Paracrine communication maximizes cellular response fidelity in wound signaling
- University of California, San Diego, United States
- San Diego Center for Systems Biology, United States
Figures
Figure 1 with 9 supplements
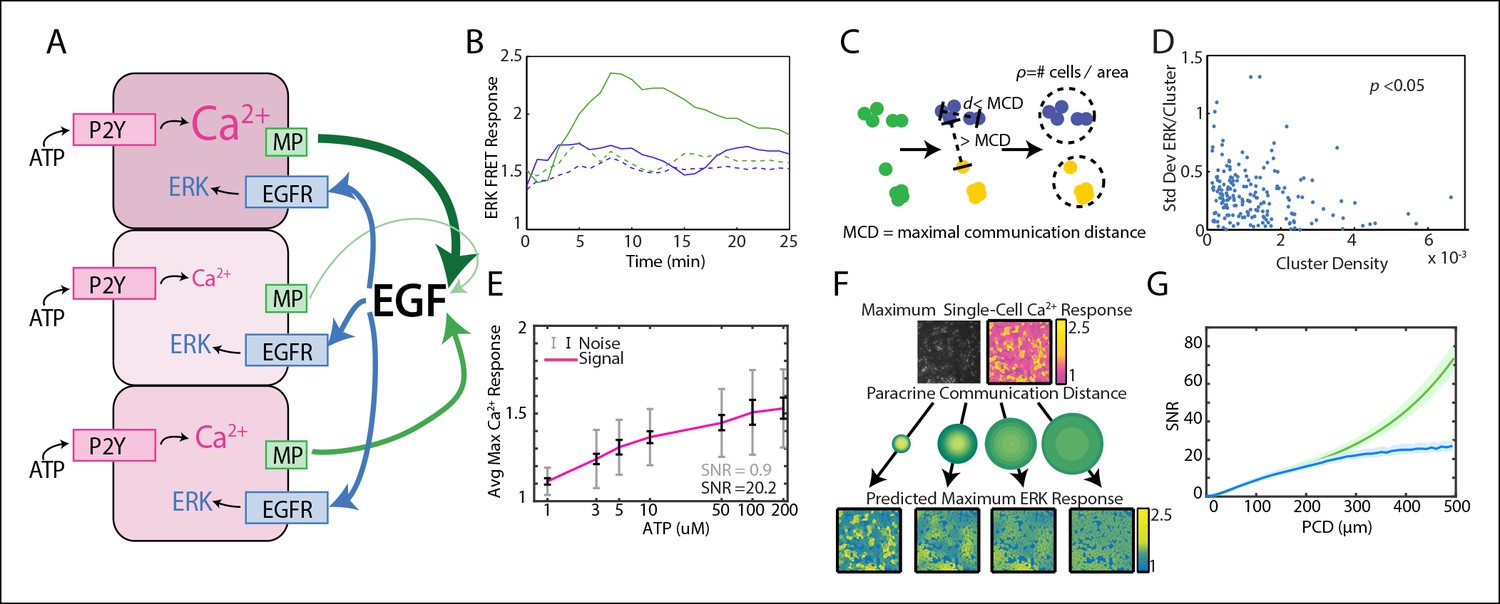
Local averaging using paracrine signaling reduces response variability in a communication distance dependent manner.
(A) A hypothesis for local averaging based reduction of response variability using paracrine signaling for ERK activation by P2Y receptors. ATP binds to P2Y receptors to increase cytosolic Ca2+ levels with high variability between cells despite equivalent ATP dosage per cell (pink shading). EGF release from each cell is proportional to the primary response to ATP (green arrows). Due to diffusion of EGF, the local concentration will be the average of EGF released from nearby cells and subject cells in a local neighborhood to the same level of EGF (blue arrows) to result in similar ERK activation. (B) ATP activates ERK in a paracrine fashion in MCF-10A cells. ERK response to 10 μM ATP addition with (green dashed) and without (green solid) 1 μM of EGFR inhibitor tryphosphitin AG1478. 0 μM ATP addition with (blue dashed) and without (blue solid) 1 μM AG1478 shown as controls. (C) MCF-10A cells were clustered based on their spatial proximity so that cells within a cluster were within a specific maximal communication distance (MCD) and cells in other clusters were farther than the MCD. Cluster denisty was calcuated by dividing the number of cells per cluster by the circular area inhabitated by each cluster. (D) Standard deviation of ERK response per cluster to 10 μM ATP. Standard deviation decreases with increasing cluster density (p-value <0.05, Pearson correlation). (E) Average maximum Ca2+ response with increasing ATP dosage. The standard deviation, that is noise, of the Ca2+ response to each ATP dosage is large when compared to the increase in average response with increasing ATP dose, that is signal (SNR = 0.9, gray error bars [standard deviation]). Noise decreases when Ca2+ response is locally averaged with a PCD of 100 μm (SNR = 20.2, black error bars [standard deviation]). x-axis shown in log-scale. F. Single-cell maximum Ca2+ response is locally averaged across an area specified by the PCD to produce a predicted single-cell ERK response. Variability between cells in the predicted ERK response decreases with increasing PCD. Response magnitude of Ca2+ and ERK response indicated by pink to yellow and blue to yellow colorbars, respectively. G. The SNR of the predicted ERK response from locally averaged Ca2+ data continually increases with increasing PCD shown for a model with rapid diffusion (green) or limited by the diffusion rates and integration time of paracrine signals (blue, Materials and methods). SNR calculated in same manner as panel E with increasing PCD. Shaded area is SEM (N = 5).
Figure 1—figure supplement 1
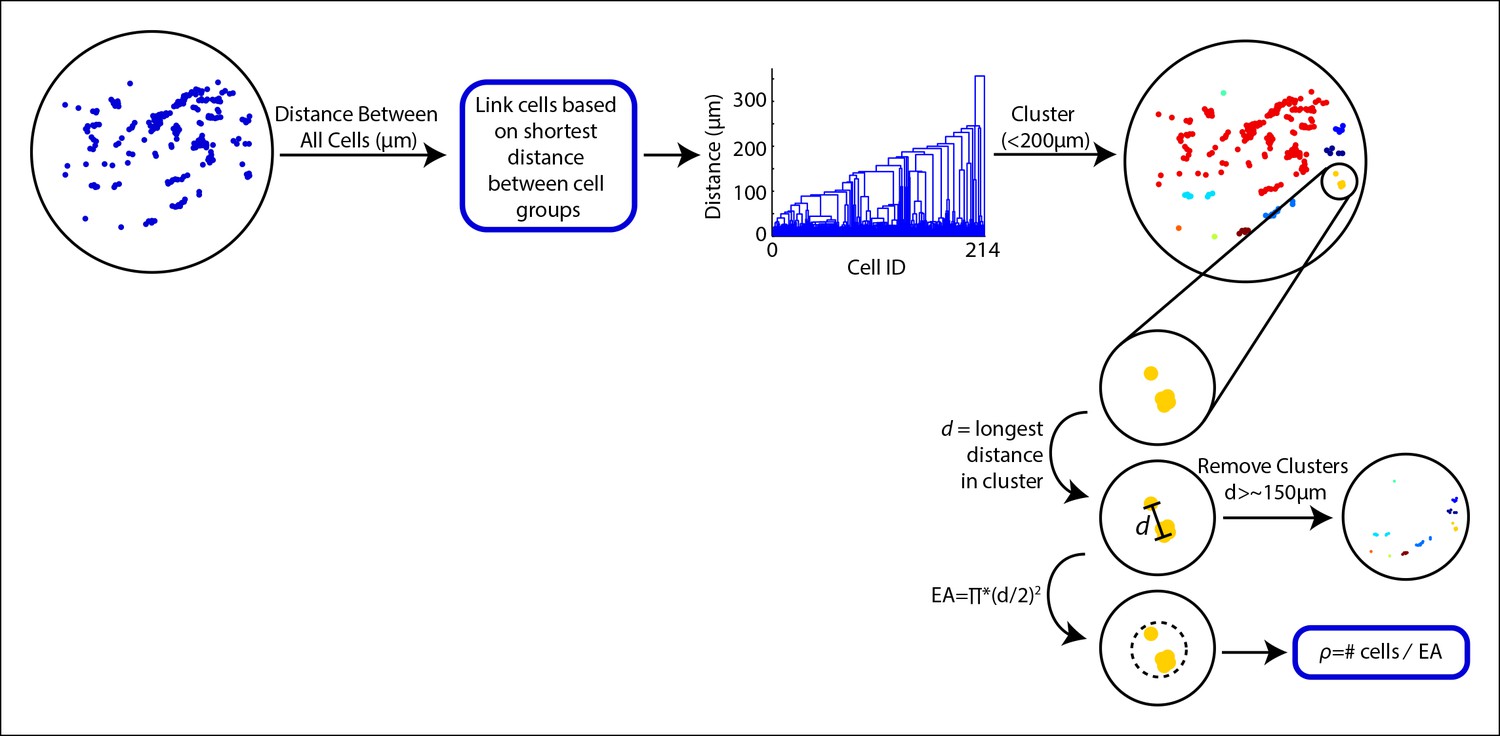
MCF-10A cells can be separated and analyzed in cell clusters when plated at low densities.
Cells were grouped into clusters based on distance between cells. First, the distance between all cells was calculated based on the distance from the center of the cell. A hierarchical clustering based on the shortest distance linkage between cell groups was used to group cells. Cells linked within 200 μm (maximum PCD, or MCD) of each other were assigned as a cell cluster. To calculate the local cell density (ρ) within the cluster, the longest cell-to-cell distance within the cluster was measured (d). Clusters with a d greater than 150 μm were removed since the PCD was calculated to be 99.5 μm. Effective area (EA) of the cluster was calculated by finding the area of the circle encompassing the cluster using d as the diameter of the circle. ρ was estimated by dividing the number of cells within the cluster by the EA. This process was repeated for all clusters.
Figure 1—figure supplement 2

Cluster standard deviation and cluster average as a function of cluster density show significant trends for ERK activation but not Ca2+ activation.
Cells were plated at low density to form groups of cells and clustered according to Figure 1—figure supplement 1. ERK and Ca2+ activation were monitored following the addition of 10 μm ATP. All p-values obtained through Pearson correlation. (A) Standard deviation of ERK expression for each cluster significantly decreases with increasing cluster density (p-value <0.05) indicating that ERK expression becomes more reliable as cells coordinate with more cells. The average ERK expression per cluster, however, does not significantly decrease (p-value >0.05) verifying that the decrease in standard deviation of ERK expression is not related to changes in the average ERK expression. (B) The standard deviation of Ca2+ activation does not significantly decrease with increasing cluster density (p-value >0.05) assuring that decreases in ERK cluster standard deviation represent communication via paracrine signaling and not due to similarities in cellular expression between sister cells in a cluster. Similarly to A., the average Ca2+ response for each cluster does not significantly decrease with increasing cluster density (p-value >0.05)
Figure 1—figure supplement 3
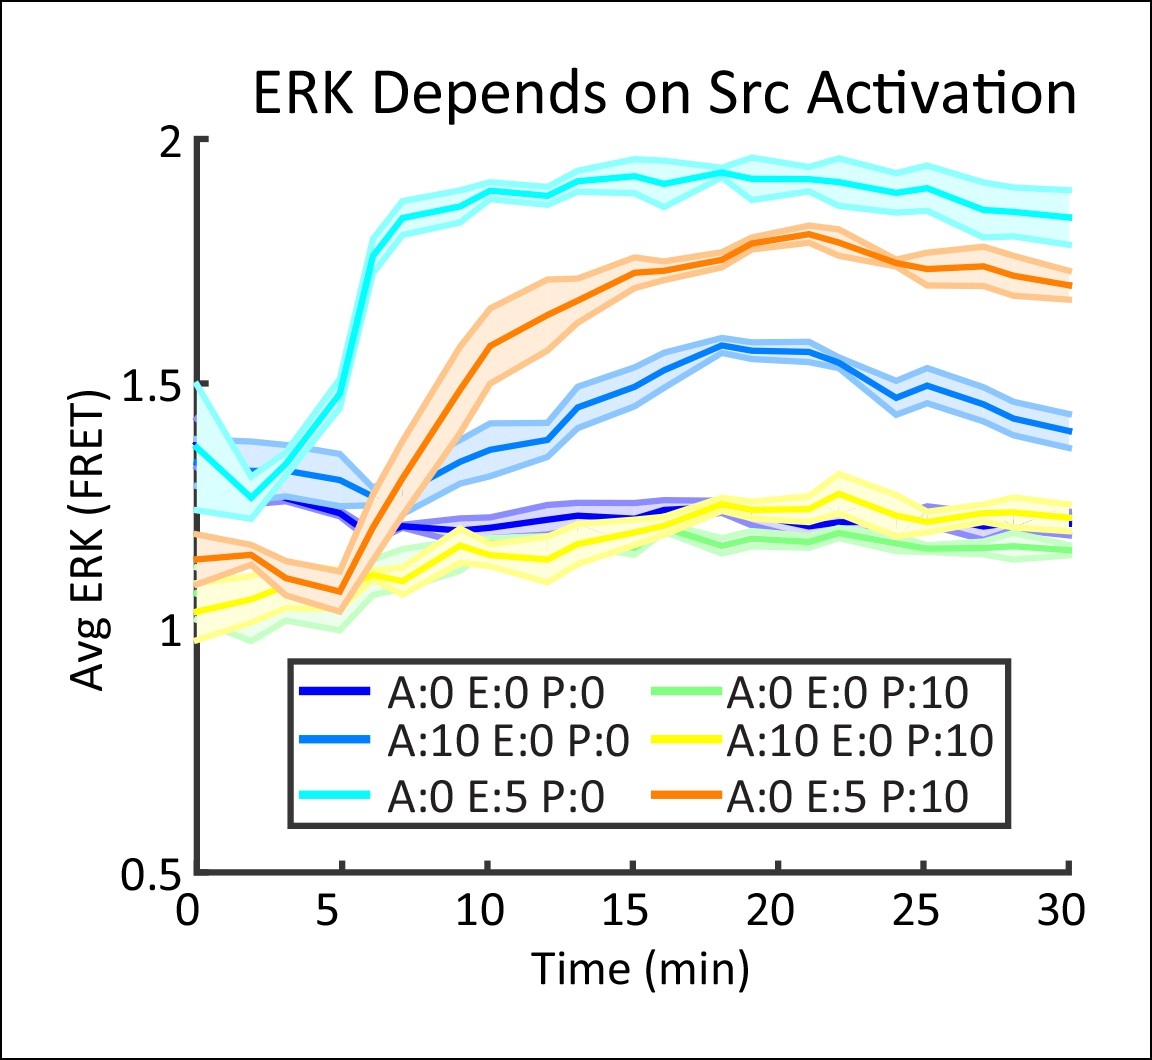
Paracrine ERK activation depends on Src prior to MMP activation.
MCF-10A cells expressing EKAREV FRET ERK reporter were incubated with 10 µM of the selective Src kinase inhibitor PP2 (Tocris) for 30 min at normal cell culture conditions before addition of 10 µM ATP or 5ng/mL EGF(A = AP, E = EGF, P = PP2). Shaded region indicates SEM (N = 5).
Figure 1—figure supplement 4
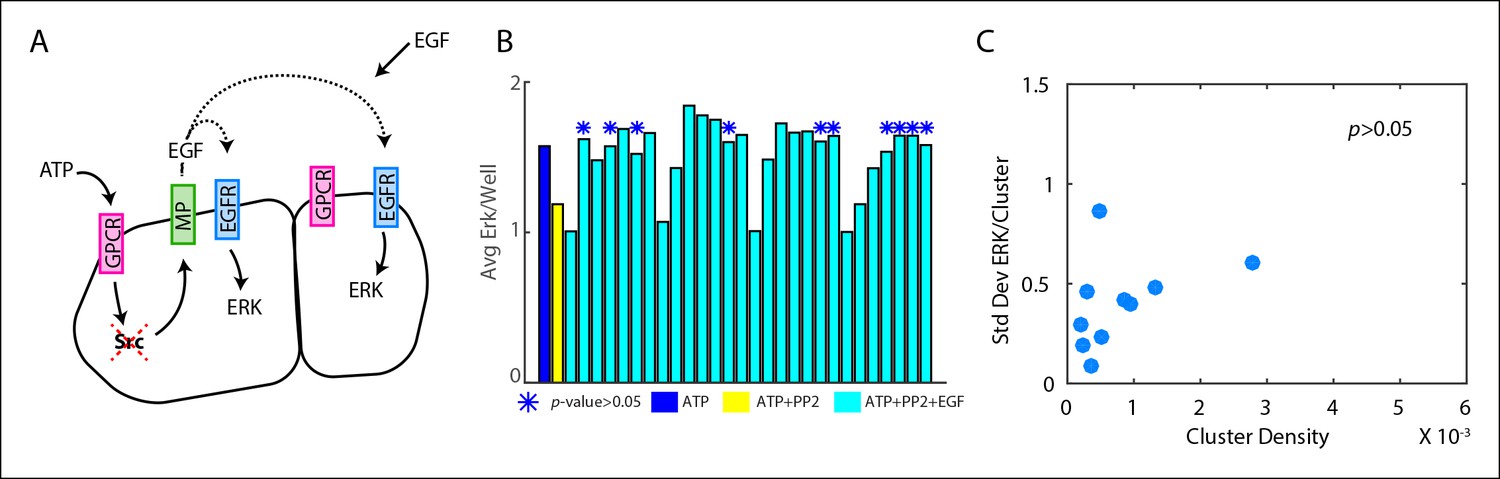
Inhibiting paracrine communication does not allow decreased cellular response variability.
Cells were plated in a 96 well plate at low density to form groups and clustered according to Figure 1—figure supplement 1. All p-values obtained through Pearson correlation. (A) Cells were incubated with varying concentrations of PP2 (0 – 10 μM, red dashed X) for 30 min in normal cell culture conditions to inhibit Src to varying degrees and therefore limit the concentration of secreted EGF (black broken lines). Additional EGF (0 – 1 ng/mL) was added to compensate for the lack of secreted EGF to ensure that the average ERK response of the well remained similar to controls. Cells were then perturbed with 10 μM ATP to activate ERK response in a paracrine fashion. PP2, EGF, and ATP were added such that cells were perturbed with every combination of PP2, EGF, and ATP. (B) Wells that showed statistically similar average ERK activation (cyan) to the control well (blue, 10 μM ATP) were selected for analysis (blue *, p-value >0.05, t-test). Complete inhibition by PP2 shown as negative control (yellow). The cells within wells labeled with a blue * were clustered in the same manner as Figure 1—figure supplement 1. (C) The standard deviation of ERK response per cluster is not significantly correlated with cluster density (p-value >0.05, Pearson correlation) indicating that ERK variability does not decrease when paracrine communication is inhibited.
Figure 1—figure supplement 5
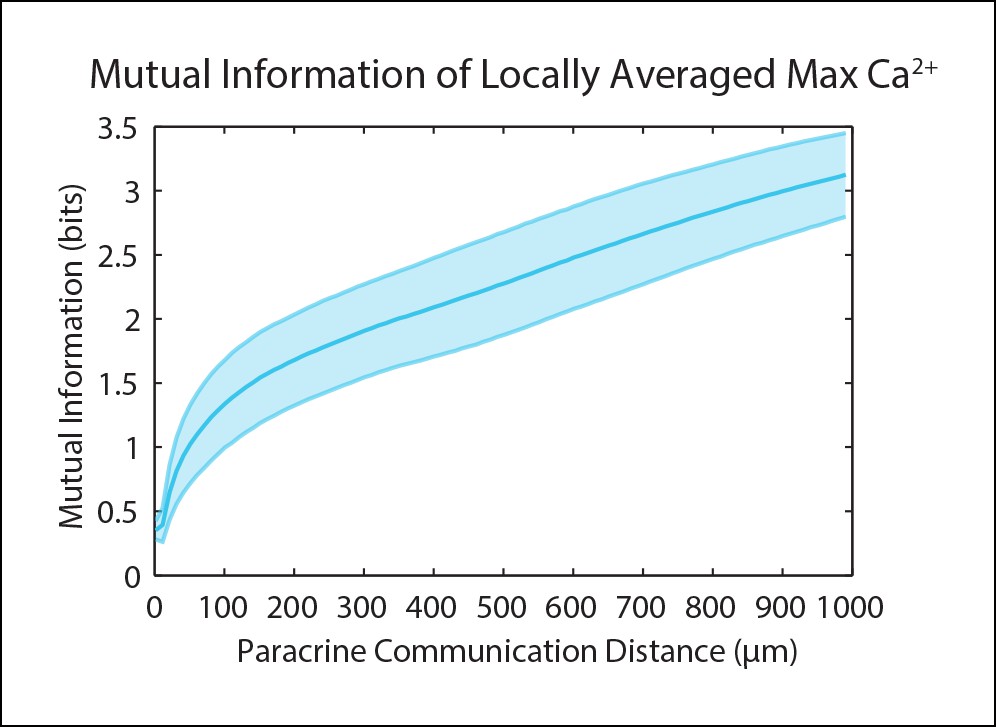
Mutual information and SNR both continue to increase with increasing PCD.
A mutual information analysis using established methods on a Ca2+ dose response to ATP as a secondary and more sophisticated approach to our SNR analysis (Selimkhanov et al., 2014). As expected, the mutual information exhibits a similar increase with increasing PCD with no upper bound, similar to the SNR analysis. Shaded area represents SEM (N = 5).
Figure 1—figure supplement 6

Scaling of Paracrine Communication Distance.
The scaling of Paracrine Communication Distance with the strength of the paracrine signal expressed as the ratio of released molecules to the number of molecules needed for signal detection. Cell radius is 10 μm, height 15 μm and chamber height is 60 μm. These values were chosen to approximate the analysis in Figure 2.
Figure 1—figure supplement 7
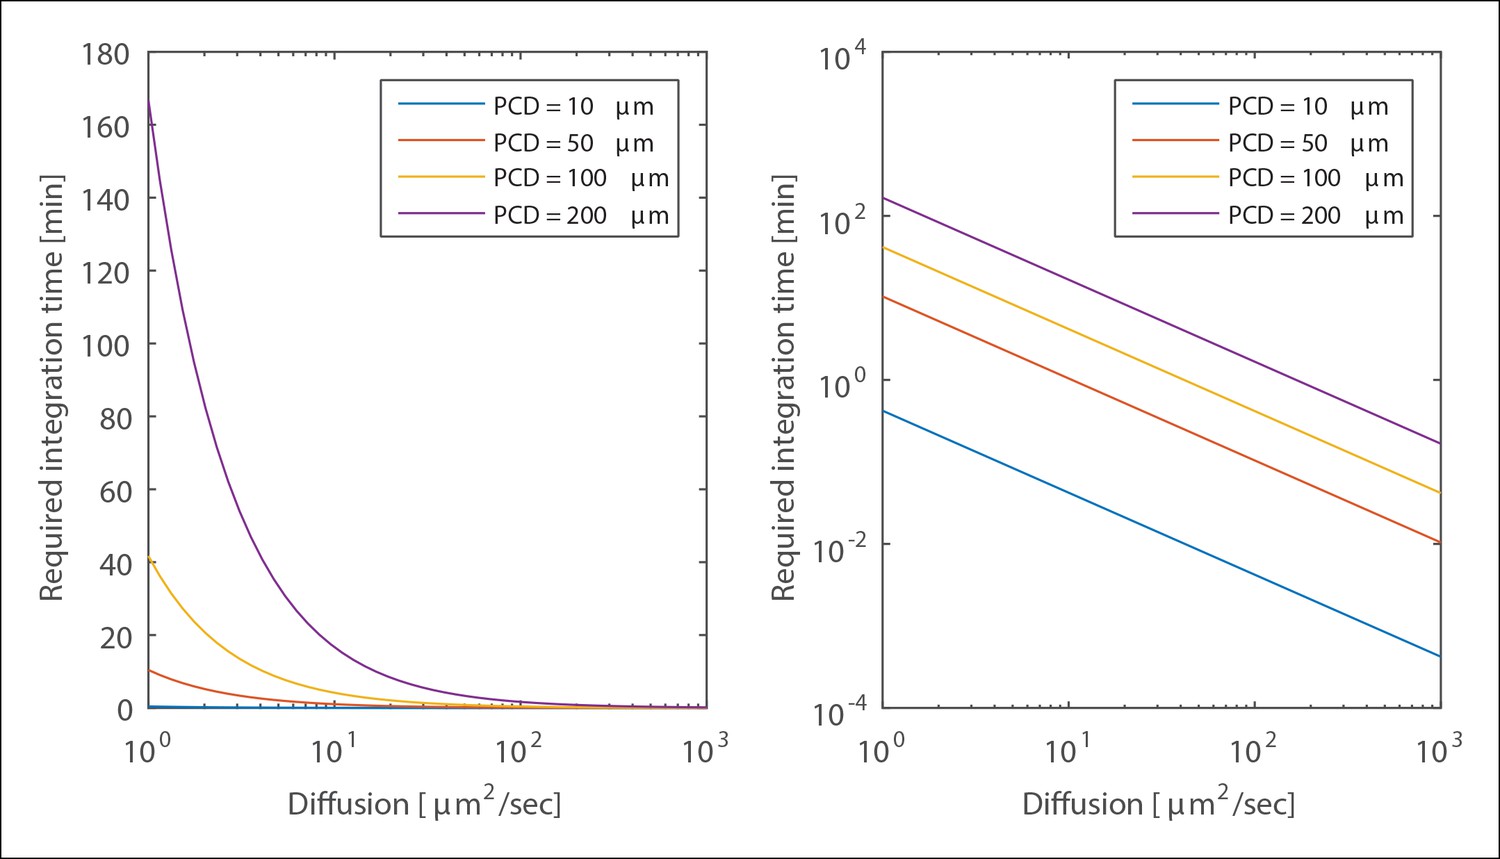
Required Integration time.
The required integration time for selected Paracrine Communication Distance values shown in linear (left) and log (right) sclaes. Geometry is the same as in Figure 1—figure supplement 6. Cell radius is 10 μm, height 15 μm and chamber height is 60 μm.
Figure 1—figure supplement 8
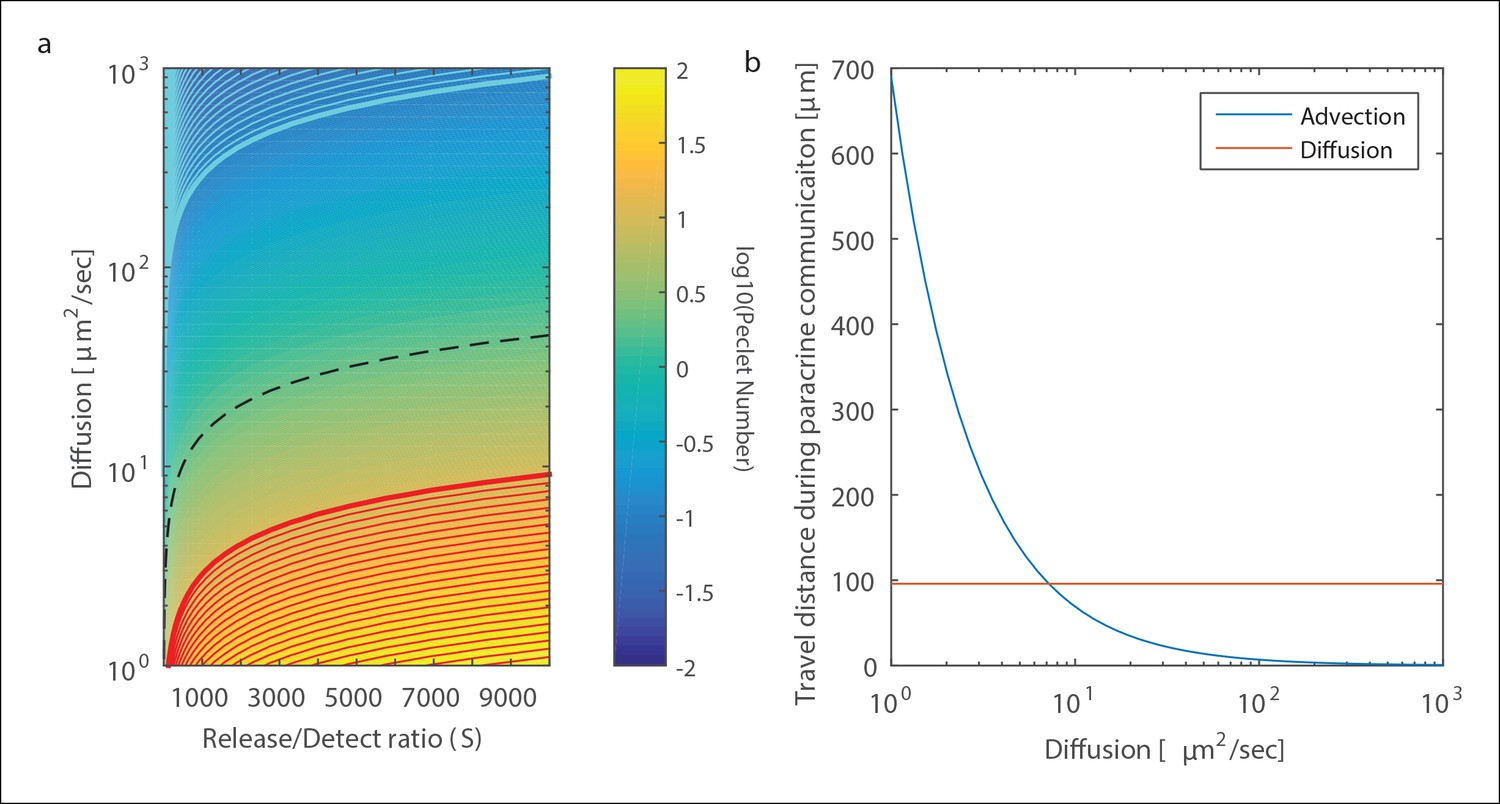
The effect of fluid flow on paracrine communication.
(A) Color map of Péclet number (shown in Log10 scale). The red (cyan) region shows the combination of signal strength (S) and diffusion coefficient (D) where advection (diffusion) is dominating over diffusion (advection). The dotted dark line shows the regime above which advection will have little effect on positional accuracy. (B) The expected distance of advection based spread as a function of D for a signal strength of 1000. The geometry and parameters here are the same as in Figure 1—figure supplement 6 and Figure 1—figure supplement 7. Interstitial flow rate used was 0.3 μm/s based on (Polacheck et al 2011).
Figure 1—figure supplement 9
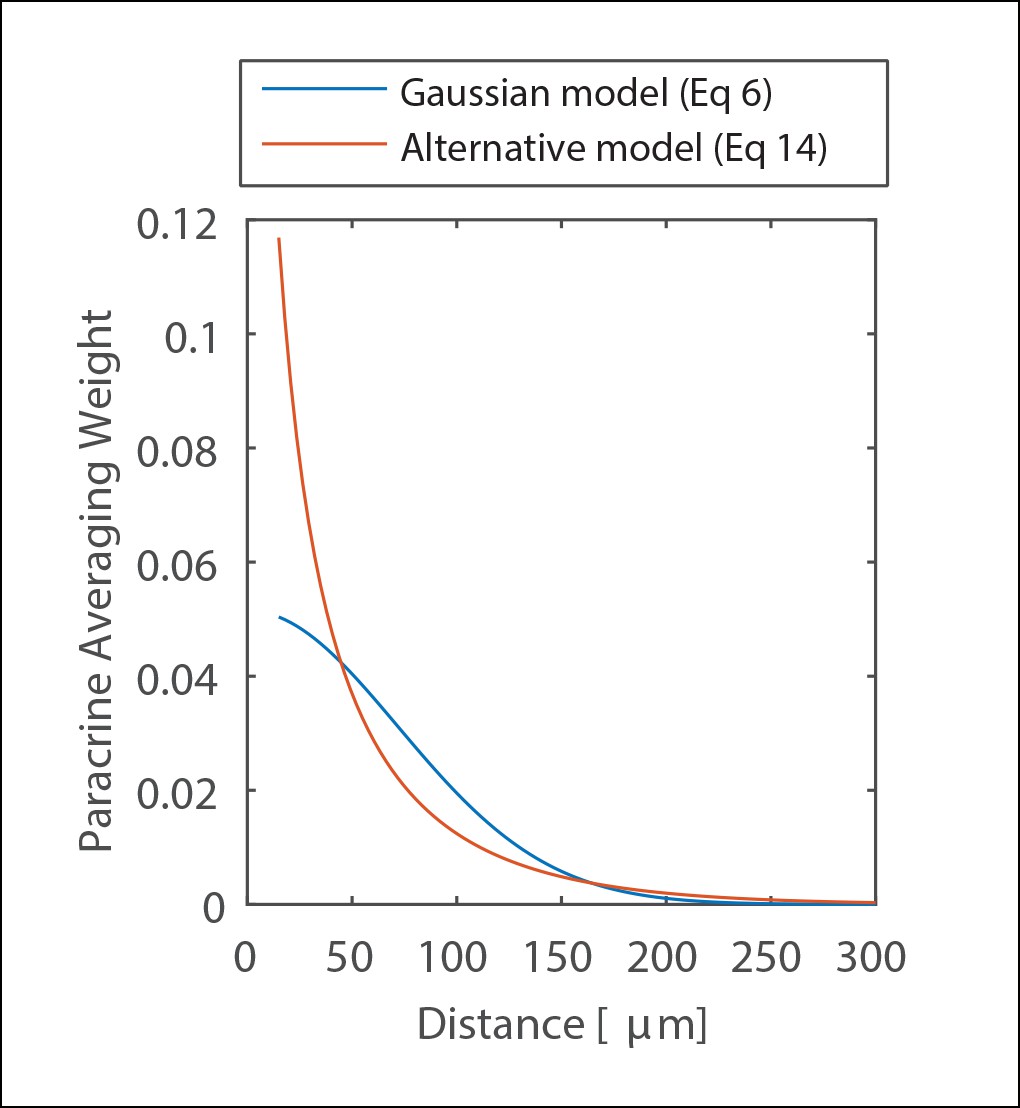
The effect of cellular decoding schemes on paracrine communication.
Comparison of Paracrine averaging weights between the Gaussian model used in this work to represent paracrine communication and an alternative model that is based on an assumption of instant release temporal averaging of paracrine signal.
Figure 2 with 1 supplement
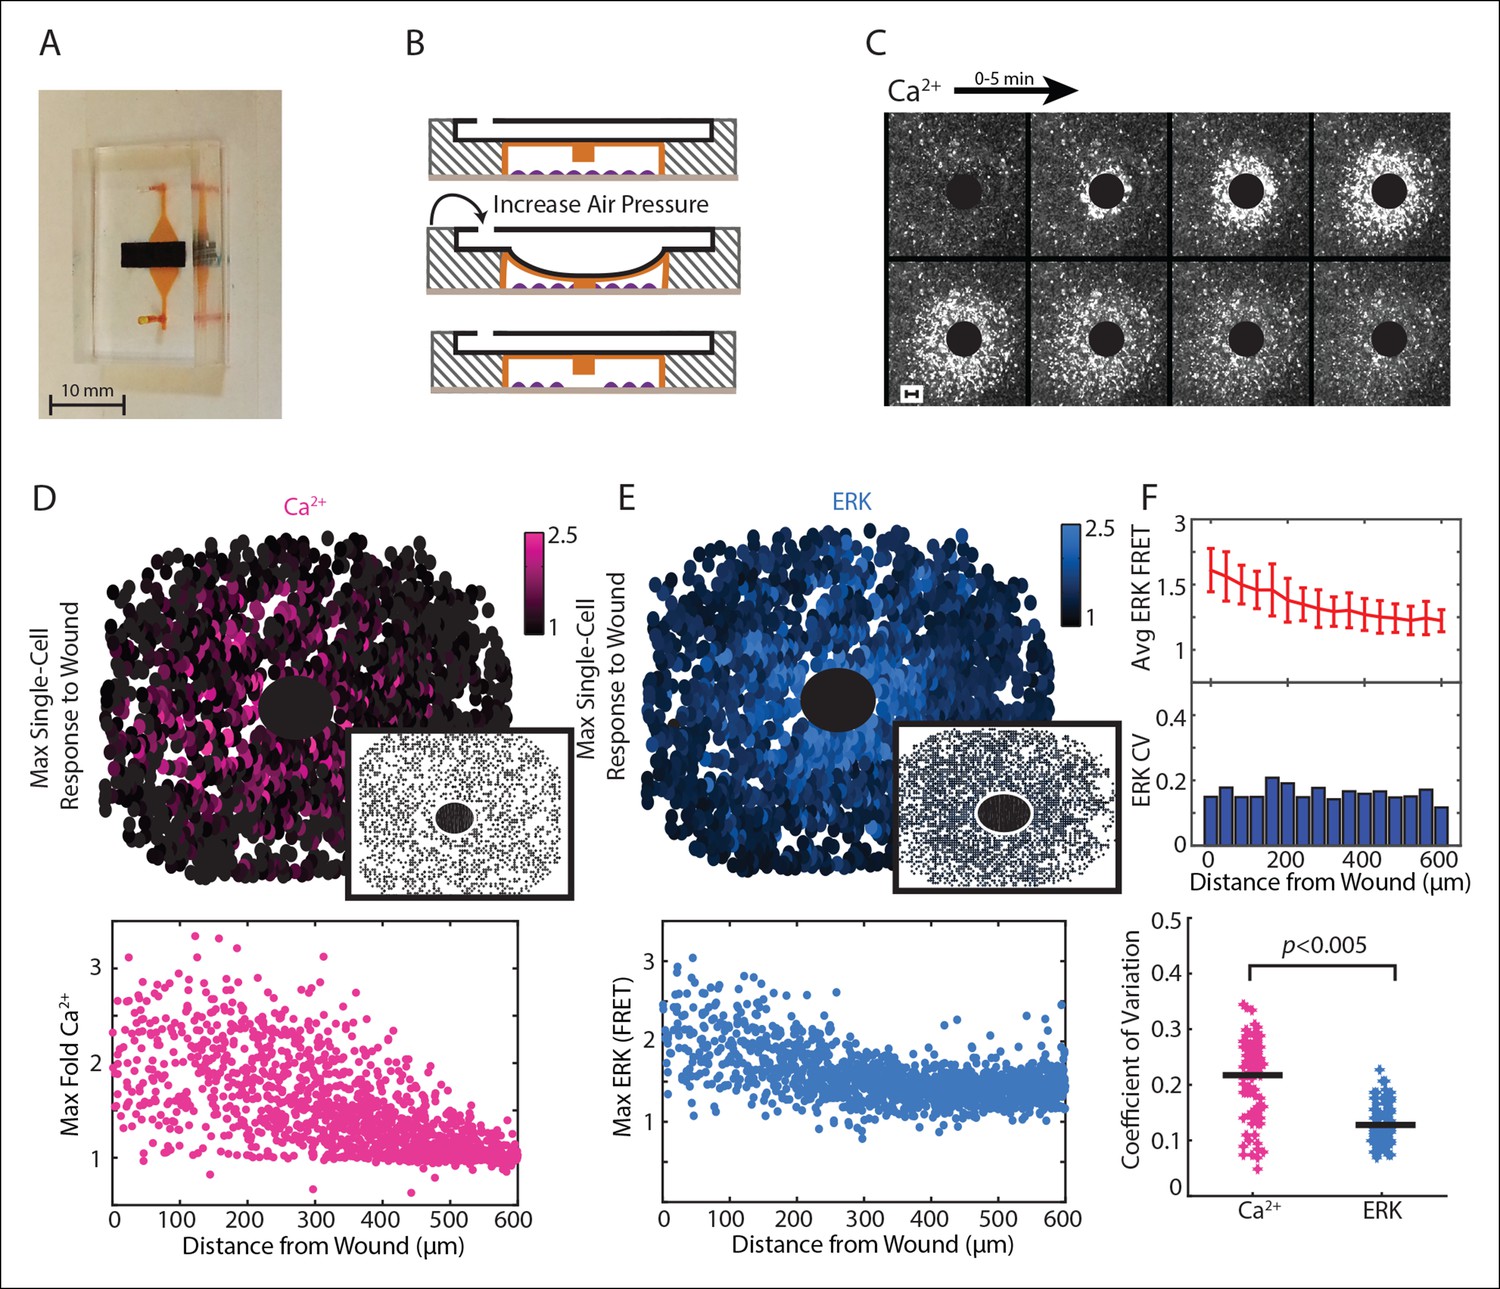
Paracrine communication reduces response variability during wounding.
(A) Dual layer microfluidic-based wounding device with a top air channel (black) and bottom cell chamber (orange). (B) Schematic of wounding in the device. Cells are first loaded into the cell chamber (top). Increasing the air pressure in the air channel lowers a pillar in the ceiling of the cell chamber until cells below the pillar are mechanically crushed (middle). The pillar returns to the original height when air pressure is released (bottom). (C) Ca2+ response visualized by the Fluo-4 Ca2+ indicator dye over a period of 5 min following a 300 μm diameter wound (black circle). (D) Top: Maximum single-cell (dots) Ca2+ response to a 300 μm wound. Inset shows maximum Ca2+ response to 300 μm wound in the presence of the ATP scavenger apyrase. Bottom: Maximum single-cell (dots) of Ca2+ response to wound according to distance from the wound. (E) Same as D but for maximum ERK response. (F) Top: Cells are binned according to distance from the wound (Figure 3A) and the average and standard deviation (error bars) are found for each bin. Middle: Coefficient of variation (CV) calcuated by dividing the standard deviation of each bin by the mean of that bin. Bottom: Ca2+ has higher variability than ERK response for the wound according to the CV of every bin for all wounds (Black bar = average CV, p-value by t-test).
Figure 2—figure supplement 1
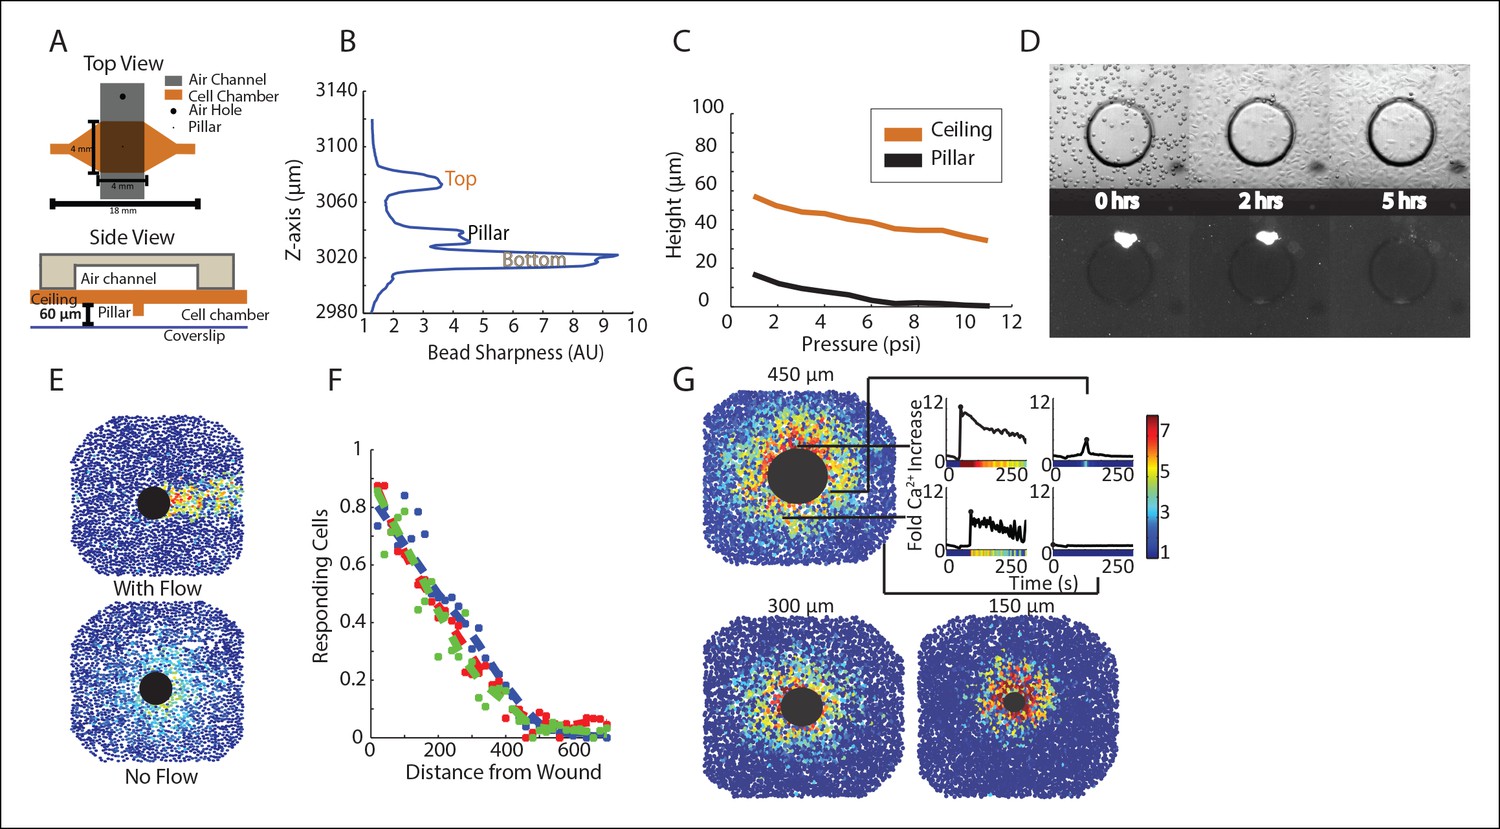
Microfluidic wounding device characterization demonstrates cell viability, isotropic wounding, wounding control, and reproducibility.
(A) Top (top panel) and side (bottom panel) view of the microfluidic wounding device. The wounding device is constructed of 2 layers, a top air layer (black) and bottom cell chamber (orange). The air layer has an air hole at one end where air pressure is increased by flowing air through a small tube connected to the hole. The ceiling of the cell chamber has a PDMS pillar that is lowered down on to the cells in the cell chamber when air pressure is increased in the air layer. (B) Cell chamber heights were measured by loading fluorescent beads into the device and allowing them to settle on the surfaces within the device (bottom, pillar, ceiling). Height was measured by scanning the cell chamber through the Z-axis and seeing where the beads had settled based on where they were in focus (bead sharpness). Cell chamber height within the device as measured by bead sharpness revealed a chamber of approximately 60 μm in height and a distance of approximately 15 μm between the bottom of the pillar and the bottom of the cell chamber. These distances provide ample room for cell growth while still limiting the z-space in which extracellular signals can diffuse. (C) The change in height of the ceiling of the cell chamber (orange) and the pillar (black) with increasing air pressure as measured by bead sharpness shows controlled movement of the pillar with increasing air pressure. Although the ceiling of the cell chamber also moves with the pillar, this does not interfere with cellular wounding. (D) MCF-10A cells were loaded in to the wounding device cell chamber and allowed to adhere in the presence of propidium iodide (PI) to measure cell viability within the device over time in static media conditions. Cells were able to adhere within 5 hr after which the media began to dry up and cells began to die indicating that cellular response following wounding can be measured for up to 5 hr in a static setting before cell death. (E) Wounding in non-static (with flow) and static (no flow) media conditions. Static media conditions were accomplished by placing a piece of tape over one of the ports of the wounding device during imaging. When flow was present, the signal went in the direction of the flow. However, when flow was not present, the signal propagated isotropically from the wound indicating that the response was a measurement of signal transfer and not simply due to the flow in the environment. (F) Ca2+ response according to distance away from the center of a 300 μm diameter wound shows reproducible wounding between 3 experiments as represented by 3 different colors. Cellular response is measured as the percentage of responding cells according to distance away from the wound. (G) Due to the layer-by-layer photolithography manufacture of the molds used to make the wounding device, the size of the wound can be controlled and reproducible. We were able to measure the single-cell spatiotemporal Ca2+ response in cells wounded by a 450 μm, 300 μm, and 150 μm wound. The single-cell responses for 4 different cells at varying distances from the wound are highlighted for the 450 μm wound with colorbar indicating fold maximum increase.
Figure 3 with 1 supplement
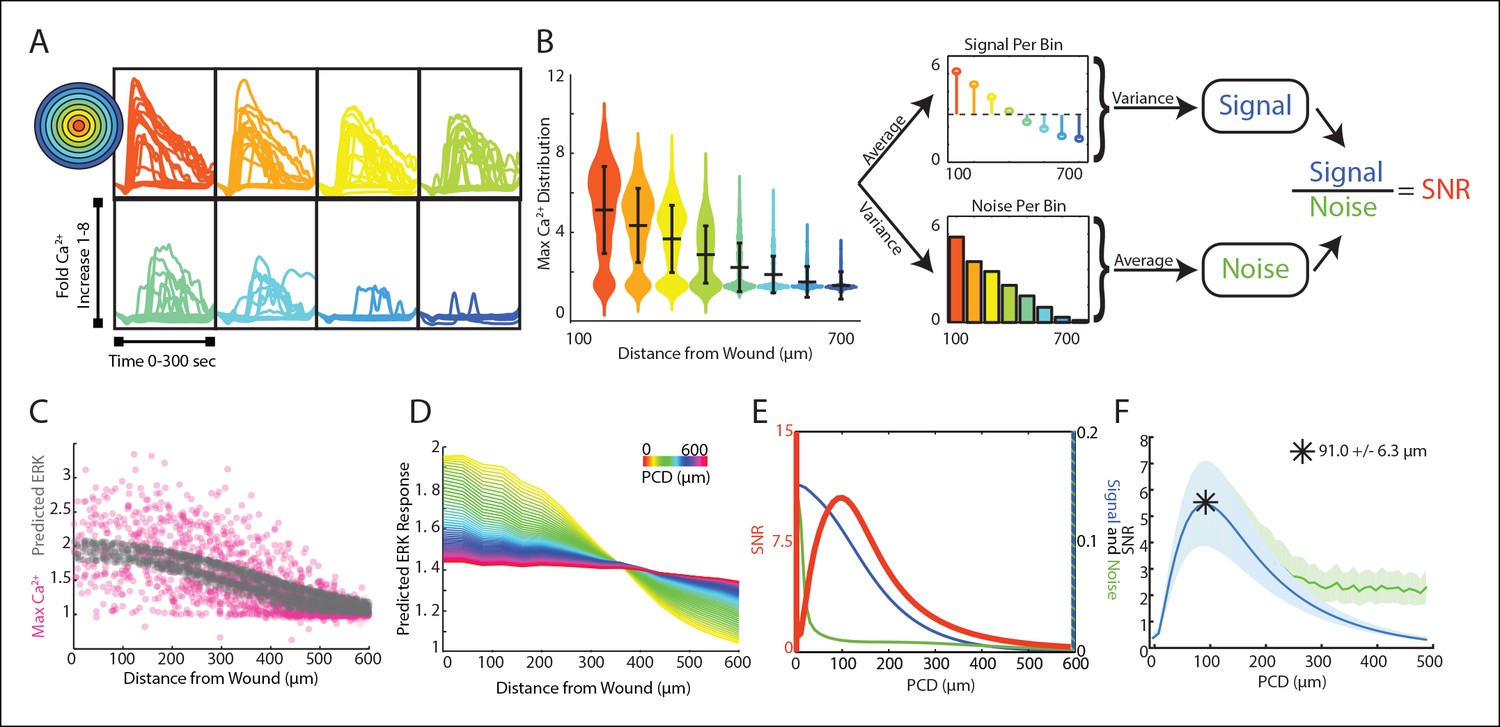
Signal to noise analysis of initial wound response shows limits to paracrine communication.
(A) Representative single-cell time traces of Ca2+ response to wounding, grouped according to distance from the wound (concentric circle colors). (B) SNR calculation method for Ca2+ response adpated to the wound. Horizontal bars represent bin average and error bars represent bin variance. (C) Maximum single-cell (dots) Ca2+ response to wound with respect to distance away from the wound (pink). Predicted ERK cellular response after paracrine communication as determined by local averaging (gray). Local averaging done in same manner as Figure 1F. (D) Predicted ERK response according to distance from the wound using PCDs of 0 to 600 μm (colorbar). Predicted ERK response determined through local averaging using increasing PCDs results in decreased response magnitude over space. (E) Signal (blue), Noise (green) and SNR (orange) as function of PCD of locally averaged Ca2+ response trends in panel D. (F) SNR analysis of locally averaged Ca2+ response to a wound with increasing PCD shows a maximum SNR at PCD of 91.0 μm+/-6.3 μm indicated by the asterick (blue, SEM indicated by shaded region, N = 5). The maximum SNR for conditions controlled for biologically relevant integration times show the same maximum SNR (green, Materials and methods).
Figure 3—figure supplement 1
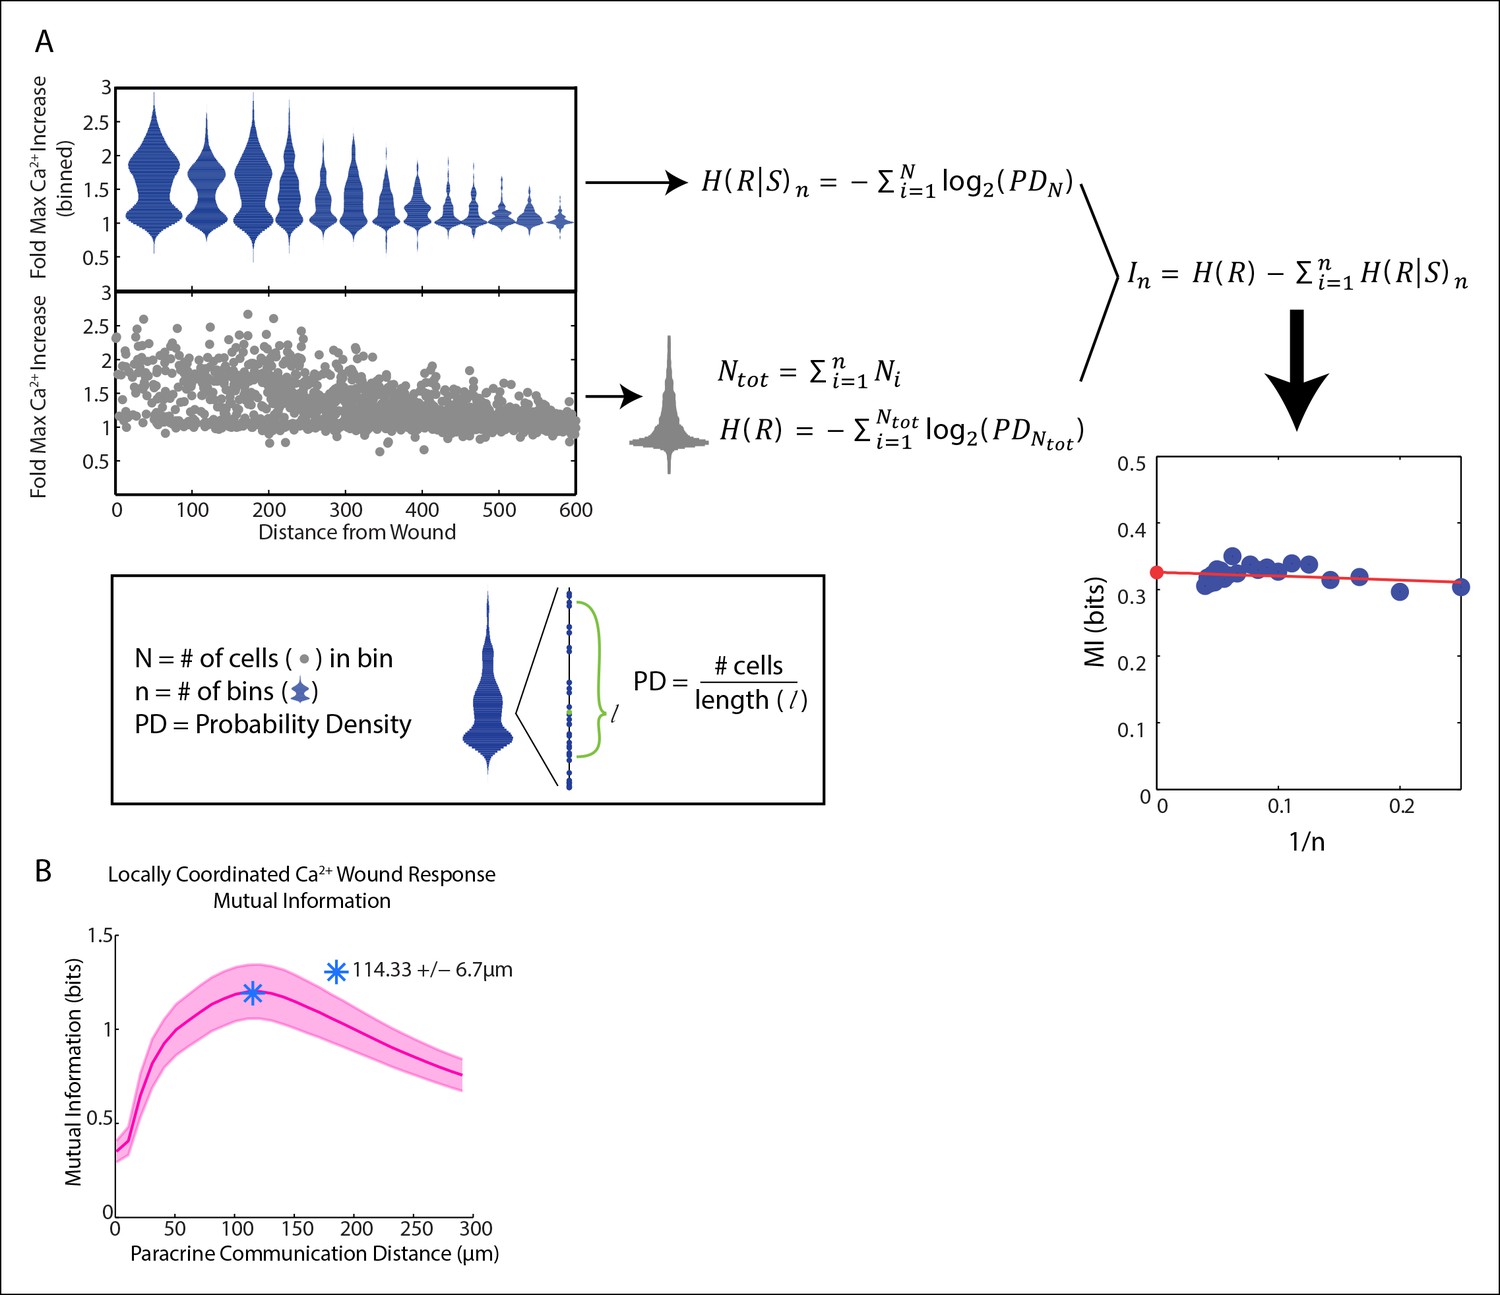
Mutual information analysis of locally averaged Ca2+ response to wounding shows similar peak to SNR analysis.
(A) Mutual information was calucated by binning the cells according to their distance away from the wound. The maximum response per cell (gray circles) is divided into bins such that there are the same number of cells in each bin (blue plots). The conditional response (H[R S]) is calculated for each bin using the probability density (PD) of each cell. The PD of each cell is calculated by finding the 10th nearest neighbor for each cell, counting the number of cells within that space, and then dividing by the distance covering that space. The non-conditional response (H[R]) is calcuated by measuring the PD of all of the cells. The cells are divided into multiple sets of bins and the mutual information (I) is calculated for each set of bins. Each I is then plotted according to the number of bins after which the final MI is found by extrapolating back to zero to ensure no dependence on bin number. B. Mutual information was used as a measurement tool to further confirm the SNR analysis of locally averaged Ca2+ response. Indeed, the mutual information analysis found an optimal coordination length-scale of 114.33 μm+/-6.7 μm (SEM, N = 5), matching the optimal coordintation length-scale found in the SNR analysis (shaded region indicates SEM, N = 5).
Figure 4
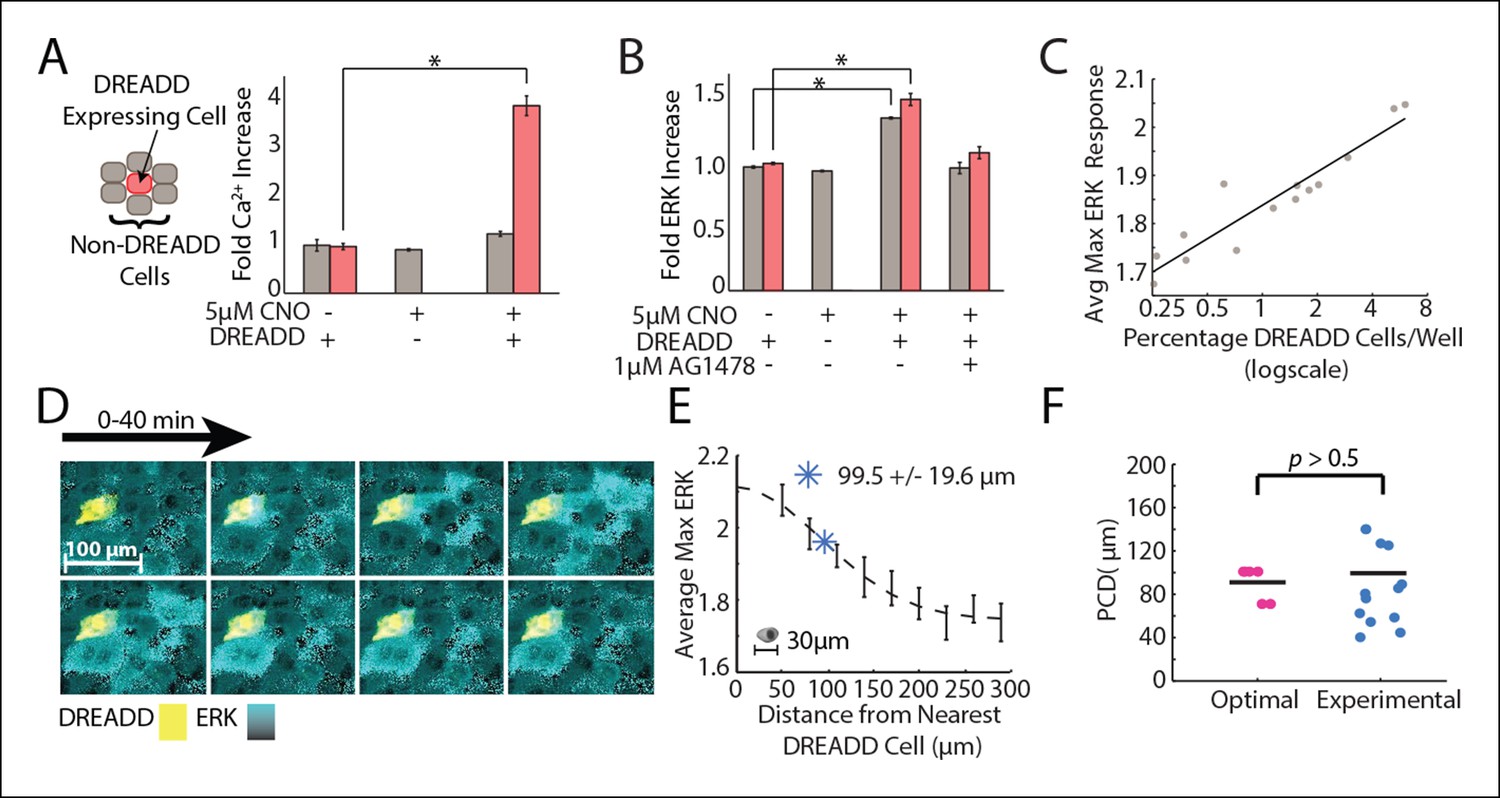
Empirical PCD measurement using DREADD synthetic GPCR show that cells use an optimal level of paracrine communication to maximize cellular response fidelity.
(A) The addition of 5 μM CNO to a co-culture of DREADD expressing (red) and non-expressing (gray) MCF-10A cells shows increased fold Ca2+ response in DREADD expressing cells but not non-expressing cells (SEM indicated by error bars, N = 3; *p-value<0.005, t-test). (B) Fold ERK increase in DREADD co-culture assay. Both DREADD and non-expressing cells show significant ERK increase when both DREADD cells and 5 μM CNO are present. ERK activation inhibited by 1 μM AG1478 (SEM indicated by error bars, N = 3; *p-value <0.005, t-test). (C) The average maximum ERK response of non-expressing cells in a given well increases linearly with an increasing percentage of DREADD cells per well. (D) Representative images from a timelapse experiment showing ERK activation (cyan) in non-expressing cells surrounding a single activated DREADD cell (yellow) over a 40 min time period. ERK activation level indicated by black to cyan colorbar. (E) Average maximum ERK activation in non-expressing cells surrounding single DREADD cell according to distance from the DREADD cell. PCD was calcuated as the spread, or sigma, of the fitted Gaussian curve (dashed line) and measured to be 99.5 μm+/-19.6 μm (blue *) (SEM indicated by error bars, N = 12 DREADD cells). Scale bar represents average length of a single-cell. F. Comparison between calculated optimal PCD per wound (pink, Figure 3F) and experimentally measured PCD found using the DREADD co-culture assay per DREADD cell (blue, Figure 4E) (p-value>0.5, t-test). Horizontal bars represent average.
Videos
Video 1
Isotropic Ca2+ response to wounding.
Ca2+ response to a 300 μm wound, indicated by the Fluo-4 Ca2+ sensor. Upon wounding, Ca2+ response propagates isotropically from the wound. Movie time lapse is 5 min.
Video 2
Ca2+ and ERK dual wounding.
Ca2+ and ERK are measured simultaneously using the fluoresecent reporter RGECO for Ca2+ (pink) and the ERK FRET sensor EKAREV (cyan). Ca2+ response is completed within 5 min whereas ERK response takes approximately 30 min.
Download links
A two-part list of links to download the article, or parts of the article, in various formats.
Downloads (link to download the article as PDF)
Open citations (links to open the citations from this article in various online reference manager services)
Cite this article (links to download the citations from this article in formats compatible with various reference manager tools)
Paracrine communication maximizes cellular response fidelity in wound signaling
eLife 4:e09652.
https://doi.org/10.7554/eLife.09652


