Mechanisms of ribosome stalling by SecM at multiple elongation steps
- Tsinghua University, China
Figures
Figure 1 with 8 supplements
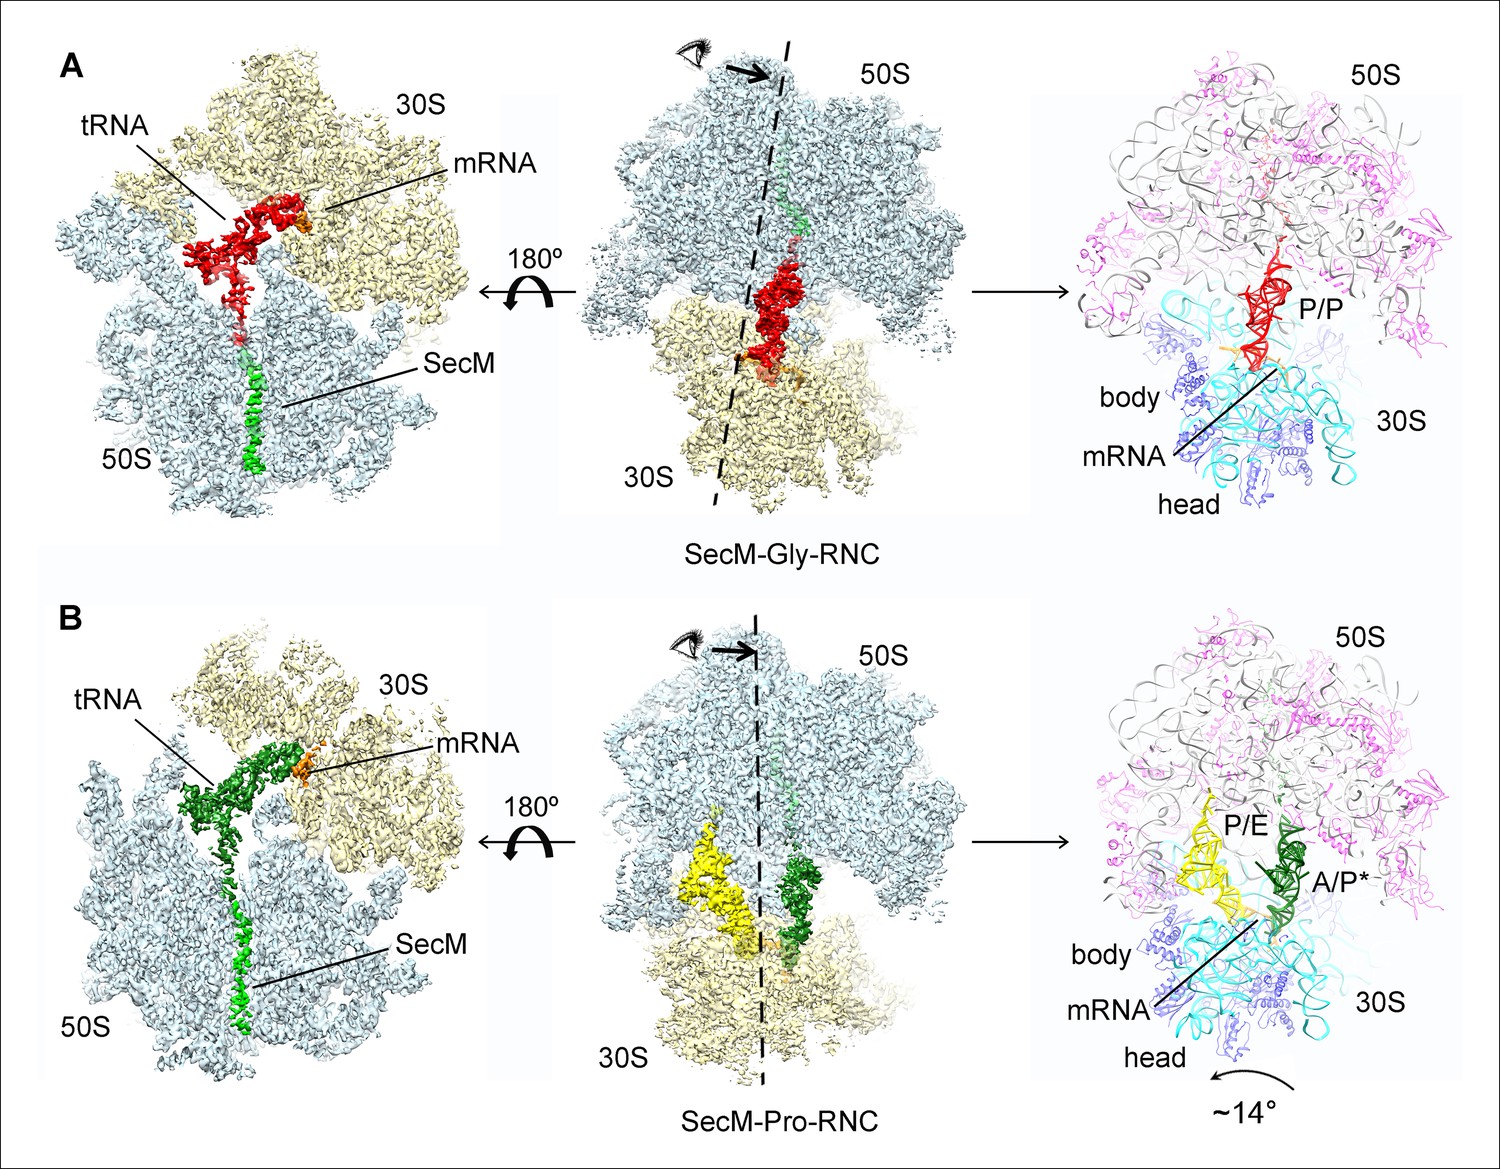
Cryo-EM structures and atomic models of SecM-stalled ribosomes.
(A) Cryo-EM density map (3.6 Å) and atomic model of SecM-Gly-RNC, with a peptidyl-tRNA at the P/P-site. Surface representation of the map (50S, 30S, SecM-tRNA, nascent chain, and mRNA in light blue, yellow, red, green, and orange, respectively) is shown in the middle panel, and the atomic model on the right panel. The cut-away view of the density map on the left panel highlights the tunnel and the nascent peptide within. (B) Same as (A), but for SecM-Pro-RNC (3.3 Å). The A/P*-site tRNA (SecM-tRNA) and P/E-site tRNA are colored forest green and bright yellow, respectively. For atomic models, mRNA, 16S rRNA, 30S proteins, 23S rRNA, and 50S proteins are colored orange, cyan, blue, grey, and magenta, respectively.
Figure 1—figure supplement 1
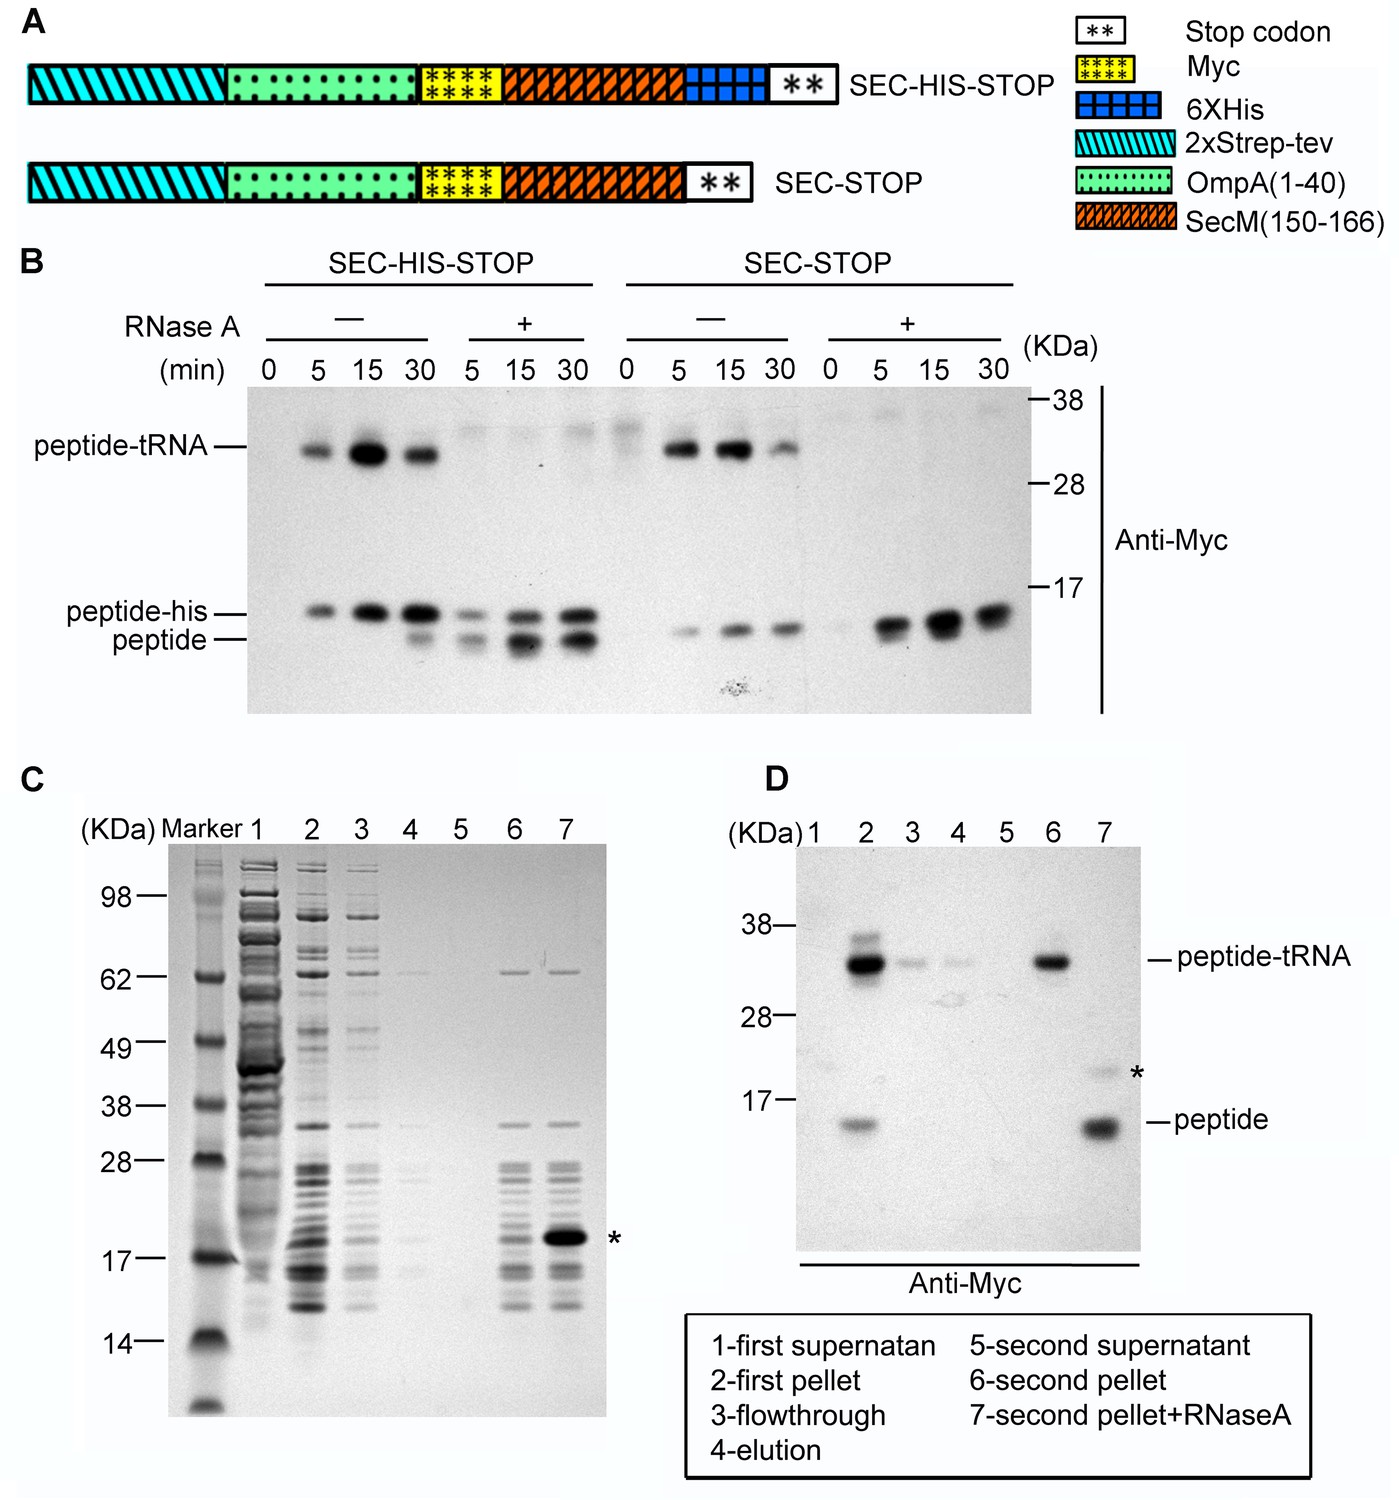
Preparation of SecM-stalled RNCs.
(A) Schematic diagrams showing the two experimental constructs, SecM-HIS-STOP and SEC-STOP, used for in vitro translation. (B) Western blot (using anti-Myc antibody) analysis of the in vitro translation reactions. The reactions were performed with either of the two constructs for indicated time and treated with ( + ) or without (-) RNase A after reaction. The reaction solutions were resolved on NuPAGE and examined by Western blot analysis. The positions of the peptidyl-tRNA (peptidyl-tRNA), rescued SecM polypeptide (peptide-his), and hydrolyzed SecM peptide (peptide) by RNase A are indicated. (C) NuPAGE examination of RNC purification. SecM-stalled RNCs with the construct of SEC-STOP were isolated by a sucrose cushion (first supernatant and first pellet), followed by a Strep-affinity chromatography (flowthrough and elution) and further purified by a second round of sucrose cushion (second supernatant and second pellet). Fractions of RNCs obtained from the second pellet were also treated with RNase A. The asterisk indicates the band of added RNase A. (D) Western blot (using anti-Myc antibody) analysis of the NuPAGE as shown in C. As shown, after the second pelleting, only one major band for the peptidyl-tRNA is present, which, upon addition of RNase A becomes free SecM peptide.
Figure 1—figure supplement 2
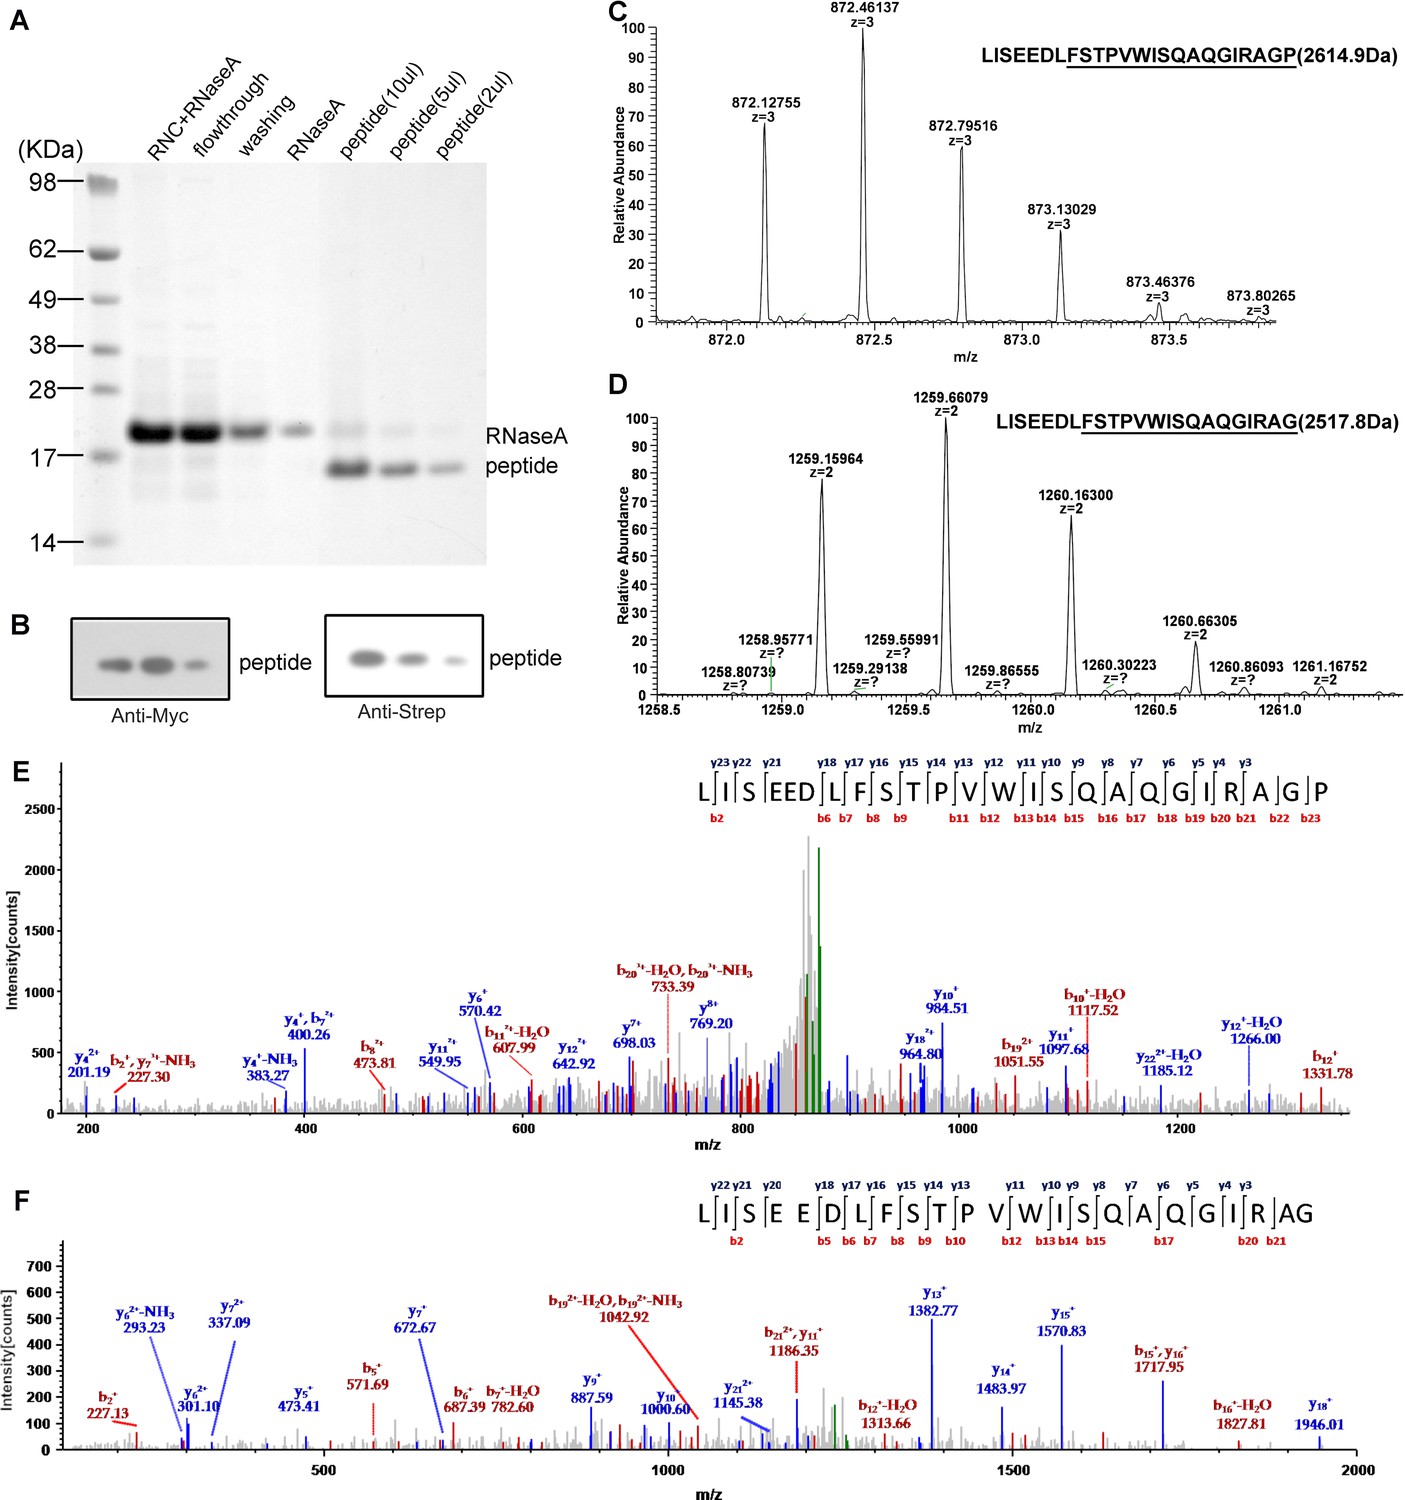
Mass spectrometry analysis of the nascent peptides purified from SecM-stalled RNCs.
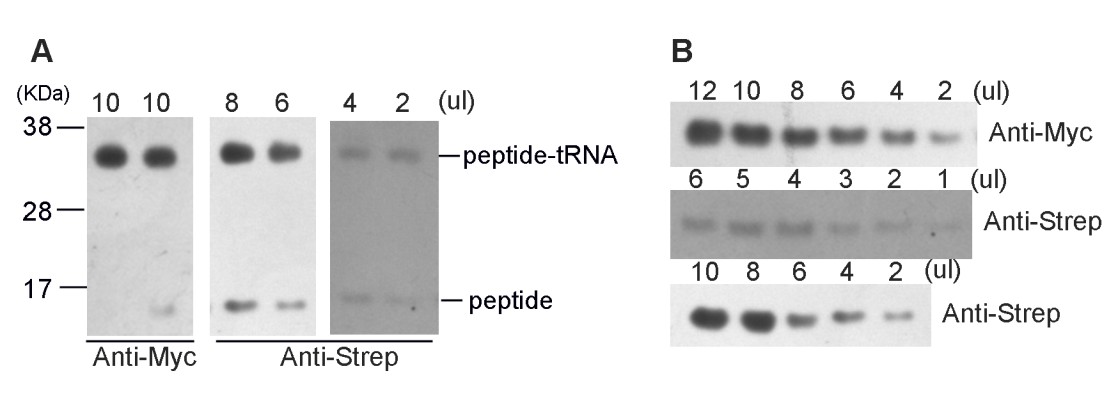
(A) NuPAGE examination of nascent peptide purification. SecM-stalled RNCs were treated with 10 mM EDTA and 100 U of RNAse A to disassemble ribosomes and to digest ribosomal RNA (RNC + RNAse A), and then enriched by Strep-affinity chromatography (flowthrough and washing). Eluted peptide was loaded at different volumes to test the purity. (B) Western blot (using anti-Myc and anti-Strep antibody) analysis of the purified nascent peptides from NuPAGE as shown in A. (C-F) Respective first-order (C-D) and second-order (E-F) mass spectra of digested nascent peptides. Two species of peptides (digested by lysyl endopeptidase) starting from F150 could be identified from their first-order mass spectra (C-D). The ratio of proline to glycine (C-terminal) is about 2:1. (E-F) The MS/MS spectra of respective two peptide species.
Figure 1—figure supplement 3
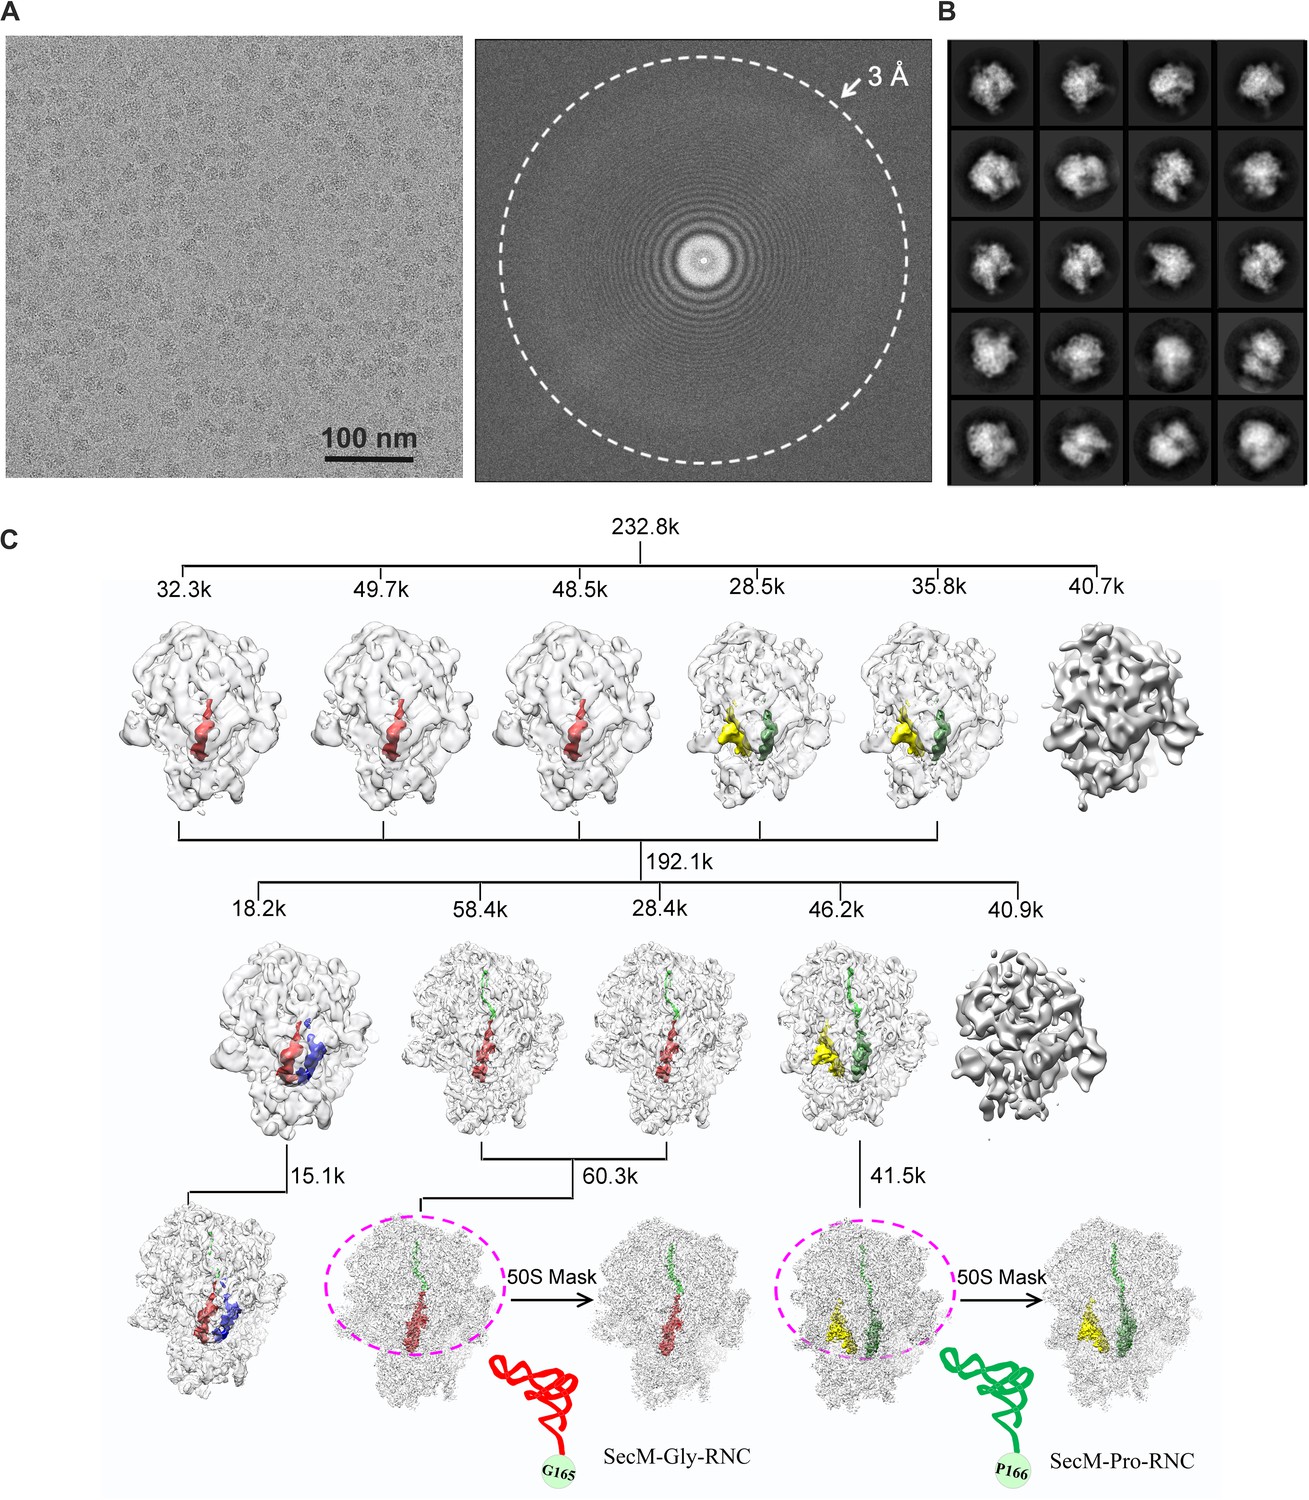
Overview of the image processing.
(A) A representative raw micrograph of SecM-stalled ribosomes. A Fourier transform of the micrograph is also shown. (B) Representative 2D class averages from reference-free classification. (C). Workflow of the 3D classification (see ‘Methods’ for details). To improve the density quality of the nascent polypeptides, a soft mask of the 50S subunit and tRNAs (purple circle) was applied during further structural refinement. The A-site tRNA, P-site tRNA, A/P-site tRNA, P/E-site tRNA, and nascent polypeptide are colored in blue, red, forest green, yellow, and green, respectively.
Figure 1—figure supplement 4
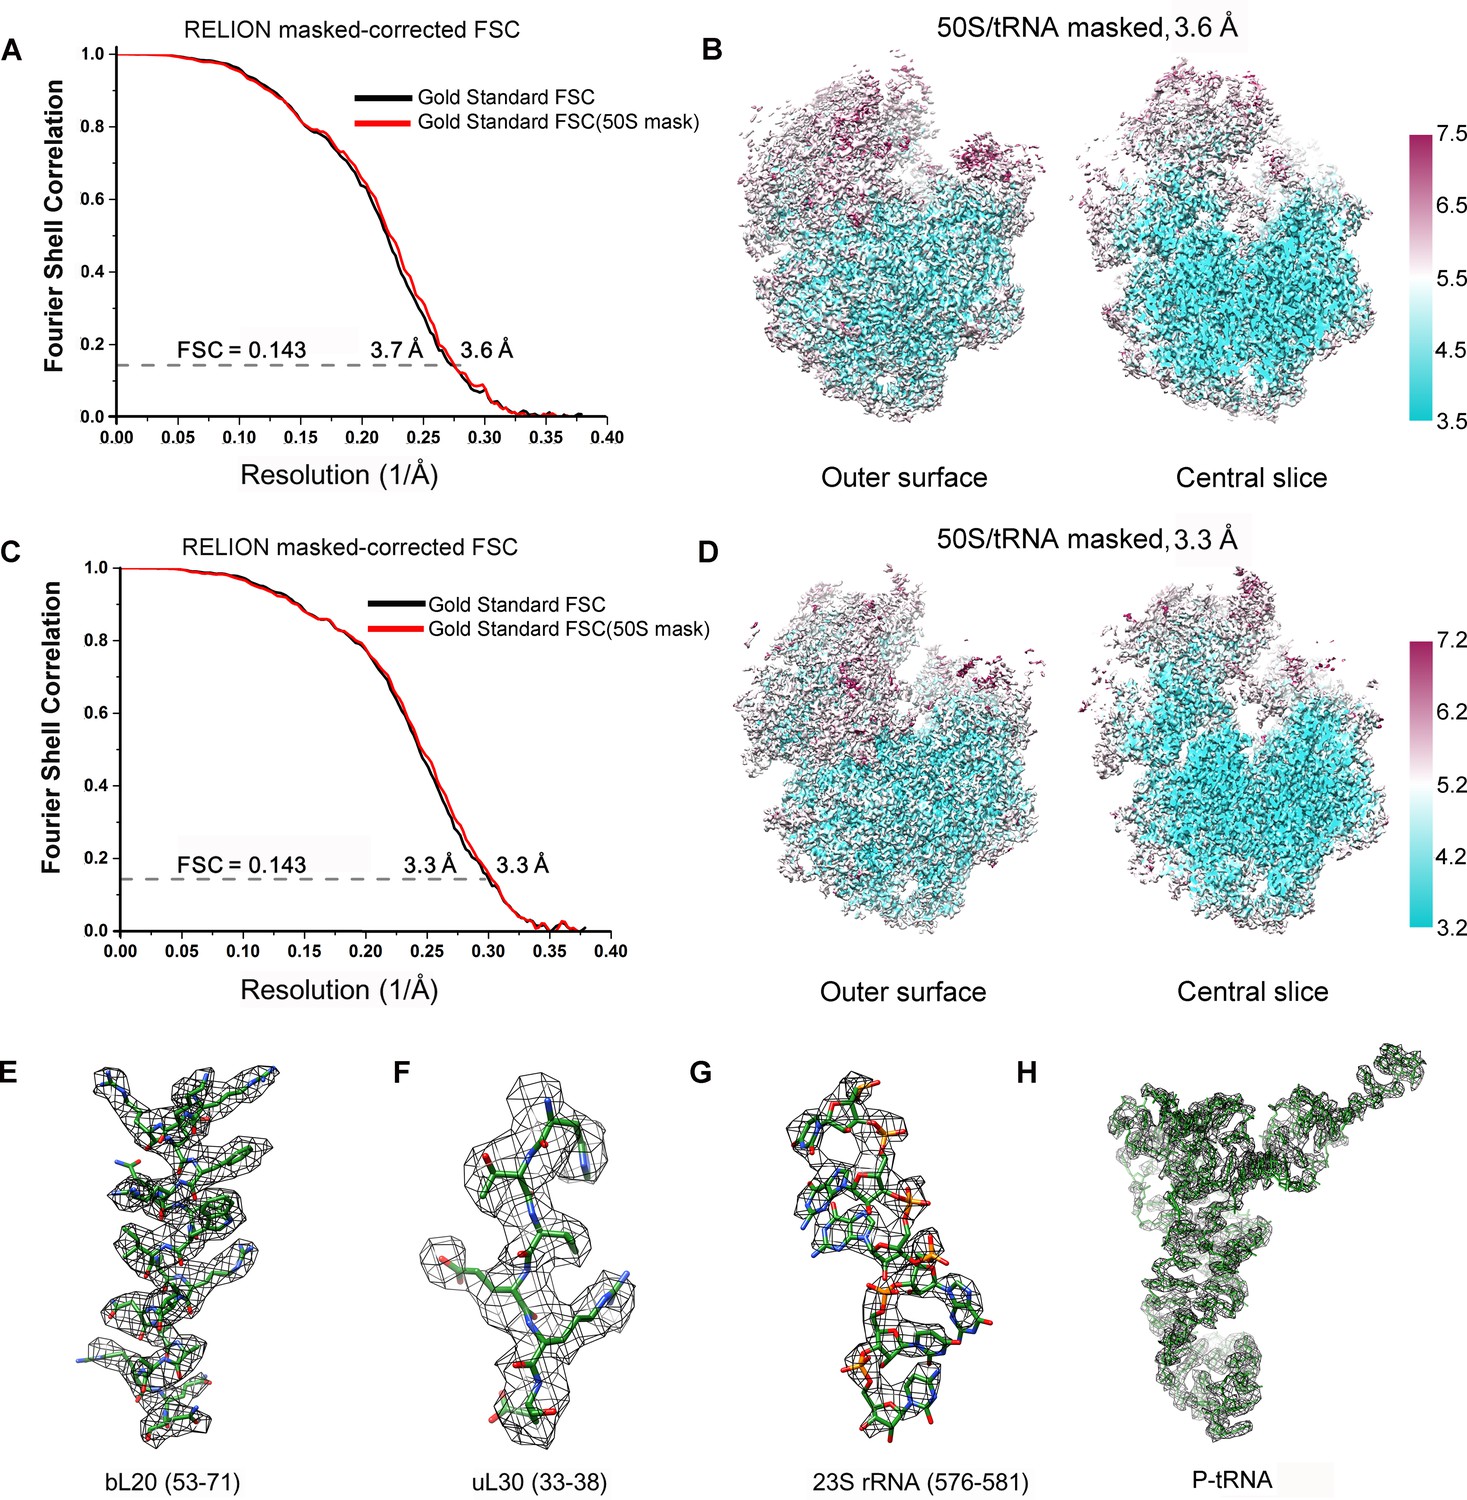
FSC curves and Cryo-EM density.
(A, C) Gold-standard Fourier shell correlation curves of the reconstructions of SecM-Gly-RNC (A) and SecM-Pro-RNC (C) with a soft 70S mask (black) or a 50S mask (red) applied during refinement. (B, D) The local resolution maps of the 50S-masked SecM-Gly-RNC (B) and SecM-Pro-RNC (D). Throughout much of the interior, the local resolution is significantly better than the overall resolution. (E-H) Examples of the densities in the cryo-EM map of SecM-Gly-RNC, including anα helix (residues 53–71 from protein bL20, E), a β strand (residues 33–38 from protein uL30, F), nucleotide bases (576–581 from 23S rRNA, G), and the P-site tRNA (H). The models were colored as forest green by elements, and the density maps were showed as dark mesh. The densities of nucleotide bases and amino acids are clearly separated from each other, in good agreement with reported resolutions. The density map was displayed at ∼5σ contour level.
Figure 1—figure supplement 5
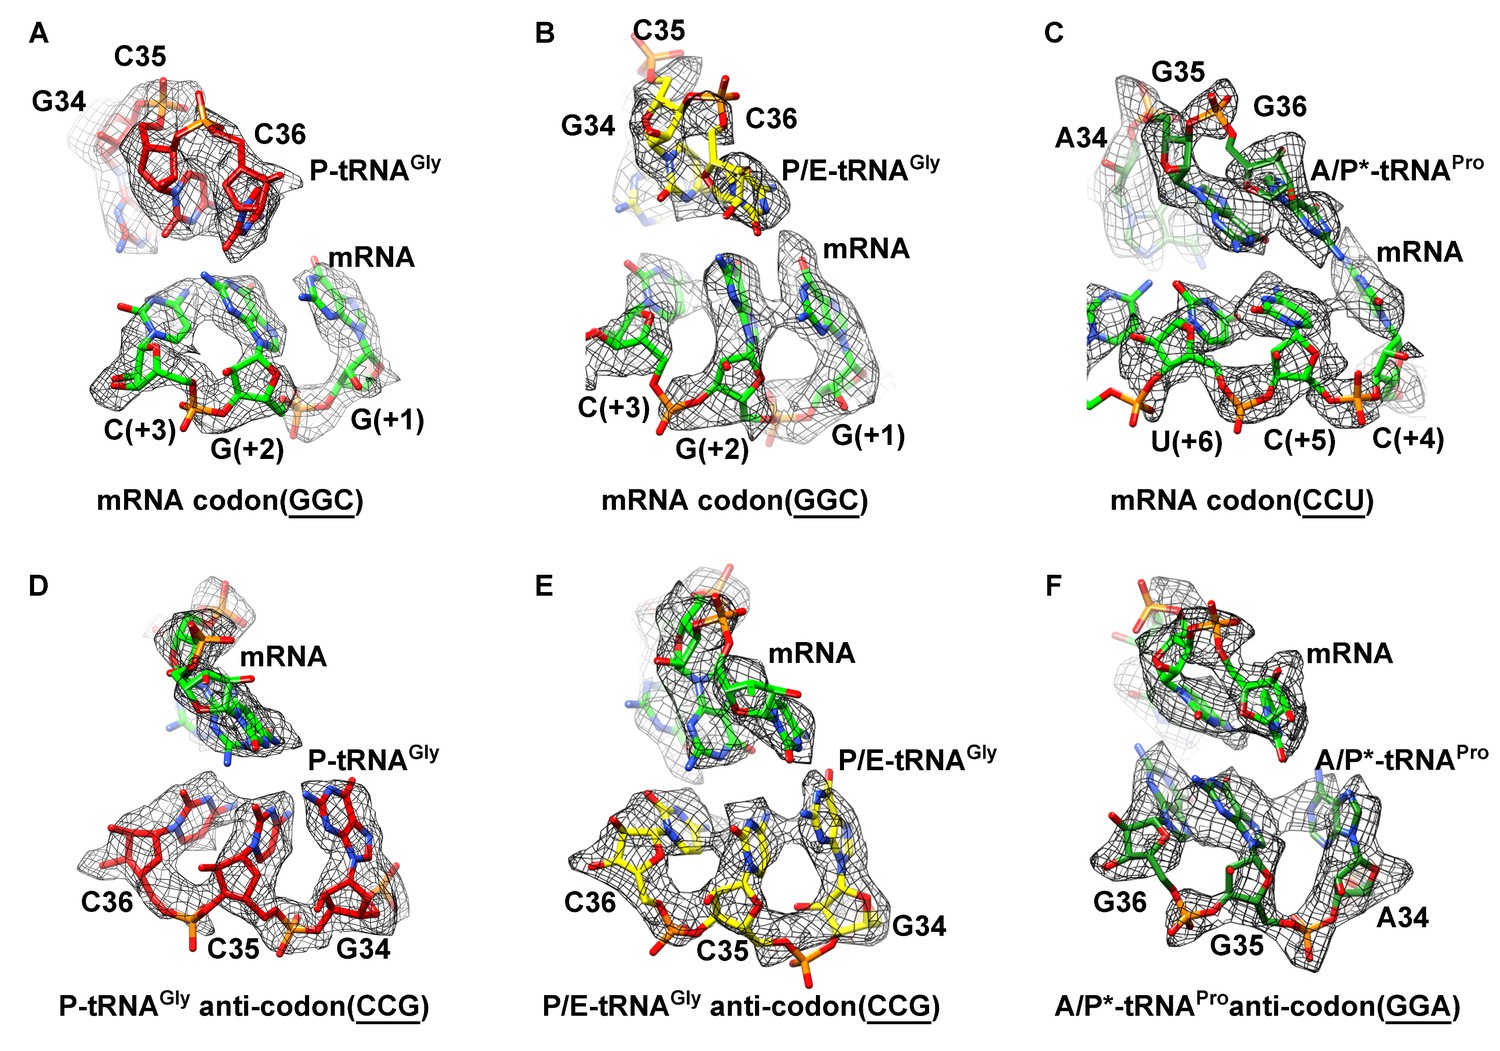
Map density of the antiodon region of tRNAs and codon region of mRNA in SecM-stalled RNCs.
(A) Local density of the P-site codon of mRNA in SecM-Gly-RNC. (B) Local density of the P-site codon of mRNA in SecM-Pro-RNC. (C) Same as B, but for the A-site codon. (D-F) Same as A–C, but for the anticodon regions of respective tRNAs in the two map. The density map is displayed at ∼5σ contour level.
Figure 1—figure supplement 6
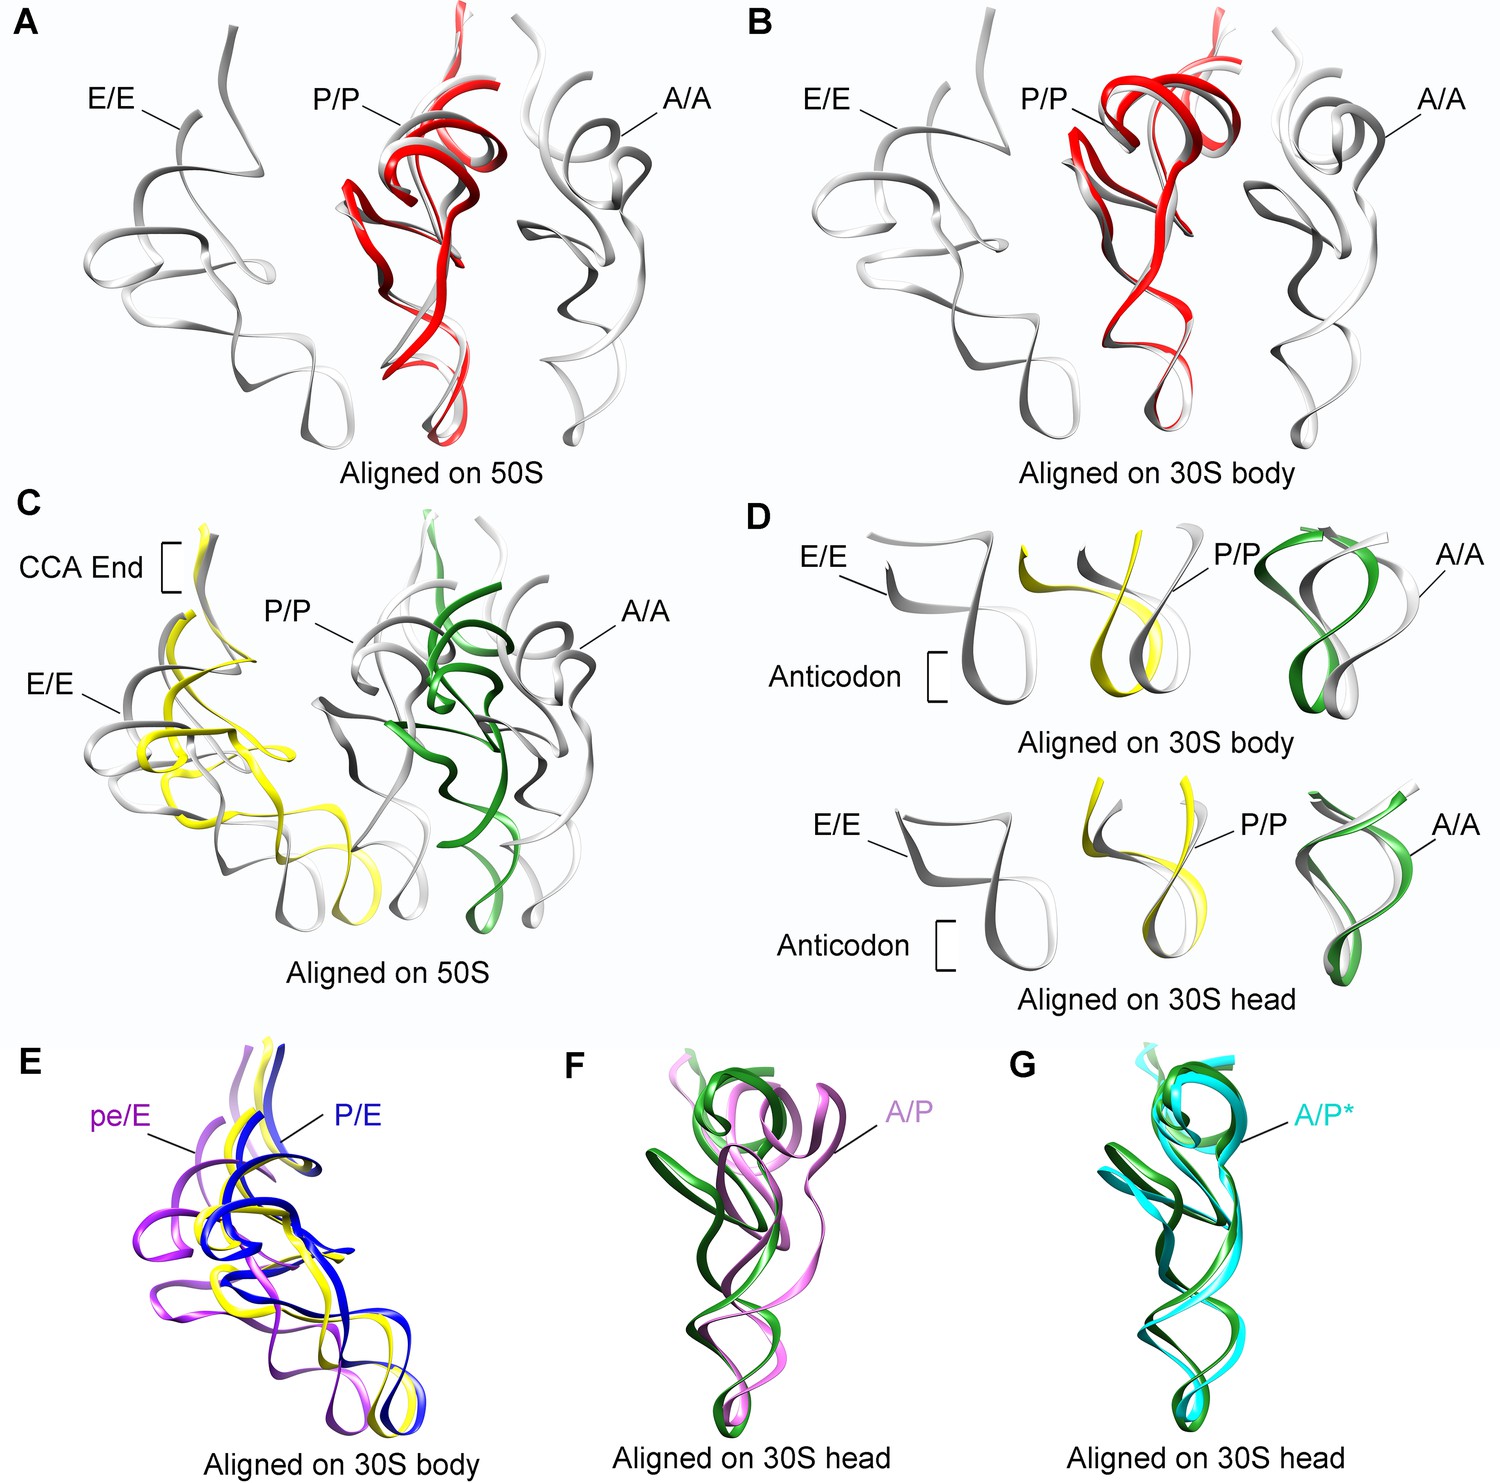
Positions of tRNAs in SecM-stalled RNCs.
(A-B) Comparison of the tRNA in SecM-Gly-RNC (red) with the tRNAs in classical A, P, and E-state (PDB 4V6F, gray) (Jenner et al., 2010). The alignment was done using the 50S subunit (the 23S rRNA residues 1600–2700) (A) or 30S subunit body (the 16S rRNA residues 10–550) (B) as reference. (C-D) Comparison of the tRNAs in SecM-Pro-RNC (yellow, forest green) with the tRNAs in classical states (gray). The alignment was done using the 50S subunit (the 23S rRNA residues 1600–2700) (C), the 30S subunit body (the 16S rRNA residues 10–550) (D, upper panel) or the 30S subunit head (the 16S rRNA residues 920–1400) (D, lower panel) as reference. (E) The P/E-tRNA in SecM-Pro-RNC (yellow), the P/E-tRNA (PDB ID 4V9D, blue) (Dunkle et al., 2011), and the pe/E-tRNA (PDB ID 4W29, purple) (Zhou et al., 2014) were aligned using the 30S body (the 16S rRNA residues 10–550) as reference. (F-G) The A/P*-tRNA in SecM-Pro-RNC (forest green), the A/P-tRNA (PDB ID 4V7C, orchild), and the A/P*-tRNA (PDB ID 4V7D, cyan) (Brilot et al., 2013) were aligned using the 30S head (the 16S rRNA residues 920–1400) as reference.
Figure 1—figure supplement 7
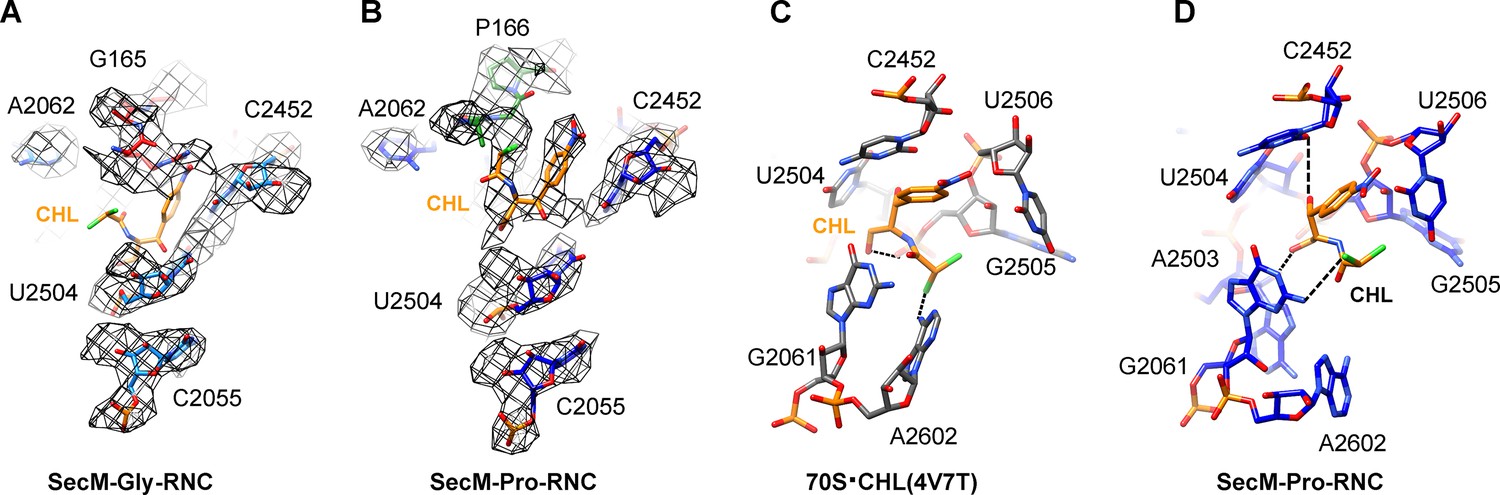
Chloramphenicol is present in SecM-Pro-RNC, but not SecM-Gly-RNC.
(A) The map density for selected region of the PTC in SecM-Gly-RNC is shown in mesh representation, superimposed with the atomic model. As shown, superimposition of chloramphenicol (CHL) (PDB ID 4V7T) (Dunkle, et al., 2010) indicates that there is no chloramphenicol bound in SecM-Gly-RNC. (B) Same as (A), but for SecM-Pro-RNC. At expected chloramphenicol-binding position, clear densities of chloramphenicol could be located. The density map is displayed at ∼5σ contour level. The alignment was done using the 50S subunit (the 23S rRNA residues 2400–2800) as reference. The RMS deviations between respective reference sequences are 1.5 Å for SecM-Gly-RNC vs 4V7T, and 1.1 Å for SecM-Pro-RNC vs 4V7T. (C) A snapshot of the binding environment of chloramphenicol (orange) in the crystal structure of chloramphenicol-bound 70S ribosome (PDB ID 4V7T) (Dunkle et al., 2010). Potential hydrogen bonds are shown in black dashed lines. (D) Same as C, but for SecM-Pro-RNC. Note that chloramphenicol interacts with different nucleotides, contrasting the structural observations from the crystal structure (PDB ID 4V7T) (Dunkle et al., 2010).
Figure 1—figure supplement 8
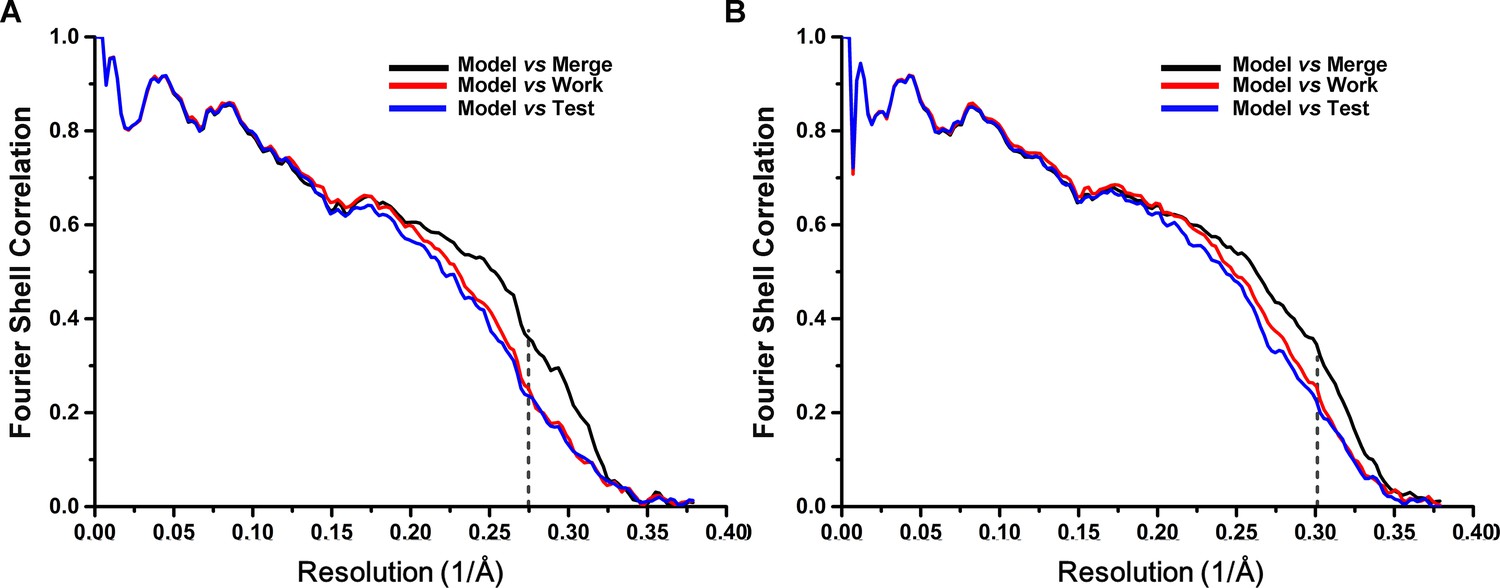
Cross-validation of the atomic model refinement.
Cross-validation of model refinements for SecM-Gly-RNC (A) and SecM-Pro-RNC (B). Refer to methods for details.
Figure 2 with 1 supplement

Interactions between SecM-Gly-nascent chain and ribosomal tunnel.
(A) A zoom-in view of the density map in the regions where SecM-Gly-nascent chain interacts with exit tunnel. A transverse-section of the cryo-EM map of the SecM-Gly-RNC, showing P-tRNA and SecM-Gly-nascent chain within the ribosomal exit tunnel is provided in the lower right corner. (B–G) Zoom-in views of the density map in selected regions, highlighting extensive interactions between SecM and ribosomal tunnel components. Map density is shown in mesh, and the atomic model in stick representation. The coloring scheme is the same as in (A). Strong interactions between SecM-nascent-peptide and ribosomal components are indicated by red asterisks. The primary sequences from N-terminal Myc-tag to C-terminal of SecM peptide within the exit tunnel are shown below the panel (F). To illustrate the interaction between the nascent peptide and ribosomal tunnel components, the density map was displayed at relatively lower contour (1.5–3 σ).
Figure 2—figure supplement 1
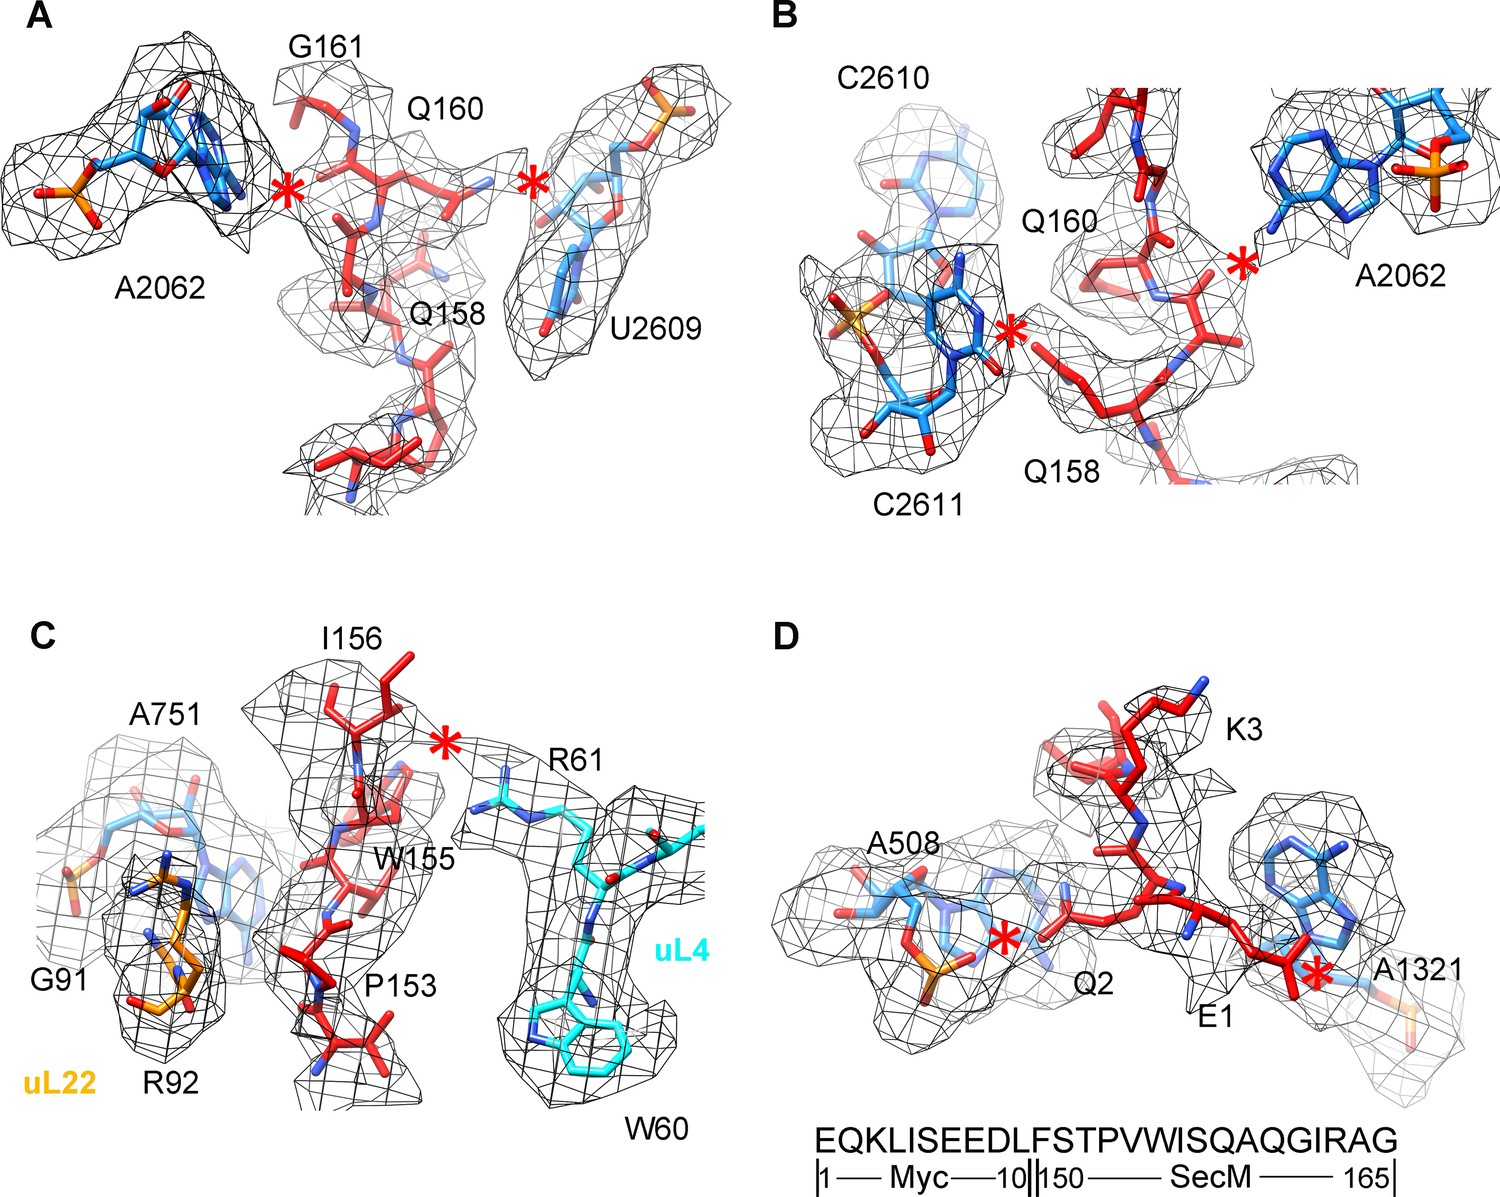
Selected regions of interactions between SecM and ribosomal tunnel components in SecM-Gly-RNC.
(A–D) Zoom-in views of the density map in selected regions, highlighting extensive interactions between SecM and ribosomal tunnel components. The coloring scheme is the same as in Figure 2. The interactions between SecM-nascent-peptide and ribosomal components are indicated by red asterisks. The primary sequences from N-terminal Myc-tag to C-terminus of the SecM peptide are shown below the panel (D). To illustrate the interaction between the nascent peptide and ribosomal tunnel components, the density map was displayed at relatively lower contour levels (1.5–3σ).
Figure 3 with 1 supplement
Interactions between SecM-Pro-nascent chain with ribosomal tunnel.
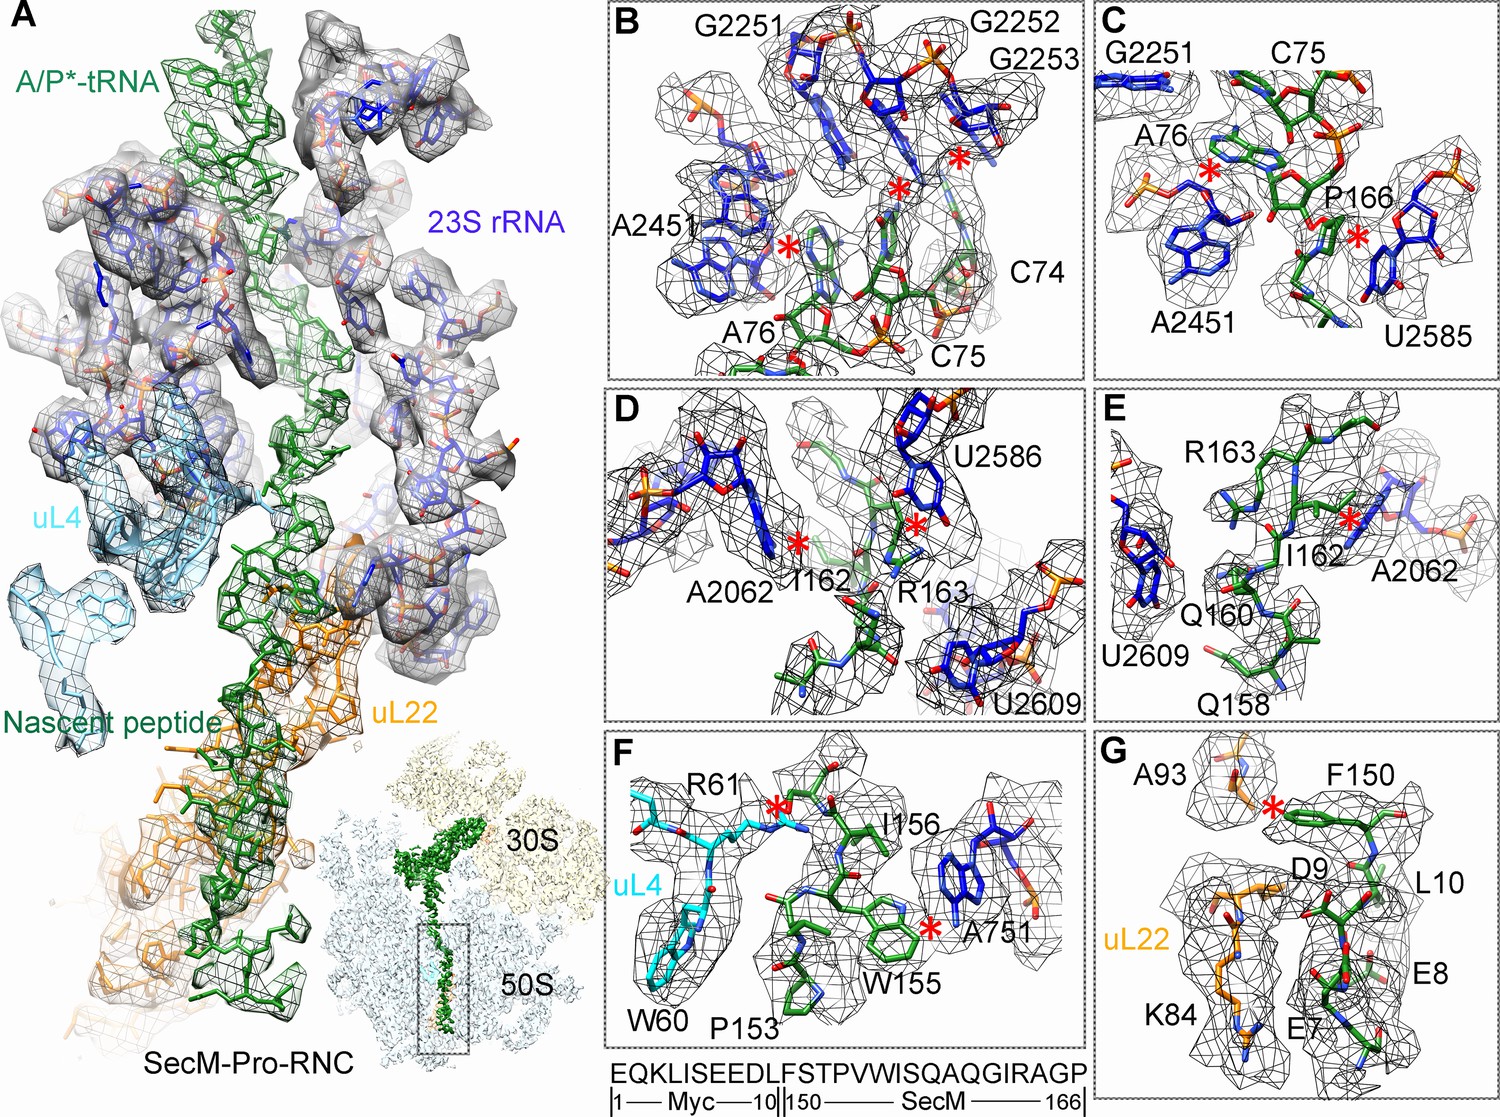
(A) A zoom-in view of the density map in the region where SecM-Pro-nascent chain interacts with ribosomal tunnel. A transverse-section of the cryo-EM map of the SecM-Pro-RNC, showing P-tRNA and SecM-Pro-nascent chain within the ribosomal exit tunnel is provided in the lower right panel. (B–G) Zoom-in views of the density map in selected regions, highlighting extensive interactions between SecM and ribosomal tunnel components. Map density is shown in mesh, and the atomic model in stick representation. The coloring scheme is the same as in (A). Strong interactions between SecM-nascent-peptide and ribosomal components are indicated by red asterisks. The primary sequences from N-terminal Myc-tag to C-terminal of SecM peptide within the exit tunnel are shown below the panel (F). To illustrate the interaction between the nascent peptide and ribosomal tunnel components, the density map was displayed at relatively lower contour (1.5–3 σ).
Figure 3—figure supplement 1
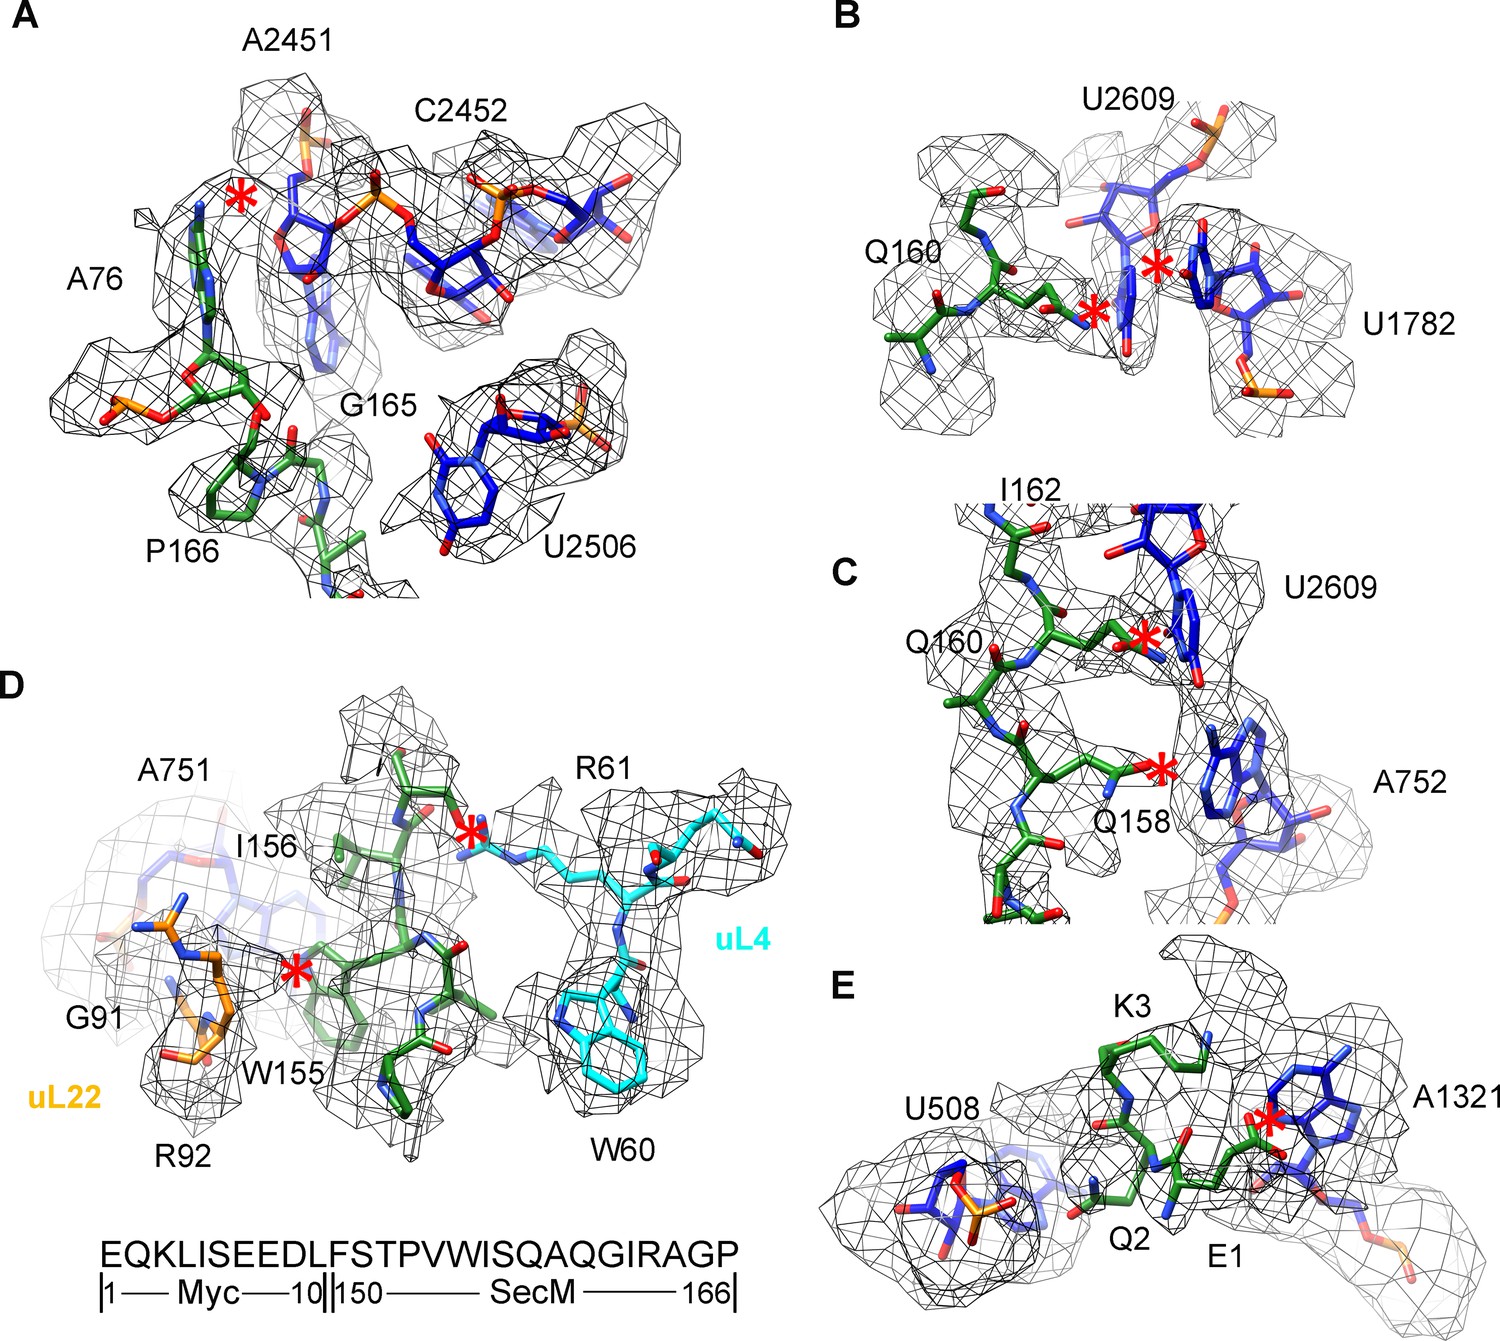
Selected regions of interactions between SecM and ribosomal tunnel components in SecM-Pro-RNC.
(A–E) Zoom-in views of the density map in selected regions, highlighting extensive interactions between SecM and ribosomal tunnel components. Map density is shown in mesh, and the atomic model in stick representation. The coloring scheme is the same as in Figure 3. The interactions between SecM-nascent-peptide and ribosomal components are indicated by red asterisks. The primary sequences from N-terminal Myc-tag to C-terminus of the SecM peptide are shown below the panel (D). To illustrate the interaction between the nascent peptide and ribosomal tunnel components, the density map was displayed at relatively lower contour levels (1.5–3σ).
Figure 4 with 1 supplement
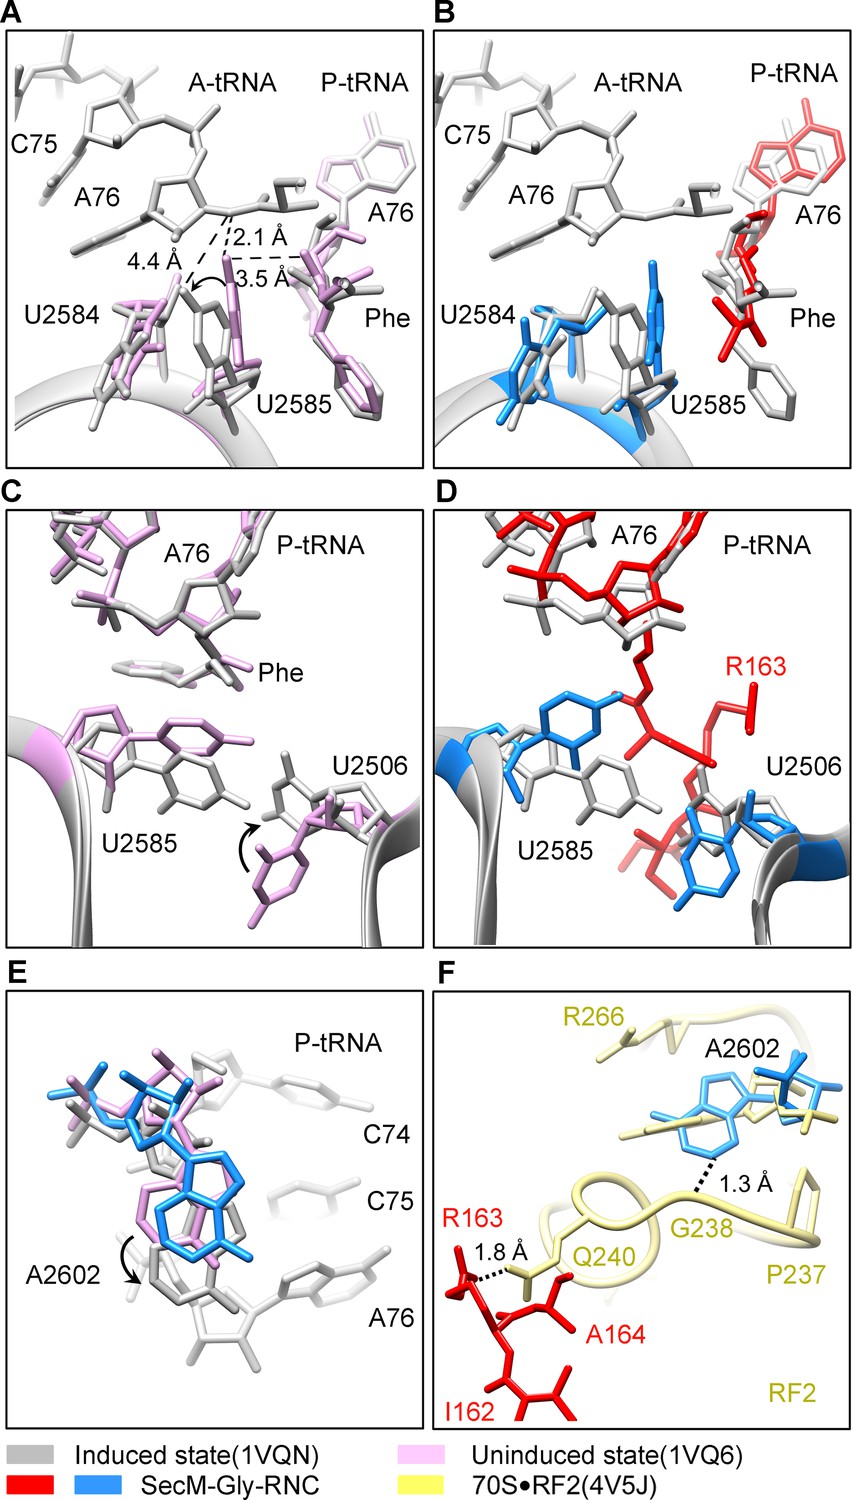
SecM stabilizes the PTC of SecM-Gly-RNC in an inactive state.
(A) Conformational difference between the uninduced (PDB ID 1VQ6, plum) (Schmeing et al., 2005a) and the induced states (PDB ID 1VQN, gray) (Schmeing et al., 2005a) of the PTC. Direction of the shift for U2585 between two states and corresponding distances are labeled. As shown in (A), U2585 and U2584 would shift away by 3–4 Å from the uninduced state to the induced state. (B) U2584 and U2585 in SecM-Gly-RNC (23S rRNA in blue and peptidyl-tRNA in red) shift away from their regular positions in the induced state (grey) and assume an uninduced state. (C) Rotation of U2506 accompanying the shift of U2585 as in (A), upon transition from the uninduced (plum) to induced (grey) states. (D) Position and interaction of R163 in SecM-Gly-RNC. R163 leads to a rotation of U2506 to assume an uninduced conformation. (E) Comparison of A2602 in SecM-Gly-RNC with that of the uninduced and induced states. (F) The conformation of A2602 (blue) in SecM-Gly-RNC is incompatible with the binding of release factor2 (RF2) to the PTC. The position of R163 (red) in SecM-Gly-RNC is in clash with the GGQ motif of RF2 (bright yellow). The coordinates of RF2 is from a crystal structure of the 70S·RF2 complex (PDB, ID 4V5J) (Jin et al., 2010). The alignment was done using the 23S rRNA residues 2400–2800 as reference. The RMS deviations between respective reference sequences are 0.3 Å for 1VQN vs 1VQ6, 1.5 Å for SecM-Gly-RNC vs 1VQN, 1.0 Å for SecM-Gly-RNC vs 4V5J.
Figure 4—figure supplement 1
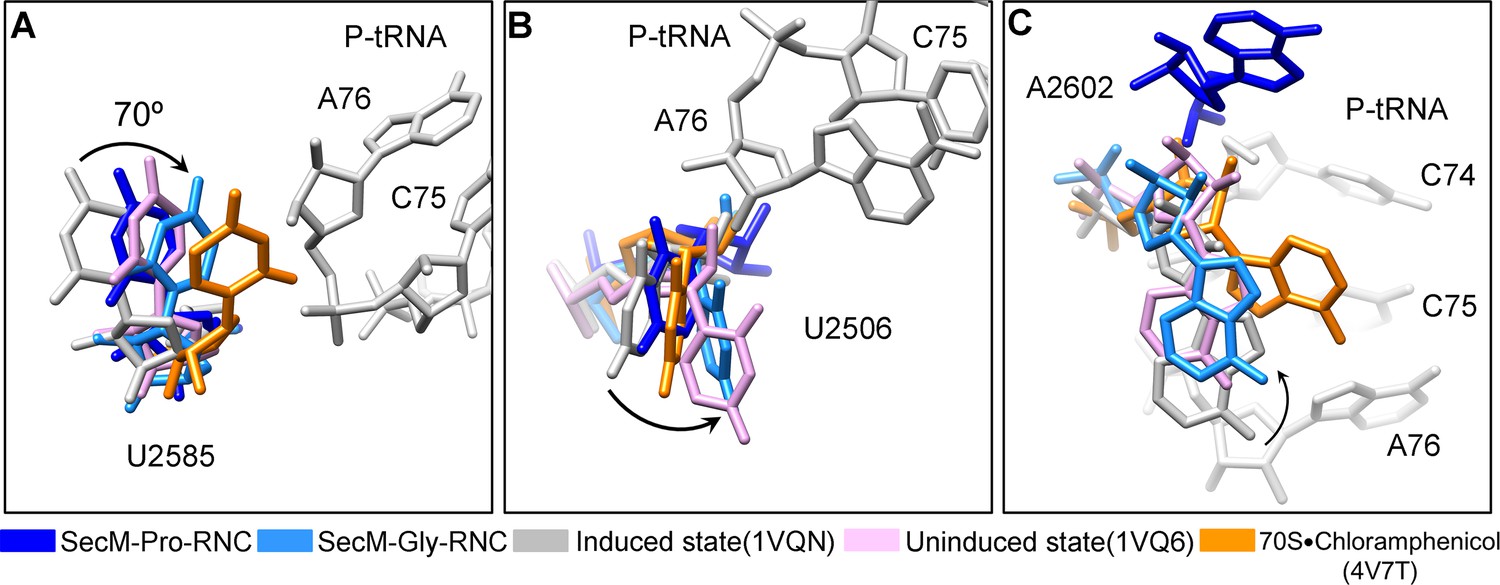
Conformational changes of the PTC nucleotides in SecM-stalled RNCs.
(A) Comparison of U2585 in SecM-Gly-RNC (azure) and SecM-Pro-RNC (blue) with the ribosomal structures in the induced (PDB 1VQN, gray), uninduced (PDB 1VQ6, plum) (Schmeing et al., 2005a; Schmeing et al., 2005b), and chloramphenicol bound (PDB 4V7T, orange) (Dunkle, et al., 2010) states. U2585 in both SecM-Gly-RNC and SecM-Pro-RNC shifts away from their regular positions in the induced state to different extents. (B) Same as (A), but for U2506. U2506 in SecM-Gly-RNC adopts a position similar as in the uninduced state, and in SecM-Pro-RNC the induced state. (C) Same as A, but for A2602. A2602in SecM-Gly-RNC is in the uninduced state, and in SecM-Pro-RNC flips away from the induced state. The alignment was done using the 23S rRNA residues 2400–2800 as reference. The RMS deviations between respective reference sequences are 0.3 Å for 1VQ6 vs 1VQN, 1.5 Å for SecM-Gly-RNC vs 1VQN, 1.4 Å for SecM-Pro-RNC vs 1VQN, and 1.1 Å for 4V7T vs 1VQN. As shown, comparison of our models with the chloramphenicol-bound one indicates that the conformations of the important bases (U2506/U2585/A2602) of the PTC in our models are different from the crystal structure of ribosome bound with chloramphenicol, indicating that the stalling in our structures is not determined by chloramphenicol.
Figure 5 with 1 supplement
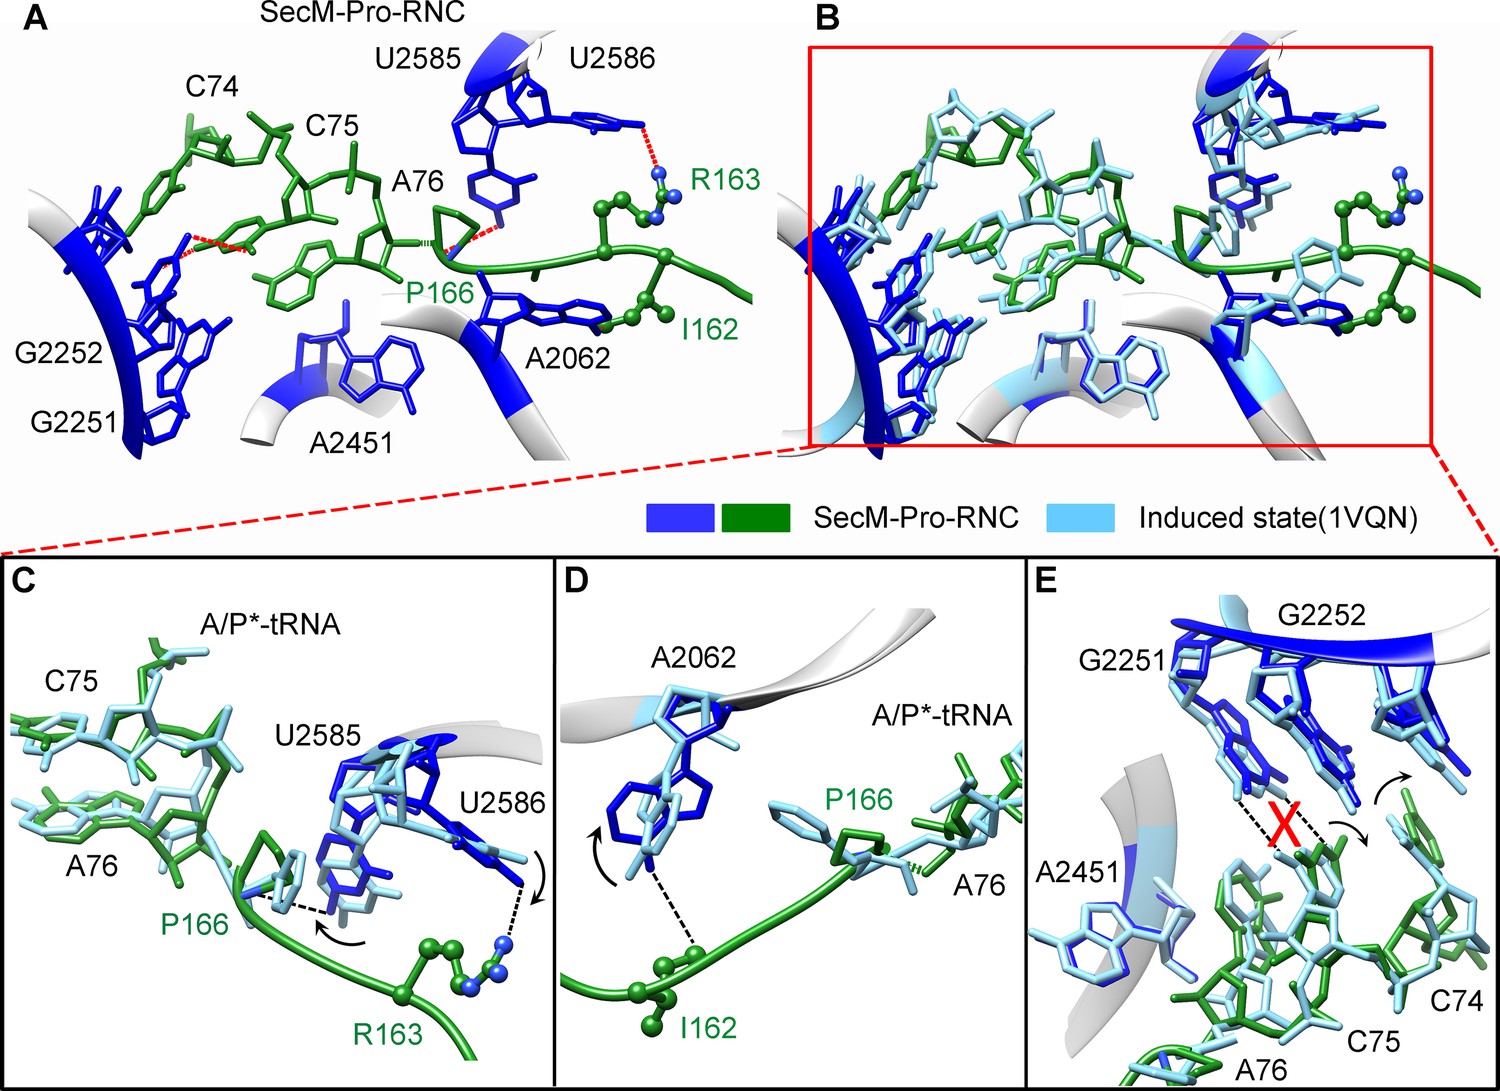
SecM destabilizes the interaction between CCA-end of the A/P*-tRNA and the P-loop in SecM-Pro-RNC.
(A) Interactions between SecM nascent peptide and ribosomal components at the PTC in SecM-Pro-RNC. Peptidyl-tRNA and 23S rRNA are colored forest green and blue, respectively. (B) Comparison of the 23S rRNA nucleotides in SecM-Pro-RNC with that of the induced state of the PTC (PDB 1VQN, cyan) (Schmeing et al., 2005a). (C–E) Zoom-in views of (B), with orientations optimized to show the conformational difference for U2585-U2586 (C), A2062 (D), and the P-loop (E). The alignment was done using the 23S rRNA residues 2400–2800 as reference. The RMS deviation between respective reference sequences is 1.4 Å for SecM-Pro-RNC vs 1VQN.
Figure 5—figure supplement 1
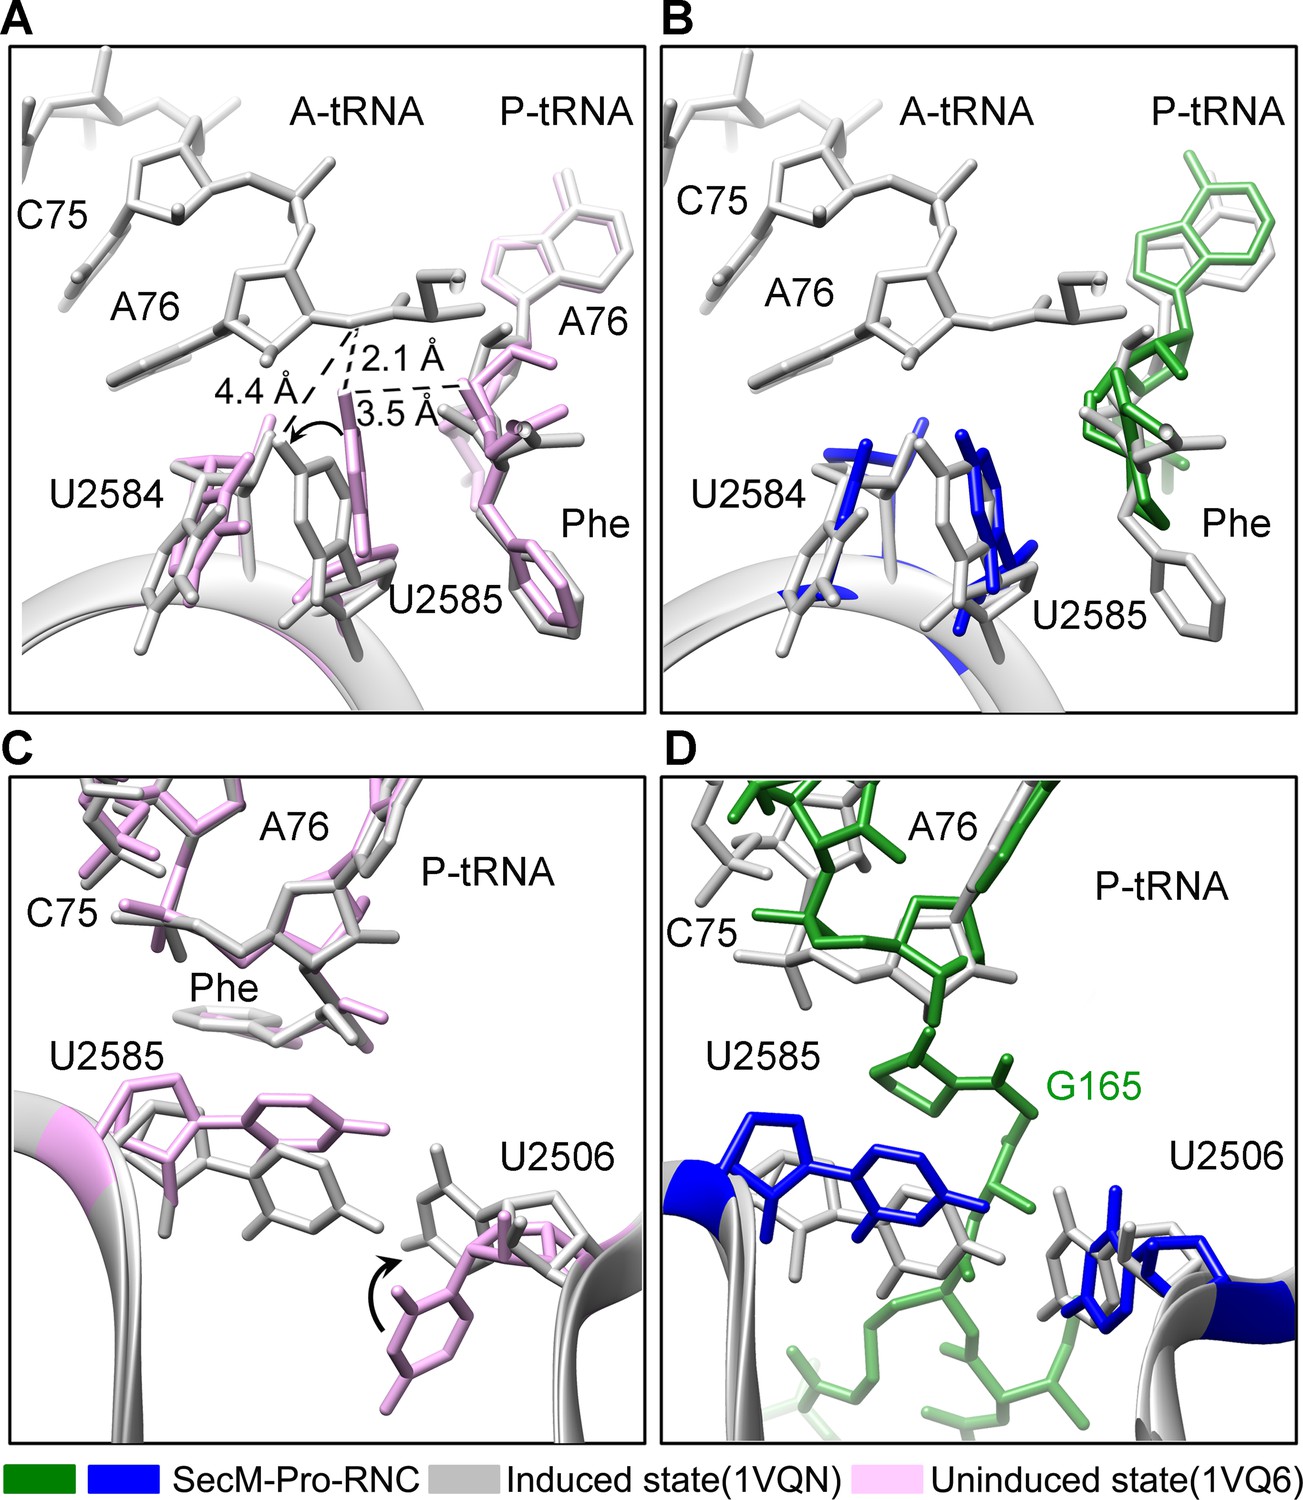
Conformation states of the PTC nucleotides in SecM-Pro-RNC around the PTC.
(A) Conformational difference between the uninduced (PDB ID 1VQ6, plum) (Schmeing et al., 2005b) and the induced states (PDB ID 1VQN, gray) (Schmeing et al., 2005b) of the PTC. Direction of shift for U2585 and corresponding distances are labeled. As shown in (A), U2585 and U2584 would shift away by 3–4 Å from the uninduced state to the induced state. (B) U2585 in SecM-Pro-RNC (blue) shifts slightly toward the direction of the induced state (gray), but still in a state closer to the uninduced conformation (plum). (C) Rotation of U2506 accompanying the shift of U2585 as in (A), upon transition from the uninduced (plum) to induced (grey) states. (D) Position and interaction of G165 in SecM-Pro-RNC. The alignment was done using the 23S rRNA residues 2400–2800 as reference. The RMS deviations between respective reference sequences are 0.3 Å for 1VQN vs 1VQ6 (A, C), and 1.4 Å for SecM-Pro-RNC vs 1VQN (B, D).
Figure 6 with 3 supplements
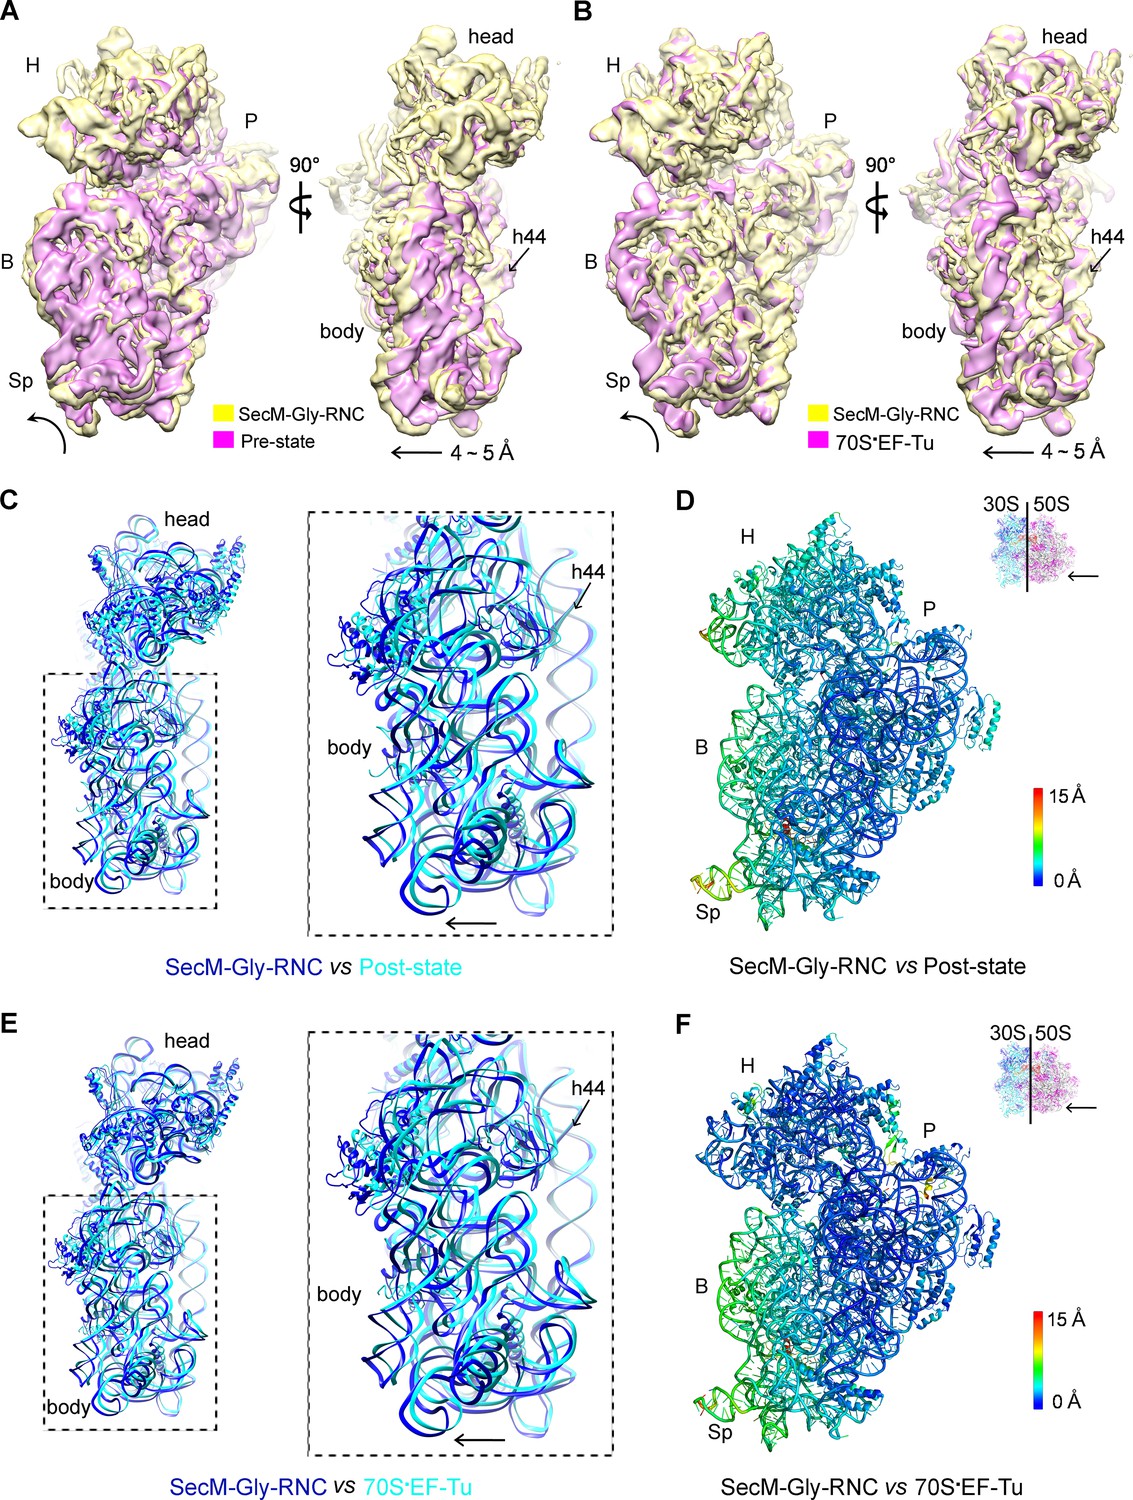
A rolling-like motion of the 30S subunit in SecM-Gly-RNC.
(A) Comparison of the cryo-EM density map of the 30S subunit in SecM-Gly-RNC (yellow) with that of a pre-translocational state ribosome with three tRNA-bound (EMDB 5796, orchid) (Brilot et al., 2013) from an intersubunit view (left panel) and a side view (right panel). (B) Same as (A), but compared with the 30S subunit from the cryo-EM density map of a 70S ribosome bound with elongation factor-Tu (EF-Tu) (EMDB 5036, orchid) (Villa et al., 2009). Alignments were done using the segmented 50S subunit as reference. (C) Comparison of the atomic model of the 30S subunit in SecM-Gly-RNC (cyan) with that of the crystal structure of a post-translocational/initiation state ribosome (PDB ID 4V9D, blue) (Dunkle et al., 2011). A side view of two superimposed models is shown on the left, with a zoom-in view on the right. (D) Temperature map of the 30S subunit in SecM-Gly-RNC, compared with the 30S subunit in the crystal structure of a post-translocational/initiation state ribosome (PDB ID 4V9D). The 30S subunit in SecM-Gly-RNC is colored according to its distance deviations from 4V9D, with coloring scheme showing on the right. (E) Same as (C), but for the comparison between SecM-Gly-RNC (cyan) and the atomic model of the cryo-EM structure of a post-translocational ribosome bound with EF-Tu (PDB ID 4V69, blue) (Villa et al., 2009). (F) Same as (D), but the temperature map is for the comparison in (E). The alignment was done using the 23S rRNA residues 1600–2800 as reference. The RMS deviations between respective reference sequences are 1.7 Å for 4V9D vs SecM-Gly-RNC (C,D), and 1.4 Å for 4V69 vs SecM-Gly-RNC (E,F). EF-Tu: Elongation factor-Tu.
Figure 6—figure supplement 1
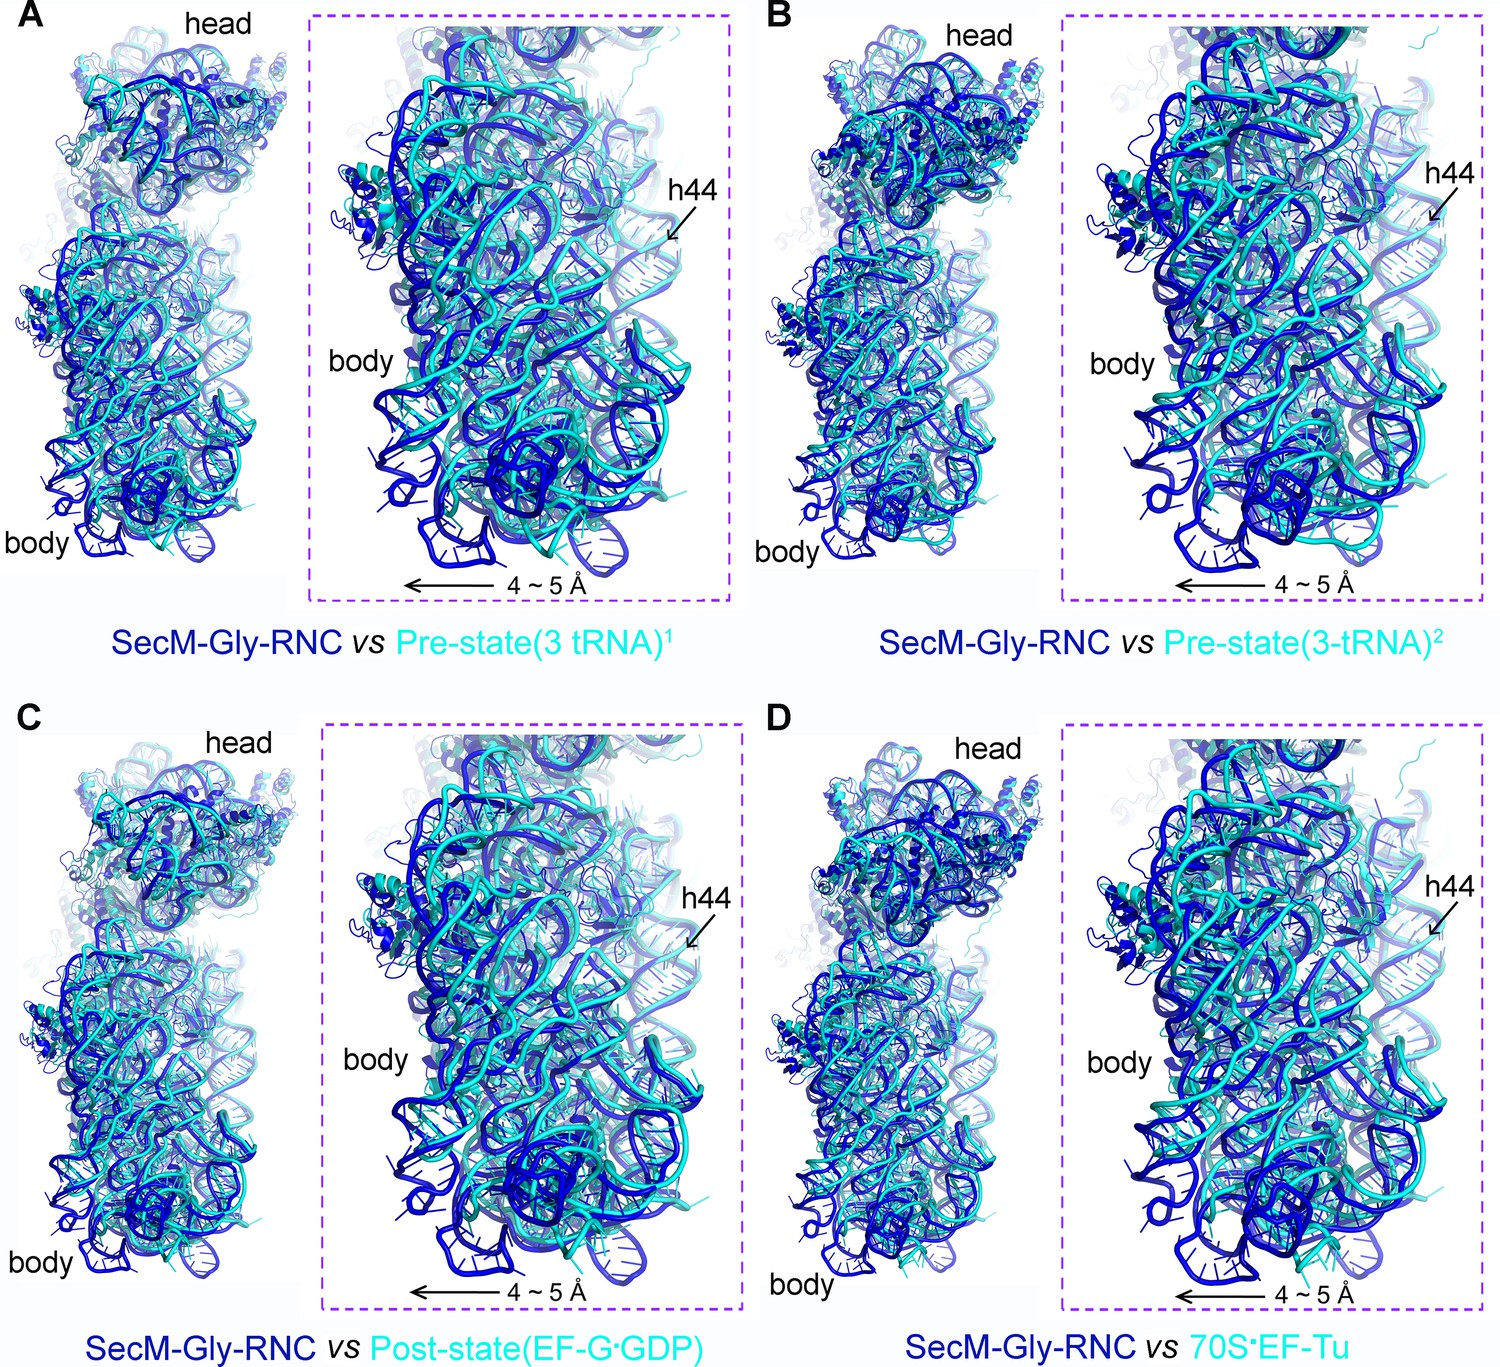
The rolling-like motion of the 30S subunit in SecM-Gly-RNC, compared with crystal structures of various ribosomal complexes from Thermus thermophilus.
(A-D) Comparison of the 30S subunit in SecM-Gly-RNC (cyan) with that from the crystal structures of different ribosomal complexes from T. thermophilus, including a pre-translocationalstate (three tRNAs) (PDB ID 4V51, blue) (Selmer et al., 2006) (A), another pre-translocationalstate (three tRNAs) (PDB ID 4V6F, blue) (Jenner et al., 2010) (B), post-translocation state with EF-G (PDB ID 4V5F, blue) (Gao et al., 2009) (C), and 70S complex with EF-Tu (PDB ID 4V5L, blue) (Voorhees et al., 2010) (D). Comparisons are based on a common 50S alignment. The alignment was done using the 23S rRNA residues 1600–2900 as reference. The RMS deviations between respective reference sequences are 1.6 Å for 4V51 vs SecM-Gly-RNC (A), 1.6 Å for 4V6F vs SecM-Gly-RNC (B), 1.6 Å for 4V5F vs SecM-Gly-RNC (C), and 1.7 Å for 4V5L vs SecM-Gly-RNC (D).
Figure 6—figure supplement 2
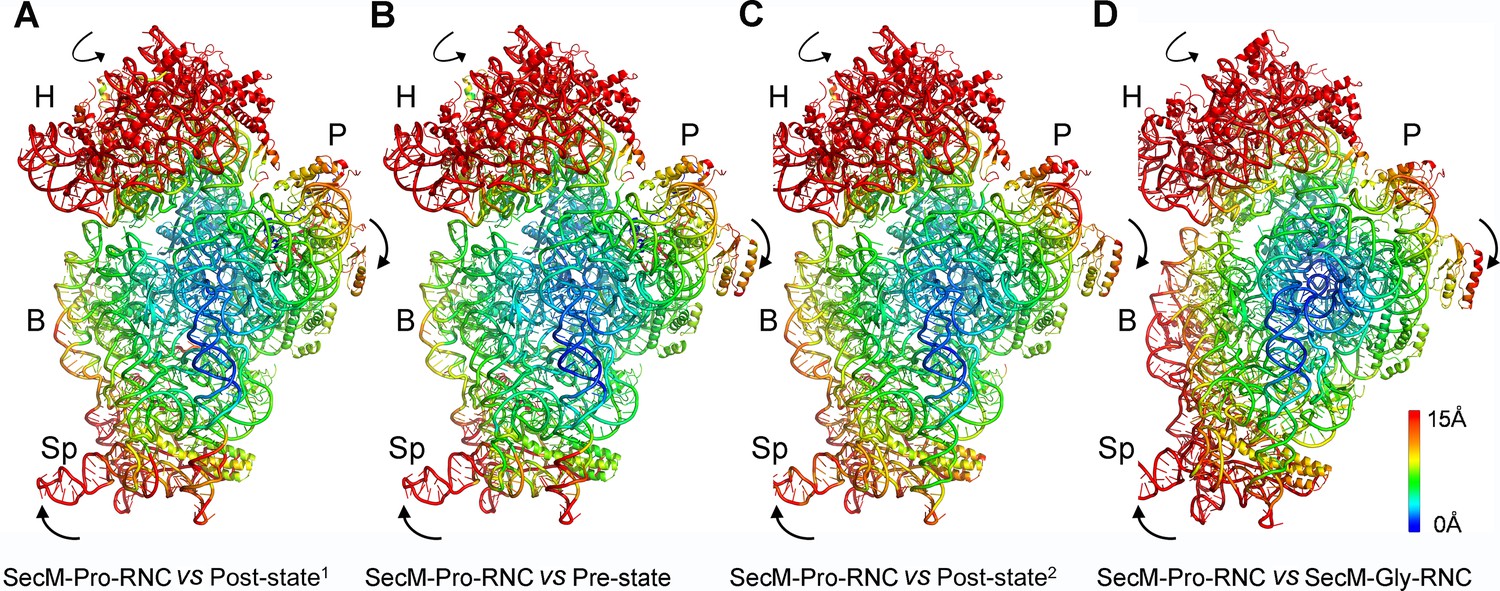
Rotation of the 30S subunit relative to the 50S subunit in SecM-Pro-RNC.
(A-D) Temperature map of the 30S subunit in SecM-Pro-RNC, compared with the 30S subunits in unrotated ribosomes, including the post-translocational state from Thermus thermophilus (PDB ID 4V6F) (Jenner et al., 2010) (A), the pre-translocational state from T. thermophilus (PDB ID 1VY5) (Polikanov et al., 2014) (B), the post-translocational state from Escherichia coli (PDB ID 4V9D) (Dunkle et al., 2011) (C), and the atomic model of SecM-Gly-RNC (D). The 30S subunit in SecM-Pro-RNC is colored according to its distance deviations from the other, with coloring scheme showing on the right. The alignment was done using the 23S rRNA residues 1600–2900 as reference. The RMS deviations between respective reference sequences are ∼1.6 Å for 4V6F vs SecM-Pro-RNC (A), 1.5 Å for 1VY5 vs SecM-Pro-RNC (B), 1.2 Å for 4V9D vs SecM-Pro-RNC (C), and 1.0 Å for SecM-Gly-RNC vs SecM-Pro-RNC (D).
Figure 6—figure supplement 3
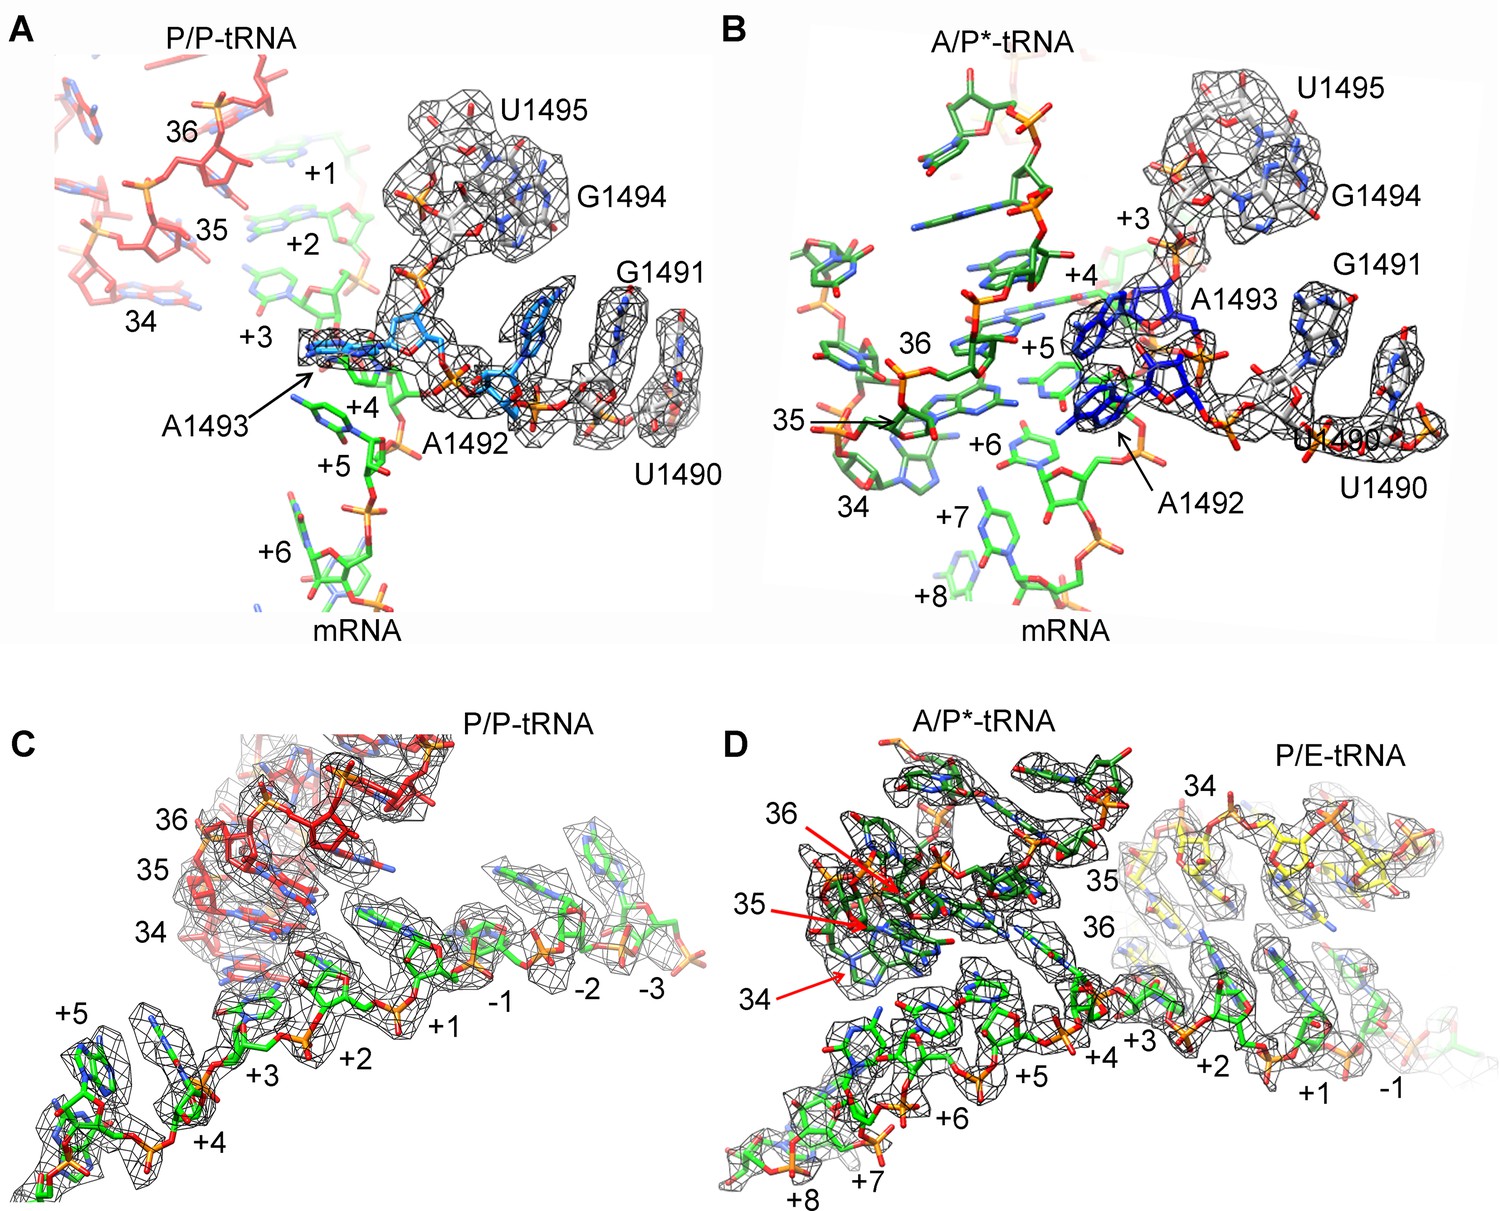
Map density of decoding centers in SecM-stalled RNCs.
(A) The conformation of A1492 and A1493 in SecM-Gly-RNC. Map density is shown in mesh, and the atomic model in stick representation. P/P-tRNA, mRNA and 16S rRNA are colored red, green, and azure, respectively. (B) The conformation of A1492 and A1493 in SecM-Pro-RNC. Map density is shown in mesh, and the atomic model in stick representation. A/P*-tRNA, mRNA and 16S rRNA are colored forest green, green, and blue, respectively. (C) Map density of P/P-tRNA and mRNA in SecM-Gly-RNC. The anti-codons of P/P-tRNA contact with codons of mRNA at positions from + 1 to + 3. Map density is shown in mesh, and the atomic model in stick representation. P/P-tRNA and mRNA are colored red and green, respectively. (D) Map density of A/P*-tRNA, P/E-tRNA, and mRNA in SecM-Pro-RNC. The anticodons of A/P*-tRNA and P/E-tRNA contact with codons of mRNA at positions from + 4 to + 6 and from + 1 to + 3, respectively. The positions of nucleotide bases in mRNA were numbered by setting the codon of Gly as + 1 to + 3. Map density is shown in mesh, and the atomic model in stick representation. A/P*-tRNA, P/E-tRNA and mRNA are colored forest green, yellow, and green, respectively. The density map is displayed at ∼4σ contour level.
Figure 7

Schematic models of SecM-mediated translation stalling.
(A) Model illustrating how interactions of SecM within the ribosomal tunnel in SecM-Gly-RNC promote conformational rearrangements of the 23S rRNA nucleotides of U2585, U2506, and A2602, and thereby locks the PTC in the inactive state and not optimized for stable binding and accommodation of the incoming A-site tRNA. (B) Model illustrating how interactions of SecM within the ribosomal tunnel in SecM-Pro-RNC alter the interaction between the A/P*-tRNA and the P-loop. The altered P-loop interaction increases the life time of A/P*-tRNA and slows down its translocation to classical P/P site.
Author response image 1
Local density of peptidyl-tRNA connection.
https://doi.org/10.7554/eLife.09684.031
Author response image 2
(A) High-resolution gel and Western blotting analyses of the purified SecM-RNC and (B) purified nascent peptide.
https://doi.org/10.7554/eLife.09684.032
Author response image 3
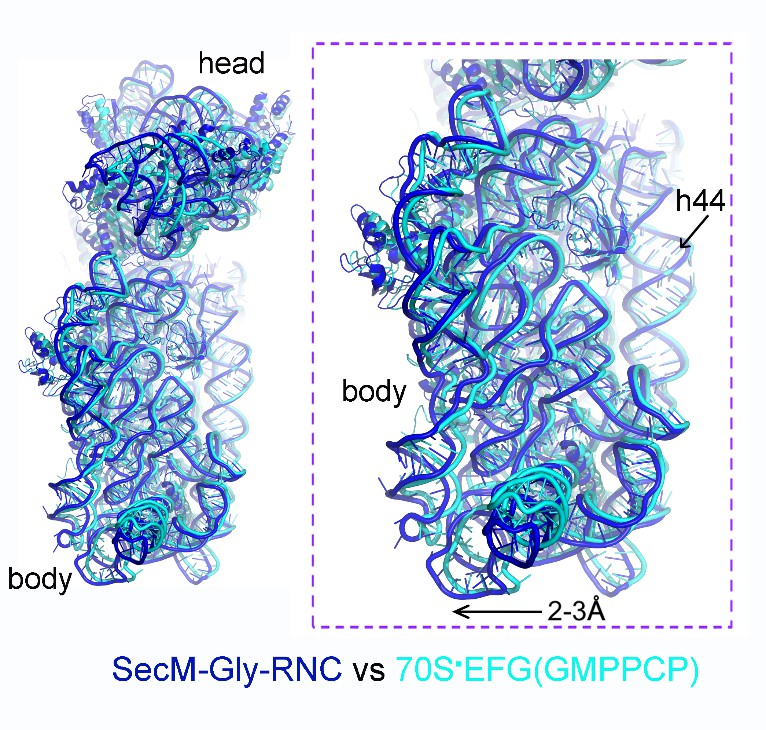
Comparison of SecM-Gly-RNC with an unrotated 70S-EF-G-GMPPCP structure.
https://doi.org/10.7554/eLife.09684.034
Author response image 4

Model Refinement and validation.
https://doi.org/10.7554/eLife.09684.035
Author response image 5
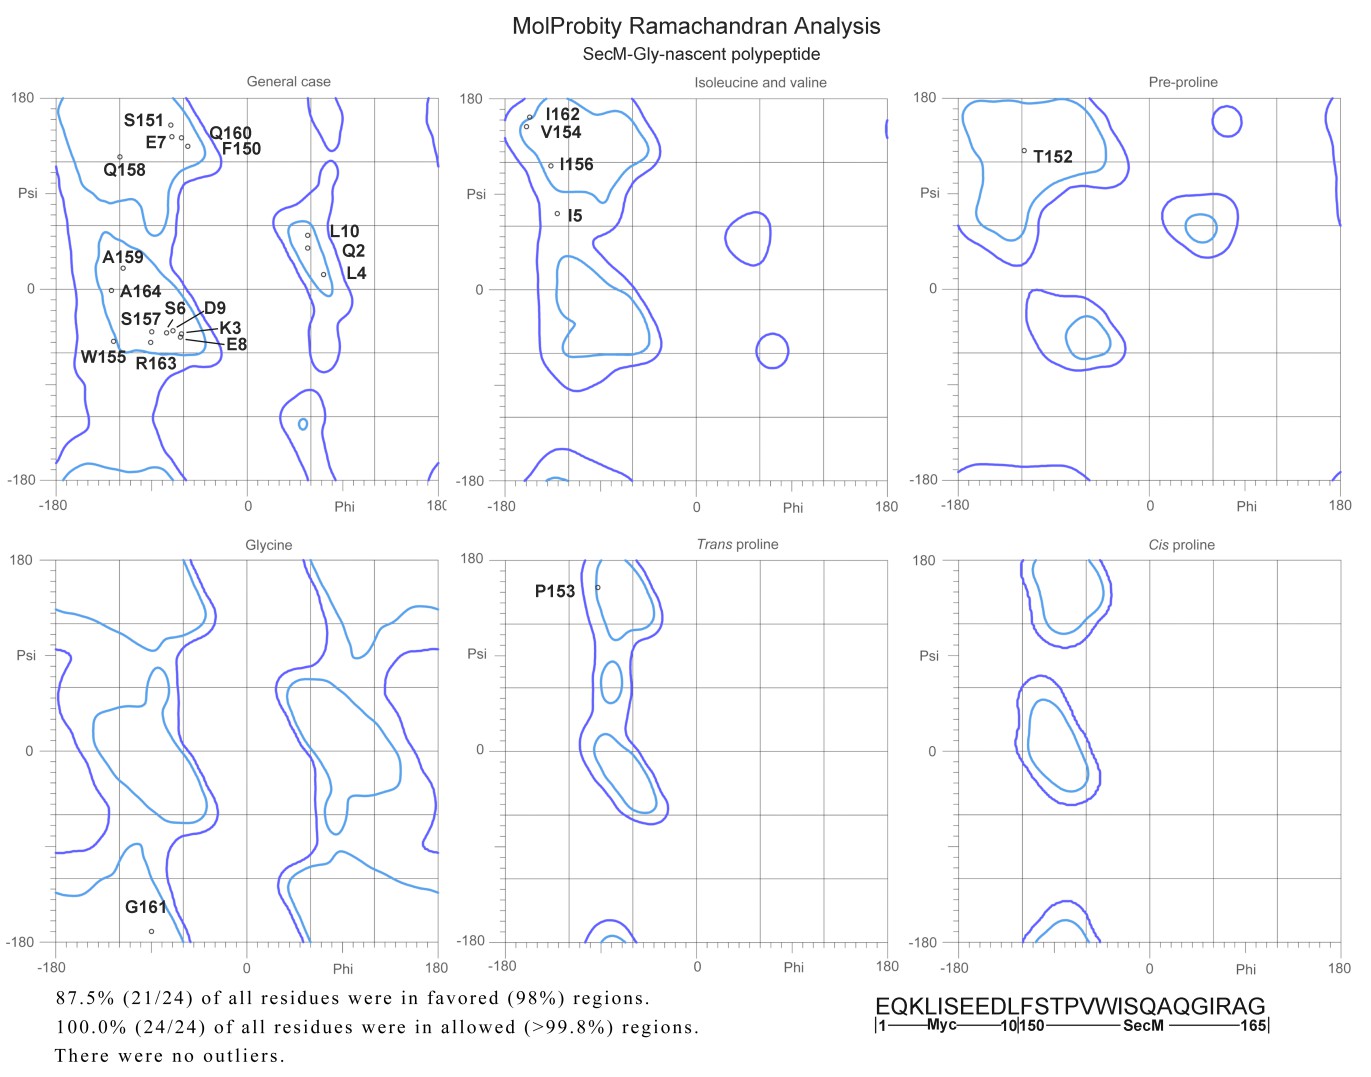
Ramachandra diagrams of the two nascent chains.
https://doi.org/10.7554/eLife.09684.036
Author response image 6

Comparison of our map of SecM-Gly-RNC (grey) with the Bhushan map (yellow).
The atomic model of our SecM-Gly-RNC is shown in red.
Author response image 7
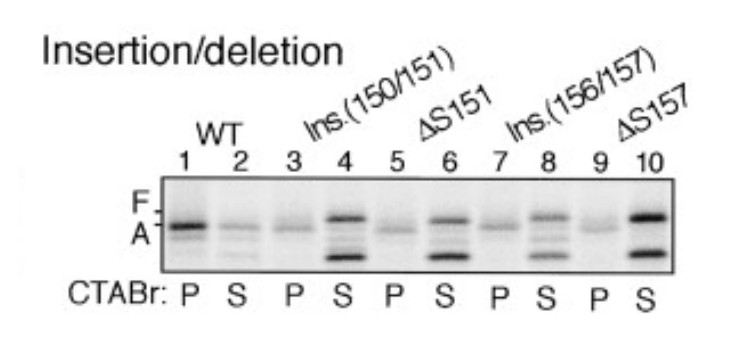
Insertion between F150 and S151 or deletion of S151 impairs stalling efficiency (adapted from Nakatogawa and Ito, 2002).
https://doi.org/10.7554/eLife.09684.038Videos
Video 1
Cryo-EM density map of SecM-Gly-RNC.
The cryo-EM density map of SecM-Gly-RNC is shown in transparent surface representation. The 50S subunit, 30S subunit, SecM-Gly-tRNA, and mRNA are colored pale blue, yellow, red, and orange, respectively. In the final movie frames, the map is shown in a cut-away view and zoomed into the region of the peptide exit tunnel, highlighting the densities for the nascent chain.
Video 2
Cryo-EM density map of SecM-Pro-RNC.
The cryo-EM density map of SecM-Pro-RNC is shown in transparent surface representation. The 50S subunit, 30S subunit, SecM-Pro-tRNA (A/P*), P/E-tRNA, and mRNA are colored pale blue, yellow, green, bright yellow, and orange, respectively. In the final movie frames, the map is shown in a cut-away view and zoomed into the region of the peptide exit tunnel, highlighting the densities for the nascent chain.
Video 3
Atomic models of the nascent peptides in SecM-Gly-RNC and SecM-Pro-RNC.
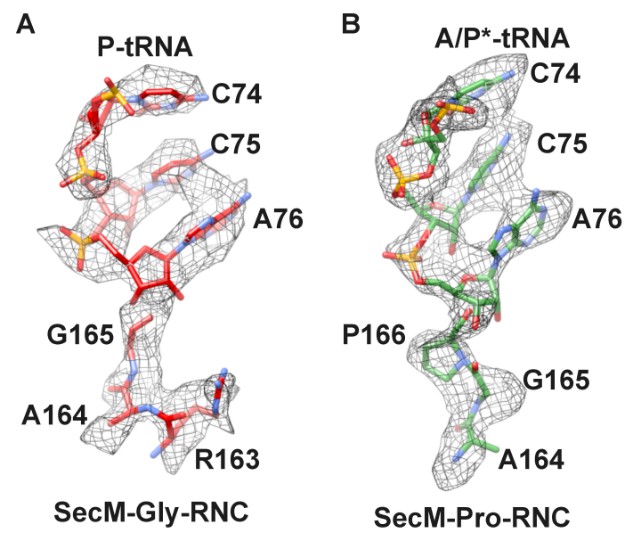
Segmented density maps of the peptidyl-tRNAs in SecM-Gly-RNC (red) and in SecM-Pro-RNC (green) are shown in surface representation, with C-terminal half of SecM peptide highlighted in zoom-in views. Atomic models of the nascent peptides are superimposed with the density maps, with a few landmark residues of SecM labeled.
Video 4
Comparison of the PTC in SecM-Gly-RNC with that of the induced state.
Superimposition of the atomic model of SecM-Gly-RNC with that of the induced state (1VQN) (Schmeing et al., 2005b) in the PTC region. Morphing between two models was shown. Critical residues of SecM and the 23S rRNA are labeled. Also see Figure 7 and text for details.
Video 5
Comparison of the PTC in SecM-Pro-RNC with that of the induced state.
Superimposition of the atomic model of SecM-Pro-RNC with that of the induced state (1VQN) (Schmeing et al., 2005b) in the PTC region. Morphing between two models was shown. Critical residues of SecM and the 23S rRNA are labeled. As shown, a deformation of the CCA-end of the peptidyl-tRNA disrupts canonical P-loop interaction. Also see Figure 7 and text for details.
Tables
Author response table 1
Model1 | Model2 | Reference Residues | RMS(Å) | Figure |
|---|---|---|---|---|
SecM-Gly-RNC | 4V6F | PyMOL align with residues 1600-2700(23S rRNA) | 1.902 | Figure1-supplemental_figure6, Figure6-supplemental_figure1 |
SecM-Gly-RNC | 4V6F | PyMOL align with residues 10-550(16S rRNA) | 1.537 | Figure1-supplemental_figure6 |
SecM-Pro-RNC | 4V6F | PyMOL align with residues 1600-2900(23S rRNA) | 1.588 | Figure1-supplemental_figure6, Figure6-supplemental_figure2 |
SecM-Pro-RNC | 4V6F | PyMOL align with residues 10-550(16S rRNA) | 1.330 | Figure1-supplemental_figure6 |
SecM-Pro-RNC | 4V6F | PyMOL align with residues 920-1400(16S rRNA) | 1.198 | Figure1-supplemental_figure6 |
4V9D | SecM-Pro-RNC | PyMOL align with residues 10-550(16S rRNA) | 1.193 | Figure1-supplemental_figure6 |
4W29 | SecM-Pro-RNC | PyMOL align with residues 10-550(16S rRNA) | 1.425 | Figure1-supplemental_figure6 |
4V7C | SecM-Pro-RNC | PyMOL align with residues 920-1400(16S rRNA) | 1.196 | Figure1-supplemental_figure6 |
4V7D | SecM-Pro-RNC | PyMOL align with residues 920-1400(16S rRNA) | 1.066 | Figure1-supplemental_figure6 |
SecM-Gly-RNC | 4V7T | PyMOL align with residues 1600-2700(23S rRNA) | 1.535 | Figure1-supplemental_figure7 |
SecM-Pro-RNC | 4V7T | PyMOL align with residues 1600-2700(23S rRNA) | 1.112 | Figure1-supplemental_figure7 |
1VQ6 | 1VQN | PyMOL align with residues 2400-2800(23S rRNA) | 0.308 | Figure4, Figure4-supplemental_figure1, Figure5-supplemental_figure1 |
SecM-Gly-RNC | 1VQN | PyMOL align with residues 2400-2800(23S rRNA) | 1.527 | Figure4, Figure4-supplemental_figure1 |
4V5J | SecM-Gly-RNC | PyMOL align with residues 2400-2800(23S rRNA) | 1.007 | Figure4 |
4V7T | 1VQN | PyMOL align with residues 2400-2800(23S rRNA) | 1.054 | Figure4-supplemental_figure1 |
SecM-Pro-RNC | 1VQN | PyMOL align with residues 2400-2800(23S rRNA) | 1.405 | Figure5, Figure4-supplemental_figure1, Figure5-supplemental_figure1 |
5796(EMDB) | SecM-Gly-RNC | Chimera fit with 50S subunit | 0.9494 (correlation) | Figure6 |
5036(EMDB) | SecM-Gly-RNC | Chimera fit with 50S subunit | 0.9634 (correlation) | Figure6 |
4V9D | SecM-Gly-RNC | PyMOL align with residues 1600-2700(23S rRNA) | 1.697 | Figure6 |
4V69 | SecM-Gly-RNC | PyMOL align with 23S rRNA | 1.344 | Figure6 |
4V51 | SecM-Gly-RNC | PyMOL align with residues 1600-2900(23S rRNA) | 1.616 | Figure6-supplemental_figure1 |
4V5F | SecM-Gly-RNC | PyMOL align with residues 1600-2900(23S rRNA) | 1.624 | Figure6-supplemental_figure1 |
4V5L | SecM-Gly-RNC | PyMOL align with residues 1600-2900(23S rRNA) | 1.758 | Figure6-supplemental_figure1 |
SecM-Gly-RNC | SecM-Pro-RNC | PyMOL align with 23S rRNA | 0.996 | Figure6-supplemental_figure2 |
1VY5 | SecM-Pro-RNC | PyMOL align with residues 1600-2900(23S rRNA) | 1.487 | Figure6-supplemental_figure2 |
4V9D | SecM-Pro-RNC | PyMOL align with 23S rRNA | 1.386 | Figure6-supplemental_figure2 |
Additional files
-
Supplementary file 1
Statistics of data processing and model refinement.
- https://doi.org/10.7554/eLife.09684.030
Download links
A two-part list of links to download the article, or parts of the article, in various formats.
Downloads (link to download the article as PDF)
Open citations (links to open the citations from this article in various online reference manager services)
Cite this article (links to download the citations from this article in formats compatible with various reference manager tools)
Mechanisms of ribosome stalling by SecM at multiple elongation steps
eLife 4:e09684.
https://doi.org/10.7554/eLife.09684


