Retroactive modulation of spike timing-dependent plasticity by dopamine
- University of Cambridge, United Kingdom
Figures
Figure 1
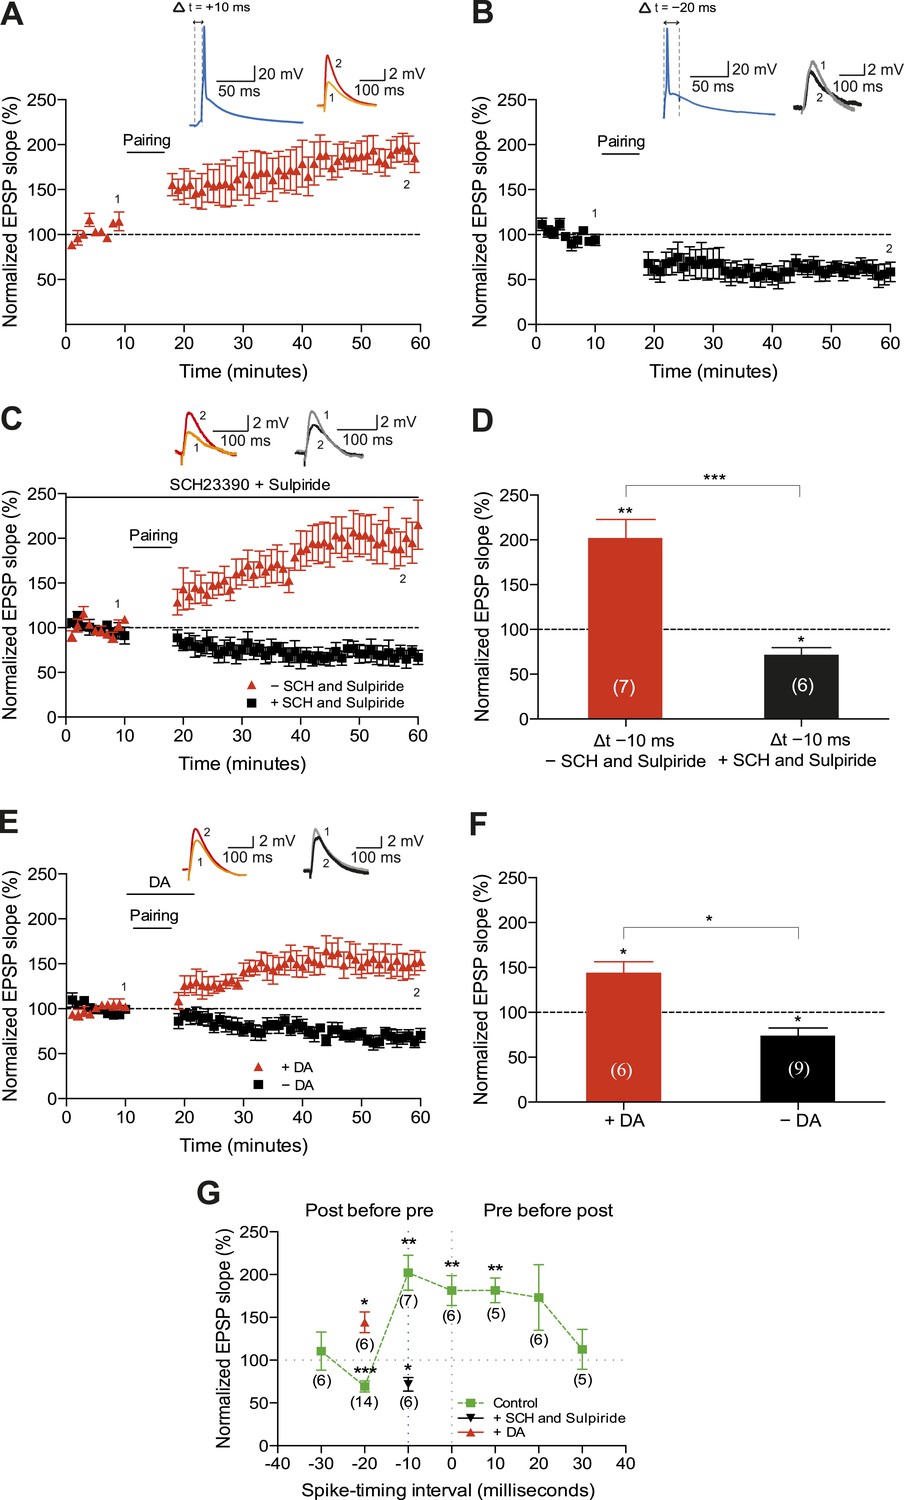
Dopamine widens the time window for induction of t-LTP.
Example plots of normalized EPSP slopes demonstrating that (A) pre-before-post pairing protocol with Δt = +10 ms induced t-LTP, whereas (B) post-before-pre pairing protocol with Δt = −20 ms induced t-LTD. Insets, pairing protocols. Traces show an excitatory postsynaptic potential (EPSP) before (1) and 40 min after (2) pairing. (C) Endogenous DA widens the spike time window for induction of t-LTP. In the absence of DA receptor antagonists, the post-before-pre pairing protocol with Δt = −10 ms induced t-LTP (red), whereas application of SCH23390 and sulpiride at the start of the recordings prevented this t-LTP and enabled t-LTD instead (black). Traces are presented as in A. (D) Summary of results. (E) Exogenous DA widens the spike time window for induction of t-LTP. In the presence of 20 μM DA, the post-before-pre pairing protocol with Δt = −20 ms induced t-LTP (red), whereas in control condition the same pairing protocol induced t-LTD (black). Traces are presented as in A. (F) Summary of results. (G) Summary of the spike timing-dependent plasticity (STDP) induction with various spike-timing intervals (Δt in ms) in control condition (green; data point at −20 ms represents data combined from B and E), in the presence of DA receptor antagonists (SCH23390 and sulpiride; black), or DA (red). Each data point is the group average EPSP slope percentage change from baseline. Error bars represent s.e.m. Significant difference (*p < 0.05, **p < 0.01, ***p < 0.001) compared with the baseline (one-sample two-tailed Student's t-test) or between the indicated two groups (paired two-tailed Student's t-test). The numbers of cells are shown in parentheses.
-
Figure 1—source data 1
Source data for Figure 1.
- https://doi.org/10.7554/eLife.09685.004
Figure 2
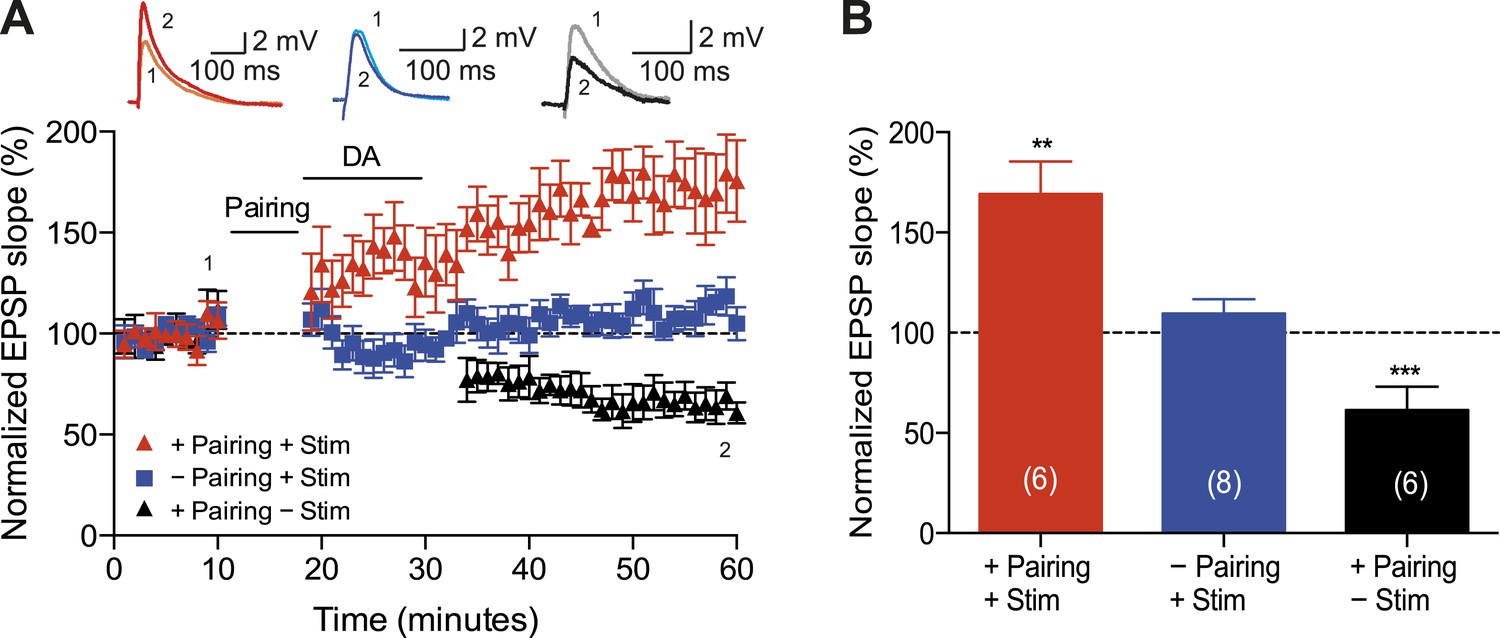
Dopamine retroactively converts t-LTD into t-LTP.
(A) DA applied immediately after the pairing protocol with Δt = −20 ms converted t-LTD into t-LTP (+Pairing +Stim; red). If the pathway was not stimulated following the pairing protocol until after DA washout, t-LTD was induced (+Pairing −Stim; black). In the absence of the pairing protocol, DA had no effect on baseline EPSPs (−Pairing +Stim; blue). Traces show an EPSP before (1) and 40 min after (2) pairing. (B) Summary of results. Error bars represent s.e.m. Significant difference (**p < 0.01, ***p < 0.001) compared with the baseline (one-sample two-tailed Student's t-test). The number of cells is shown in parentheses.
-
Figure 2—source data 1
Source data for Figure 2.
- https://doi.org/10.7554/eLife.09685.006
Figure 3

Time dependence of the DA-induced conversion of t-LTD into t-LTP.
(A) DA applied immediately after the pairing protocol with Δt = −20 ms converted t-LTD into t-LTP, whereas delayed application of DA failed to convert t-LTD into t-LTP and either (B) resulted in a reversal of t-LTD back to baseline (10 min after pairing) or (C) failed to affect t-LTD altogether (30 min after pairing). Traces show an EPSP before (1) and 40 min (A, B) or 60 min (C) after pairing (2). (D) Summary of results. Error bars represent s.e.m. Significant difference (*p < 0.05, **p < 0.01) compared with the baseline (one-sample two-tailed Student's t-test). The number of cells is shown in parentheses.
-
Figure 3—source data 1
Source data for Figure 3.
- https://doi.org/10.7554/eLife.09685.008
Figure 4 with 2 supplements
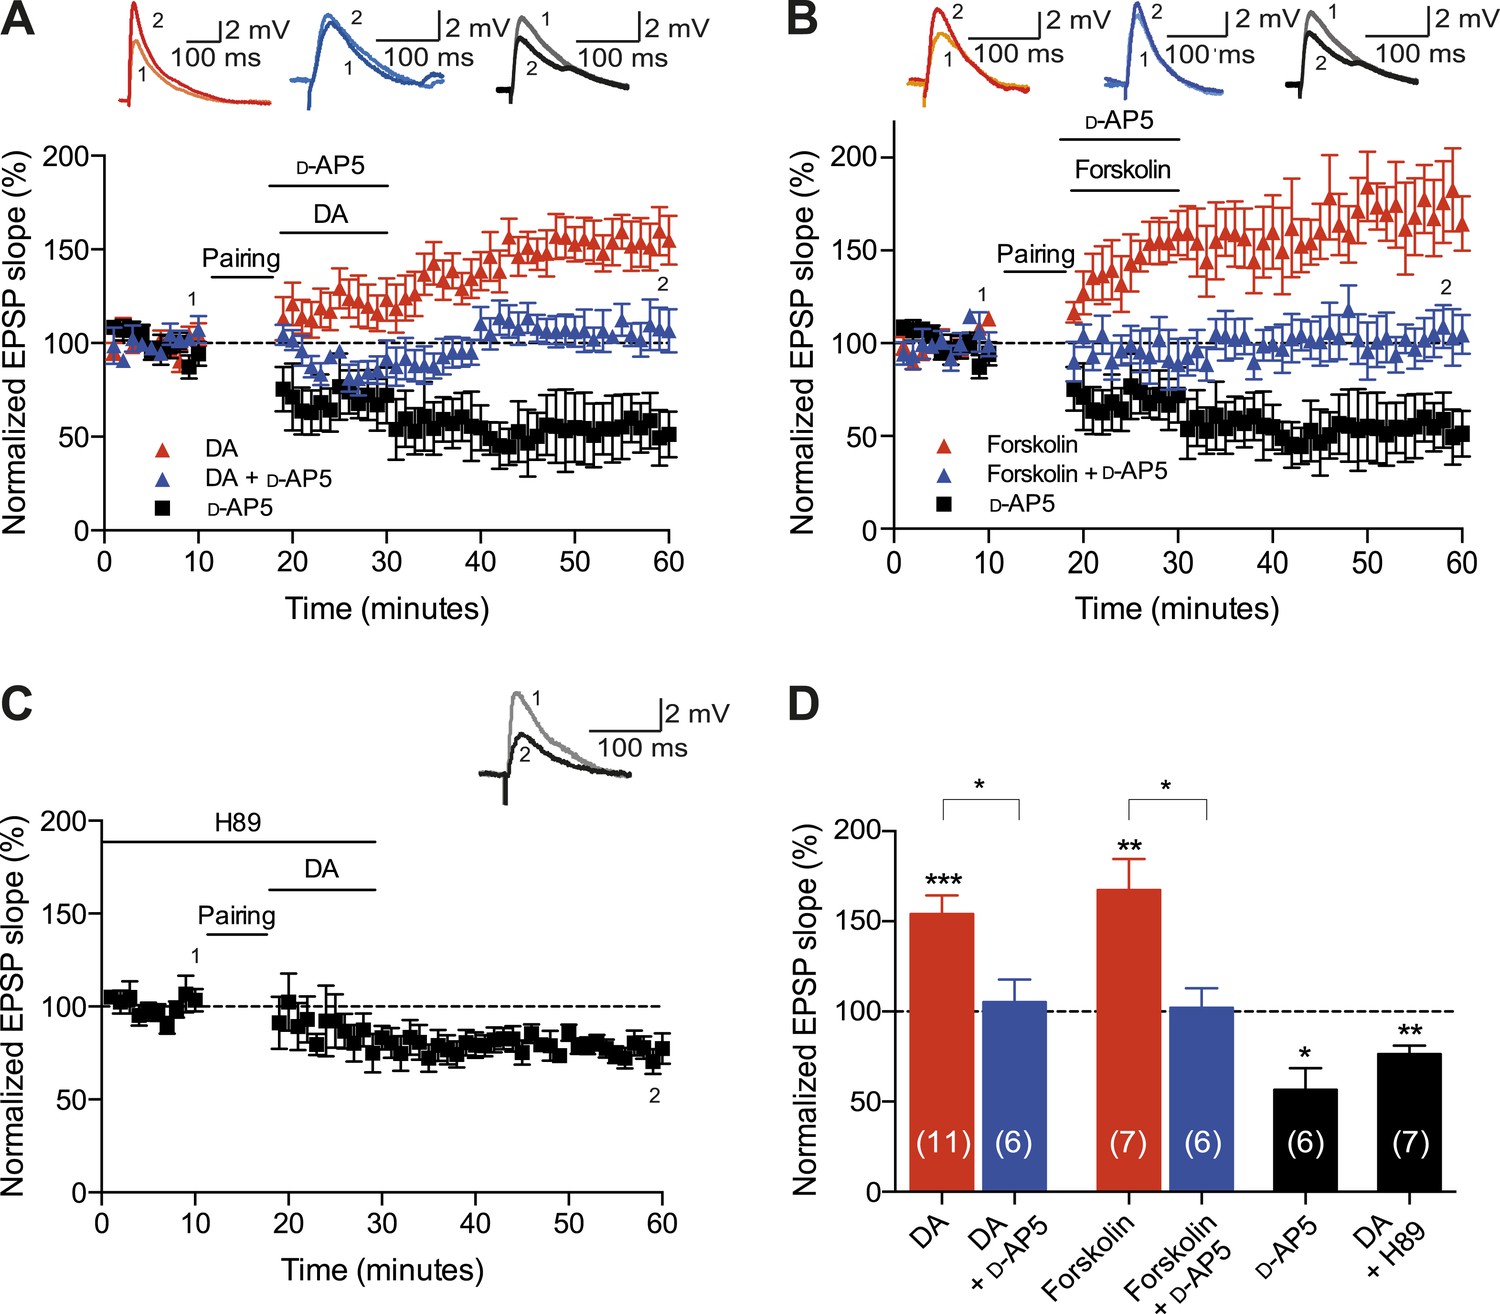
Cellular mechanisms involved in the DA-induced conversion of t-LTD into t-LTP.
(A) DA applied immediately after the pairing protocol (Δt = −20 ms) converted t-LTD into t-LTP (red; data combined from Figures 2A, 3A). This effect requires NMDA receptors as application of d-AP5 1 min before the DA application partially blocked the conversion of t-LTD into t-LTP (blue), whereas application of d-AP5 alone failed to influence the development of t-LTD (black). Traces show an EPSP before (1) and 40 min after pairing (2). (B) The DA-induced conversion of t-LTD into t-LTP involves the activation of cAMP/PKA signaling cascade, which closely mimics the effect of DA. Forskolin, an AC activator, applied immediately after the pairing protocol (Δt = −20 ms) converted t-LTD into t-LTP (red). This effect requires NMDA receptors as application of d-AP5 1 min before forskolin application partially blocked the forskolin-induced conversion of t-LTD into t-LTP (blue), whereas application of d-AP5 alone failed to influence the development of t-LTD (black; data same as in A). (C) Downstream of cAMP, PKA is involved in the conversion of t-LTD into t-LTP as application of the PKA inhibitor, H-89, completely prevented the conversion of t-LTD into t-LTP. Traces are presented as in A. (D) Summary of results. Error bars represent s.e.m. Significant difference (*p < 0.05, **p < 0.01, ***p < 0.001) compared with the baseline (one-sample two-tailed Student's t-test) or between the indicated two groups (paired two-tailed Student's t-test). The number of cells is shown in parentheses.
-
Figure 4—source data 1
Source data for Figure 4.
- https://doi.org/10.7554/eLife.09685.010
-
Figure 4—source data 2
Source data for Figure 4—figure supplement 1.
- https://doi.org/10.7554/eLife.09685.011
-
Figure 4—source data 3
Source data for Figure 4—figure supplement 2.
- https://doi.org/10.7554/eLife.09685.012
Figure 4—figure supplement 1
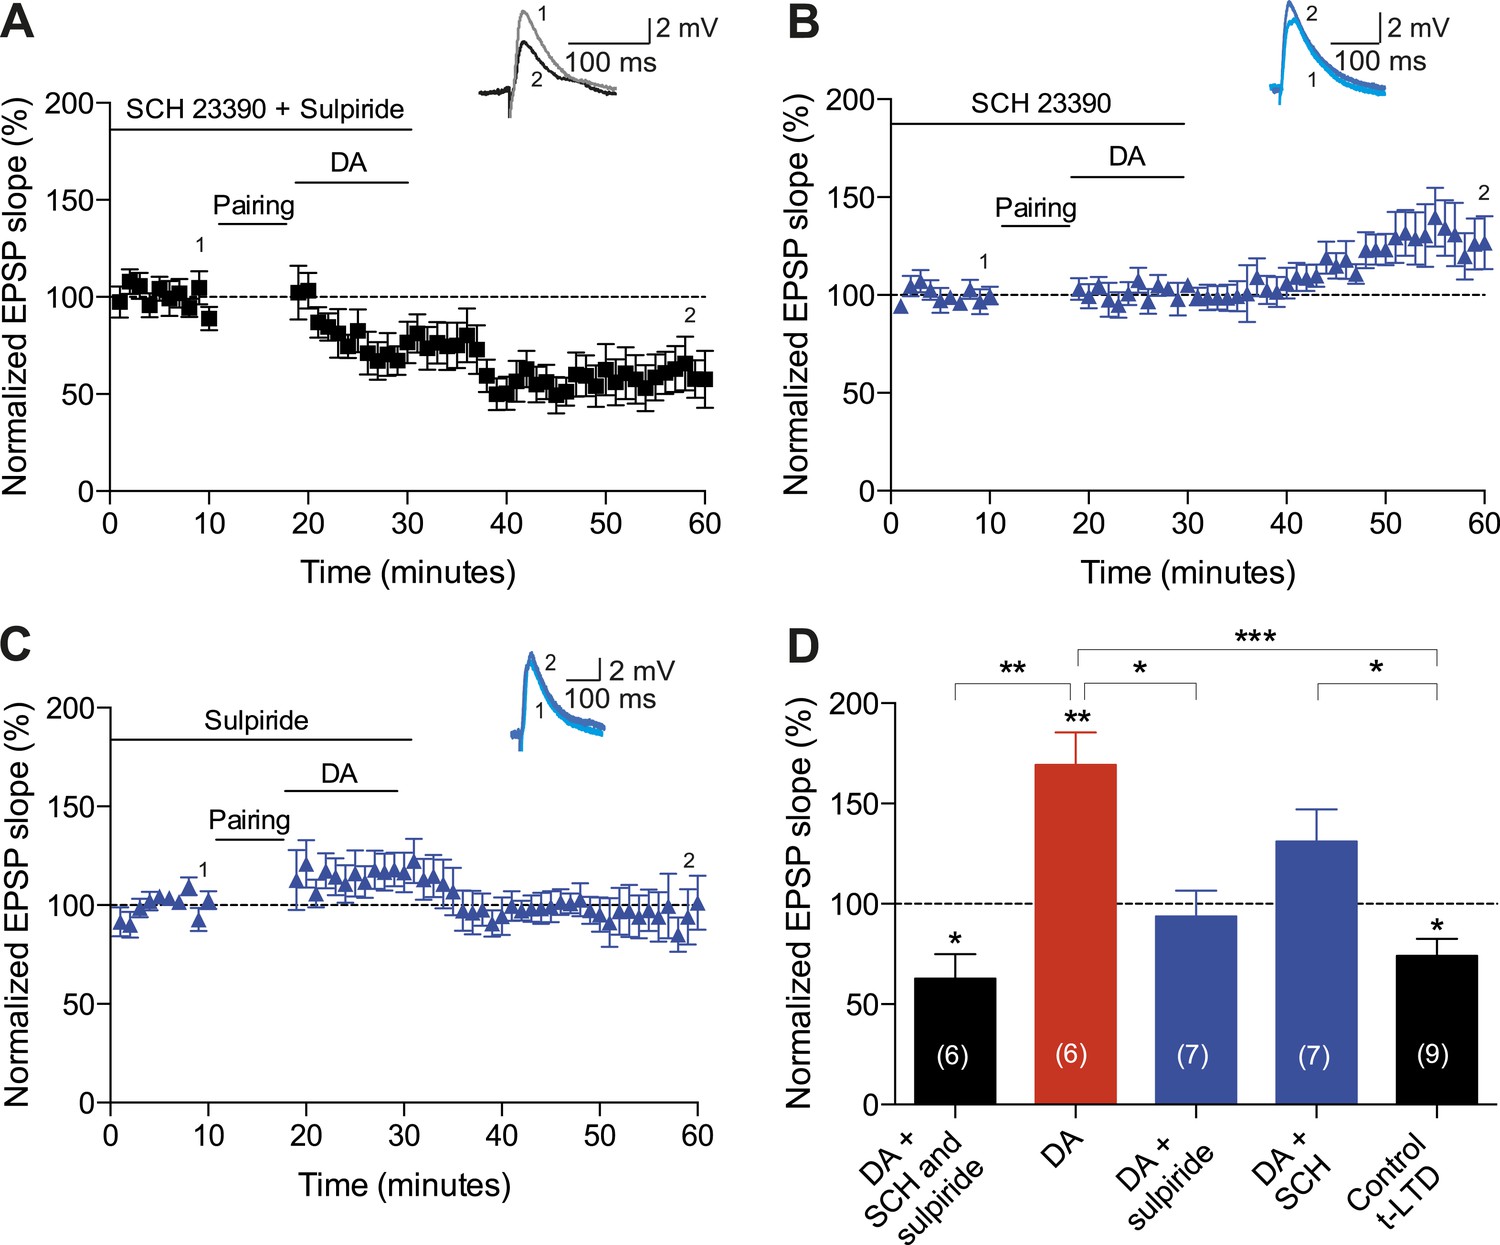
The retroactive conversion of t-LTP into t-LTD is due to specific DA receptor activation.
Plot of normalized EPSP slopes demonstrating that (A) application of 10 μM SCH23390 and 50 μM sulpiride prevented DA-induced conversion of t-LTD into t-LTP, which resulted in significant t-LTD, whereas (B) neither SCH23390 nor (C) sulpiride alone was able to completely block the DA effect. Traces show an EPSP before (1) and 40 min after (2) pairing. (D) Summary of results. Error bars represent s.e.m. Significant difference (*p < 0.05, **p < 0.01, ***p < 0.001) compared with the baseline (one-sample two-tailed Student's t-test) or between the indicated two groups (paired two-tailed Student's t-test). The number of cells is shown in parentheses.
Figure 4—figure supplement 2
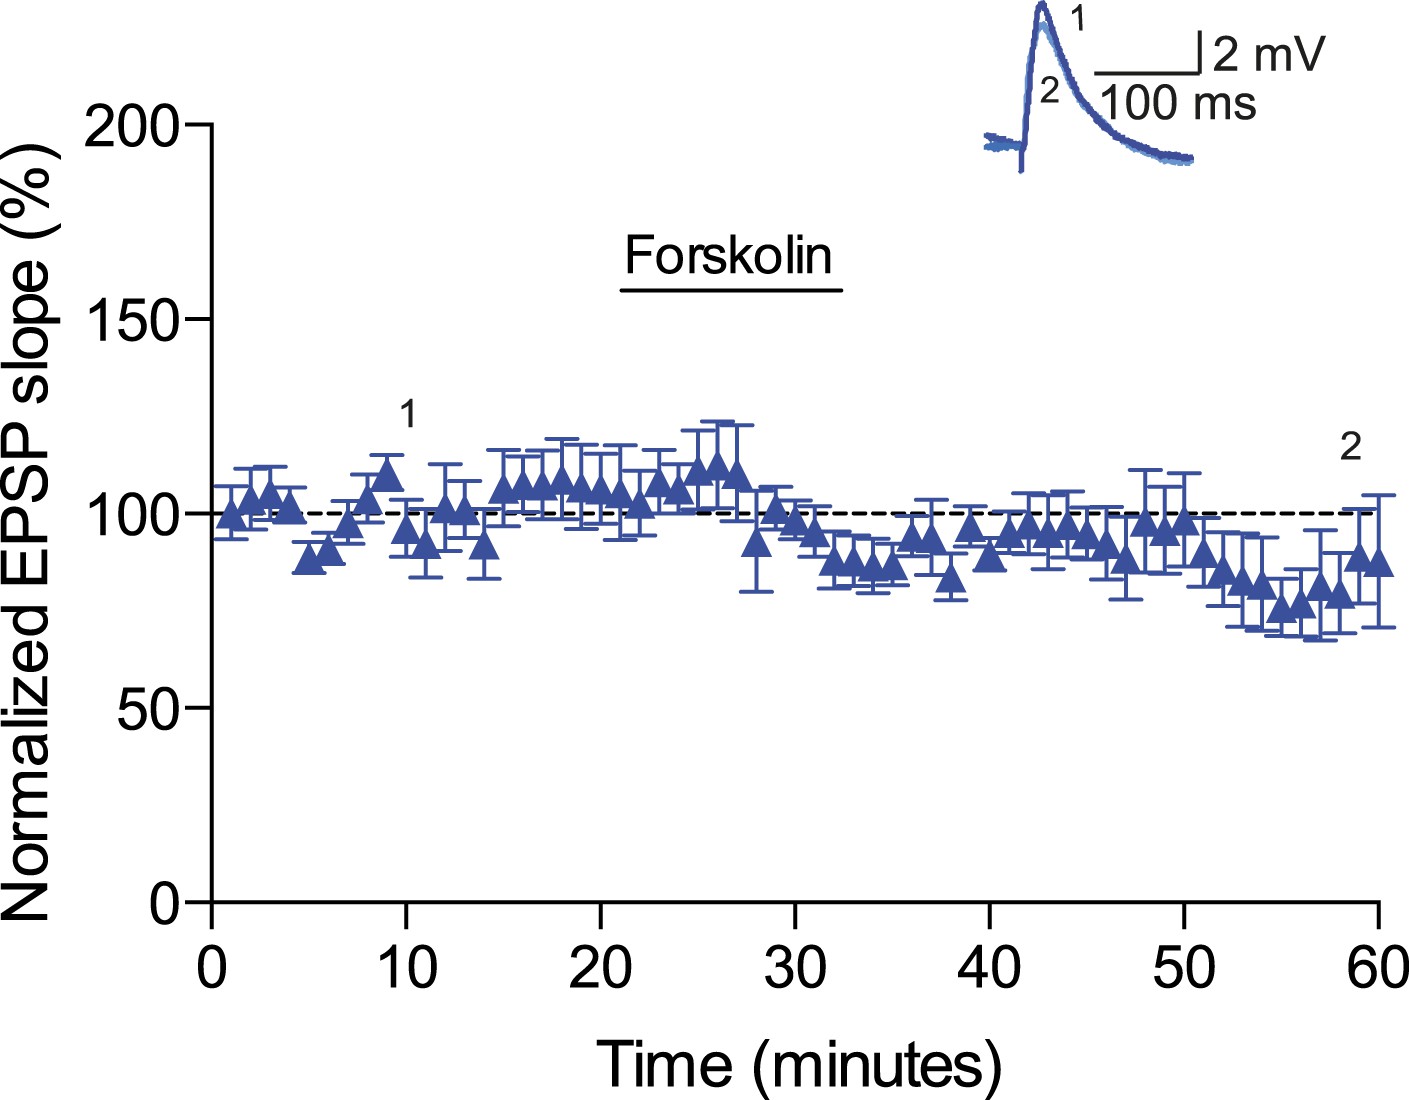
Forskolin had no effect on baseline EPSPs.
Plot of normalized EPSP slopes showing that in the absence of a pairing protocol, application of 50 μM forskolin does not result in significant synaptic modification (n = 7). Traces show an EPSP at 10 min (1) and 58 min (2) of a recording. Error bars represent s.e.m.
Figure 5
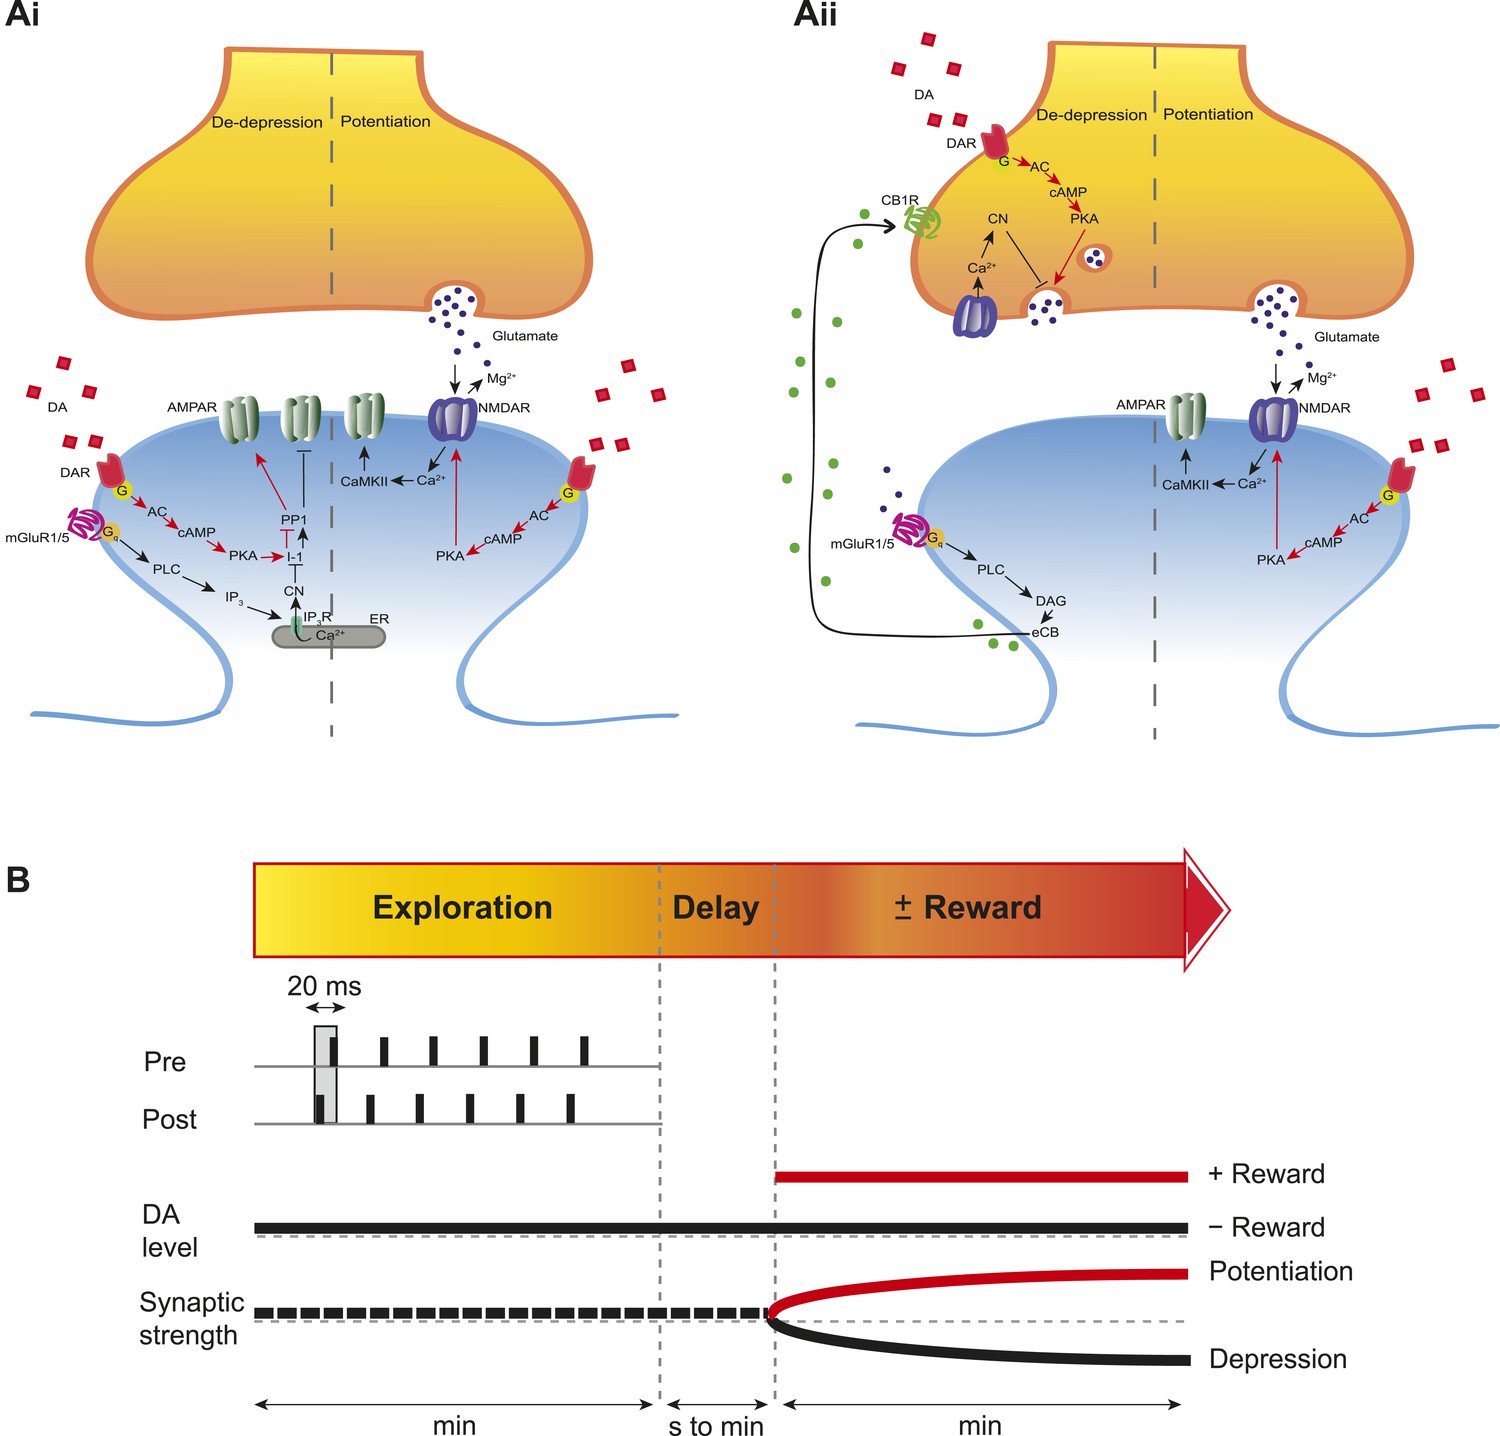
Proposed mechanisms underlying the DA-induced conversion of t-LTD into t-LTP.
(A) Schematic diagram depicting core components of the proposed cellular mechanisms underlying the DA-induced conversion of t-LTD into t-LTP (de-depression and potentiation). (Ai) Model based on postsynaptic NMDAR-dependent potentiation (Bi and Poo, 1998; Caporale and Dan, 2008; Zhang et al., 2009; Edelmann and Lessmann, 2011; Yang and Dani, 2014) and metabotropic glutamate receptor-dependent (mGluRs) depression (Otani and Connor, 1998; Kemp and Bashir, 1999; Huber et al., 2000). De-depression (red, left): Activation of G protein-coupled D1/D5 receptors stimulates AC, increasing cAMP and activating PKA (Greengard et al., 1999; Neve et al., 2004), which, via phosphorylation of I-1 (Ingebritsen and Cohen, 1983), reverses the PP1-induced dephosphorylation of synaptic AMPARs (Lee et al., 2000; Mockett et al., 2007). Potentiation (red, right): PKA activation enhances NMDAR function (Westphal et al., 1999; Chen and Roche, 2007). (Aii) Model based on presynaptic depression (Bolshakov and Siegelbaum, 1994; Siegel et al., 1994; Oliet et al., 1997; Charton et al., 1999; Watabe et al., 2002; Jourdain et al., 2007). De-depression (red, left): Activation of presynaptic DA receptors stimulates AC, increasing cAMP and activating PKA (Greengard et al., 1999; Neve et al., 2004), which reverses the calcineurin-dependent presynaptic depression. Potentiation (red, right): as in Ai. Arrow indicates activation/phosphorylation, blunt-ended line indicates inhibition/dephosphorylation. Abbreviations: AMPAR, AMPA-type glutamate receptor; NMDAR, NMDA-type glutamate receptor; mGluR1/5, group I metabotropic glutamate receptor; DAR, dopamine receptor; AC, adenylate cyclase; cAMP, cyclic adenosine monophosphate; PKA, protein kinase A; I-1, inhibitor 1; PP1, protein phosphatase 1; PLC, phospholipase C; IP3, inositol 1,4,5-trisphosphate; ER, endoplasmic reticulum; DAG, diacylglycerol; eCB, endocannabinoid; CB1R, cannabinoid receptor type 1; CN, calcineurin; CaMKII, calcium-calmodulin-dependent protein kinase II. (B) Schematic diagram of synaptic and behavioral timescales in reward learning. During Exploration, the activity-dependent modification of synaptic strength due to spike timing-dependent plasticity (STDP) depends on the coordinated spiking between presynaptic and postsynaptic neurons on a millisecond time scale. Post-before-pre pairing leads to synaptic depression that develops gradually on a scale of minutes. When Reward, signaled via dopamine, follows Exploration with a Delay of seconds to minutes, synaptic depression is converted into potentiation.
Author response image 1
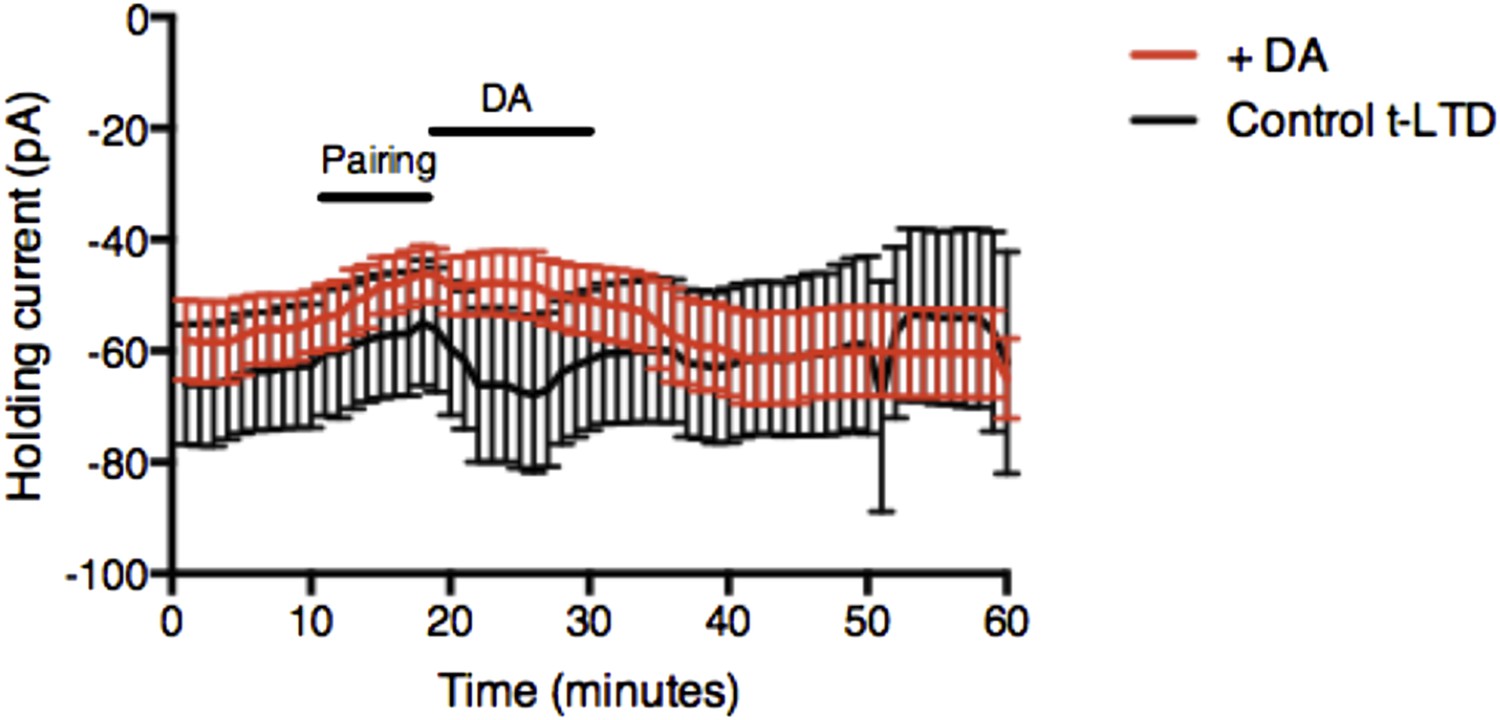
Example plot showing changes in the holding current over time for post-before-pre pairing protocol with Δt = −20 ms in control t-LTD (n = 9) and with DA added after pairing (n = 11). Error bars represent s.e.m.
Download links
A two-part list of links to download the article, or parts of the article, in various formats.
Downloads (link to download the article as PDF)
Open citations (links to open the citations from this article in various online reference manager services)
Cite this article (links to download the citations from this article in formats compatible with various reference manager tools)
Retroactive modulation of spike timing-dependent plasticity by dopamine
eLife 4:e09685.
https://doi.org/10.7554/eLife.09685


