APP and APLP2 interact with the synaptic release machinery and facilitate transmitter release at hippocampal synapses
- Albert Einstein College of Medicine, United States
- MS Bioworks, LLC, United States
Figures
Figure 1
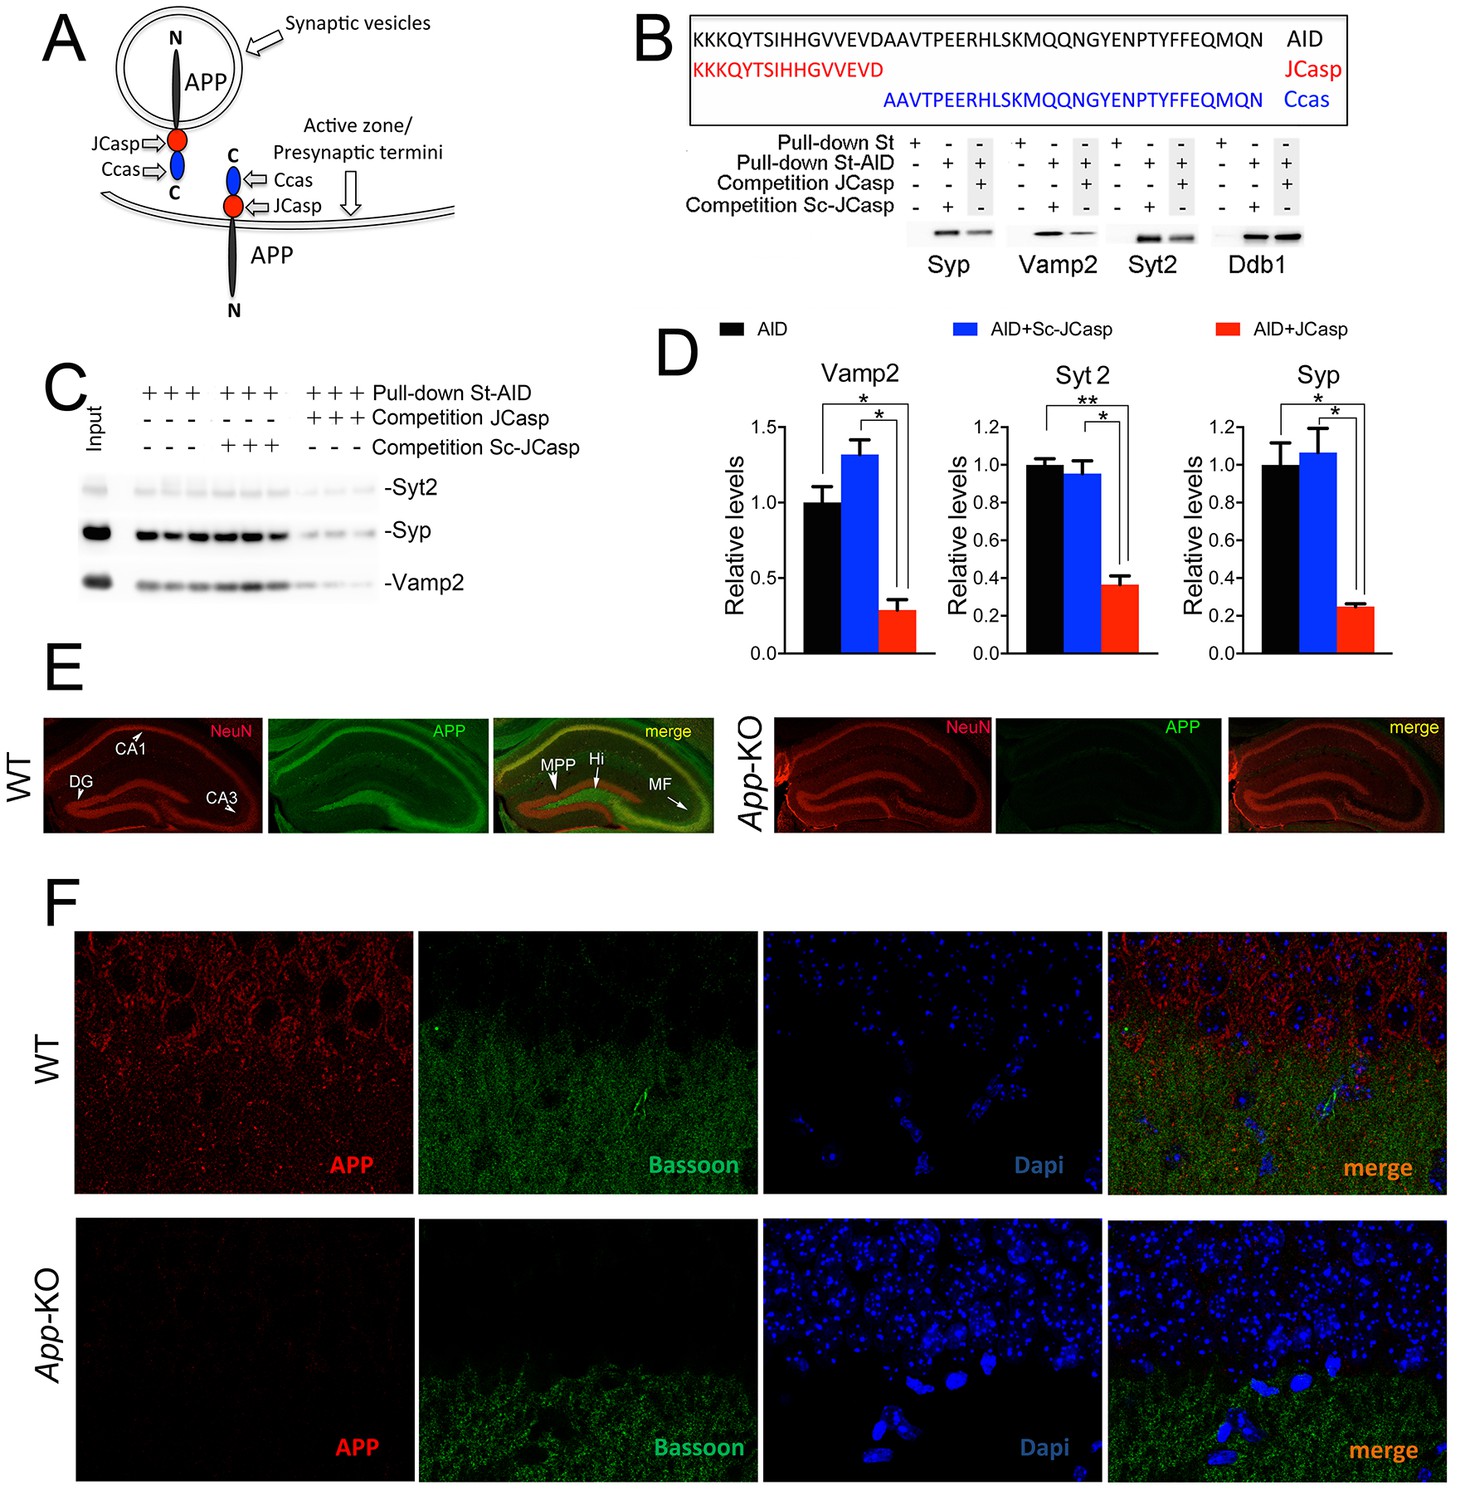
The AID–presynaptic interactome binds to JCasp.
(A) The APP intracellular domain, composed by the two sub-regions JCasp and Ccas, is always cytosolic whether APP molecules are localized at synaptic vesicles or the active zone. (B) Sequences of AID, JCasp, and Ccas used as baits in the proteomic experiments. (C) Brain lysates were incubated for 30 min with 10 μM of either JCasp or ScJCasp. After incubation, the lysates were affinity purified on StrepTactin columns bound to the indicated St-peptides. Bound proteins were analyzed by Western blot. JCasp reduces binding of Syp, Vamp2, and Syt2, but not Ddb1, to St-AID. (D) Triplicate experiment showing that JCasp, but not ScJCasp, significantly reduces binding of Syp, Vamp2, and Syt2 to St-AID. (E) Quantification of the data shown in (D). (F) Hippocampal slices from 8-week-old WT or App-KO mice were stained with an αNeuN (red, left panels) and an αAPP (green middle panel) antibody. The images were merged in the right panels. APP is widely distributed in the hippocampus. The strongest staining is seen in the Hi, MF, CA3, and CA1. The staining for APP is specific since there is no signal in App-KO hippocampi. (G) Staining for APP (red, left panels) and Bassoon (green middle panel) show that APP is expressed in the Stratum radiatum where it partially co-localizes with Bassoon (arrows in the merged image, right panel). Again, the staining for APP and the co-localization spots are specific as shown by their absence in App-KO hippocampi. AID, APP intracellular domain; APP, amyloid precursor protein; WT, wild type.
Figure 2
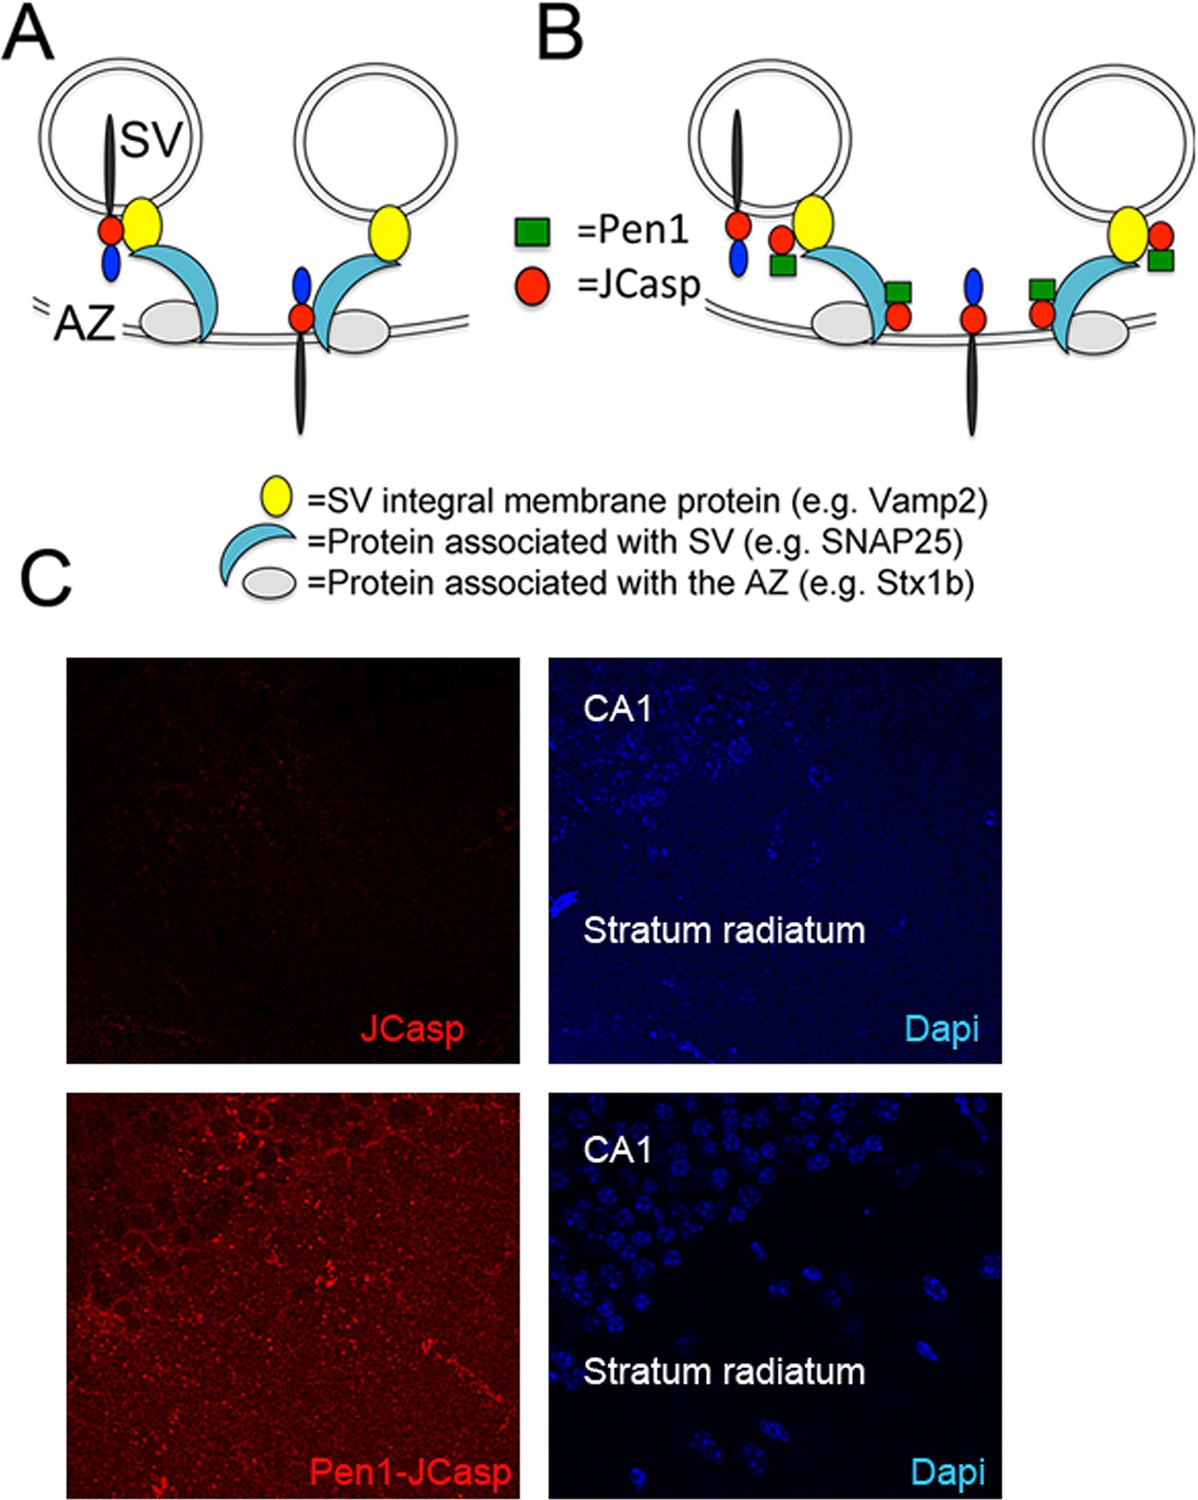
Pen1-JCasp is delivered intra-neuronally.
Models of assembly of the amyloid precursor protein (APP) presynaptic interactome and mechanism of action of Pen1-JCasp. (A) SV = synaptic vesicles; AZ = active zone. SV proteins and proteins associated to SV and to the AZ bind via direct and indirect interactions with the JCasp region of APP molecules localized to either SV or the AZ. The interactions depicted here are hypothetical. (B) Pen1-JCasp is delivered intracellularly and can interfere with the interaction of APP with presynaptic proteins. (C) Immune-fluorescence experiment showing that Pen1 delivers the JCasp peptide in hippocampal neurons.
Figure 3
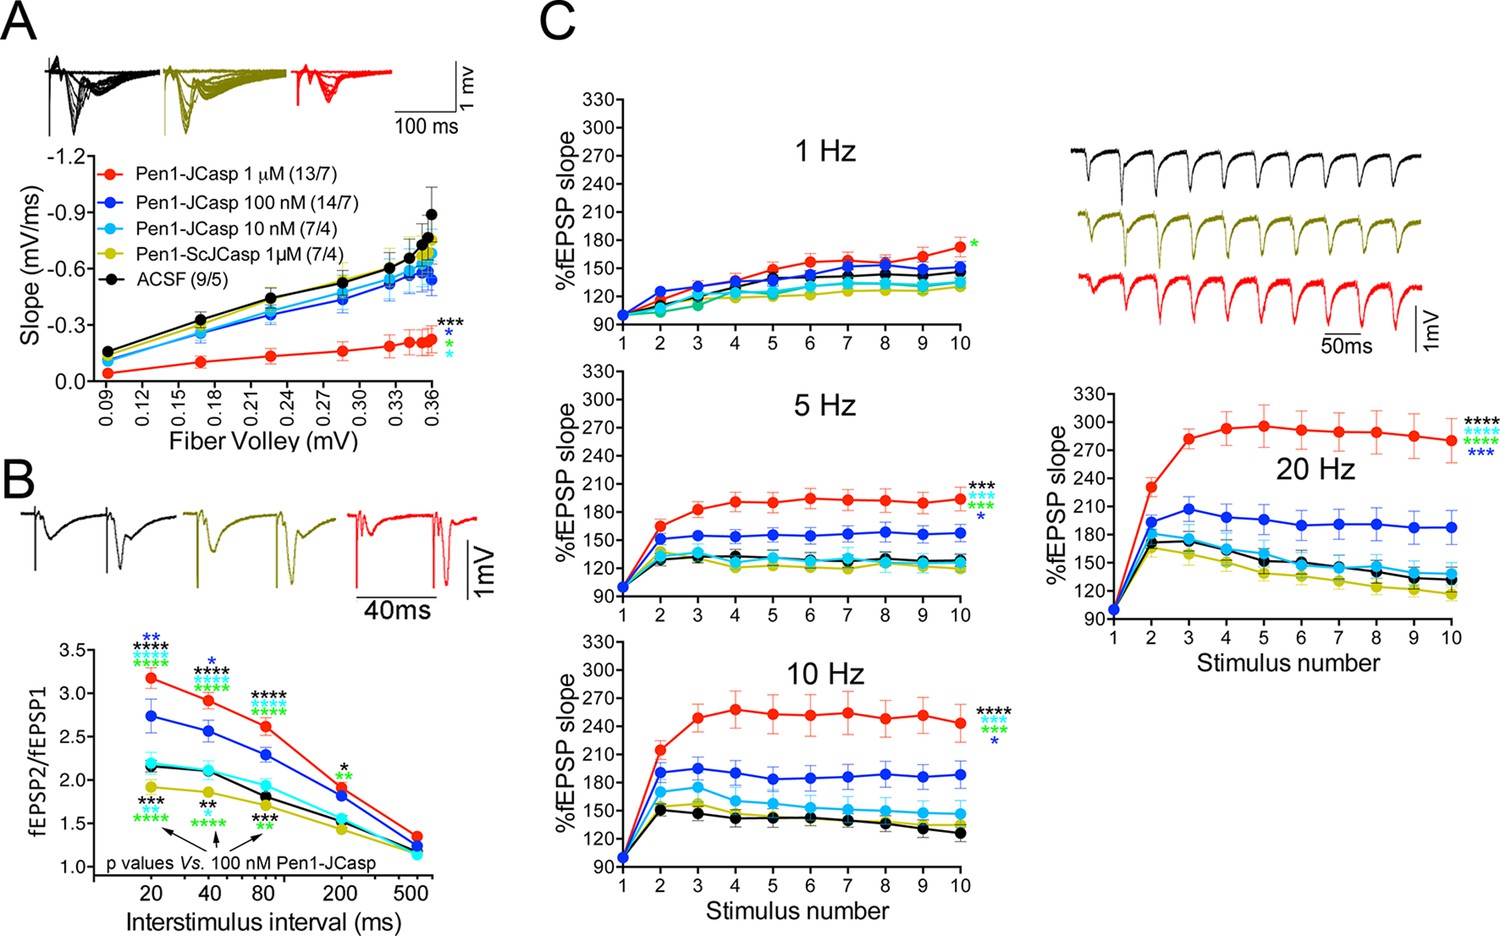
Pen1-JCasp impairs synaptic plasticity.
(A) CA1 recordings of hippocampal slices incubated with either artificial cerebrospinal fluid (ACSF), 1 μM Pen1-ScJCasp or Pen1-JCasp at the indicated concentrations. The synaptic input/output (I/O) relationship was obtained by plotting the fiber volley amplitude against the initial slope of the evoked field excitatory postsynaptic potential (fEPSP). Representative traces are shown on top. The slope values of I/O recording for each group were compared for statistical assessments. It has been found that 1 μM Pen1-JCasp significantly reduces synaptic transmission as compared to ACSF (*), Pen1-ScJCasp (*), 10 nM (*), and 100 nM Pen1-JCasp (*p). Representative traces are shown. (B) Average paired-pulse facilitation (PPF) (2nd fEPSP/1st fEPSP) plotted as a function of the inter-stimulus interval. Representative traces of fEPSPs evoked at 40 ms inter-stimulus interval are shown. Pen1-JCasp increases PPF. (C) Synaptic facilitation elicited by stimulus trains at 1, 5, 10, and 20 Hz. fEPSP slopes are normalized to the slope of the first fEPSP of the stimulus train. Representative traces of fEPSPs evoked at 20 Hz are shown. Stimulus artifacts are removed for clarity. Pen1-JCasp increases frequency facilitation (FF) in a frequency and dose-dependent manner. Statistical assessments were performed by: one-way analysis of variance (ANOVA) followed by Tukey’s multiple comparisons test for slopes of I/O curves; two-way repeated measures (RM) ANOVA followed by Tukey’s multiple comparisons test for PPF and FF (*p < 0.05; **p < 0.01; ***p < 0.001; ****p < 0.0001). In FF, 10 nM Pen1-JCasp increased facilitation in a statistically significant manner only at the 10th stimulation (indicated with (*) and (*)). The number of recordings and the number of mice analyzed for each group are shown in (C). All data represent means ± SEM. The complete statistical analyses are shown in the attached Excel file.
-
Figure 3—source data 1
Source data for statistical analysis of input/output curves in Figure 3A.
- https://doi.org/10.7554/eLife.09743.007
-
Figure 3—source data 2
Source data for statistical analysis of paired-pulse facilitation in Figure 3B.
- https://doi.org/10.7554/eLife.09743.008
-
Figure 3—source data 3
Source data for statistical analysis of frequency facilitation at 1 Hz in Figure 3C.
- https://doi.org/10.7554/eLife.09743.009
-
Figure 3—source data 4
Source data for statistical analysis of frequency facilitation at 5 Hz in Figure 3C.
- https://doi.org/10.7554/eLife.09743.010
-
Figure 3—source data 5
Source data for statistical analysis of frequency facilitation at 10 Hz in Figure 3C.
- https://doi.org/10.7554/eLife.09743.011
-
Figure 3—source data 6
Source data for statistical analysis of frequency facilitation at 20 Hz in Figure 3C.
- https://doi.org/10.7554/eLife.09743.012
Figure 4
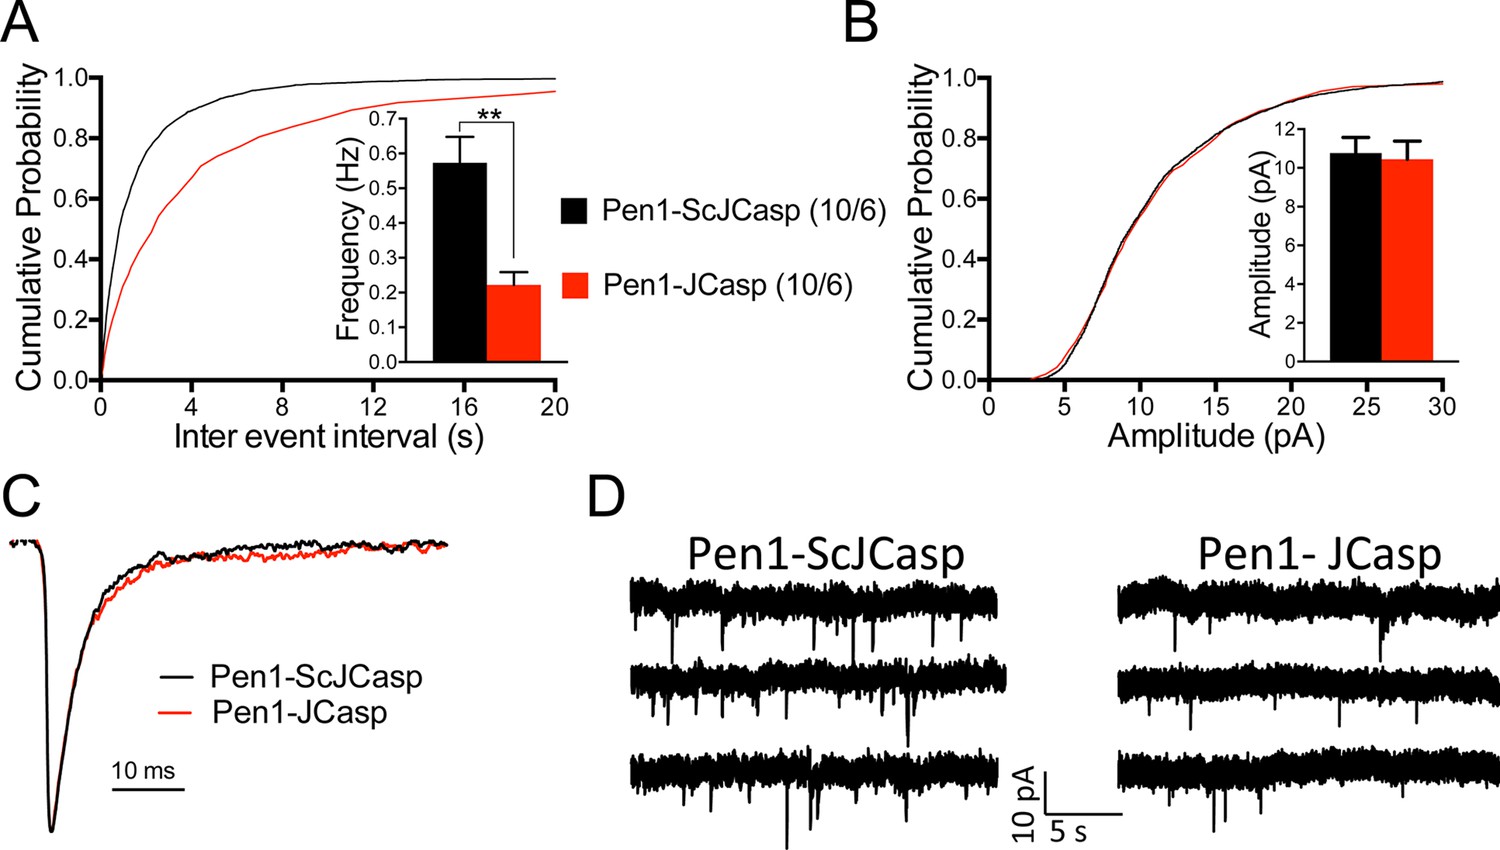
Pen1-JCasp reduces frequency of excitatory miniature currents.
(A) Cumulative probability of α-amino-3-hydroxy-5-methyl-4-isoxazolepropionic acid receptor (AMPAR) mediated miniature excitatory postsynaptic current (EPSC) (mEPSC) inter-event intervals. (B) Cumulative probability of AMPAR-mediated mEPSC amplitudes. Insets in cumulative probability graphs represent average mEPSC frequency (A) and amplitudes (B). mEPSC frequency was significantly reduced by Pen1-JCasp. (C) Average mEPSC of the two groups were not significantly different. (D) Representative recording traces of miniature EPSCs are shown. The number of recordings and the number of mice analyzed for each group are shown in (A). All data represent means ± SEM. Statistical assessments were performed by paired t test (**p < 0.01).
-
Figure 4—source data 1
Source data for statistical analysis of mEPSCs frequency in Figure 4A.
- https://doi.org/10.7554/eLife.09743.014
Figure 5
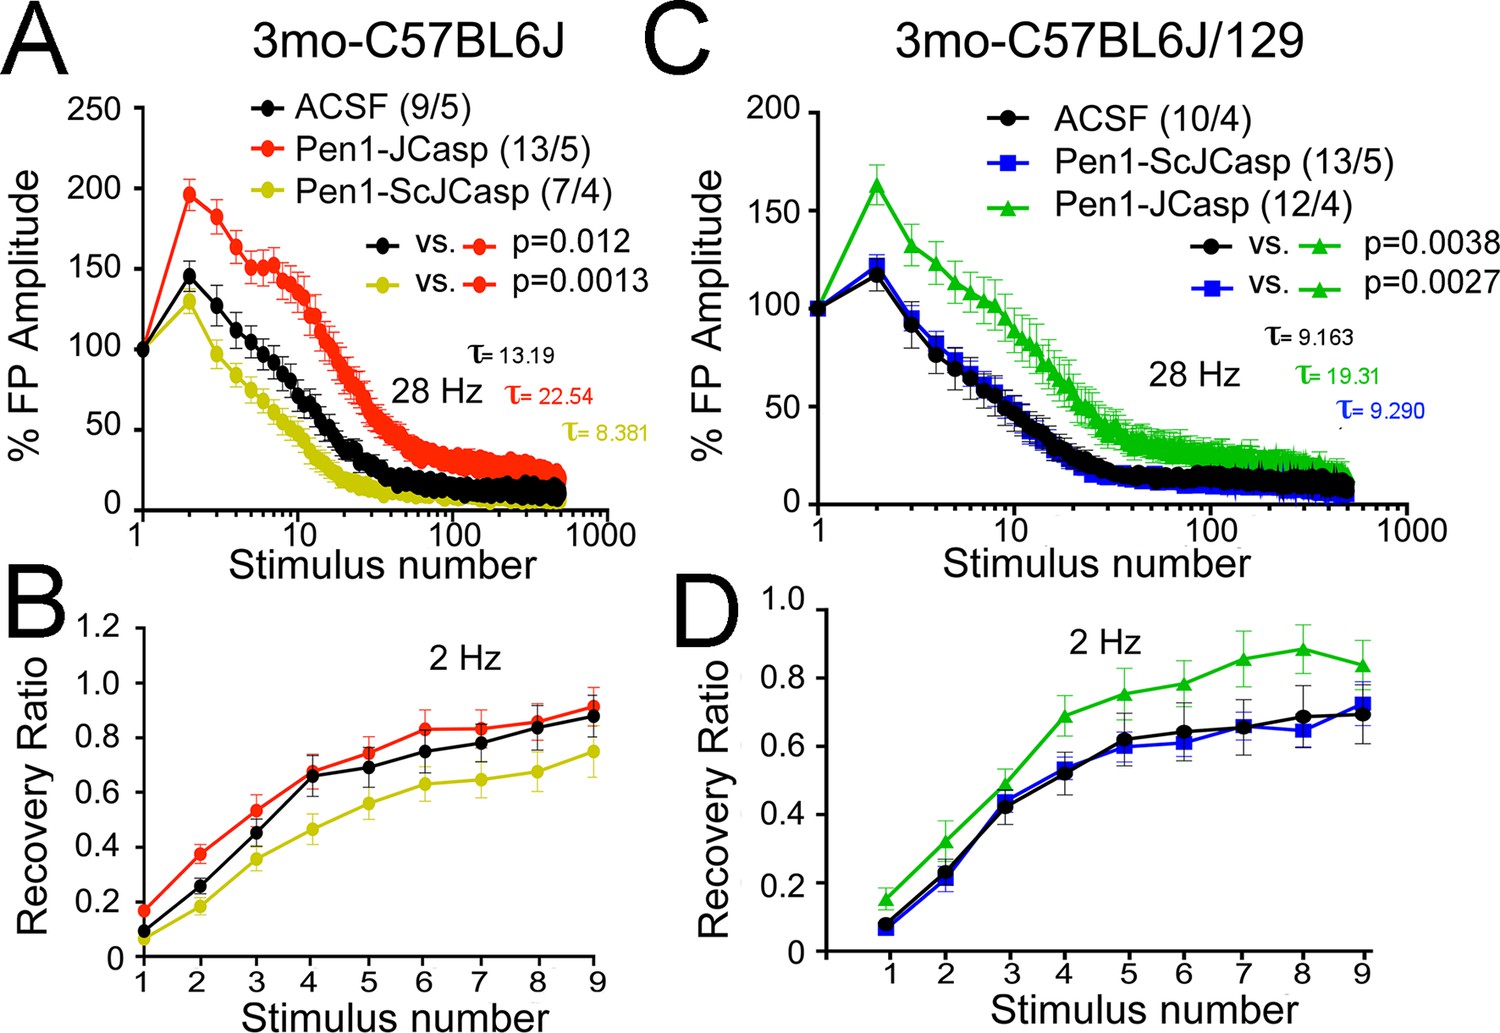
Pen1-JCasp reduces the rate of depletion of glutamatergic vesicles.
(A) Artificial cerebrospinal fluid (ACSF) vs Pen1-JCasp, p < 0.05; Pen1-SCJCasp vs. Pen1-JCasp, p < 0.01; (B) ACSF vs. Pen1-JCasp, p< 0.01; Pen1-SCJCasp vs. Pen1-JCasp, p < 0.01. Recovery kinetics (C and D) are not affected. The experiments were performed in 3-month-old C57Bl/6j (A and C) and C57Bl/6j-129 hybrid mice (B and D). All experiments shown in this paper were performed in C57Bl/6j mice, except for the experiments shown in Figure 7; App-KO and wild-type (WT) littermate animals were on a C57Bl/6j-129 hybrid genetic background. Data represent means ± SEM. Statistical assessments were performed by nonlinear regression curve fit, one phase decay.
-
Figure 5—source data 1
Source data for statistical analysis of decay rate shown in Figure 5A.
- https://doi.org/10.7554/eLife.09743.016
-
Figure 5—source data 2
Source data for statistical analysis of decay rate shown in Figure 5B.
- https://doi.org/10.7554/eLife.09743.017
Figure 6
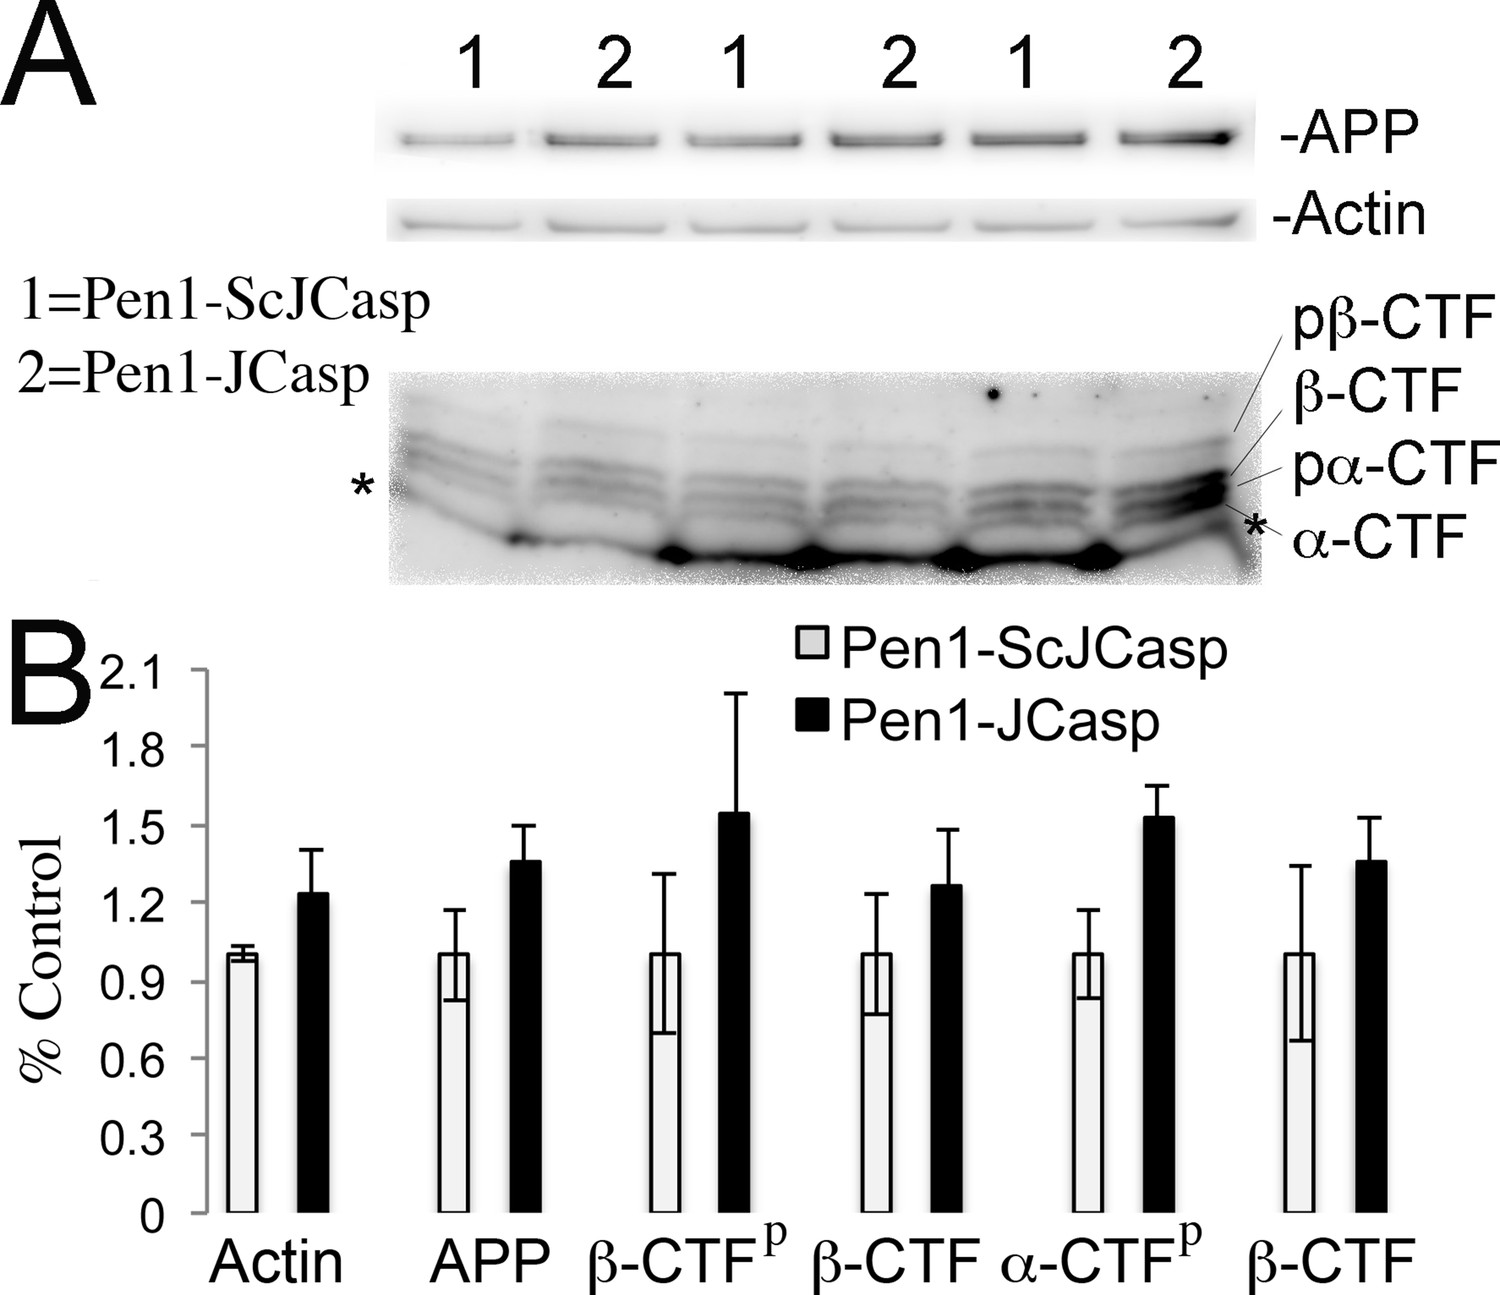
Pen1-JCasp does not alter amyloid precursor protein (APP) processing.
(A) Western blot analysis of Actin, APP, β C-terminal fragment (CTF) and α-CTF in hippocampal slices incubated for 8 hr with either 1 μM Pen1-JCasp or 1 μM Pen1-ScJCasp. β-CTFp and α-CTFp are phosphorylated forms of β-CTF and α-CTF, respectively. (B) Quantification of the data: for each protein, the average signal obtained with 1 μM Pen1-ScJCasp is arbitrarily considered 1; the average signal obtained with 1 μM Pen1-JCasp is expressed as a percent of the control. The * indicates an aspecific band, which is also present in App-KO lysates (not shown).
Figure 7

Pen1-JCasp impairs excitatory synapses via an intracellular mechanism.
Pen1-JCasp, but not JCasp, reduces basal synaptic transmission (A) paired-pulse facilitation (PPF) (B) and frequency facilitation (FF) at 20 Hz (C). Representative traces are shown. Stimulus artifacts are removed from the FF traces for clarity. The number of recordings and of mice analyzed are shown in (B). Statistical assessments were performed by: one-way analysis of variance (ANOVA) followed by Tukey’s multiple comparisons test for slopes of input/output (I/O) curves; two-way repeated measures (RM) ANOVA followed by Tukey’s multiple comparisons test for PPF and FF. *Pen1-JCasp 1 μM vs. artificial cerebrospinal fluid (ACSF), *Pen1-JCasp 1 μM vs. JCasp; *p < 0.05; **p < 0.01; ***p < 0.001; ****p < 0.0001. The complete statistical analyses are shown in the attached Excel file. All data represent means ± SEM.
-
Figure 7—source data 1
Source data for statistical analysis of input/output curves in Figure 7A.
- https://doi.org/10.7554/eLife.09743.020
-
Figure 7—source data 2
Source data for statistical analysis of paired-pulse facilitation in Figure 7B.
- https://doi.org/10.7554/eLife.09743.021
-
Figure 7—source data 3
Source data for statistical analysis of frequency facilitation at 20 Hz in Figure 7C.
- https://doi.org/10.7554/eLife.09743.022
Figure 8
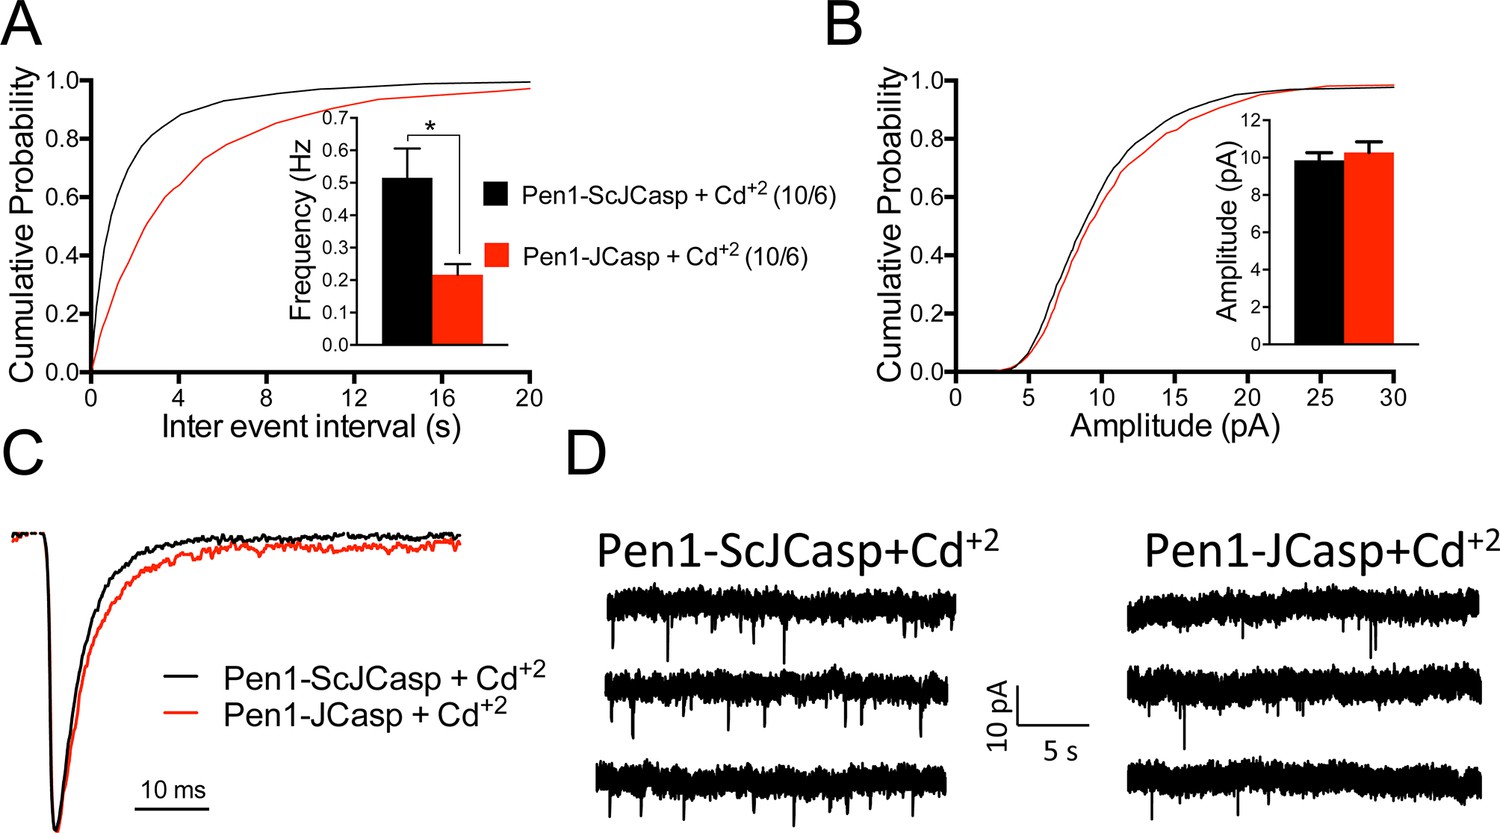
Pen1-JCasp reduces the frequency of miniature excitatory postsynaptic currents (EPSCs) (mEPSCs) independently of alterations of Ca+2 influx.
(A) Cumulative probability of α-amino-3-hydroxy-5-methyl-4-isoxazolepropionic acid receptor (AMPAR) mediated mEPSC inter-event intervals. (B) Cumulative probability of AMPAR-mediated mEPSC amplitudes. Insets in cumulative probability graphs represent average mEPSC frequency (A) and amplitudes (B). mEPSC frequency was significantly reduced by Pen1-JCasp in the presence of Cd+2. (C) Average mEPSC of the two groups were not significantly different. (D) Representative recording traces of miniature EPSCs are shown. The number of recordings and the number of mice analyzed for each group are shown in (A). All data represent means ± SEM. Statistical assessments were performed by paired t test (*p < 0.05).
-
Figure 8—source data 1
Source data for statistical analysis of mEPSCs frequency in Figure 8A.
- https://doi.org/10.7554/eLife.09743.024
Figure 9
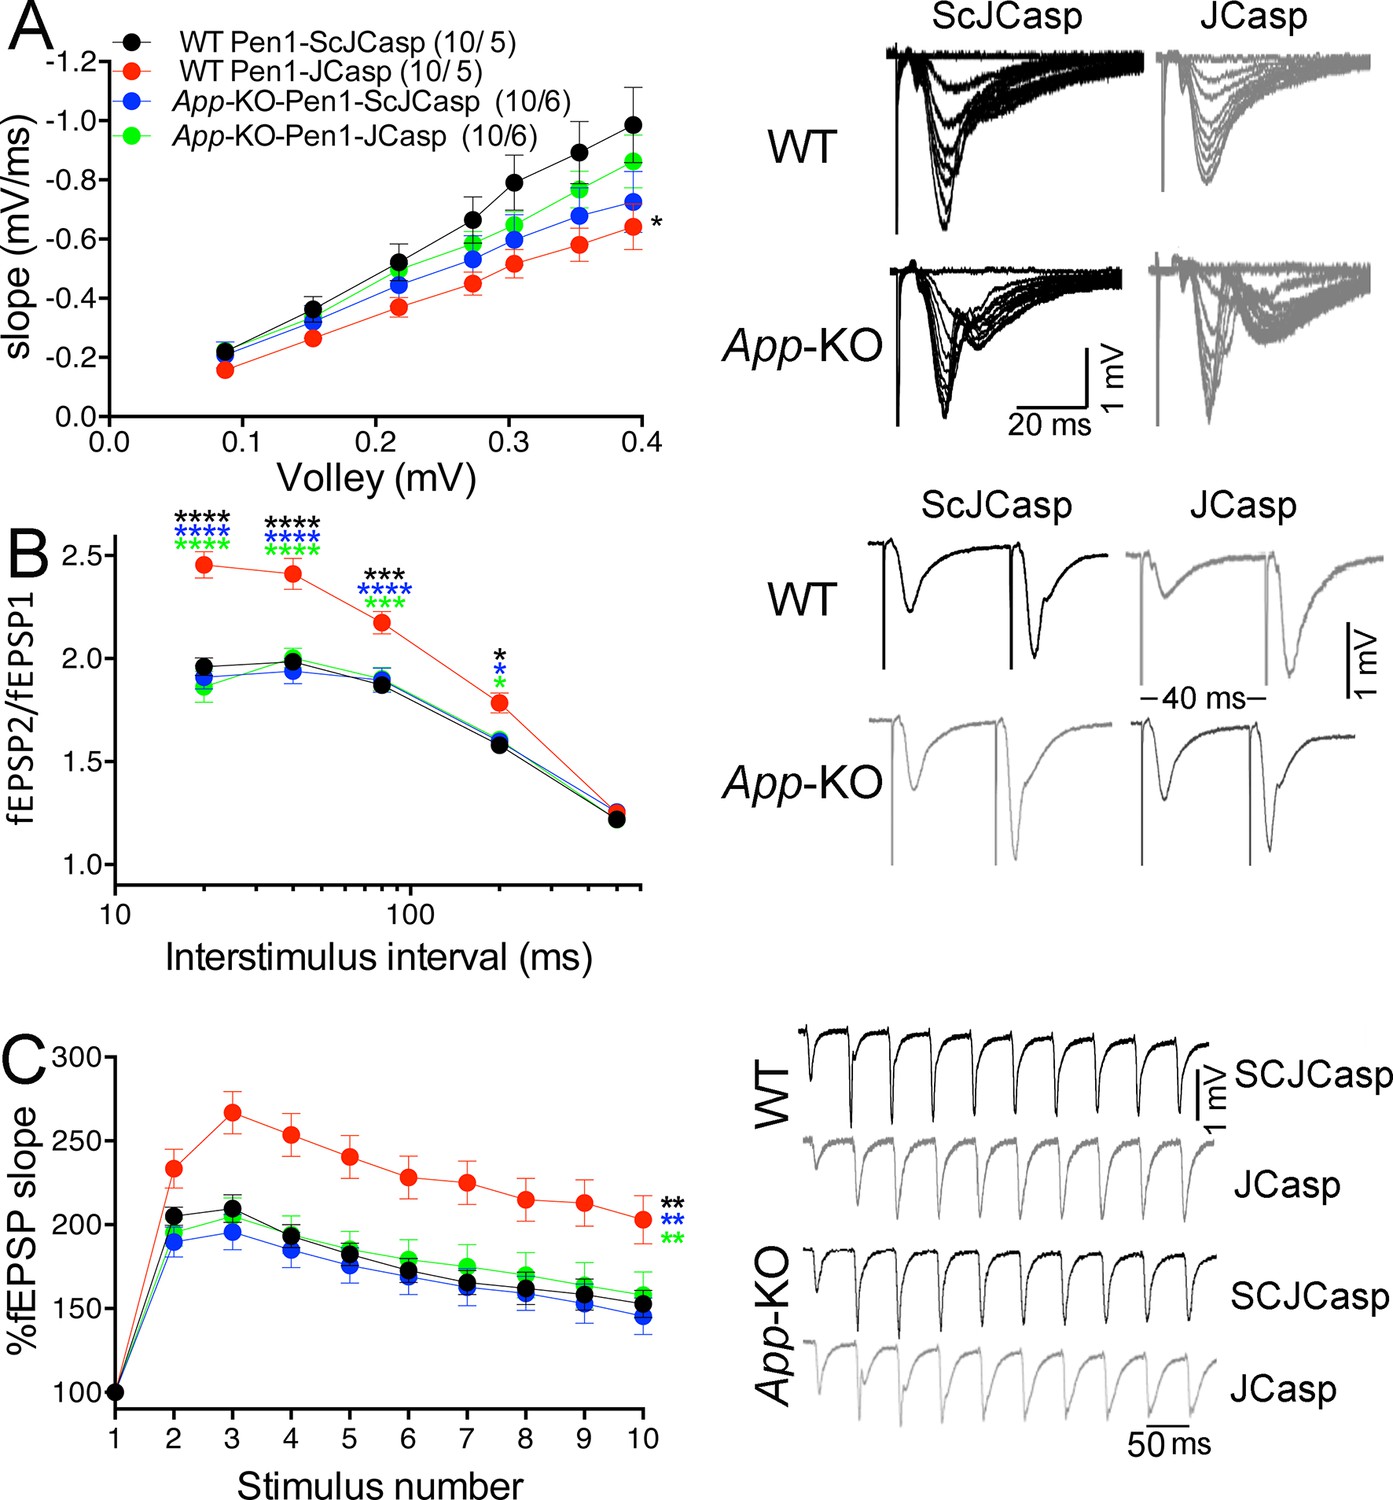
Amyloid precursor protein (APP) is required for the inhibitory effect of Pen1-JCasp on synaptic transmission.
(A) Analysis of slopes of each input/output (I/O) recording by one-way analysis of variance (ANOVA) followed by Tukey’s multiple comparisons test showed no significant differences among the groups. However, uncorrected Fisher’s LSD test shows that Pen1-JCasp reduces basal synaptic transmission in wild-type (WT) hippocampal slices as compared to WT slices treated with Pen1-ScJCasp. Pen1-JCasp increases paired-pulse facilitation (PPF) (B) and frequency facilitation (FF) (C) in WT but not App-KO excitatory Schaffer collateral (SC) synapses. Representative traces are shown on the right of summary plots. The number of recordings and of mice analyzed for each group are shown in (A). All data represent means ± SEM. Statistical assessment by two-way repeated measures (RM) ANOVA shows significant differences in PPF and FF between WT mice treated with Pen1-JCasp and the other three experimental groups (*, vs. WT+Pen1-SCJCasp; *, vs. App-KO+Pen1-SCJCasp; *, vs. App-KO+Pen1-JCasp; *p < 0.05; **p < 0.01; ***p < 0.001; ****p < 0.0001). The complete statistical analyses are shown in the attached Excel file.
-
Figure 9—source data 1
Source data for statistical analysis of input/output curves in Figure 9A.
- https://doi.org/10.7554/eLife.09743.026
-
Figure 9—source data 2
Source data for statistical analysis of paired-pulse facilitation in Figure 9B.
- https://doi.org/10.7554/eLife.09743.027
-
Figure 9—source data 3
Source data for statistical analysis of frequency facilitation at 20 Hz in Figure 9C.
- https://doi.org/10.7554/eLife.09743.028
Figure 10
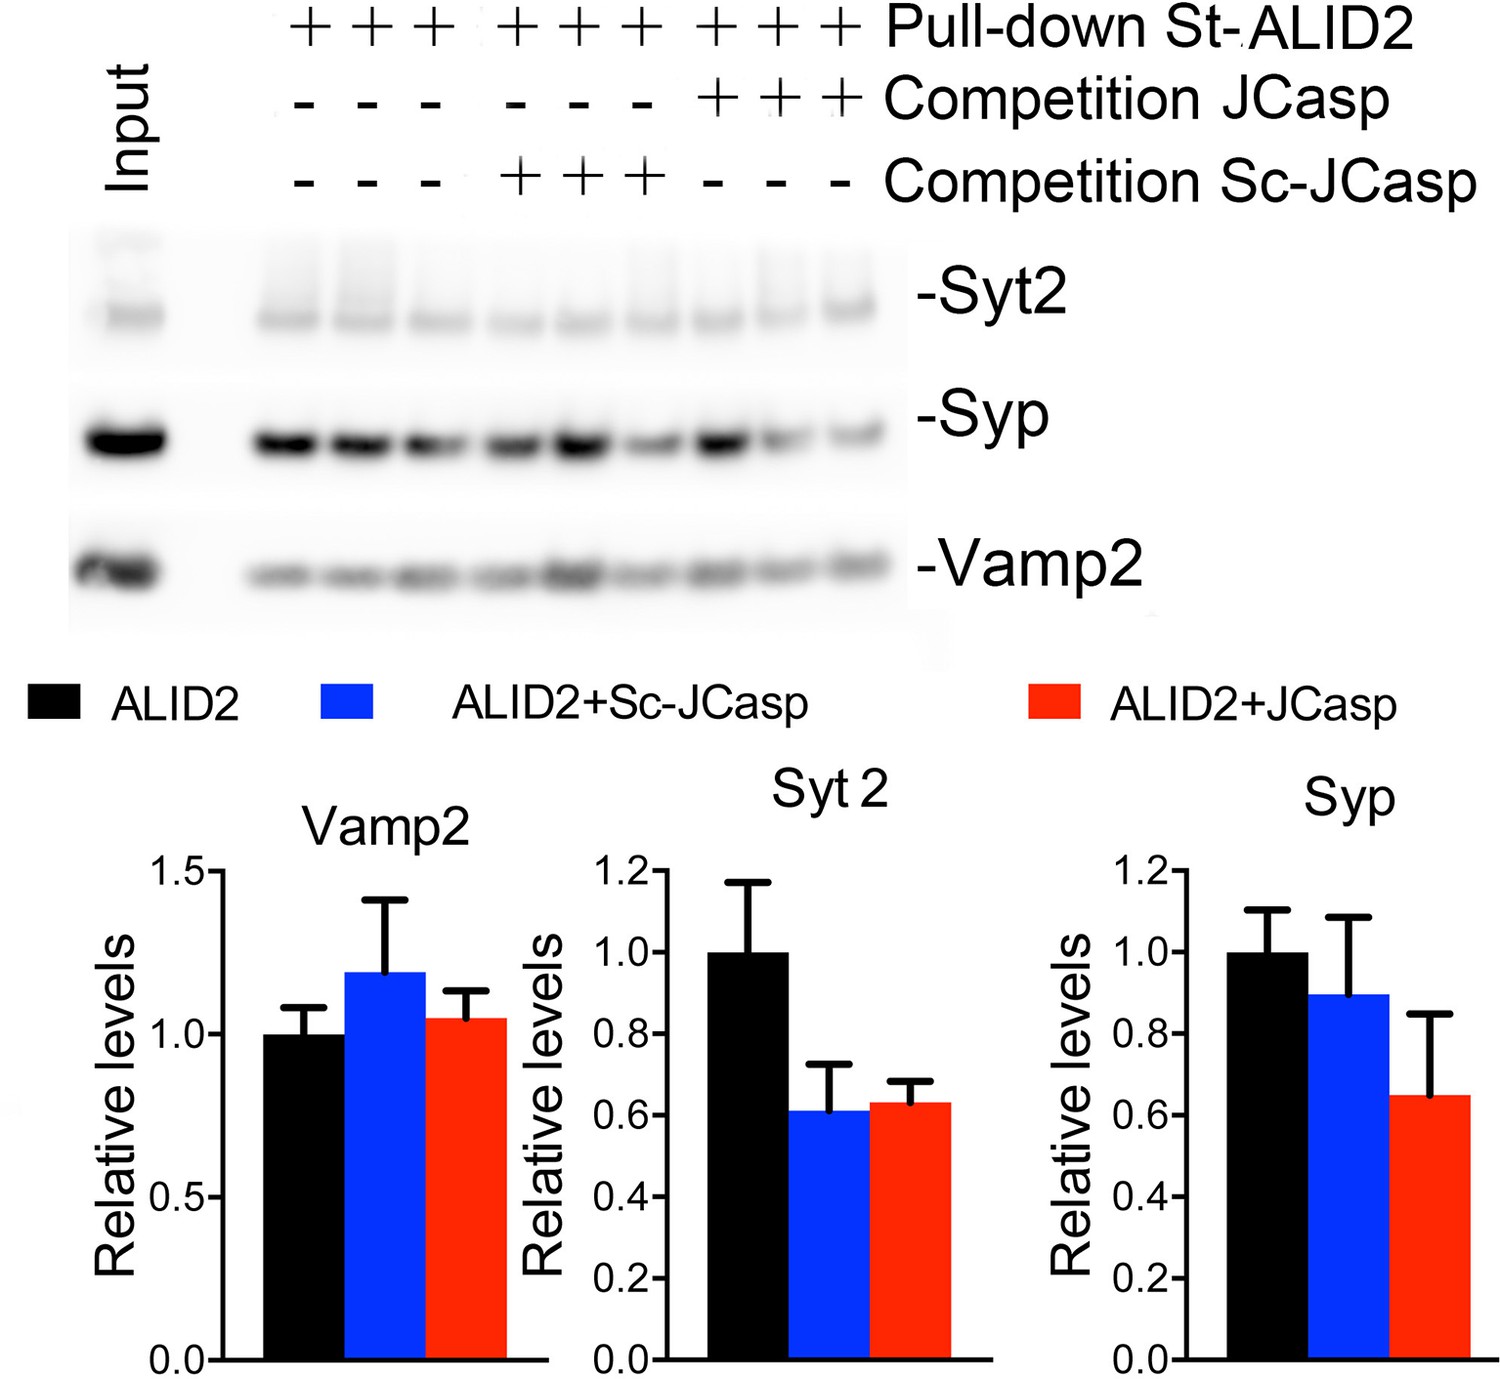
JCasp does not compete for the interaction of amyloid precursor protein (APP) like protein-2 (APLP2) intracellular domain (ALID2) with Syt2, Syp, and Vamp2.
Brain lysates were incubated for 30 min with 10 μM of either JCasp or ScJCasp. After incubation, the lysates were affinity purified on StrepTactin columns bound to the indicated St-peptides. Bound proteins were analyzed by Western blot. JCasp does not reduce binding of Syp, Vamp2, and Syt2 to St-ALID2. The graphs at the bottom of the figure show quantitative analysis of the Western blot data.
Figure 11
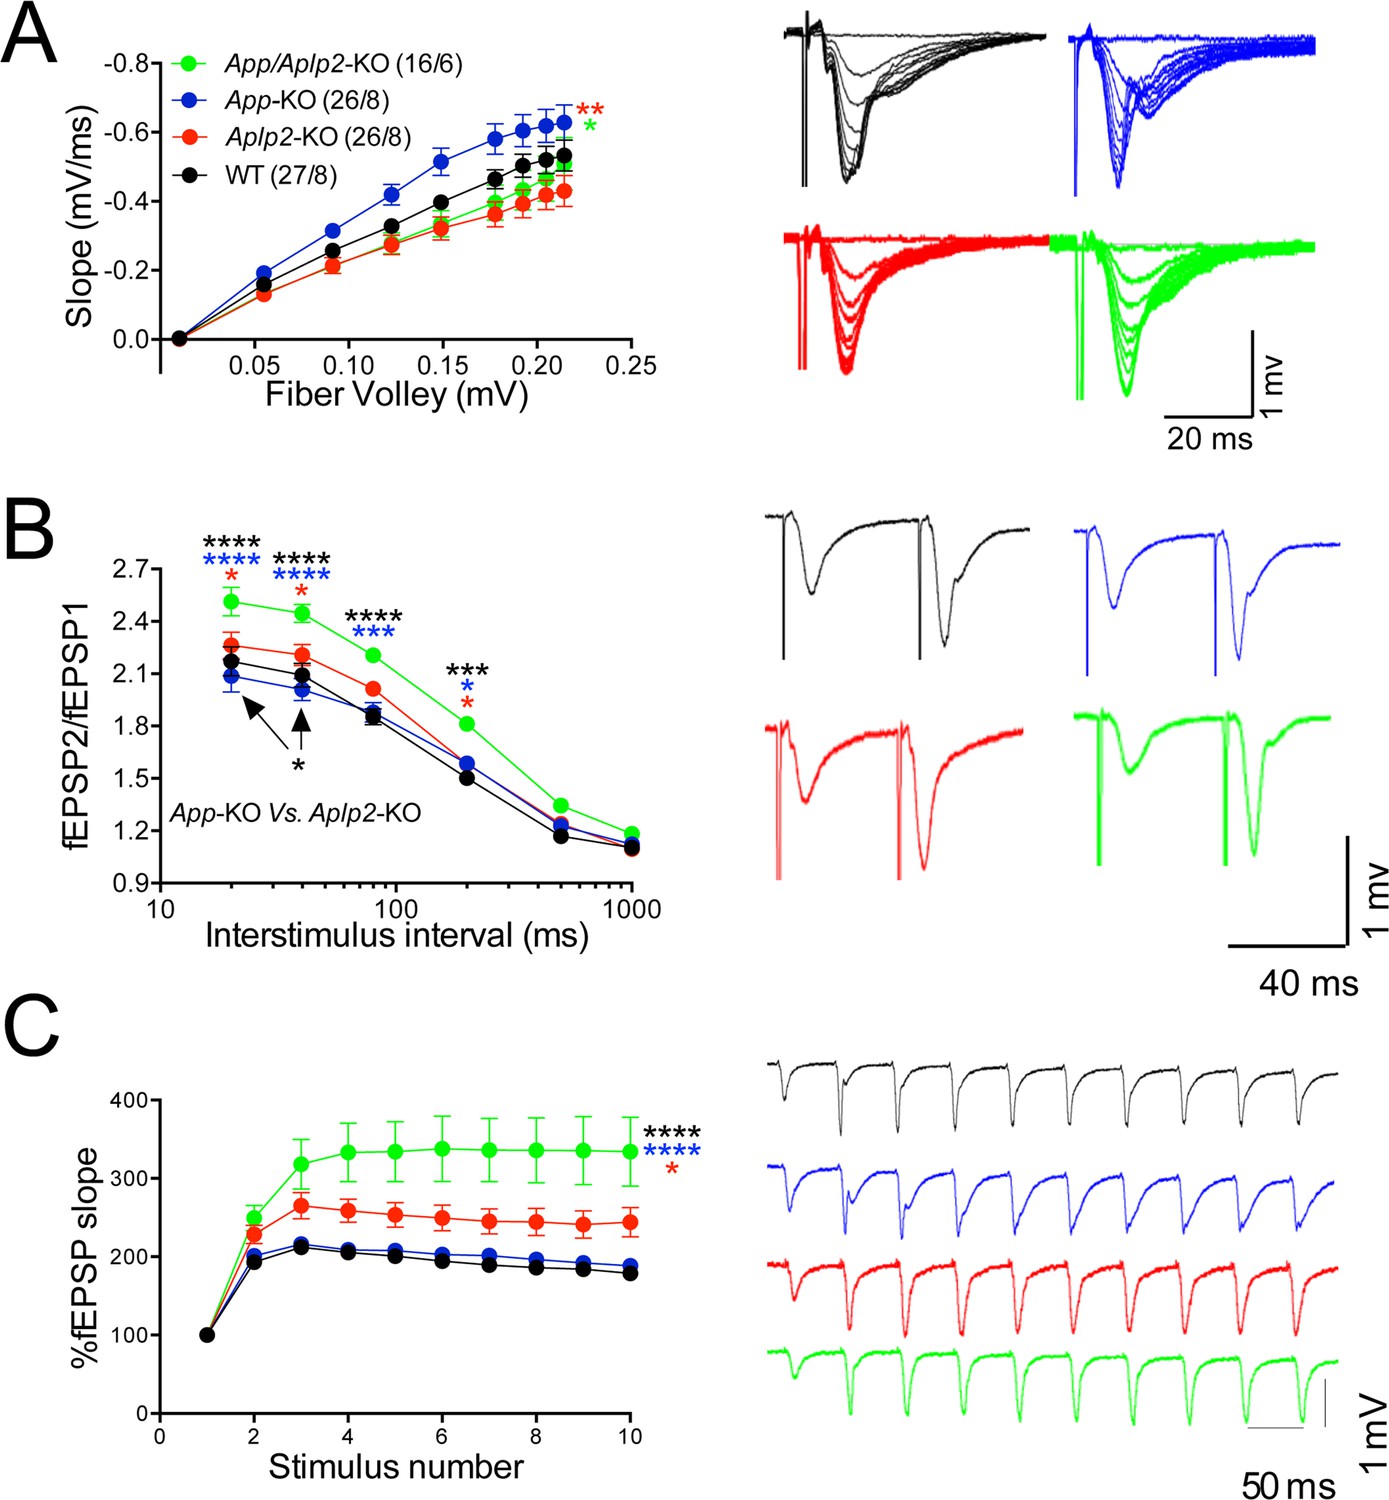
Amyloid precursor protein (APP) like protein-2 (APLP2) compensates for loss of APP function.
(A) Input/output (I/O) recording showed significant differences between different genotypes (App-KO vs. Aplp2-KO, **p < 0.01; App-KO vs. App/Aplp2-dKO, *p < 0.05). PPR (B) and frequency facilitation (FF) (C) are significantly increased in App/Aplp2-dKO as compared to all other genotypes. Representative traces are shown on the right of summary plots. The number of recordings and of mice analyzed for each group are shown in (A). Statistical assessment by two-way repeated measures analysis of variance (RM ANOVA) followed by Tukey’s multiple comparisons tests. All data represent means ± SEM (*p < 0.05; **p < 0.01; ***p < 0.001).
-
Figure 11—source data 1
Source data for statistical analysis of input/output curves in Figure 11A.
- https://doi.org/10.7554/eLife.09743.032
-
Figure 11—source data 2
Source data for statistical analysis of paired-pulse facilitation in Figure 11B.
- https://doi.org/10.7554/eLife.09743.033
-
Figure 11—source data 3
Source data for statistical analysis of frequency facilitation at 20Hz in Figure 11C.
- https://doi.org/10.7554/eLife.09743.034
Figure 12

Reduced frequency of miniature excitatory postsynaptic currents (EPSCs) (mEPSCs) in Aplp2-KO and App/Aplp2-dKO CA1 pyramidal neurons.
(A) Cumulative probability of α-amino-3-hydroxy-5-methyl-4-isoxazolepropionic acid receptor (AMPAR)-mediated mEPSC inter-event intervals. (B) Cumulative probability of AMPAR-mediated mEPSC amplitudes. Insets in cumulative probability graphs represent average mEPSC frequency (A) and amplitudes (B). mEPSC frequency was significantly reduced in Aplp2-KO and App/Aplp2-dKO CA1 pyramidal neurons as compared to wild-type (WT) but not App-KO littermates. (C) Average mEPSC of the four groups were not significantly different. (D) Cumulative probability of AMPAR-mediated mEPSC decay time with insets representing average mEPSC decay time. mEPSC decay time was significantly increased in App/Aplp2-dKO CA1 pyramidal neurons as compared to WT, App-KO, and Aplp2-KO littermates. (E) Representative recording traces of miniature EPSCs are shown. The number of recordings and the number of mice analyzed for each group are shown in (A). All data represent means ± SEM. Statistical assessment was performed using ordinary one-way ANOVA followed by uncorrected Fisher’s least significant difference (LSD) multiple comparisons test (*p < 0.05; **p < 0.01; ***p < 0.001; ****p < 0.0001).
-
Figure 12—source data 1
Source data for statistical analysis of mEPSCs frequency in Figure 12A.
- https://doi.org/10.7554/eLife.09743.036
-
Figure 12—source data 2
Source data for statistical analysis of mEPSCs decay time in Figure 12B.
- https://doi.org/10.7554/eLife.09743.037
Author response image 1
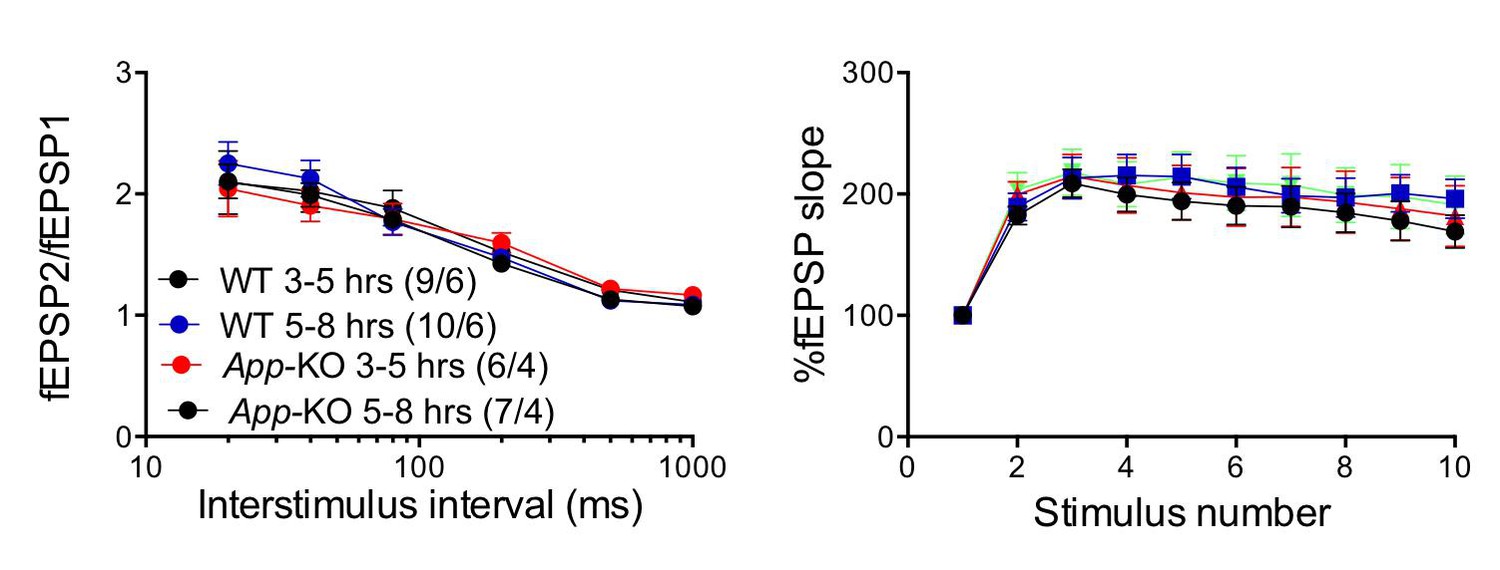
The “age” of the hippocampal slices does not affect facilitations in both WT and App-KO SC:CA1 synapses.
Frequency facilitation was tested at 20 Hz.
Tables
Table 1
Proteins that bind JCasp are in redbold. Proteins that bind Ccas are in bluethe other entries. Source Data containing all search results, coverage maps, peptide lists and product ion data were uploaded to the PRIDE repository (European Bioinformatics Institute (EBI), Cambridge, UK) with Proteome Xchange identifier #48018. Details of protein identification data related to the proteins discussed in this manuscript can be found in Table1. The table file contains: the list of proteins identified (Column 1); the database accession numbers (Column 2); the spectral counts (SpC, Columns 3-7); Spectral Abundance Factor (SAF, Columns 8-12); subsequent Normalized Spectral Abundance Factor (NSAF, Columns 13-17). This was based on the equation: NSAF = (SpC/MW)/Σ(SpC/MW)N, where SpC = Spectral Counts, MW = Protein MW in kDa and N = Total Number of Proteins, NSAF contains NSAF values without alone.
| ST | ST-AID | ST | ST-Ccas | ST-JCasp | ST | ST-AID | ST | ST-Ccas | ST-JCasp | ST | ST-AID | ST | ST-Ccas | ST-JCasp | ||||
| Prot. | Acc. Num. | SpC | SpC | SpC | SpC | SpC | SAF | SAF | SAF | SAF | SAF | NSAF | NSAF | NSAF | NSAF | NSAF | ||
| Ddb1 | sp|Q3U1J4| | 0 | 418 | 0 | 730 | 0 | 0.0000 | 3.2913 | 0.0000 | 5.7480 | 0.0000 | 0.0000 | 0.0139 | 0.0000 | 0.0366 | 0.0000 | ||
| Syt1 | sp|P46096| | 0 | 88 | 0 | 0 | 113 | 0.0000 | 1.8723 | 0.0000 | 0.0000 | 2.4043 | 0.0000 | 0.0079 | 0.0000 | 0.0000 | 0.0129 | ||
| Stxbp1 | sp|O08599| | 0 | 44 | 0 | 8 | 46 | 0.0000 | 0.6471 | 0.0000 | 0.1176 | 0.6765 | 0.0000 | 0.0027 | 0.0000 | 0.0007 | 0.0036 | ||
| Cul4a | sp|Q3TCH7| | 0 | 40 | 0 | 36 | 0 | 0.0000 | 0.4545 | 0.0000 | 0.4091 | 0.0000 | 0.0000 | 0.0019 | 0.0000 | 0.0026 | 0.0000 | ||
| Sv2b | sp|Q8BG39| | 0 | 55 | 0 | 0 | 66 | 0.0000 | 0.7143 | 0.0000 | 0.0000 | 0.8571 | 0.0000 | 0.0030 | 0.0000 | 0.0000 | 0.0046 | ||
| Syngr3 | sp|Q8R191| | 0 | 40 | 0 | 6 | 79 | 0.0000 | 1.6000 | 0.0000 | 0.2400 | 3.1600 | 0.0000 | 0.0068 | 0.0000 | 0.0015 | 0.0170 | ||
| Cul4b | sp|A2A432| | 0 | 19 | 0 | 15 | 0 | 0.0000 | 0.1712 | 0.0000 | 0.1351 | 0.0000 | 0.0000 | 0.0007 | 0.0000 | 0.0009 | 0.0000 | ||
| Stx1b | sp|P61264| | 0 | 23 | 0 | 0 | 31 | 0.0000 | 0.6970 | 0.0000 | 0.0000 | 0.9394 | 0.0000 | 0.0029 | 0.0000 | 0.0000 | 0.0050 | ||
| Vamp2 | sp|P63044| | 0 | 23 | 0 | 0 | 46 | 0.0000 | 1.7692 | 0.0000 | 0.0000 | 3.5385 | 0.0000 | 0.0075 | 0.0000 | 0.0000 | 0.0190 | ||
| Syngr1 | sp|O55100| | 0 | 8 | 0 | 0 | 30 | 0.0000 | 0.3077 | 0.0000 | 0.0000 | 1.1538 | 0.0000 | 0.0013 | 0.0000 | 0.0000 | 0.0062 | ||
| Sv2a | sp|Q9JIS5| | 0 | 11 | 0 | 1 | 23 | 0.0000 | 0.1325 | 0.0000 | 0.0120 | 0.2771 | 0.0000 | 0.0006 | 0.0000 | 0.0001 | 0.0015 | ||
| Snap25 | sp|P60879| | 0 | 16 | 0 | 12 | 35 | 0.0000 | 0.6957 | 0.0000 | 0.5217 | 1.5217 | 0.0000 | 0.0029 | 0.0000 | 0.0033 | 0.0082 | ||
| Stx1a | sp|O35526| | 0 | 2 | 0 | 0 | 21 | 0.0000 | 0.0606 | 0.0000 | 0.0000 | 0.6364 | 0.0000 | 0.0003 | 0.0000 | 0.0000 | 0.0034 | ||
| Stx7 | sp|O70439| | 0 | 3 | 0 | 0 | 4 | 0.0000 | 0.1000 | 0.0000 | 0.0000 | 0.1333 | 0.0000 | 0.0004 | 0.0000 | 0.0000 | 0.0007 | ||
| Syt2 | sp|P46097| | 0 | 15 | 0 | 0 | 36 | 0.0000 | 0.3191 | 0.0000 | 0.0000 | 0.7660 | 0.0000 | 0.0013 | 0.0000 | 0.0000 | 0.0041 | ||
| Syt12 | sp|Q920N7| | 0 | 3 | 0 | 0 | 10 | 0.0000 | 0.0638 | 0.0000 | 0.0000 | 0.2128 | 0.0000 | 0.0003 | 0.0000 | 0.0000 | 0.0011 | ||
| Stx12 | sp|Q9ER00| | 0 | 6 | 0 | 0 | 5 | 0.0000 | 0.1935 | 0.0000 | 0.0000 | 0.1613 | 0.0000 | 0.0008 | 0.0000 | 0.0000 | 0.0009 |
Table 2
Interaction of ALID2 with presynaptic protein. Source Data containing all search results, coverage maps, peptide lists and product ion data were uploaded to the PRIDE repository (European Bioinformatics Institute (EBI), Cambridge, UK) with Proteome Xchange identifier #58725. The table file contains: the list of proteins identified (Column 1); the database accession numbers (Column 2); the spectral counts (SpC, Columns 3-7); Spectral Abundance Factor (SAF, Columns 8-12); subsequent Normalized Spectral Abundance Factor (NSAF, Columns 13-17). This was based on the equation: NSAF = (SpC/MW)/Σ(SpC/MW)N, where SpC = Spectral Counts, MW = Protein MW in kDa and N = Total Number of Proteins, NSAF contains NSAF values without alone.
| ST | ST-ALID2 | ST | ST-ALID2 | ST | ST-ALID2 | ||||
|---|---|---|---|---|---|---|---|---|---|
| Prot. | Acc. Num. | SpC | SpC | SAF | SpC | NSAF | SpC | ||
| Syt1 | sp|P46096| | 0 | 29 | 0.0000 | 0.3235 | 0.0000 | 0.0045 | ||
| Stxbp1 | sp|O08599| | 0 | 22 | 0.0000 | 0.6471 | 0.0000 | 0.0027 | ||
| Sv2b | sp|Q8BG39| | 0 | 15 | 0.0000 | 0.1948 | 0.0000 | 0.0034 | ||
| Syngr3 | sp|Q8R191| | 0 | 7 | 0.0000 | 0.28 | 0.0000 | 0.0067 | ||
| Stx1b | sp|P61264| | 0 | 6 | 0.0000 | 0.1212 | 0.0000 | 0.0029 | ||
| Vamp2 | sp|P63044| | 0 | 11 | 0.0000 | 0.8461 | 0.0000 | 0.0203 | ||
| Syngr1 | sp|O55100| | 0 | 6 | 0.0000 | 0.8846 | 0.0000 | 0.0055 | ||
| Sv2a | sp|Q9JIS5| | 0 | 14 | 0.0000 | 0.4019 | 0.0000 | 0.0023 | ||
| Syt2 | sp|P46097| | 0 | 18 | 0.0000 | 0.3829 | 0.0000 | 0.0053 | ||
| Syph | sp|Q62277| | 0 | 8 | 0.0000 | 0.2353 | 0.0000 | 0.0049 |
Download links
A two-part list of links to download the article, or parts of the article, in various formats.
Downloads (link to download the article as PDF)
Open citations (links to open the citations from this article in various online reference manager services)
Cite this article (links to download the citations from this article in formats compatible with various reference manager tools)
APP and APLP2 interact with the synaptic release machinery and facilitate transmitter release at hippocampal synapses
eLife 4:e09743.
https://doi.org/10.7554/eLife.09743


