Rhythmic coordination of hippocampal neurons during associative memory processing
- Boston University, United States
- University of California, San Diego, United States
- University of Otago, New Zealand
- University of California, Los Angeles, United States
Figures
Figure 1 with 1 supplement

Changes in theta (4–12 Hz), beta (15–35 Hz), low gamma (35–55 Hz), and high gamma (65–90 Hz) amplitude during odor sampling intervals.
(a) Schematic of our behavioral paradigm in which pairs of odors (odors A and B, and odors C and D are presented in blocks) are differentially rewarded depending upon the context in which they are presented (top), raw local field potential (LFP) trace (middle) and corresponding amplitude spectrogram (bottom) beginning 0.5 s prior to the initiation of a nose poke until 1.5 s after poke onset for a single correct trial. For a more detailed view of the automated apparatus, see Figure 1—figure supplement 1. (b) Amplitude spectrogram averaged across all correct trials for a single session, shown as the log of the amplitude relative to baseline inter-trial intervals. (c) Same as in b, averaged across all sessions. (d) Same as in c, but shown instead as the log of the amplitude of correct trials relative to incorrect trials. Low gamma35-55Hz amplitude demonstrates a greater increase over time during correct trials than incorrect trials. (e-h) Instantaneous amplitude of theta4-12Hz (e), beta15-35Hz (f), low gamma35-55Hz (g), and high gamma65-90Hz (h) during the 1.5 s odor-sampling interval.
Figure 1—figure supplement 1
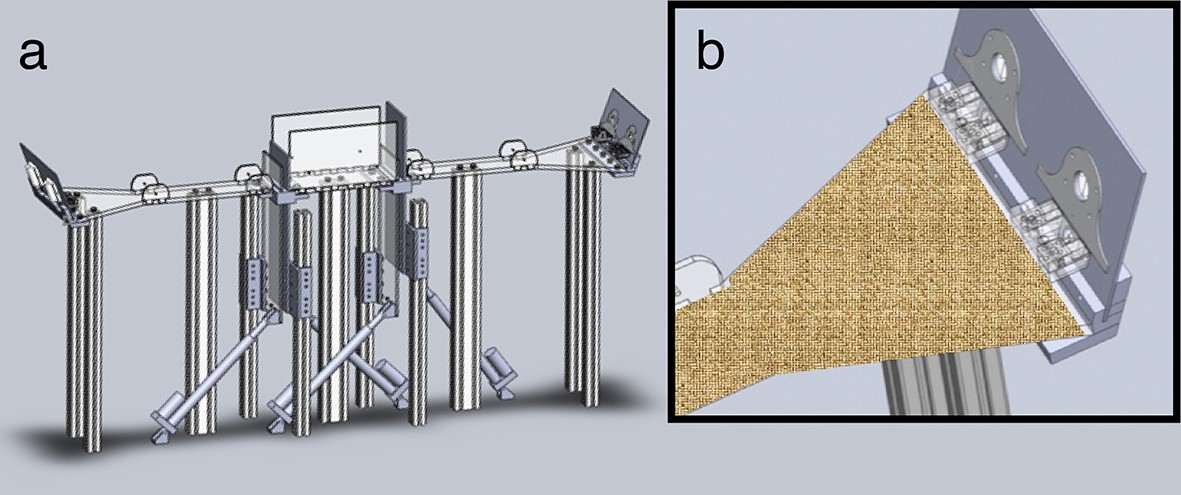
Automated behavioral apparatus.
(a) CAD drawing of automated two-arm apparatus. Each arm is connected to a central chamber with high walls and two pairs of a clear and opaque door. Independent electronic actuators control the doors. (b) Close-up view of the end of one arm with a context wrap placed over the structure. Two odor ports and water reward trays are located at the end of each arm.
Figure 2
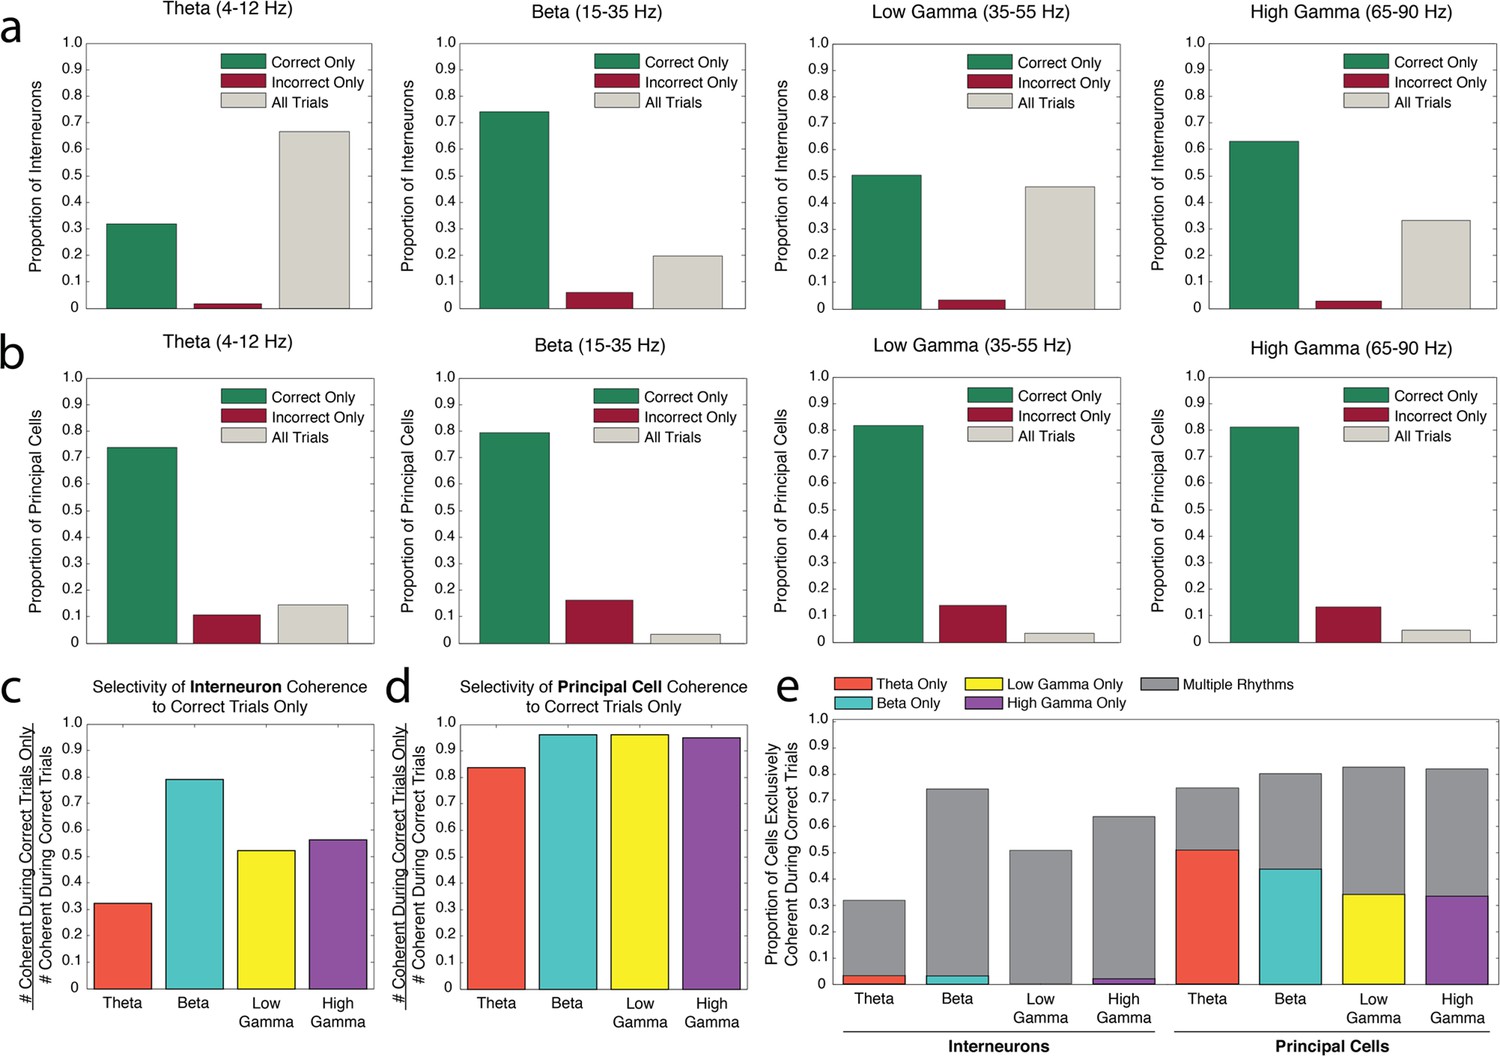
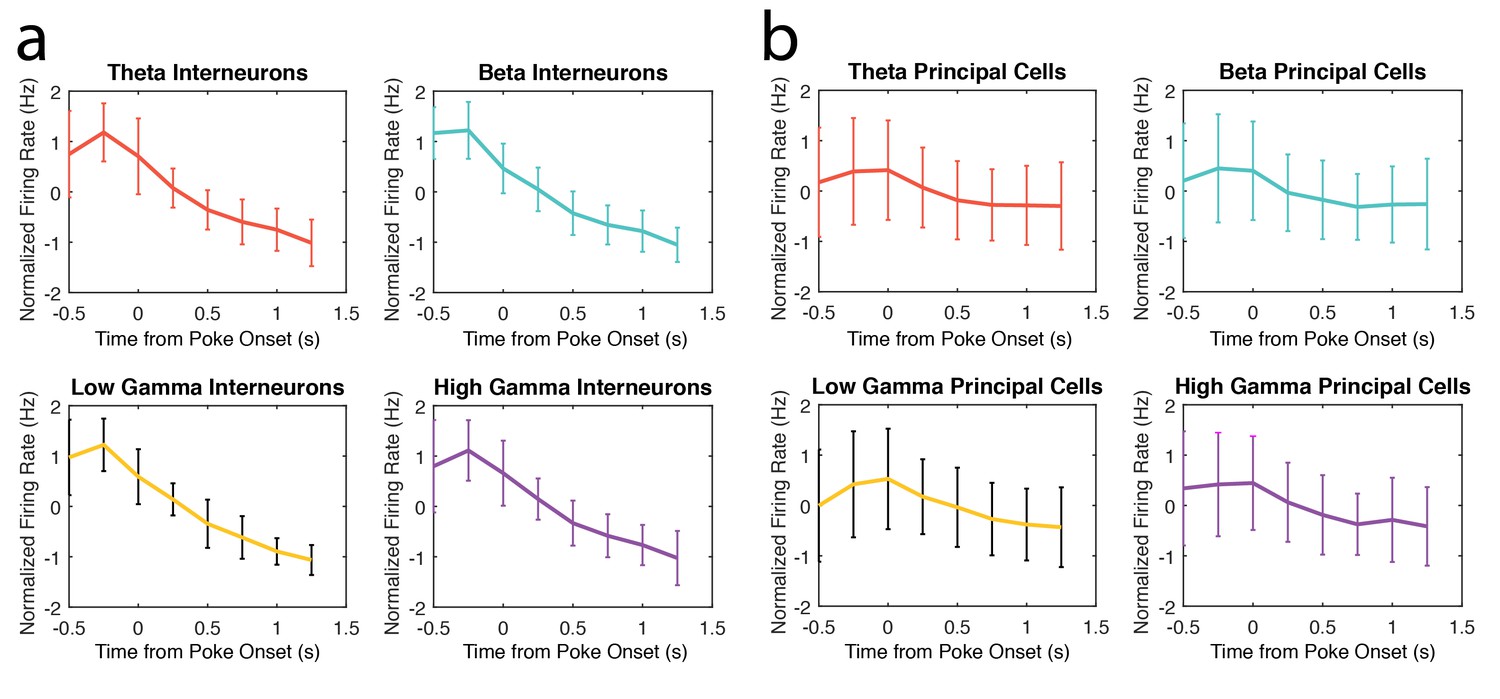
Interneuron and principal cell engagement in rhythmic circuits is related to task performance.
(a) Proportions of interneurons demonstrating significant spike-phase coherence to theta4-12Hz (far left), beta15-35Hz (middle left), low gamma35-55Hz (middle right), and high gamma65-90Hz (far right) during Correct Trials Only (green), Incorrect Trials Only (red), or All Trials (gray). The largest proportion of theta4-12Hz coherent interneurons (far left) was coherent during All Trials, regardless of outcome. In contrast, the largest proportion of beta15-35Hz coherent interneurons (middle left) was coherent selectively during Correct Trials Only. (b) Same as in a, for the principal cell population. For each rhythm, the largest proportions of principal cells were coherent during Correct Trials Only. (c) The number of interneurons coherent during Correct Trials Only as a ratio of the total number of interneurons coherent during correct trials (# coherent during Correct Trials Only + # coherent during All Trials). (d) Same as in c, for the principal cell population. (e) The proportions of interneurons and principal cells coherent to each rhythm during Correct Trials Only, subdivided into the proportions exhibiting coherence to a single rhythm or multiple rhythms. While the interneuron population demonstrates flexible engagement into multiple rhythmic circuits during successful performance, principal cells are more often engaged in single rhythmic circuits.
-
Figure 2—source data 1
The number of interneurons within each rhythmic category that were coherent to each possible combination of the four rhythms.
The interneurons categorized first by significant spike-phase coherence to a given rhythm and then by coherence during a given performance category (Correct Trials Only, Incorrect Trials Only, All Trials) were further divided by their coherence to each possible combination of the four rhythms examined in this study. For the interneurons that exhibited significant spike-phase coherence to a given rhythm during All Trials, the distribution of their coherence to all possible combinations of rhythms is shown separately for correct and incorrect trials. Interneurons coherent during All Trials often exhibited different profiles of engagement across the four rhythms during correct trials compared to incorrect trials.
- https://doi.org/10.7554/eLife.09849.006
-
Figure 2—source data 2
The number of principal cells within each rhythmic category that were coherent to each possible combination of the four rhythms.
The principal cells categorized first by significant spike-phase coherence to a given rhythm and then by coherence during a given performance category (Correct Trials Only, Incorrect Trials Only, All Trials) were further divided by their coherence to each possible combination of the four rhythms examined in this study. For the principal cells that exhibited significant spike-phase coherence to a given rhythm during All Trials, the distribution of their coherence to all possible combinations of rhythms is shown separately for correct and incorrect trials.
- https://doi.org/10.7554/eLife.09849.007
Figure 3 with 1 supplement
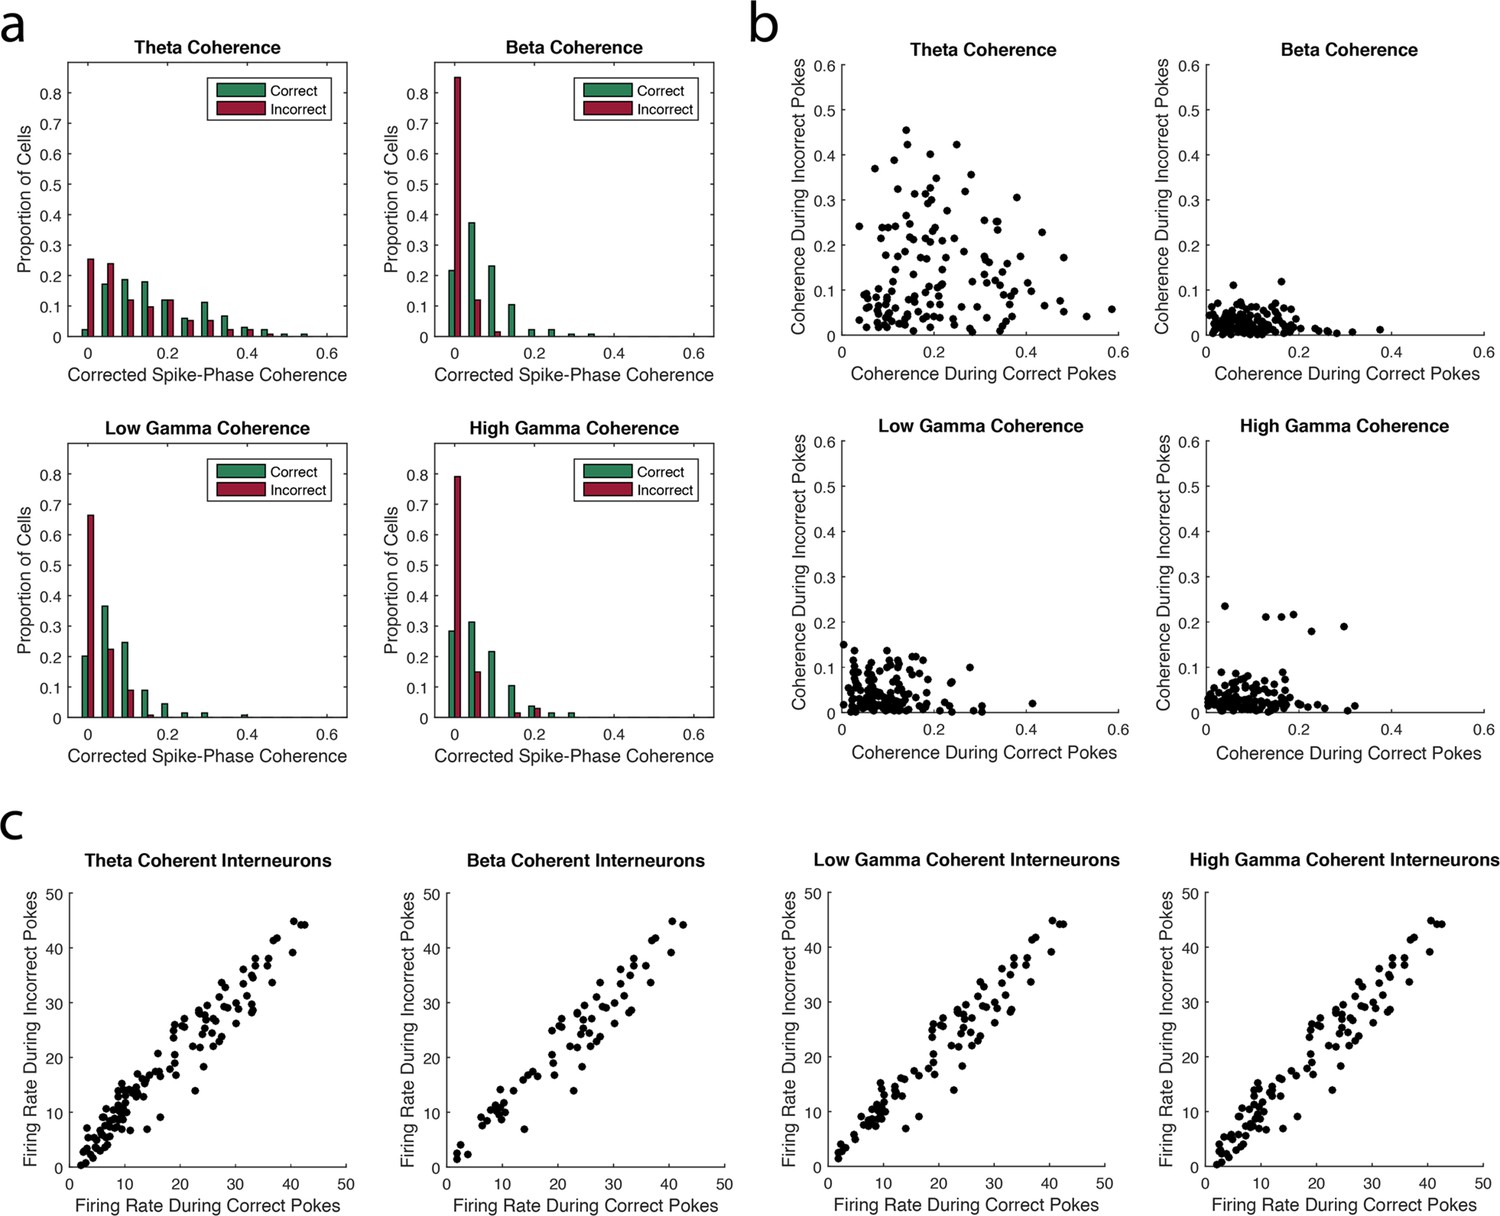
The strength of interneuron coherence to each rhythm is greater during correct trials than incorrect trials.
(a) The proportions of interneurons exhibiting a given magnitude of coherence on the x-axis during correct (green) and incorrect (red) trials with respect to the theta4-12Hz, beta15-35Hz, low gamma35-55Hz, or high gamma65-90Hz rhythm. Greater proportions of interneurons exhibit larger magnitudes of coherence during correct trials compared to incorrect trials. (b) The magnitude of coherence during correct trials plotted against the magnitude of coherence during incorrect trials for all interneurons that were coherent to each rhythm during either correct or incorrect trials. (c) The average firing rate during correct trials plotted against the average firing rate during incorrect trials for all interneurons that were coherent to each rhythm during either correct or incorrect trials.
Figure 3—figure supplement 1
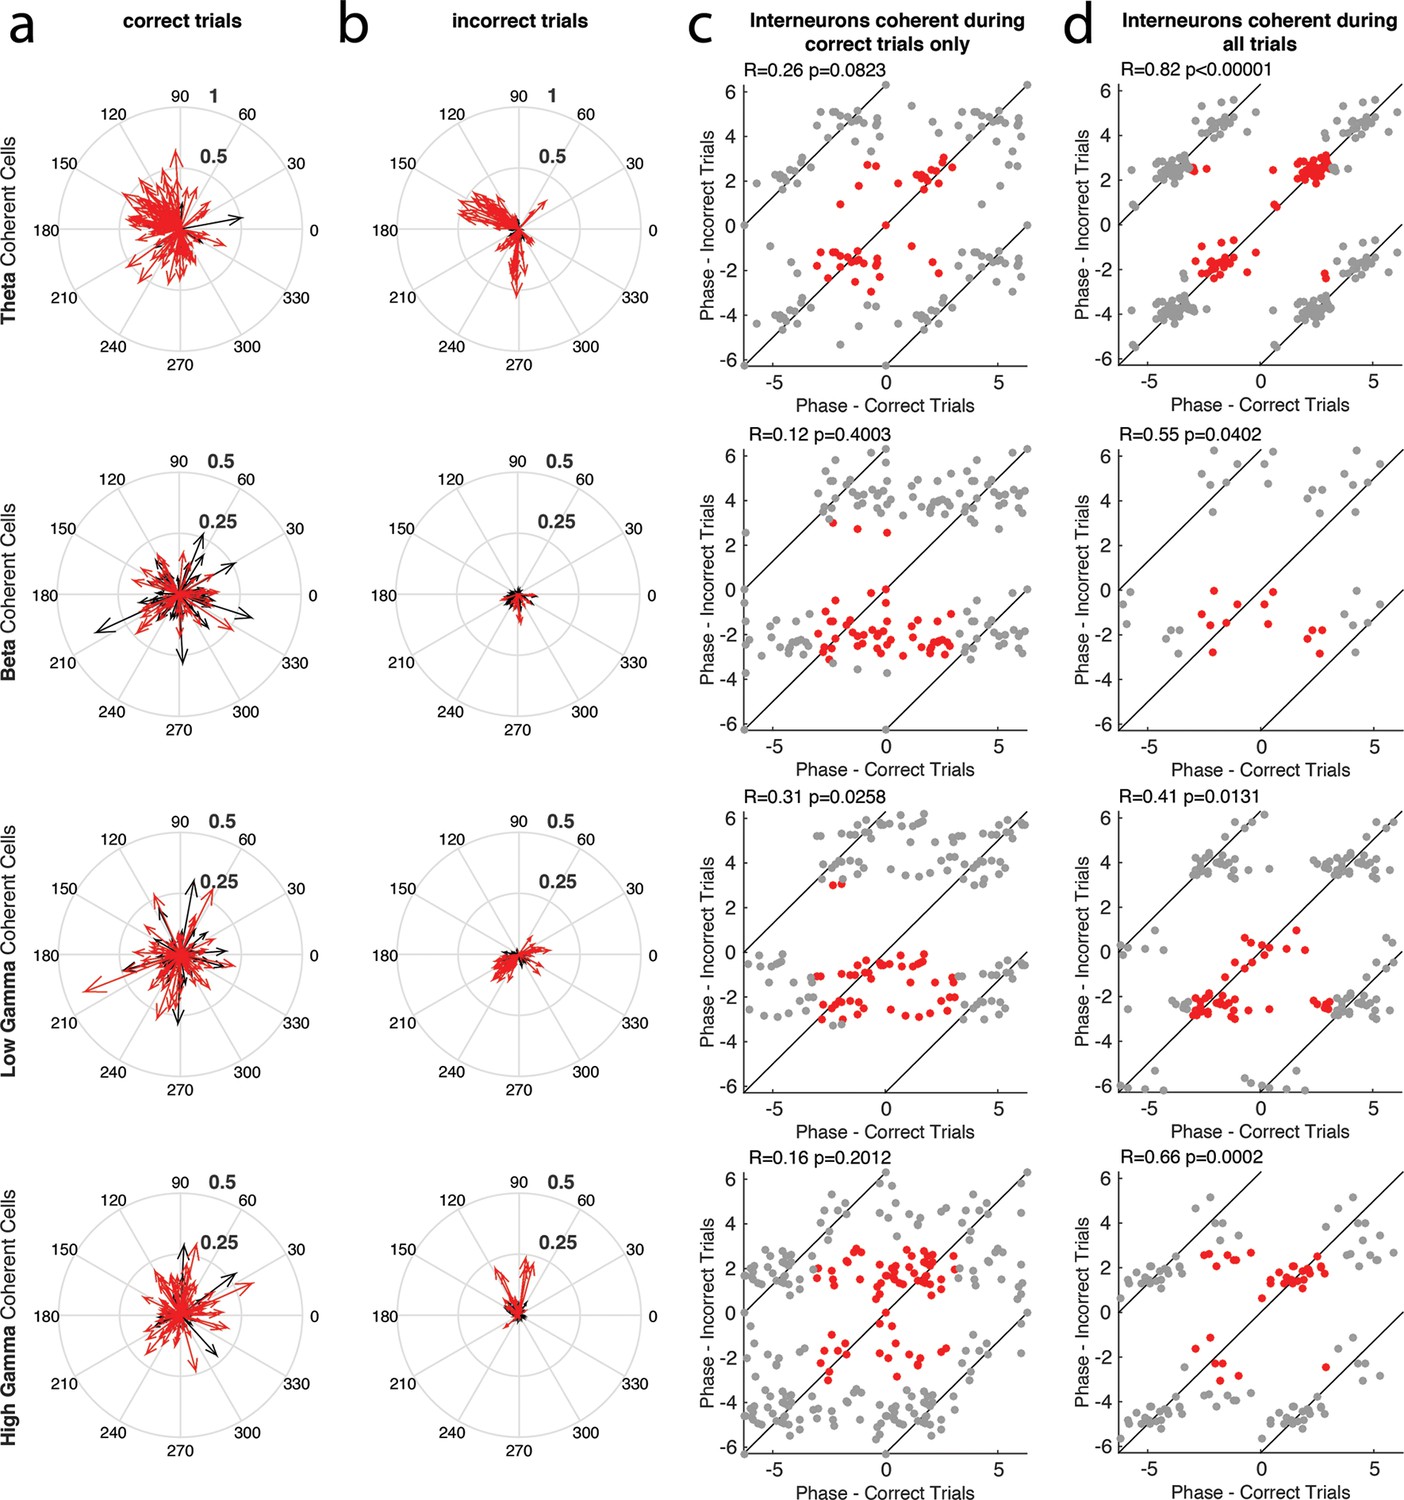
The phase of interneuron coherence to each rhythm during correct and incorrect trials.
(a) The magnitude and phase of coherence during correct trials, for every interneuron that exhibited coherence to a given rhythm during either correct or incorrect trials. Each cell is represented by a single arrow, with the length of the arrow representing the magnitude of coherence and the direction indicating the preferred phase of spiking. Interneurons that exhibited significant spike-phase coherence during correct trials (Correct Trials Only and All Trial categories) are shown in red, while cells that exhibited significant spike-phase coherence during Incorrect Trials Only are shown in black. (b) Same as in a, for incorrect trials. In this case, the interneurons that exhibited significant spike-phase coherence during incorrect trials (Incorrect Trials Only and All Trial categories) are shown in red, while cells that exhibited significant spike-phase coherence during Correct Trials Only are shown in black. (c) The preferred phase of spiking during correct trials plotted against the preferred phase of spiking during incorrect trials for interneurons that exhibited significant spike-phase coherence during Correct Trials Only (red). Gray points indicate circular repetitions of the data in red, to better visualize the circular nature of the data. Circular correlations were performed on the preferred phases observed across the population during correct and incorrect trials and are indicated at the top of each panel (d) Same as in c, for the interneurons exhibiting significant spike-phase coherence during All Trials.
Figure 4 with 1 supplement
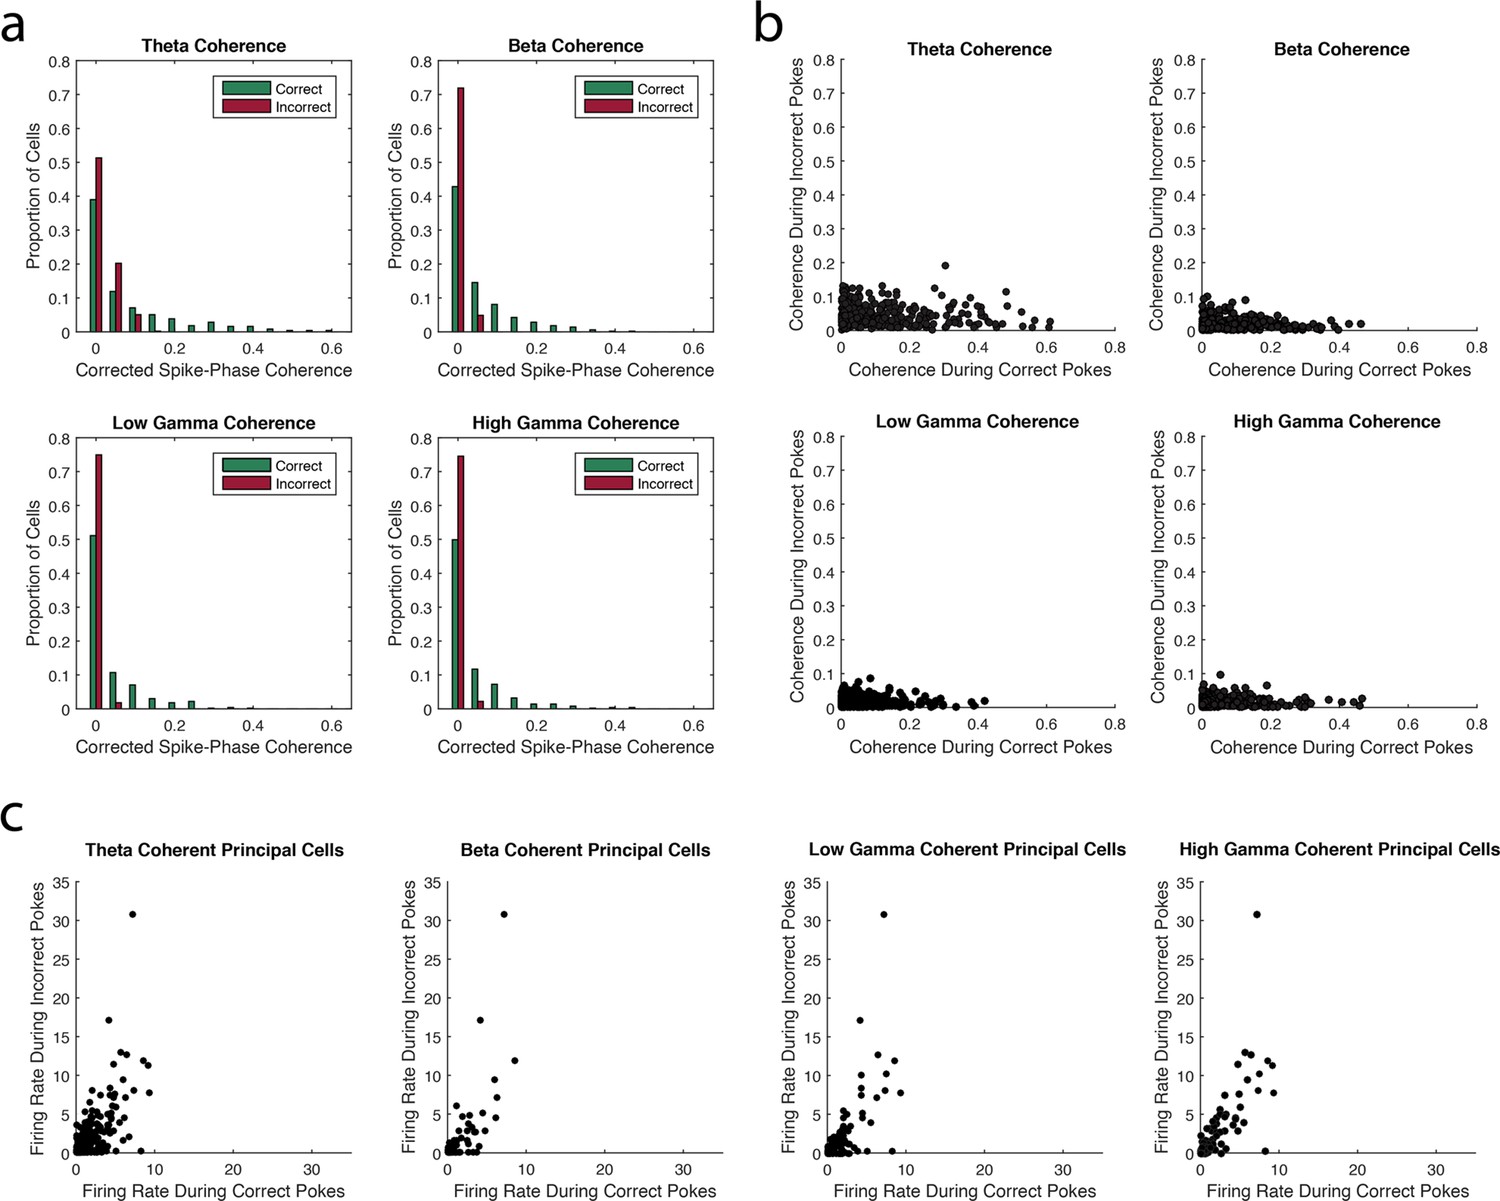
The strength of principal cell coherence to each rhythm is greater during correct trials than incorrect trials.
(a) The proportion of principal cells exhibiting a given magnitude of coherence to theta4-12Hz, beta15-35Hz, low gamma35-55Hz, or high gamma65-90Hz during correct (green) and incorrect (red) trials. Greater proportions of principal cells exhibit larger magnitudes of coherence during correct trials compared to incorrect trials. (b) The magnitude of coherence during correct trials plotted against the magnitude of coherence during incorrect trials for all principal cells that were coherent to each rhythm during either correct or incorrect trials. (c) The average firing rate during correct trials plotted against the average firing rate during incorrect trials for all principal cells that were coherent to each rhythm during either correct or incorrect trials.
Figure 4—figure supplement 1
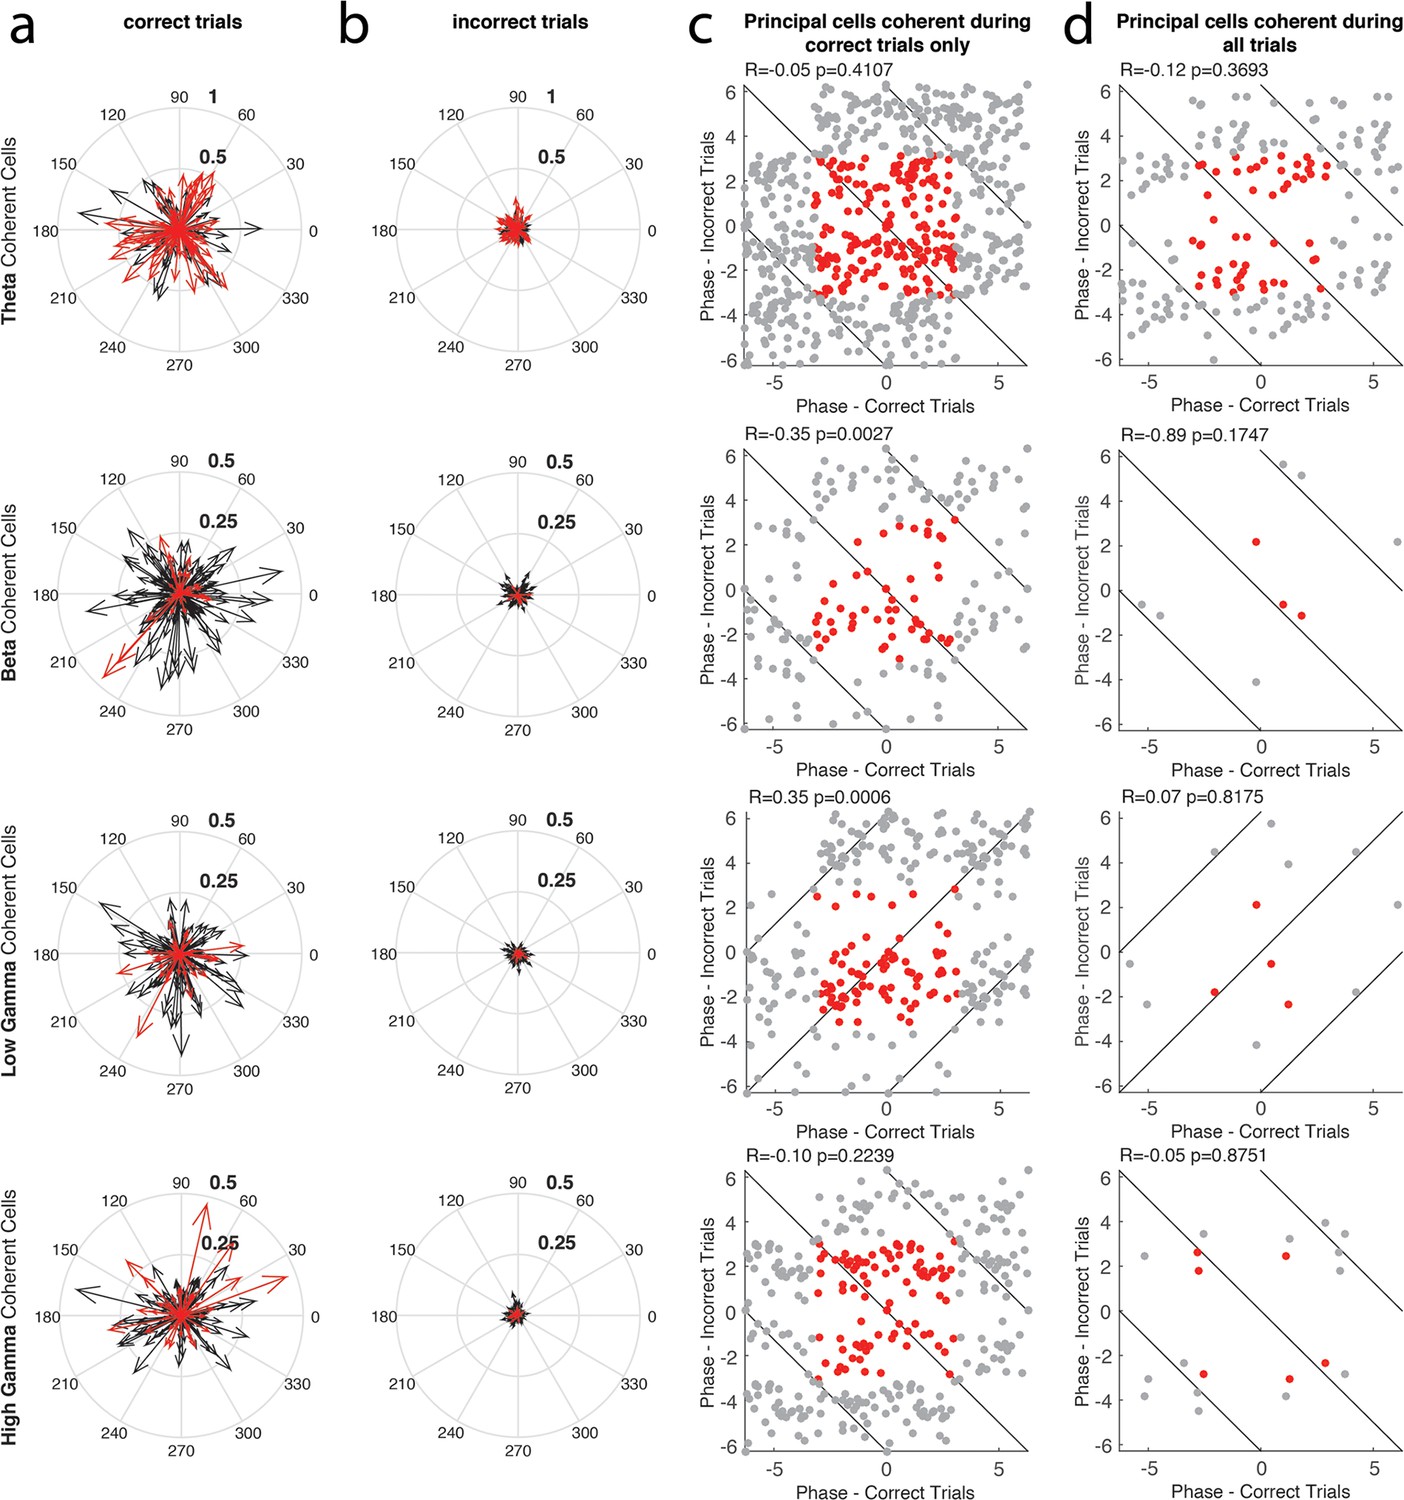
The phase of principal cell coherence to each rhythm during correct and incorrect trials.
(a) The magnitude and phase of coherence during correct trials, for every principal cell that exhibited coherence to a given rhythm during either correct or incorrect trials. Each cell is represented by a single arrow, with the length of the arrow representing the magnitude of coherence and the direction indicating the preferred phase of spiking. Principal cells that exhibited significant spike-phase coherence during correct trials (Correct Trials Only and All Trial categories) are shown in red, while cells that exhibited significant spike-phase coherence during Incorrect Trials Only are shown in black. (b) Same as in a, for incorrect trials. In this case, the principal cells that exhibited significant spike-phase coherence during incorrect trials (Incorrect Trials Only and All Trial categories) are shown in red, while cells that exhibited significant spike-phase coherence during Correct Trials Only are shown in black. (c) The preferred phase of spiking during correct trials plotted against the preferred phase of spiking during incorrect trials for principal cells that exhibited significant spike-phase coherence during Correct Trials Only (red). Gray points indicate circular repetitions of the data in red, to better visualize the circular nature of the data. Circular correlations were performed on the preferred phases observed across the population during correct and incorrect trials and are indicated at the top of each panel (d) Same as in c, for the principal cells exhibiting significant spike-phase coherence during All Trials.
Figure 5 with 3 supplements
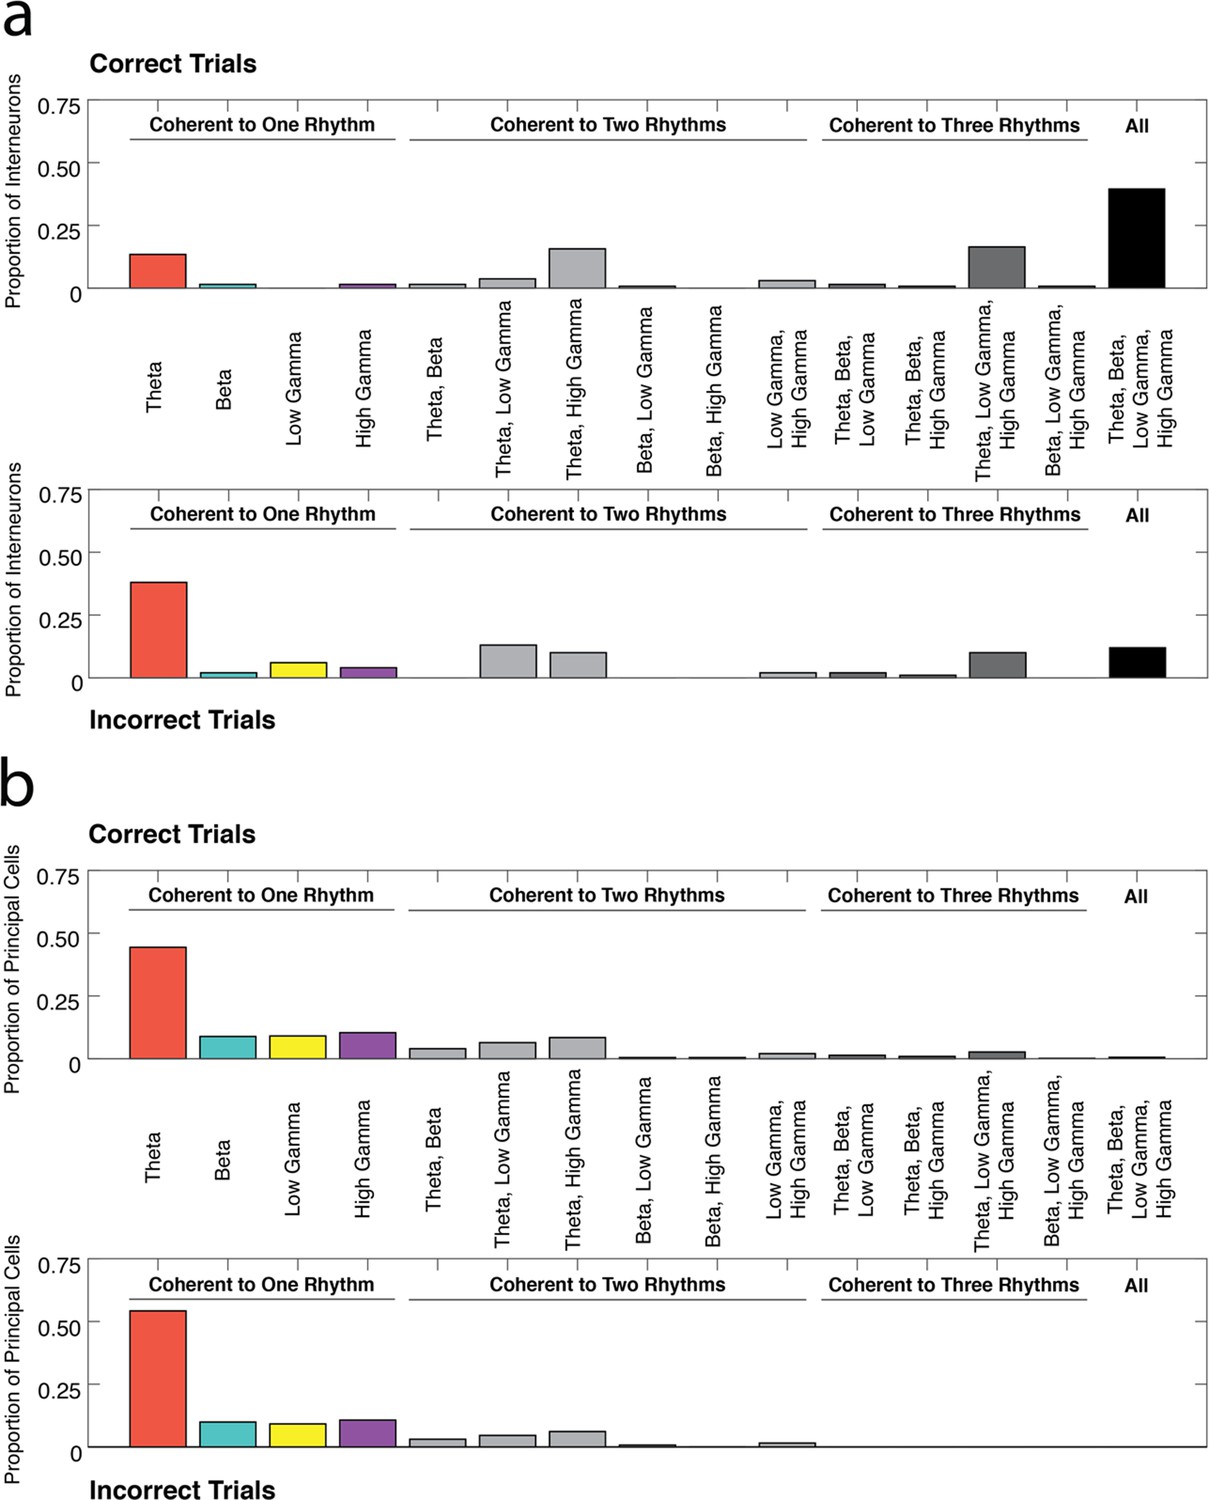
Profiles of interneuron and pyramidal cell recruitment into rhythmic circuits during correct and incorrect performance.
(a) The proportions of interneurons coherent during correct trials (top) or incorrect trials (bottom) that were coherent to each combination of the four rhythms examined in this study (theta4-12 Hz, beta15-35 Hz, low gamma35-55 Hz, and high gamma65-90 Hz). While a large proportion of interneurons demonstrate coherence to all four frequency ranges during correct trials, interneurons are often engaged in a single rhythmic circuit during incorrect trials. (b) Same as in a, for principal cells. The majority of principal cells exhibited coherence to a single rhythmic circuit during both correct and incorrect trial types. To view the number of neurons coherent during correct trials as a ratio of all the neurons coherent in each rhythmic category see Figure 5—figure supplement 1.
Figure 5—figure supplement 1
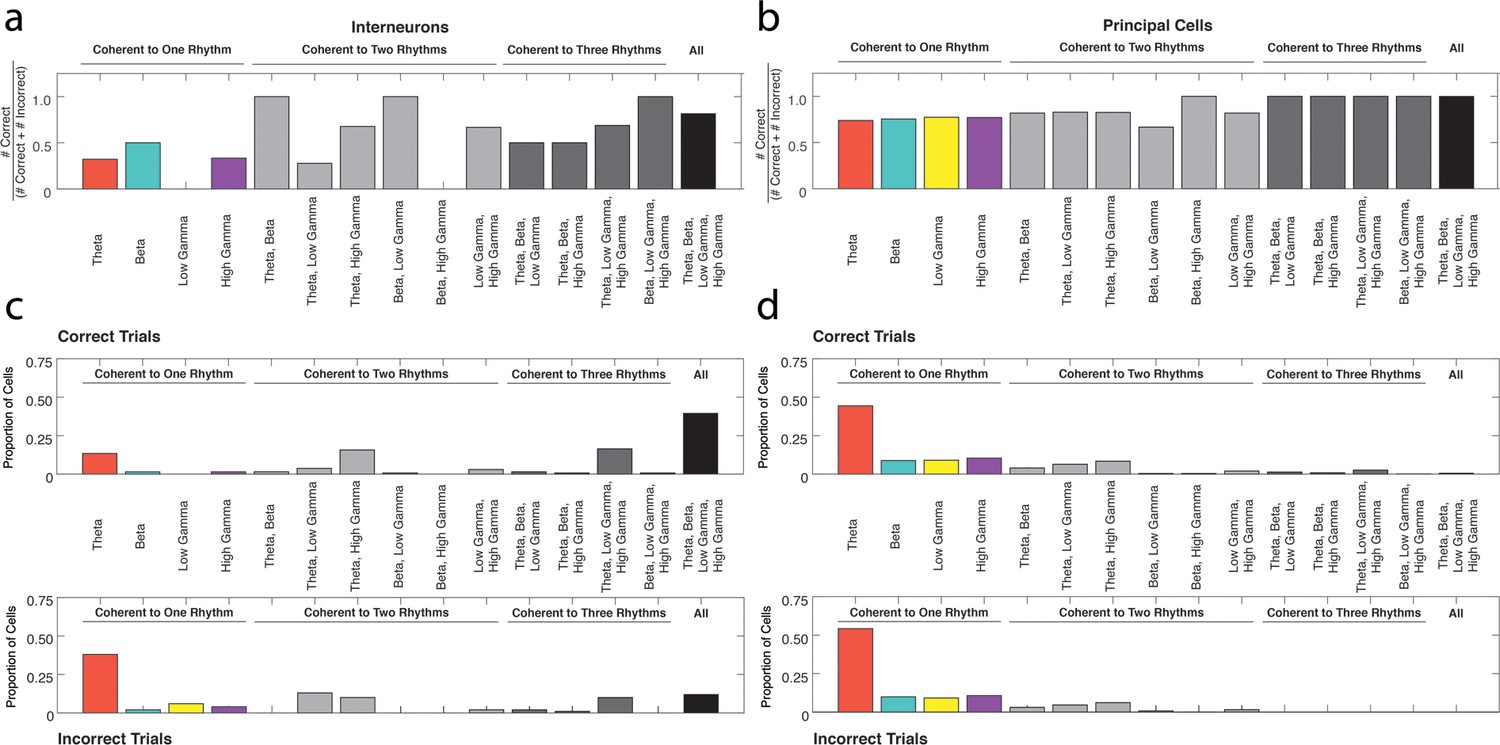
The ratio of neurons coherent during correct trials to all coherent neurons in each rhythmic category.
(a) The number of interneurons coherent during correct trials as a proportion of the numbers coherent during correct trials or incorrect trials for each rhythmic category. (b) Same as in a, for principal cells. (c) The proportions of interneurons coherent during correct trials (top) or incorrect trials (bottom) that were coherent to each combination of the four rhythms examined in this study, from Figure 5 for reference. (d) Same as in c, for principal cells.
Figure 5—figure supplement 2
Correlations of interneuron coherence for different pairs of rhythms.
Correlations between the magnitude of coherence to one frequency and the magnitude of coherence to another frequency across correct trials for interneurons that exhibited coherence to all rhythms. Each point represents the correlation value for a single interneuron. To better visualize the distribution of points, normalized 2D histograms surround the data points for every pair of frequencies.
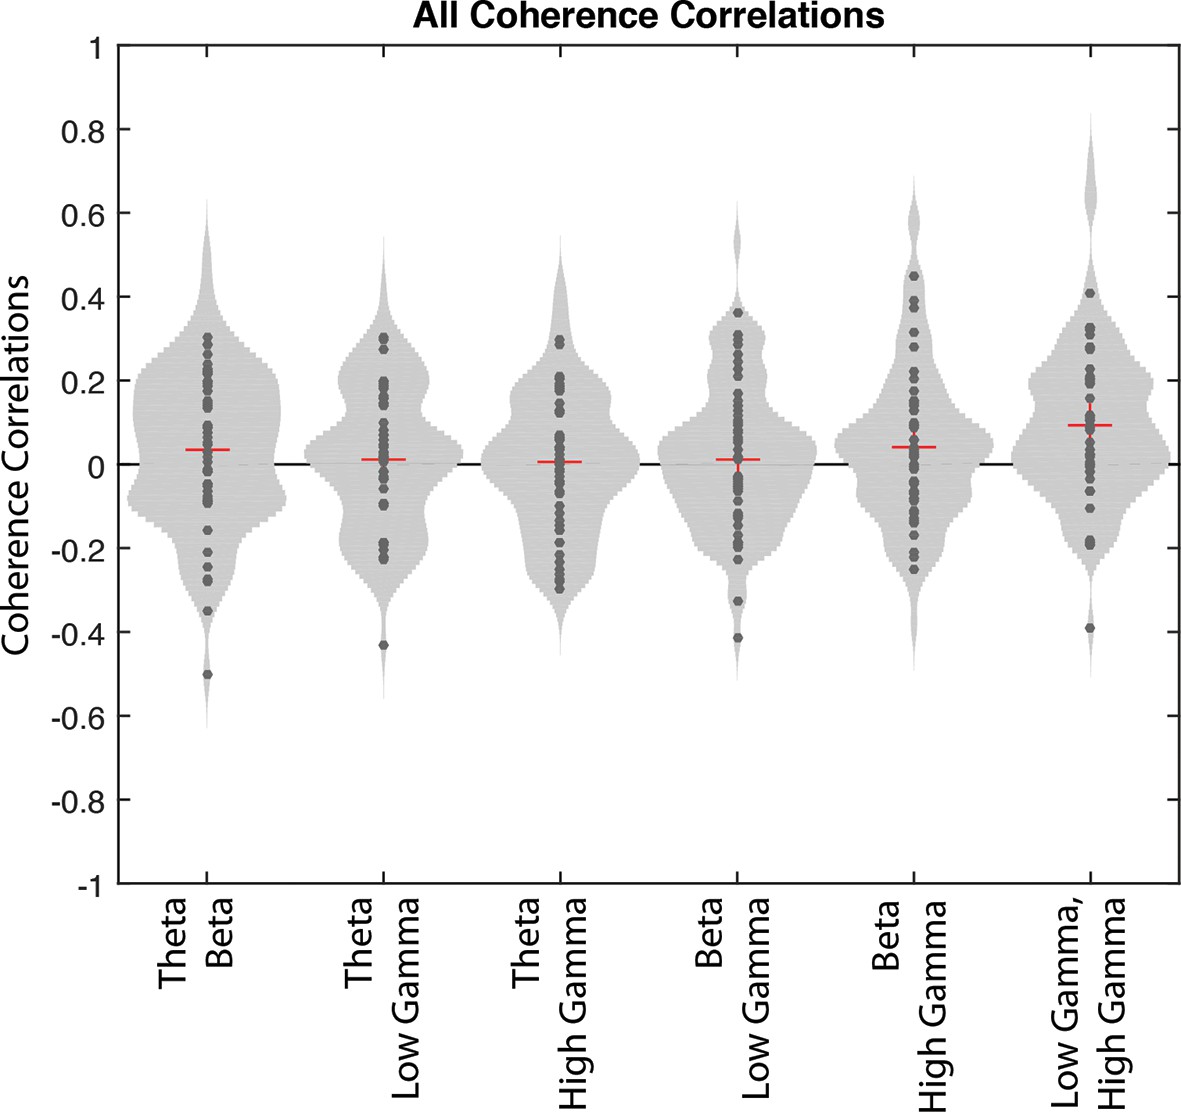
Figure 5—figure supplement 3

Amplitude correlations for different pairs of rhythms.
(a) Mean correlations between the amplitudes for every pair of frequencies, averaged across sessions. Theta4-12 Hz and low gamma35-55 Hz are often anti-correlated, while beta15-35 Hz is often strongly correlated with theta4-12 Hz and low gamma35-55 Hz. (b) The proportion of sessions exhibiting a given correlation value on the x-axis for every pair of frequencies. These correlation values were used to derive the averages in a.
Figure 6 with 4 supplements
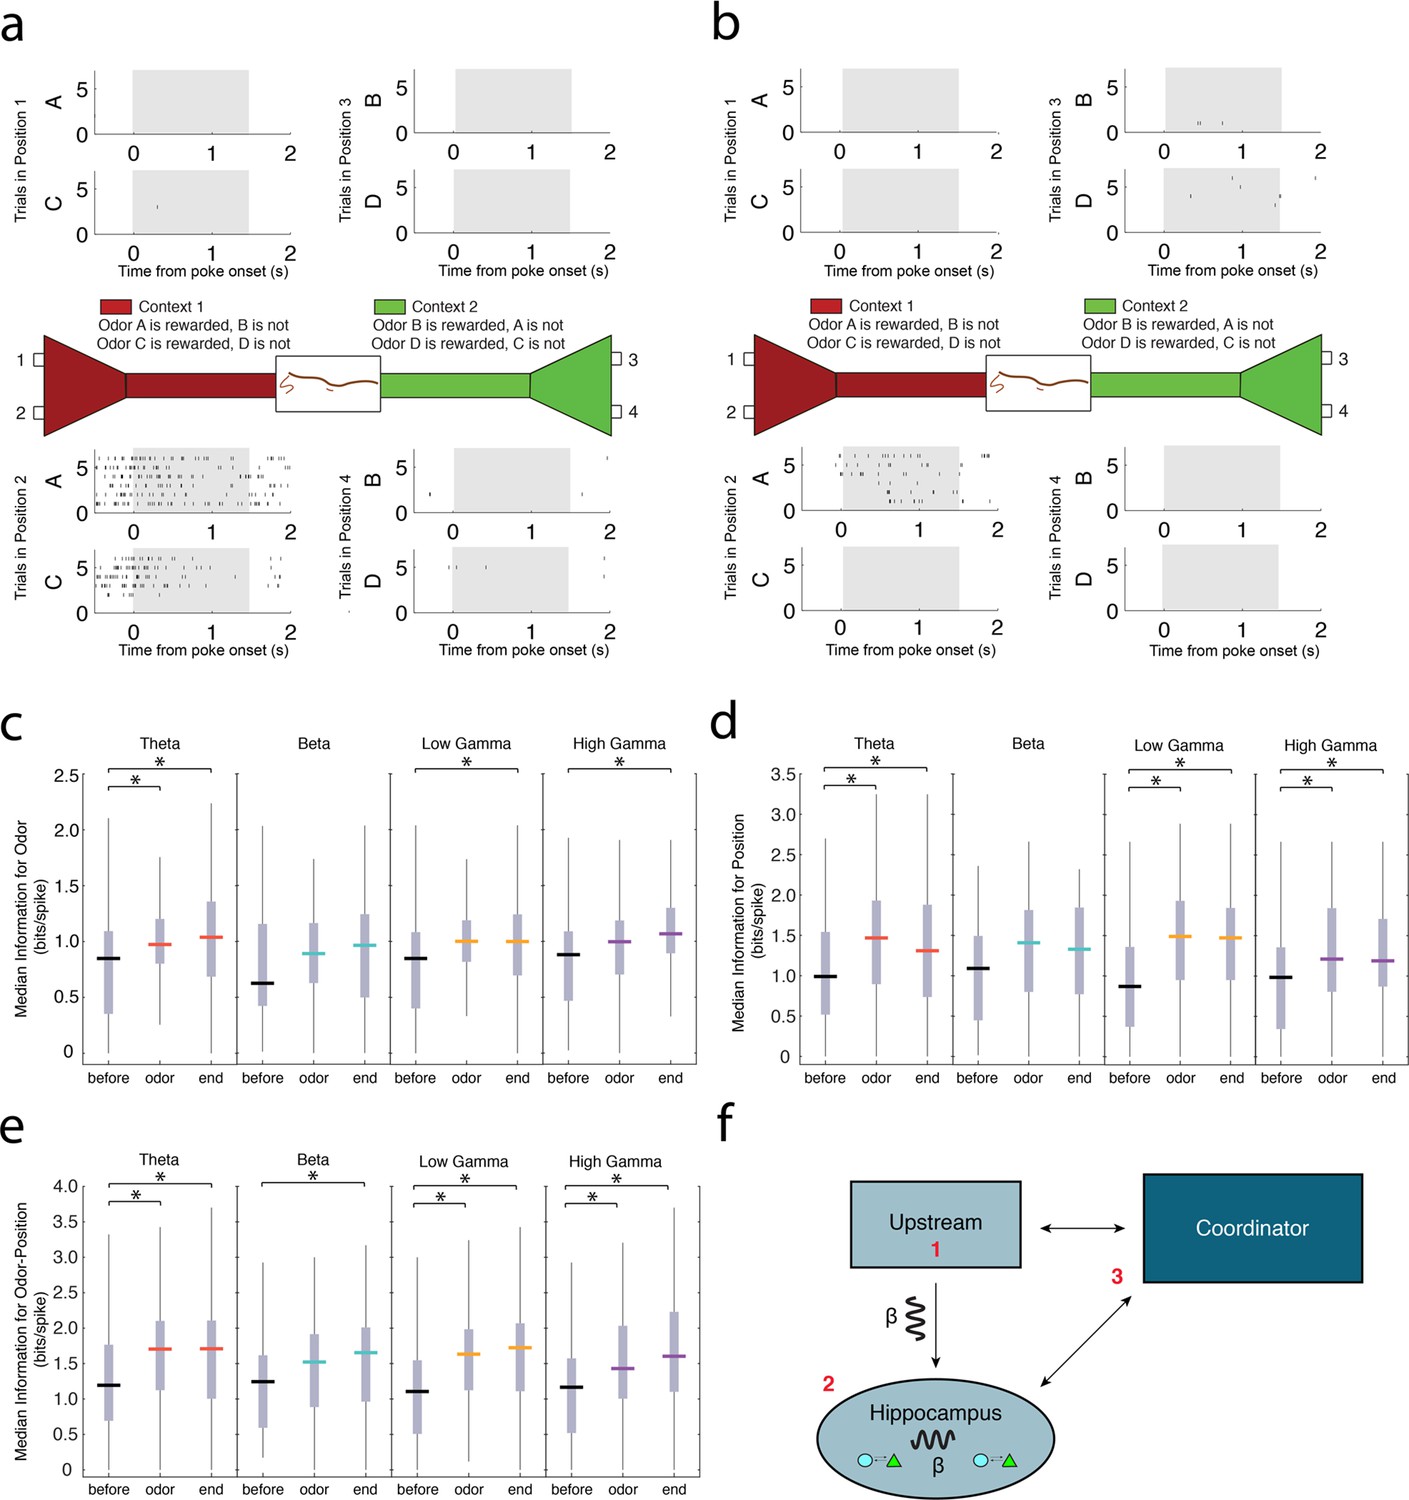
Principal cells exhibiting strong spike-phase coherence during the odor sampling contain information for task-relevant features.
(a) Representative activity of a single CA1 principal cell during the odor sampling intervals of Correct Trials Only. Each row of tick marks represents spiking during a single trial. This cell demonstrates activity selective for position 2. (b) Same as in a, showing the activity of a principal cell that is selective for the co-occurrence of odor A in position 2. For additional examples of theta4-12 Hz, beta15-35 Hz, low gamma35-55 Hz, and high gamma65-90 Hz coherent principal cells, see Figure 6—figure supplement 1–4. (c) Median information (bits/spike) in theta4-12 Hz, beta15-35 Hz, low gamma35-55 Hz, and high gamma65-90 Hz coherent populations for odors during a 500 ms interval prior to nose poke (before), 500 ms directly after odor delivery (odor), and 500 ms prior to the end of the nose poke when the rat committed to a decision (end). Vertical gray bars indicate the inter-quartile range. The top vertical line indicates q3 + 1.5 x (q3 – q1) and the bottom vertical line indicates q1 – 1.5 x (q3 – q1), where q1 and q3 are the 25th and 75th percentiles, respectively. Asterisks (*) indicate a significant pair-wise comparison using a Tukey’s Honest Significant Difference test, p<0.05. (d) Same as in c, for position information. (e) Same as in c, for odor-position information. (f) Cartoon diagram indicating potential mechanisms for the generation of the beta15-35 Hz rhythm in CA1: 1) beta15-35 Hz rhythmic input is received from an upstream structure, 2) beta15-35 Hz is an internally generated rhythm, or 3) long-range communication across multiple interacting networks is facilitated by coordination in beta15-35 Hz by a third-party structure.
Figure 6—figure supplement 1
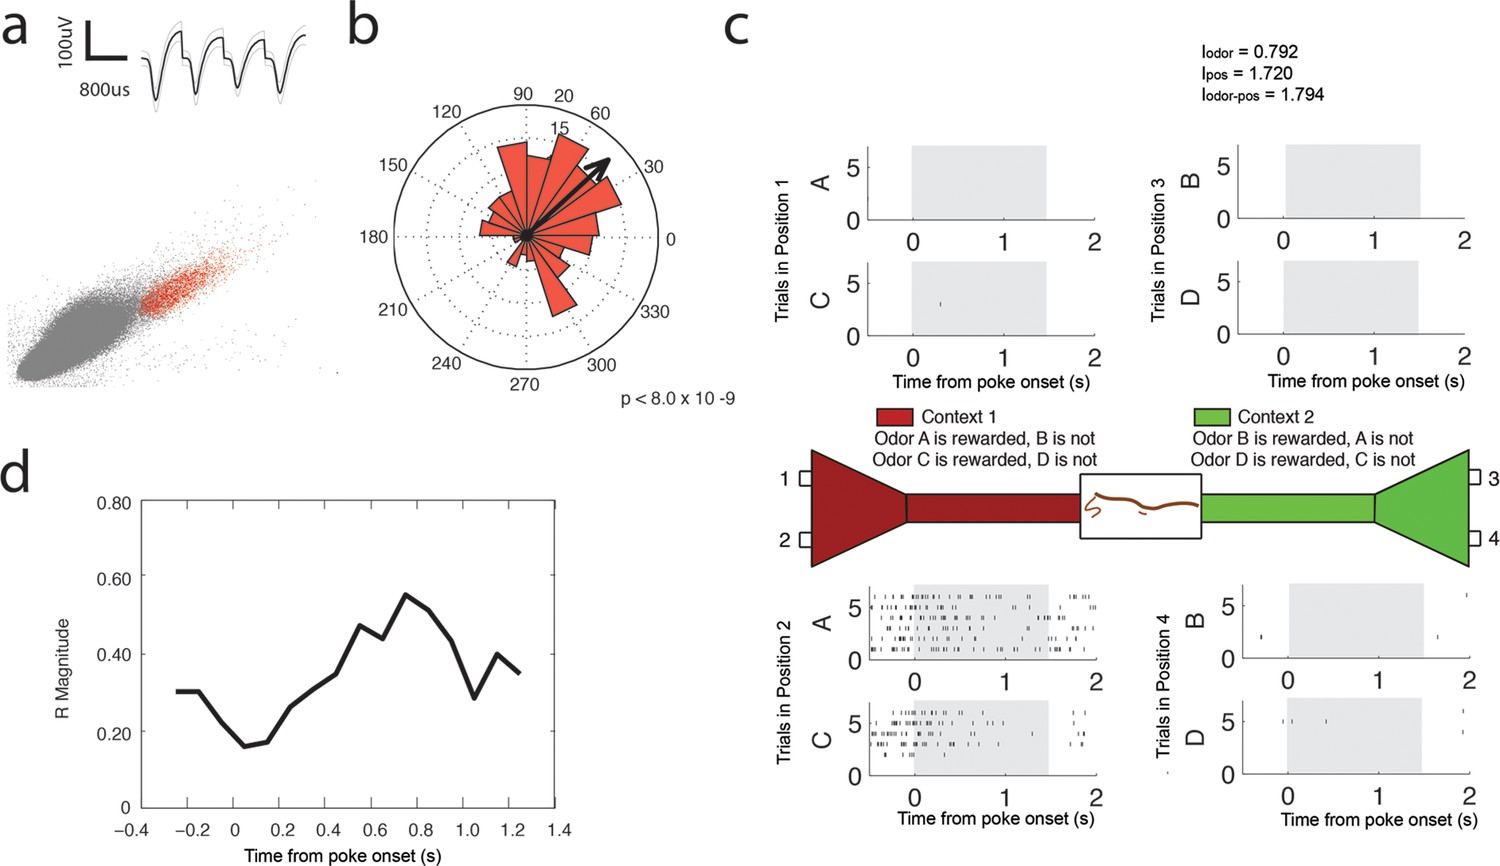
Theta (4–12 Hz) coherent principal cell.
(a) Relative waveform shape and amplitude across tetrode wires and clustering of spike features. (b) Circular histogram representing the phase of theta4-12 Hz at the time of each spike with the direction of the mean resultant length vector (R) shown by the arrow in black. Histograms were calculated from spiking activity during odor sampling intervals, during correct trials only. (c) Spiking activity of the cell during odor sampling of correct odors. Pairs of odors are differentially rewarded depending upon the context in which they are presented. Each row of tick marks represents spiking during a single trial. This cell exhibits activity that is selective for Position 2, for both odors rewarded in that position. The spiking activity of this cell contains significant information (see Materials and methods) for odors, positions, and odor-position combinations. Information scores are indicated in the top right. (d) Magnitude of the mean resultant length vector over the time course of nose pokes leading to a correct choice. The strength of theta4-12 Hz coherence is greatest at 0.75 s after nose poke onset.
Figure 6—figure supplement 2
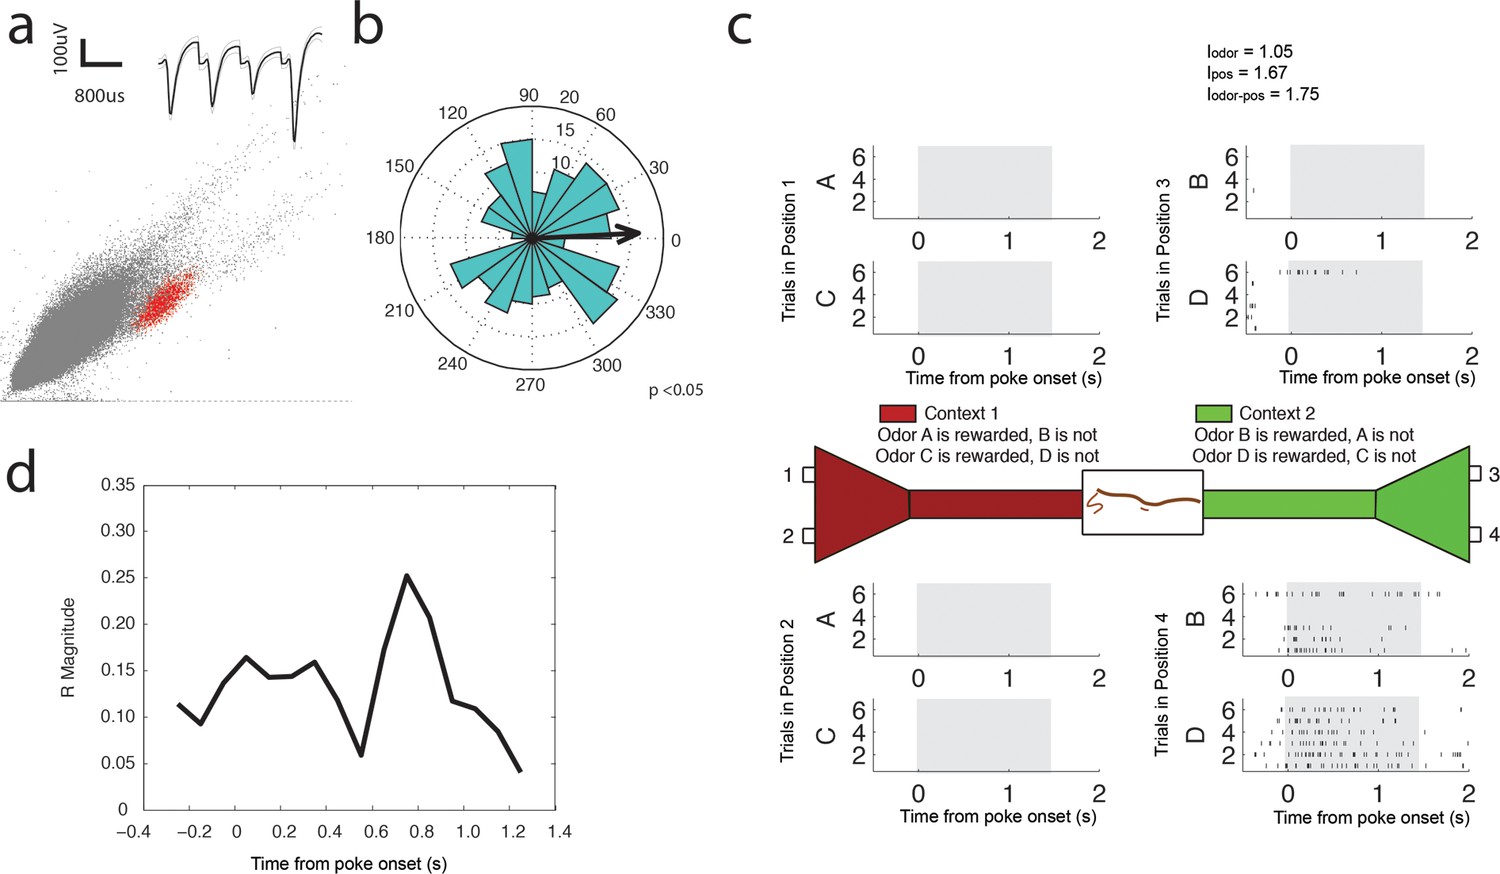
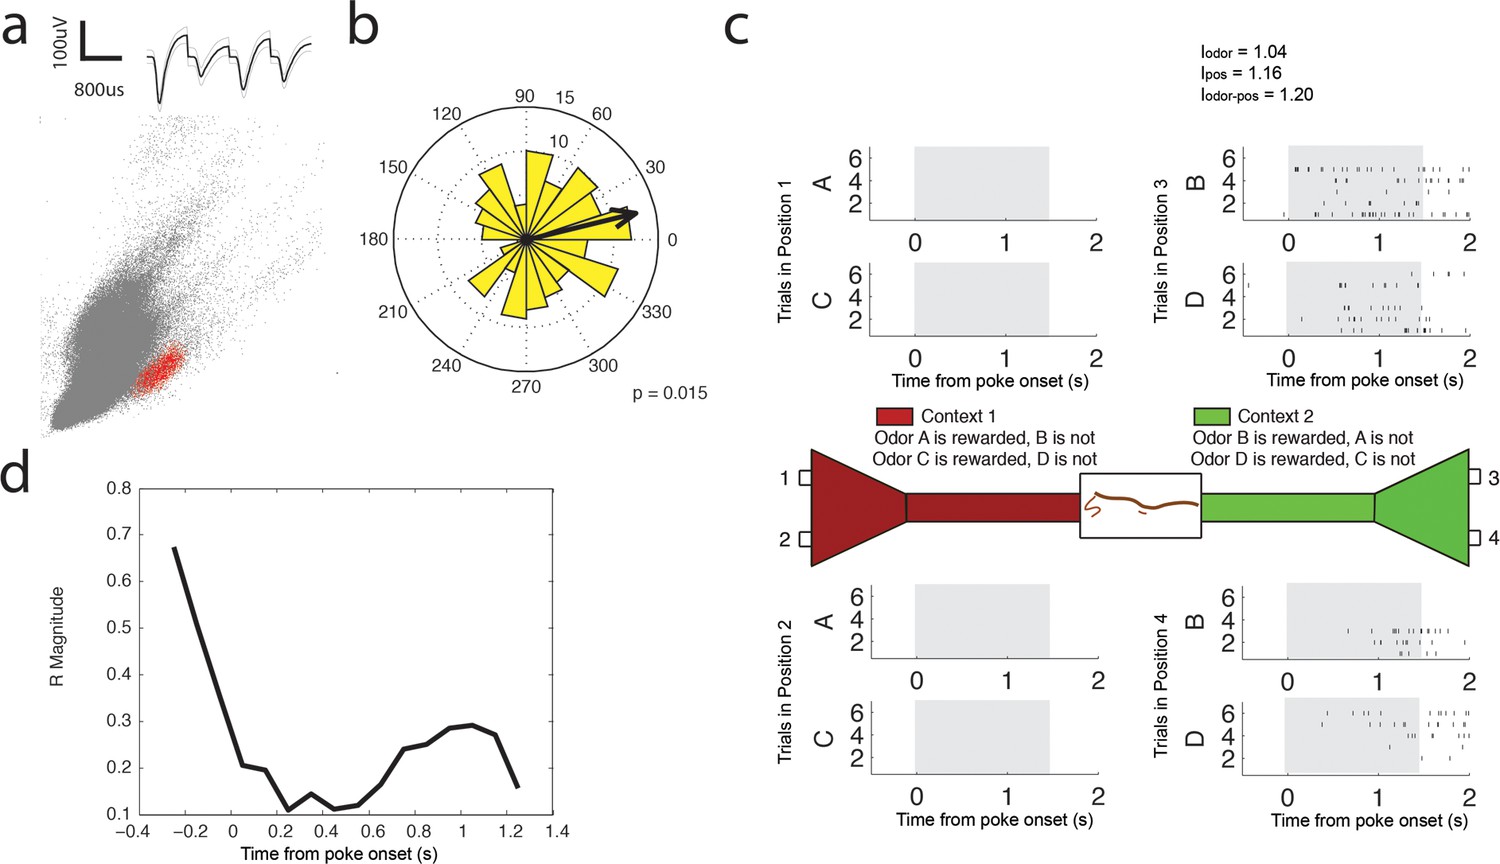
Beta (15–35 Hz) coherent principal cell.
(a) Relative waveform shape and amplitude across tetrode wires and clustering of spike features. (b) Circular histogram representing the phase of beta15-35 Hz at the time of each spike with the direction of the mean resultant length vector (R) shown by the arrow in black. Histograms were calculated from spiking activity during odor sampling intervals, during correct trials only. (c) Spiking activity of the cell during odor sampling of correct odors. Pairs of odors are differentially rewarded depending upon the context in which they are presented. Each row of tick marks represents spiking during a single trial. This cell exhibits activity that is selective for Position 4, for both odors rewarded in that position. The spiking activity of this cell contains significant information (see Materials and methods) for odors, positions, and odor-position combinations. Information scores are indicated in the top right. (d) Magnitude of the mean resultant length vector over the time course of nose pokes leading to a correct choice. The strength of beta15-35 Hz coherence is greatest at 0.75 s after nose poke onset.
Figure 6—figure supplement 3
Low Gamma (35–55 Hz) coherent principal cell.
(a) Relative waveform shape and amplitude across tetrode wires and clustering of spike features. (b) Circular histogram representing the phase of low gamma35-55 Hz at the time of each spike with the direction of the mean resultant length vector (R) shown by the arrow in black. Histograms were calculated from spiking activity during odor sampling intervals, during correct trials only. (c) Spiking activity of the cell during odor sampling of correct odors. Pairs of odors are differentially rewarded depending upon the context in which they are presented. Each row of tick marks represents spiking during a single trial. This cell exhibits activity that is selective for Position 3 and Position 4, for both odors rewarded in that position. The spiking activity of this cell contains significant information (see Materials and methods) for odors, positions, and odor-position combinations. Information scores are indicated in the top right. (d) Magnitude of the mean resultant length vector over the time course of nose pokes leading to a correct choice. The strength of low gamma35-55 Hz coherence is greatest prior to odor sampling, and at 1.05 s after nose poke onset.
Figure 6—figure supplement 4

High Gamma (65–90 Hz) coherent principal cell.
(a) Relative waveform shape and amplitude across tetrode wires and clustering of spike features. (b) Circular histogram representing the phase of high gamma65-90 Hz at the time of each spike with the direction of the mean resultant length vector (R) shown by the arrow in black. Histograms were calculated from spiking activity during odor sampling intervals, during correct trials only. (c) Spiking activity of the cell during odor sampling of correct odors. Pairs of odors are differentially rewarded depending upon the context in which they are presented. Each row of tick marks represents spiking during a single trial. This cell exhibits activity that is selective for Position 3, for both odors rewarded in that position. The spiking activity of this cell contains significant information (see Materials and methods) for odors, positions, and odor-position combinations. Information scores are indicated in the top right. (d) Magnitude of the mean resultant length vector over the time course of nose pokes leading to a correct choice. The strength of high gamma65-90 Hz coherence is greatest at 0.25 s after nose poke onset and peaks again at 1.15 s after nose poke onset.
Author response image 1
Download links
A two-part list of links to download the article, or parts of the article, in various formats.
Downloads (link to download the article as PDF)
Open citations (links to open the citations from this article in various online reference manager services)
Cite this article (links to download the citations from this article in formats compatible with various reference manager tools)
Rhythmic coordination of hippocampal neurons during associative memory processing
eLife 5:e09849.
https://doi.org/10.7554/eLife.09849


