RNA polymerase errors cause splicing defects and can be regulated by differential expression of RNA polymerase subunits
- Universitat Pompeu Fabra, Spain
Figures
Figure 1 with 2 supplements
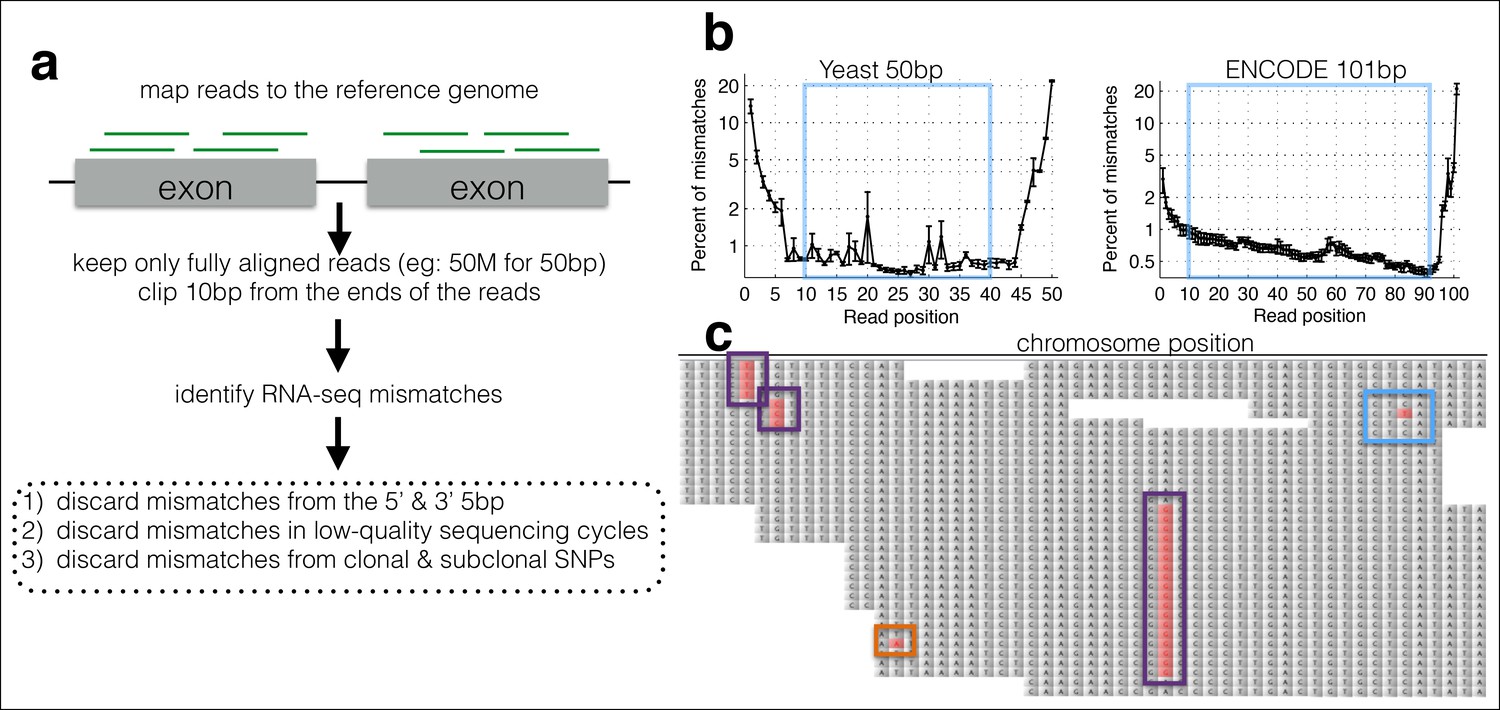
A computational framework to measure relative changes in RNA polymerase fidelity.
(a) Pipeline to identify potential RNA polymerase errors in RNA-seq data. High quality full-length RNA-seq reads are mapped to the reference genome or transcriptome using bwa, and only reads that map completely with two or fewer mismatches are kept. (b) Then 10 bp from the front and 10 bp from the end of the read are discarded as these regions have high error rates and are prone to poor quality local alignments. (c) Errors that occur multiple times (purple boxes) are discarded, as these are likely due to subclonal DNA mutations or motifs that sequence poorly on the HiSeq. Unique errors in the middle of reads (cyan box) are kept and counted.
Figure 1—figure supplement 1
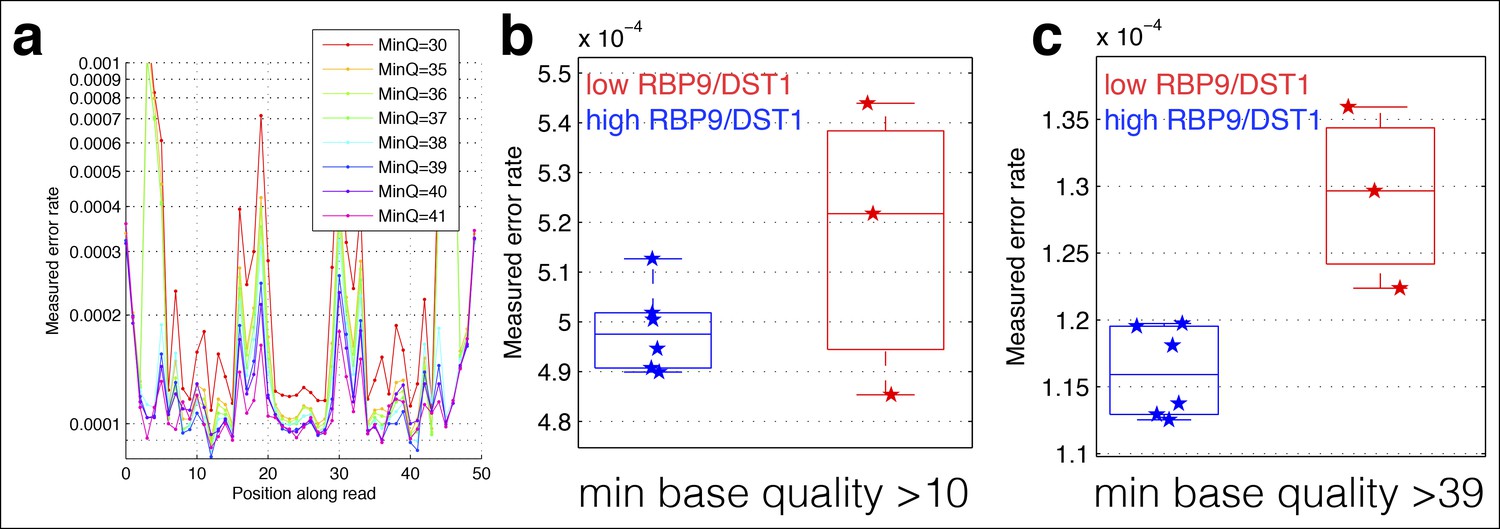
Cycle-specific error rates and better differentiation of genetically determined error rates using base quality value cutoffs.
Six yeast RNA-cDNA libraries were sequenced on the same lane in a HiSeq. (a) The average mismatch rate (across the six cDNA libraries) to the reference genome at each position was determined using different minimum base-quality thresholds using GATK ErrorRatePerCycle. Independent of the quality threshold, cycles at the ends, as well as some cycles in the middle, have high error rates. (b) The measured error rate for each sample using a minimum base quality of 10. (c) The measured error rate for each sample using a minimum base quality of 39.
Figure 1—figure supplement 2
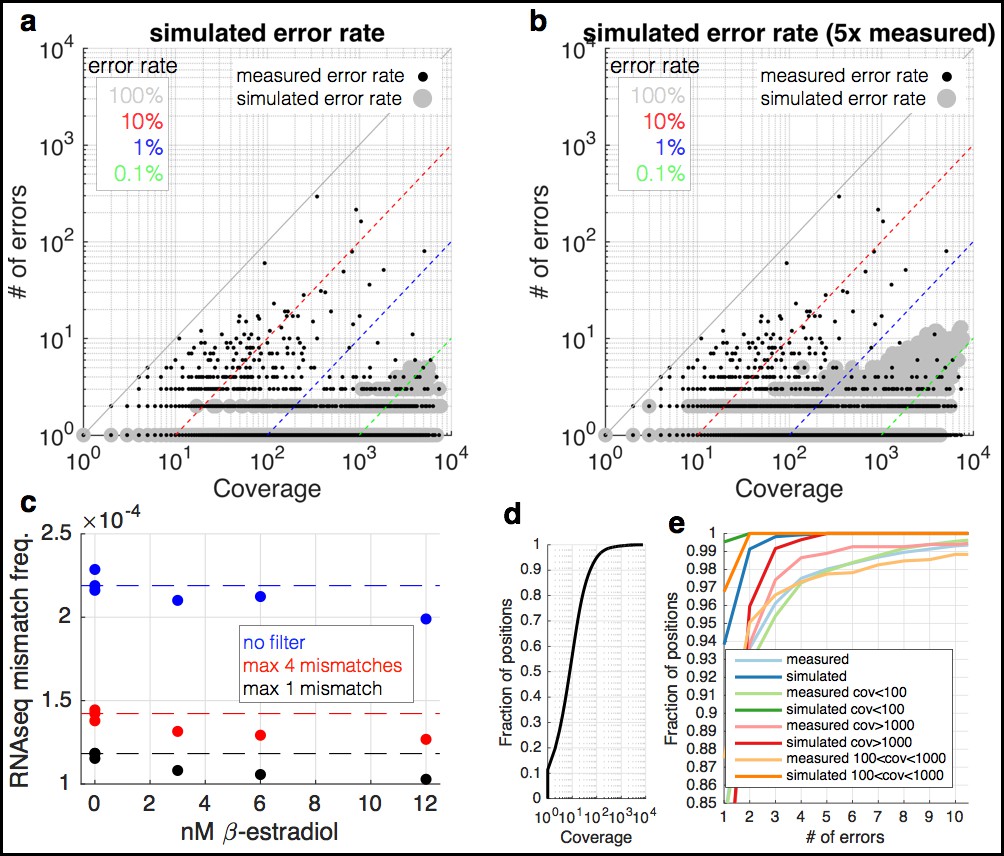
RNA-seq data are enriched for mismatches to the reference genome that occur far more often than expected.
(a) At each coverage (x-axis), a point is shown if there is any position in the genome with the observed number of errors (y-axis) (small black dots). The diagonal lines show mismatch frequencies of 100%, 10%, 1%, and 0.1% – any point falling on these lines has the given mismatch frequency. With large grey circles are shown simulated data in which the same coverage as the yeast RNA-seq data are used, but with a mismatch frequency identical to the measured overall mismatch frequency of the yeast data. Locations in the graph in which a black point occurs but there is no grey point are locations in which there are more mismatches than expected by change. Note that at a coverage of <100, we expect to see no mismatches more than twice, and 0.5% of positions with two observances of identical mismatches. (b) Identical to (a) but with the simulated mismatch frequency five times the observed. (c) Shown are measured mismatch frequencies for the yeast RPB9 and DST1 induction data at different β-estradiol concentrations, at different filters for the maximal allowed number of observed identical mismatches. The dashed lines show the average mismatch frequency for the 0 nM condition. For all filters, low β-estradiol conditions have higher RNA-seq mismatch frequencies. (d) The coverage of the yeast RNA-seq data; ~95% of the genome is covered by <100 reads. (e) Shown are the fraction of positions in the genome (y-axis) with X errors (x-axis) for the yeast RNA-seq data (cyan) and simulated data (blue). Also shown are the same data for positions of the genome with different coverage. For positions covered by <1000 reads (95% of the genome) the expectation is 0 or 1 sequence mismatch (blue and orange lines). Positions with far greater numbers of mismatches are likely due to subclonal mutations and technical bias.
Figure 2 with 2 supplements
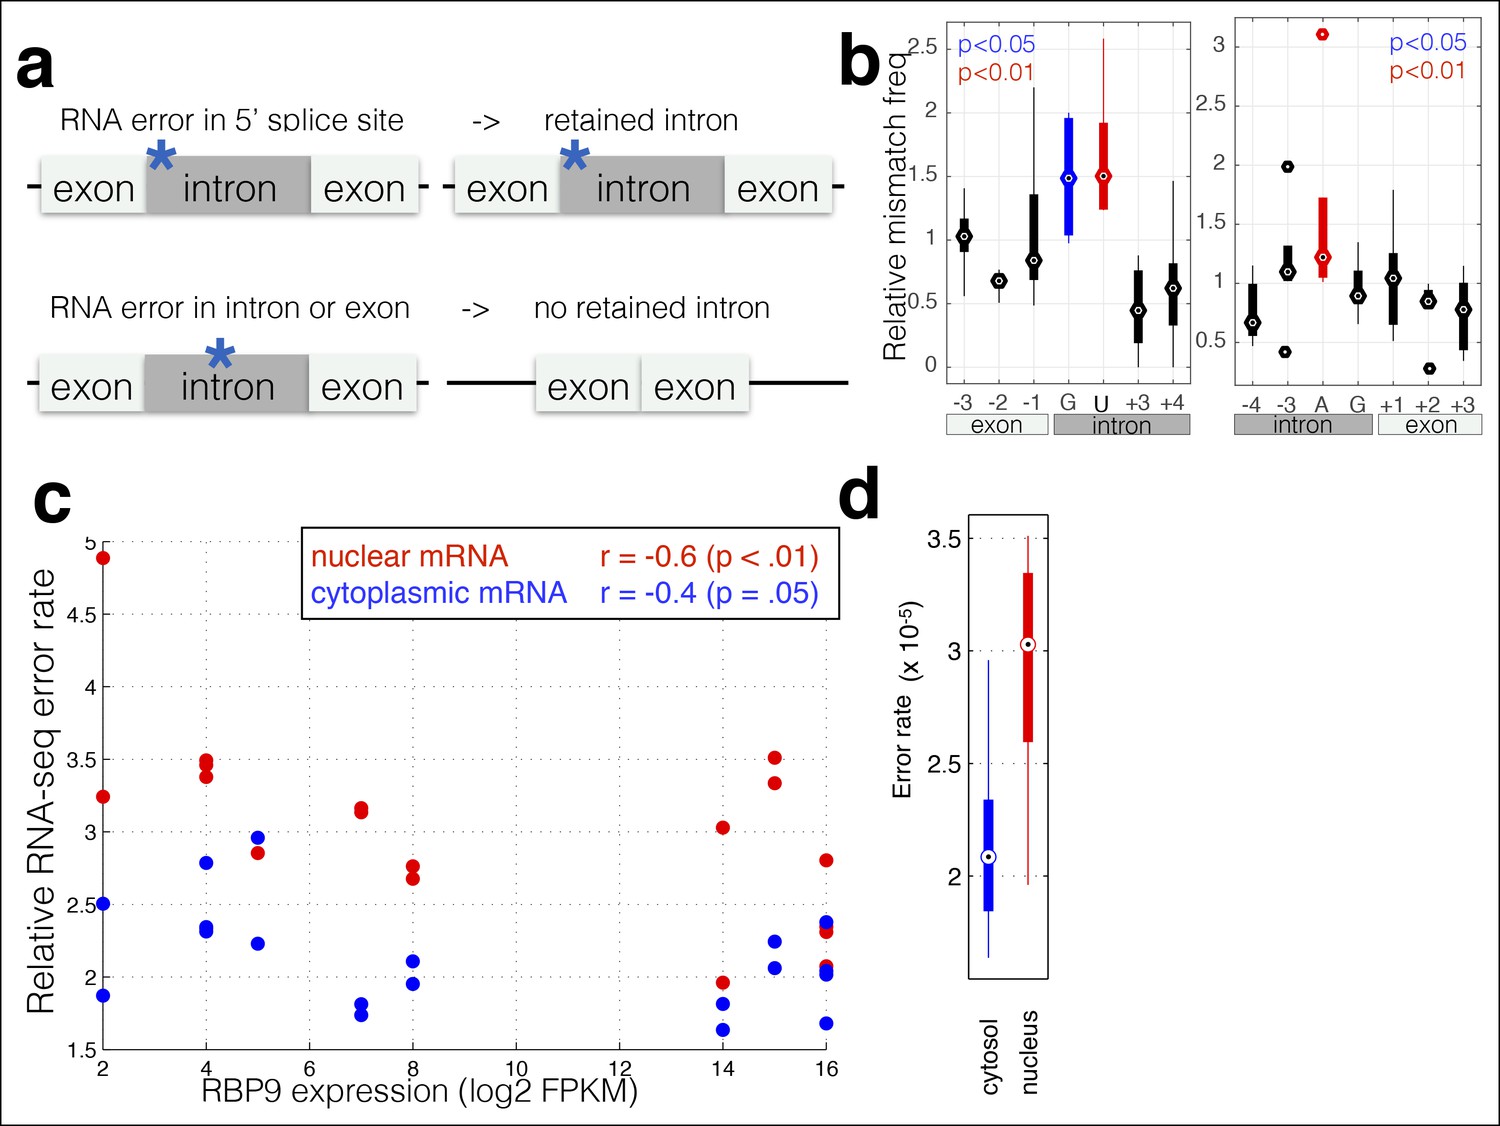
RNA polymerase errors cause intron retention and error rates are correlated with RPB9 expression.
(a) RNA polymerase errors at the splice junction should result in intron retention, as DNA mutations at the 5’ donor site are known to cause intron retention. (b) Shown are the RNA-seq mismatch rates at each position relative to the 5’ donor splice site, for sequencing reads that span an exon–intron junction. Mismatch rates from chromatin-associated and nuclear RNAs are higher at the 5’ and 3’ splice sites, suggesting that RNA polymerase errors at this site result in intron retention. (c) For all ENCODE cell lines, RPB9 expression was determined from whole-cell RNA-seq data, and the RNA-seq error rate was measured separately for the cytoplasmic and nuclear fractions. (d) The RNA-seq error rate is higher (paired t-test, p=0.0019) in the nuclear than the cytoplasmic fraction, suggesting that quality-control mechanism may block nuclear export of low quality mRNAs.
Figure 2—figure supplement 1

RNA-seq mismatch rates for all trinucleotides in chromatin-associated and nuclear RNAs.
(a,b) The 5’ and 3’ splicing motifs in the human genome. (c) The RNA-seq mismatch frequencies for all single nucleotides. (d) The RNA-seq mismatch rate to the reference genome for each trinucleotide, normalized to the average mismatch rate across all trinucleotides. For each trinucleotide, red shows the mismatch frequency at the first base, blue at the second, and green at the third. Error bars are standard deviation across all samples.
Figure 2—figure supplement 2

RBP9 expression negatively correlates with RNA-seq mismatch rates.
The mismatch frequency is shown across all cells lines. (a) RPB9 mRNA expression is normalized by the median expression level of all subunits. (b) RPB9 mRNA expression is normalized by RBP3 (POLR2C) expression.
Figure 3 with 2 supplements
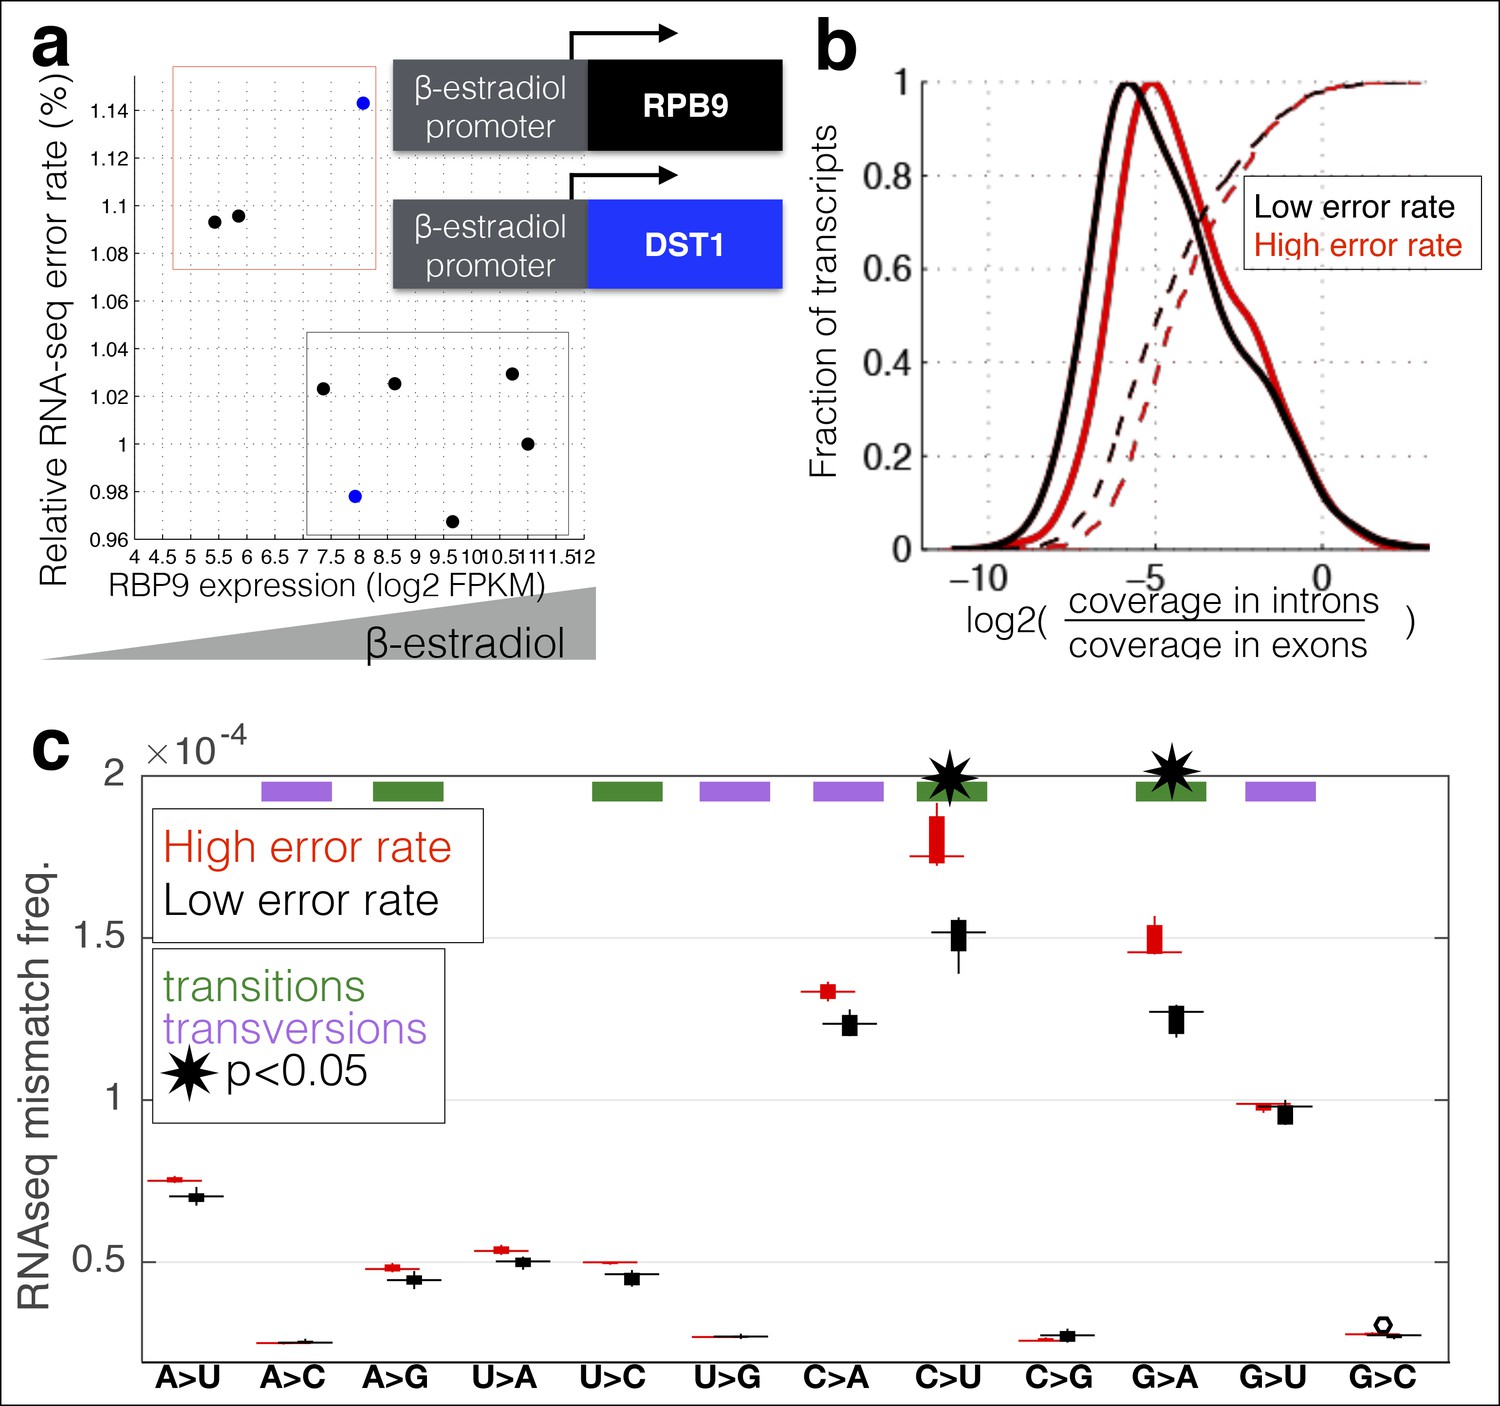
RNA polymerase error rate is determined by the expression level of RPB9 and DST1.
(a) RNA-seq error rates I re-measured for two strains (Z3EVpr-RPB9, black points, Z3EVpr-DST1, blue points) grown at different concentrations of β-estradiol. The points show the relationship between RPB9 expression levels (determined by RNA-seq) and RNA-seq error rates. The blue points show RPB9 expression levels for the Z3EVpr-DST1 strain, in which DST1 expression ranges from 16 fragments per kilobase per million (FPKM) at 0 nM β-estradiol to 120 FPKM native expression to 756 FPKM at 25 nM β-estradiol. Low induction of both DST1 or RPB9 results in high RNA-seq error rates (red box), while wild-type and higher induction levels result in low RNA-seq error rates (black box). (b) Across all genes, the intron retention rate is higher in conditions with low RNA polymerase fidelity (t-test between high and low error rate samples, p=0.029), consistent with the hypothesis that RNA polymerase errors result in splicing defects. (c) The error rate for each of the 12 single base changes are shown for induction experiments that gave high (red) or low (black) RNA-seq error rates. Transitions (G<–>A, C<–>U) are marked with green boxes and transversions (A<–>C, G<–>U) with purple.
Figure 3—figure supplement 1
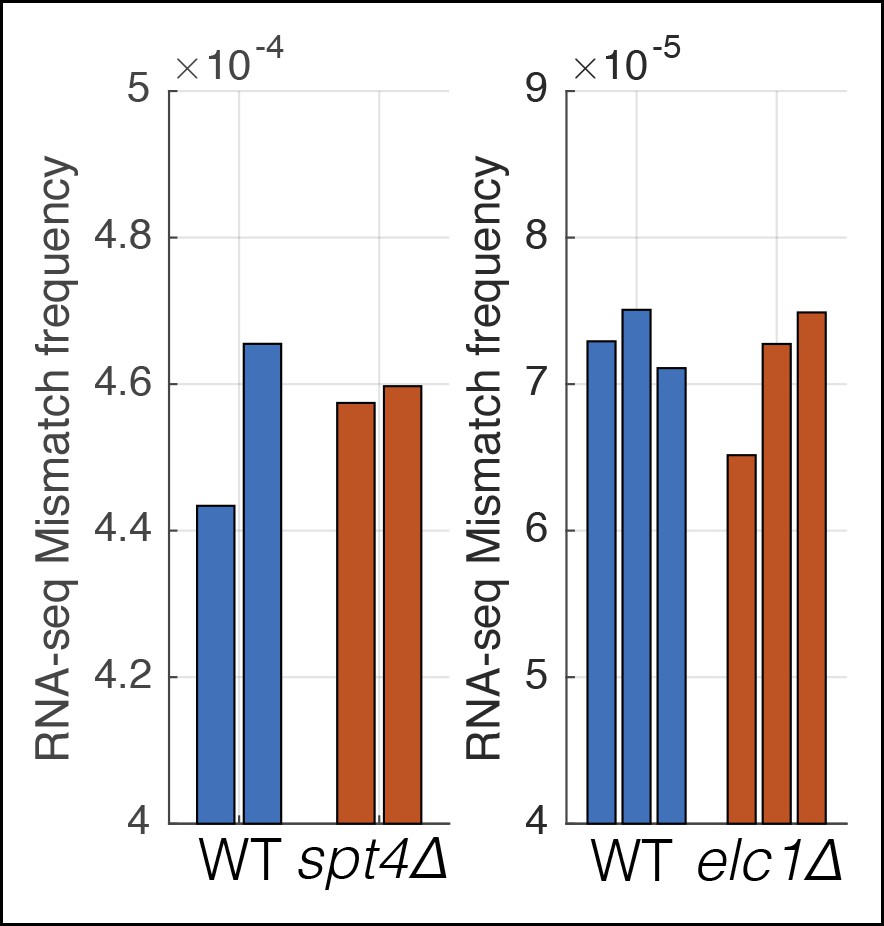
Mutations that affect transcription elongation do not affect measured RNA-seq mismatch frequencies.
Two separate experiments were performed with wild-type controls and mutants involved in transcription elongation. Individual bars show the RNA-seq mismatch frequency of biological replicates.
Figure 3—figure supplement 2

Decreases in RPB9 and DST1 expression in yeast results in more single base insertions in RNA-seq data.
For each RNA-seq dataset, the number of inserts (+N) or deletions (–N) in the mpileup output (N is the number of bases in the indel) were counted, and this number divided by the total number of mapped reads in each sample. On the right are the same data but zoomed in on each metric to better show the comparison between the two sets of samples.
Figure 4

In-frame stop codons are less likely to be created by polymerase errors.
For all genes in yeast, I calculated the number of codons which are one polymerase error from a stop codon. (a) Fewer in-frame codons can be turned into a stop codon by a single-nucleotide change, compared to out-of-frame codons. (b) Codons that are one error away from generating an in-frame stop codon are more likely to be found at the ends of the open reading frames (ORFs), compared to the beginning of the ORF.
Download links
A two-part list of links to download the article, or parts of the article, in various formats.
Downloads (link to download the article as PDF)
Open citations (links to open the citations from this article in various online reference manager services)
Cite this article (links to download the citations from this article in formats compatible with various reference manager tools)
RNA polymerase errors cause splicing defects and can be regulated by differential expression of RNA polymerase subunits
eLife 4:e09945.
https://doi.org/10.7554/eLife.09945


