Group identification drives brain integration for collective performance
- Shanghai Key Laboratory of Mental Health and Psychological Crisis Intervention, Affiliated Mental Health Center (ECNU), School of Psychology and Cognitive Science, East China Normal University, China
- Institute of Wisdom in China, East China Normal University, China
- Shanghai Changning Mental Health Center, China
Figures
Figure 1

Group identification leads to differences in collective performance.
(A) Manipulated group identification led to group differences in collective performance. (B) Group identification was positively correlated with better collective performance. The Pearson’s correlation and its associated analyses were based on the data from group identification_2. *p < 0.05.
Figure 2
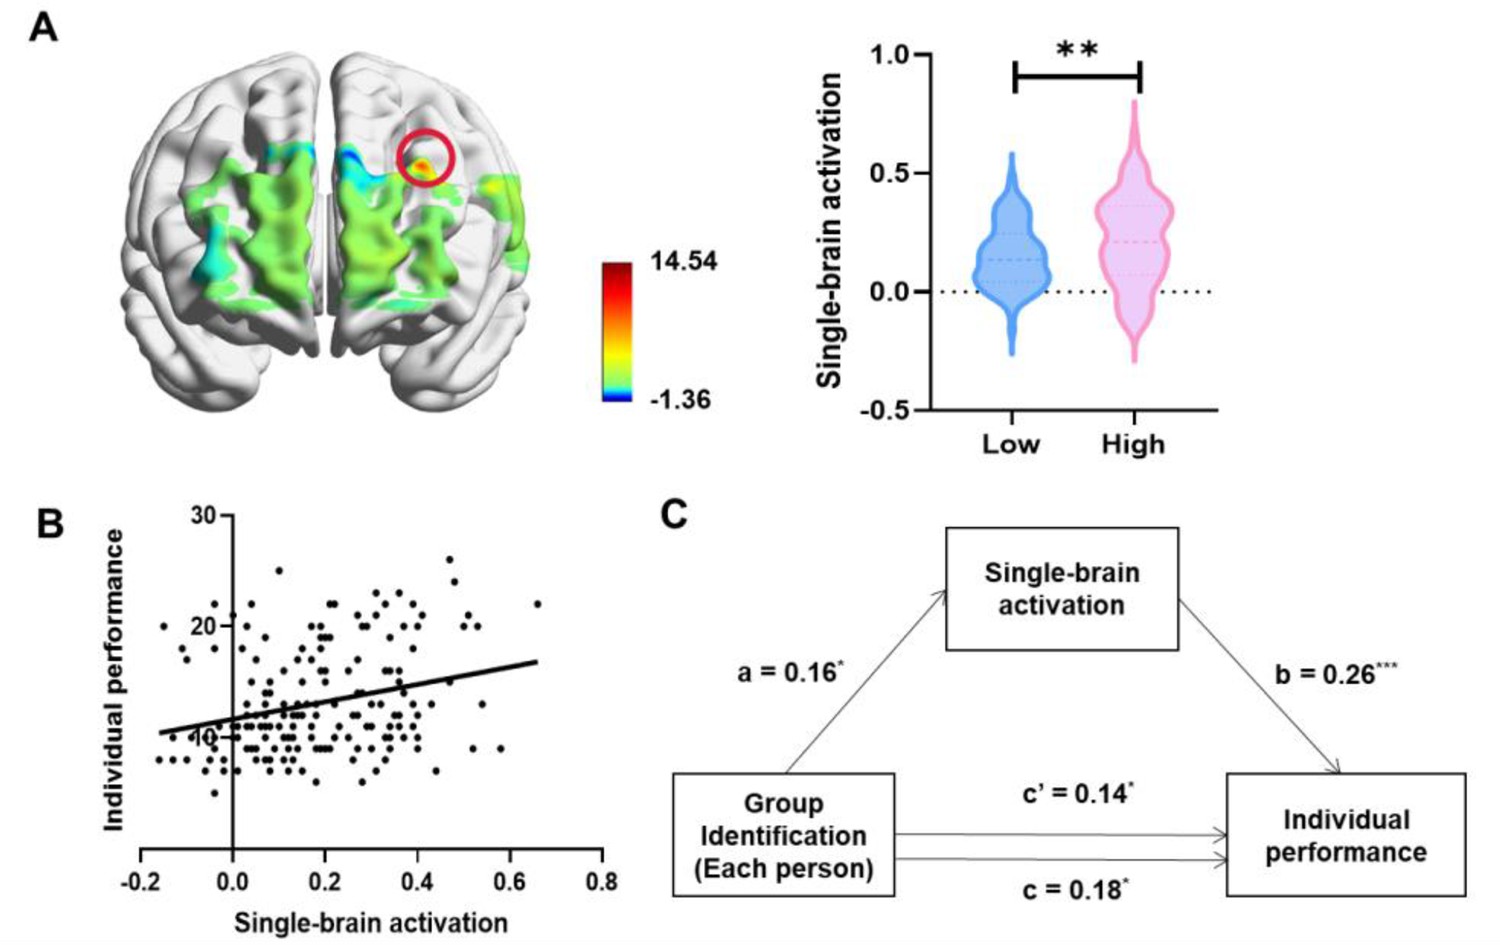
The differences in collective performance are correlated with single-brain activation.
(A) Significant differences in single-brain activations between the High and Low Group Identification groups were observed in the dorsolateral prefrontal cortex (DLPFC) (CH4). (B) Greater single-brain activation in the DLPFC (CH4) was associated with higher individual performance. (C) A serial mediation model suggested that single-brain activation mediated the relationship between group identification of each person and individual performance. *p < 0.05, **p < 0.01, ***p < 0.001.
Figure 3 with 1 supplement

The differences in collective performance are correlated with neural synchronization.
(A) A significant difference between the High and Low Group Identification groups in the orbitofrontal cortex (OFC) (CH21) was observed (p-value, false discovery rate [FDR] corrected). (B) Greater group neural synchronization (GNS) in the OFC (CH21) was associated with higher collective performance. (C) A mediation model suggested that GNS mediated the relationship between group identification of each group and collective performance. *p < 0.05, **p < 0.01.
Figure 3—figure supplement 1
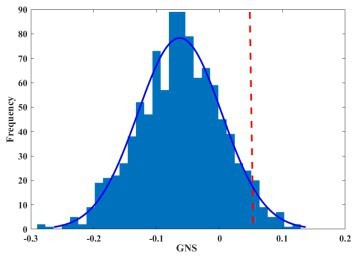
A permutation analysis confirmed that the enhanced intergroup coupling shown was group-specific.
The figure showed the distribution of the permutated average intergroup coupling enhancement. The black lines indicated the positions of the true means of the original groups.
Figure 4
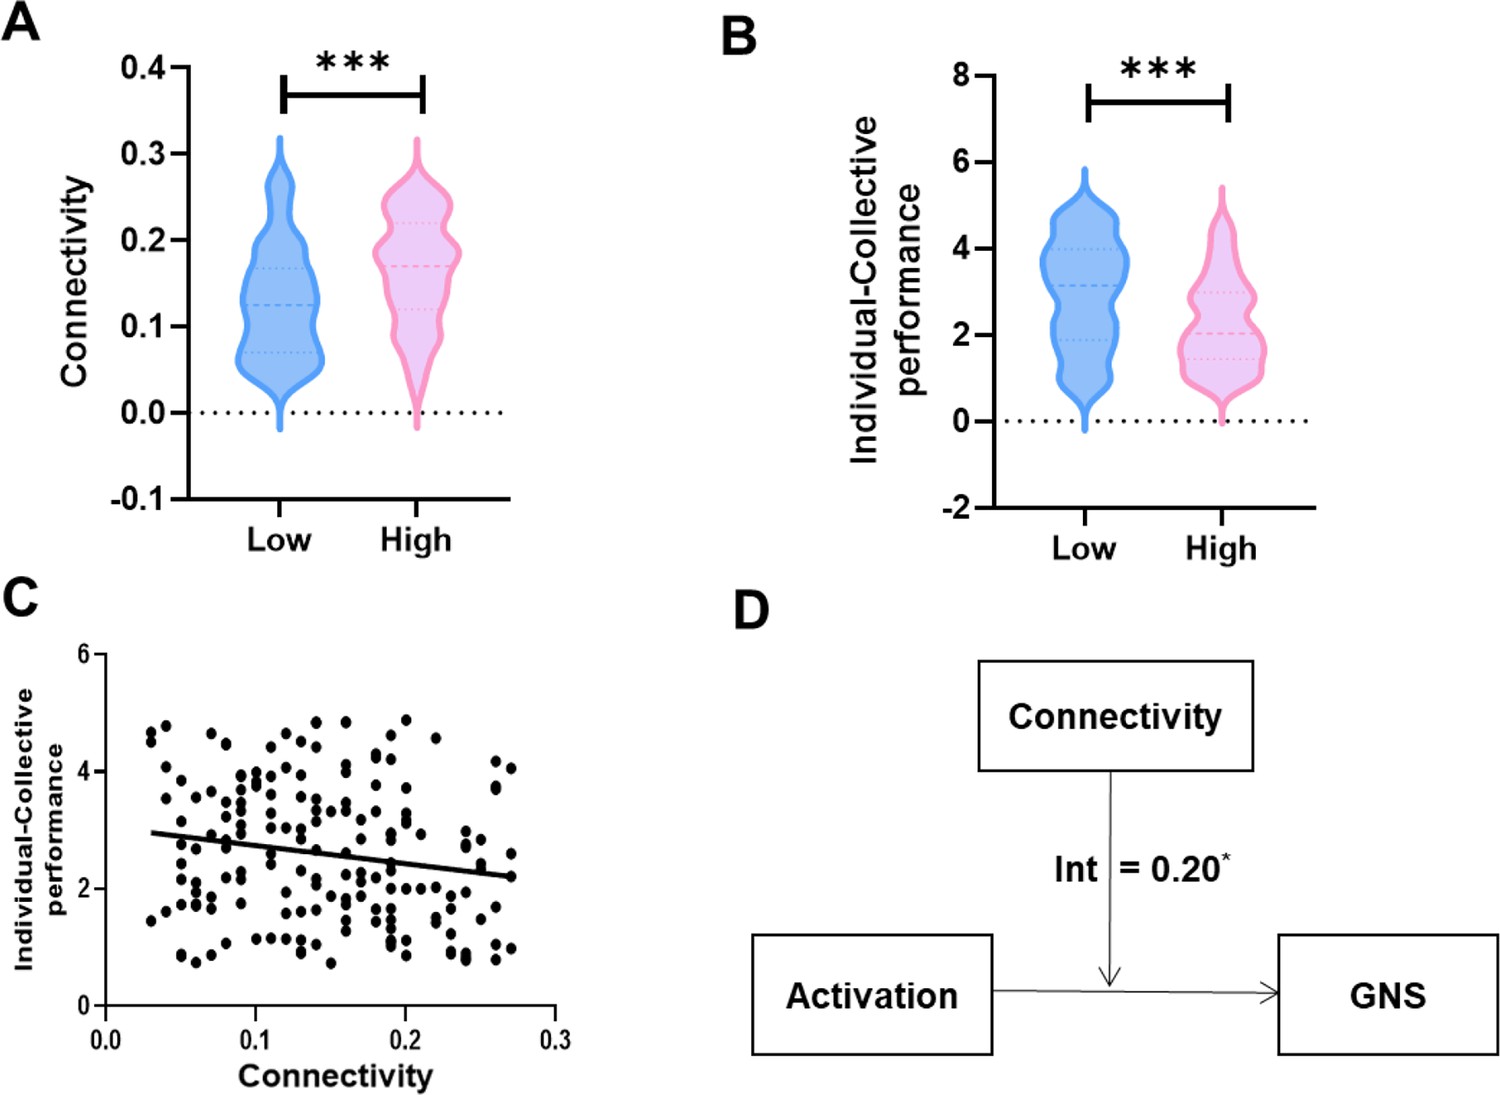
Brain activation connectivity links the single-brain activation and the corresponding group neural synchronization (GNS).
(A) A significant difference between the High and Low Group Identification groups in the dorsolateral prefrontal cortex–orbitofrontal cortex (DLPFC–OFC) (CH4–CH21) correlation was observed (p-value, false discovery rate [FDR] corrected). (B) A significant difference between the High and Low Group Identification groups in the similarity in individual-collective performance was observed. (C) A stronger DLPFC–OFC (CH4–CH21) correlation was linked to a decrease in the distance between individual and collective performance. (D) The analyses suggested that the relationship between individual single-brain activation and the corresponding GNS was regulated by brain activation connectivity. *p < 0.05, ***p < 0.001.
Figure 5

The dynamic neural process.
There was a time delay in the transition from individual to collective decisions, and brain activation connectivity was in the middle. The processing of information flow in single-brain activation (there was a significant increase in single-brain activation at approximately 7 min into the task), dorsolateral prefrontal cortex–orbitofrontal cortex (DLPFC–OFC) connectivity (there was a significant increase in connectivity at approximately 12 min into the task), and ultimately the group neural synchronization (GNS) (there was a significant increase in GNS at approximately 17 min into the task). The red star sign indicates that at this time point, the neural signal began to increase significantly.
Figure 6
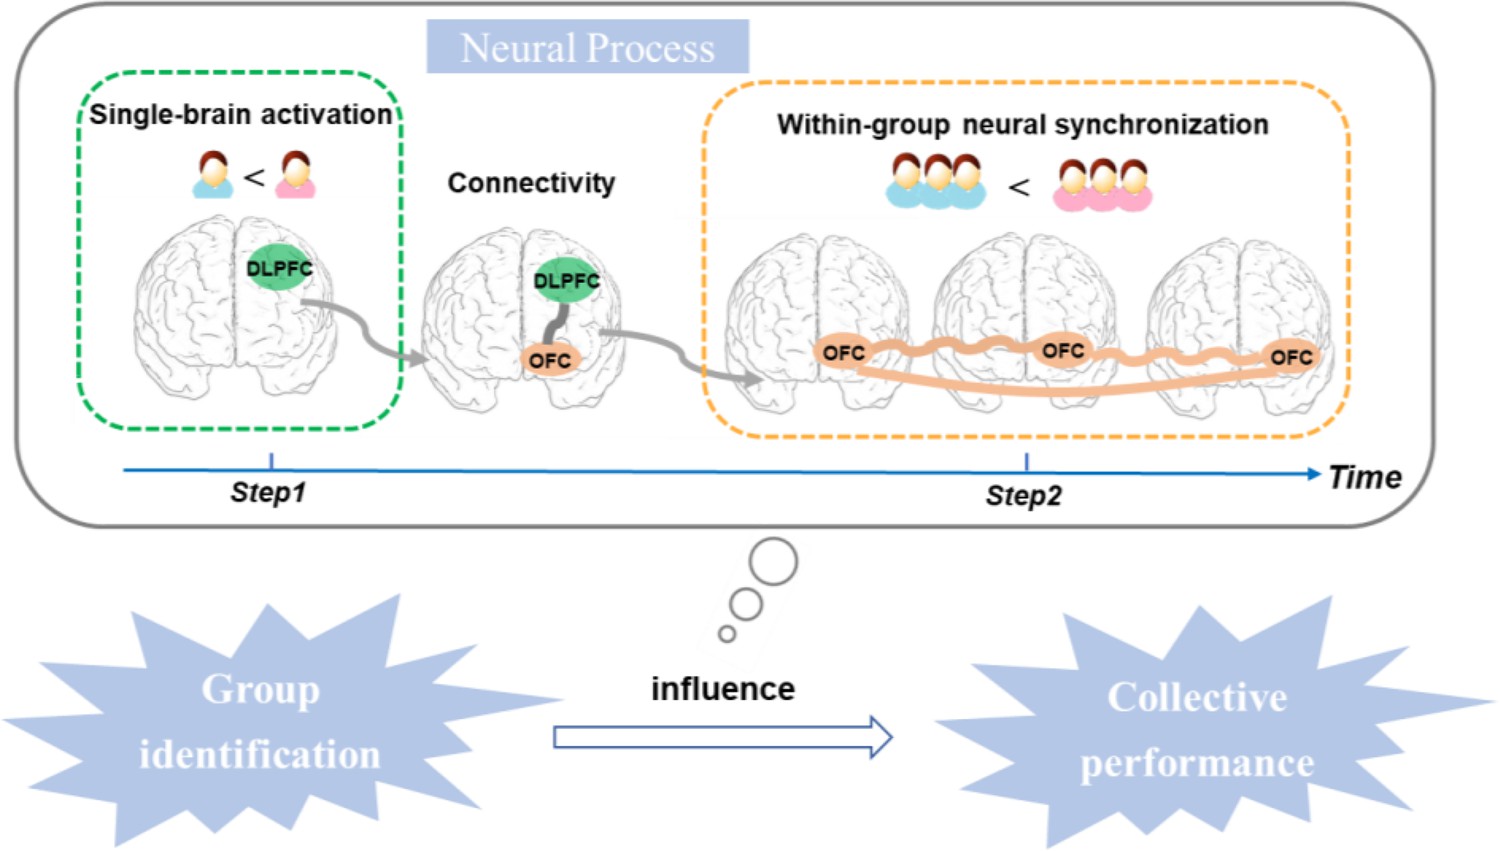
The two-in-one neural model explains how group identification influences collective performance.
In the first step, group identification influences individual performance, which is associated with significant single-brain activation in the dorsolateral prefrontal cortex (DLPFC) of each group member. In the second step, group identification influences collective performance, which is linked to significant within-group neural synchronization (GNS) in the orbitofrontal cortex (OFC). These two steps are connected by the DLPFC–OFC connectivity, which modulates the relationship between individual DLPFC activation and GNS in the OFC.
Figure 7
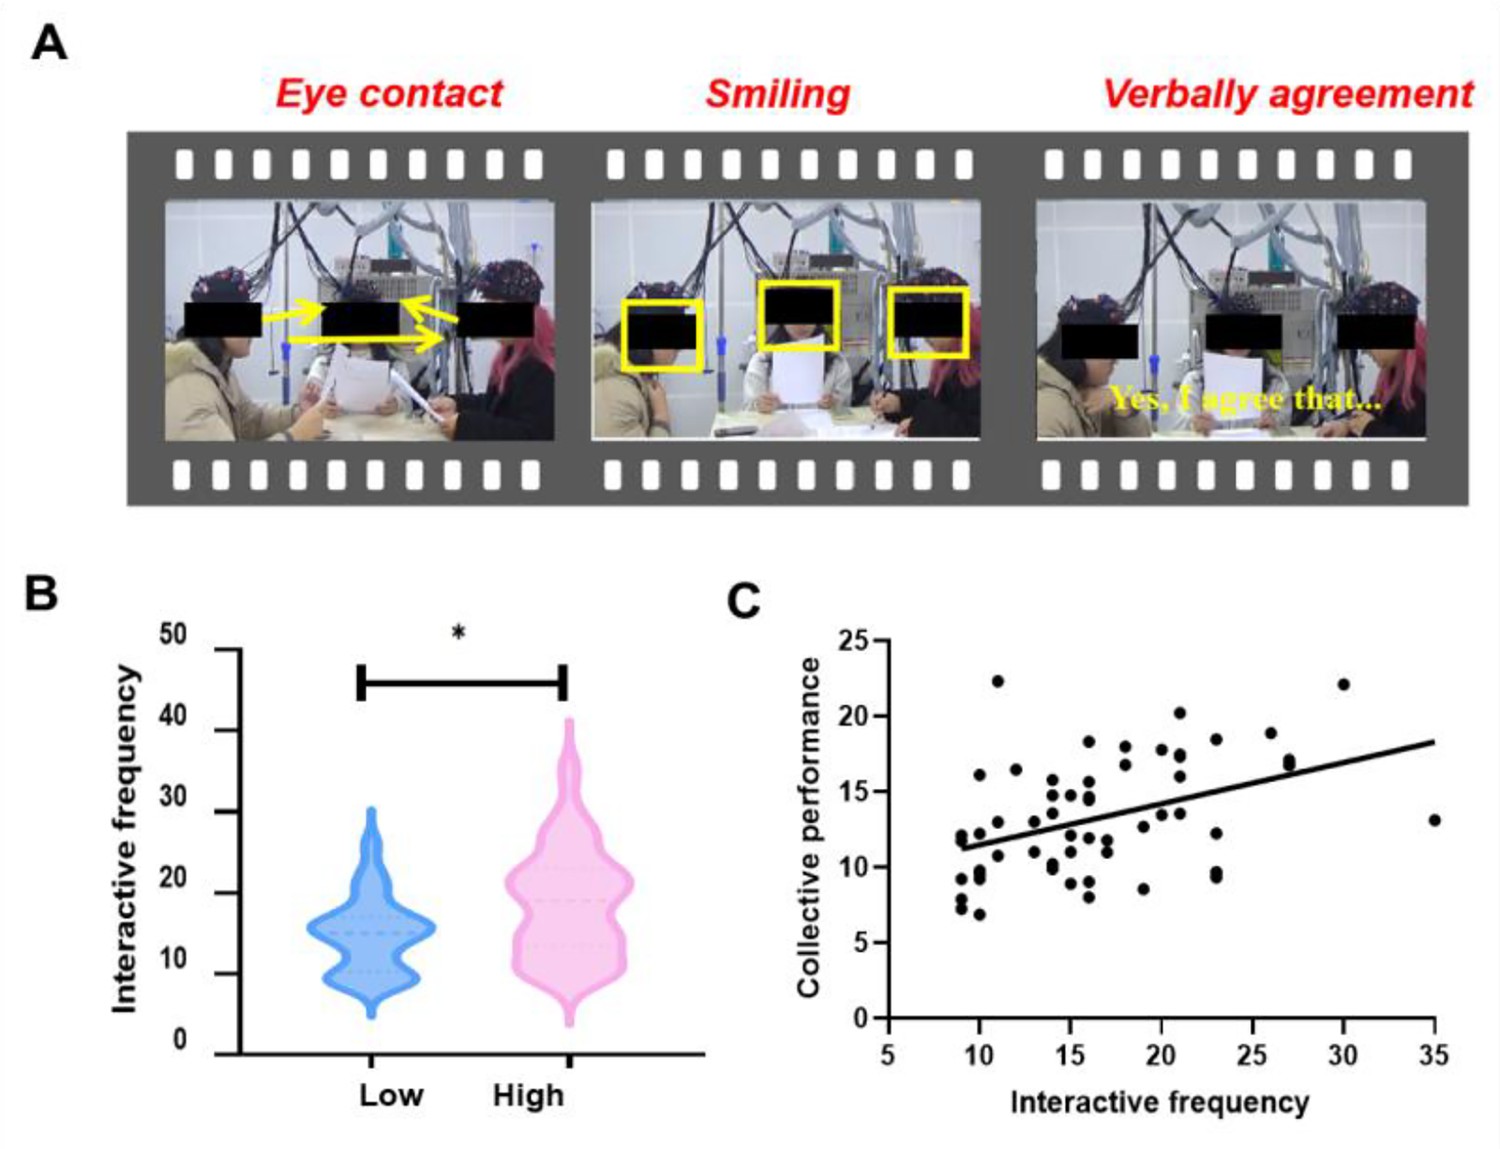
The quality of information exchange is correlated to the effect of group identification.
(A) Assessing the quality of information exchange from the video. (B) A significant difference between the High and Low Group Identification groups in the quality of information exchange was observed. (C) Higher quality of information exchange was linked to better collective performance. *p < 0.05.
Figure 8 with 1 supplement
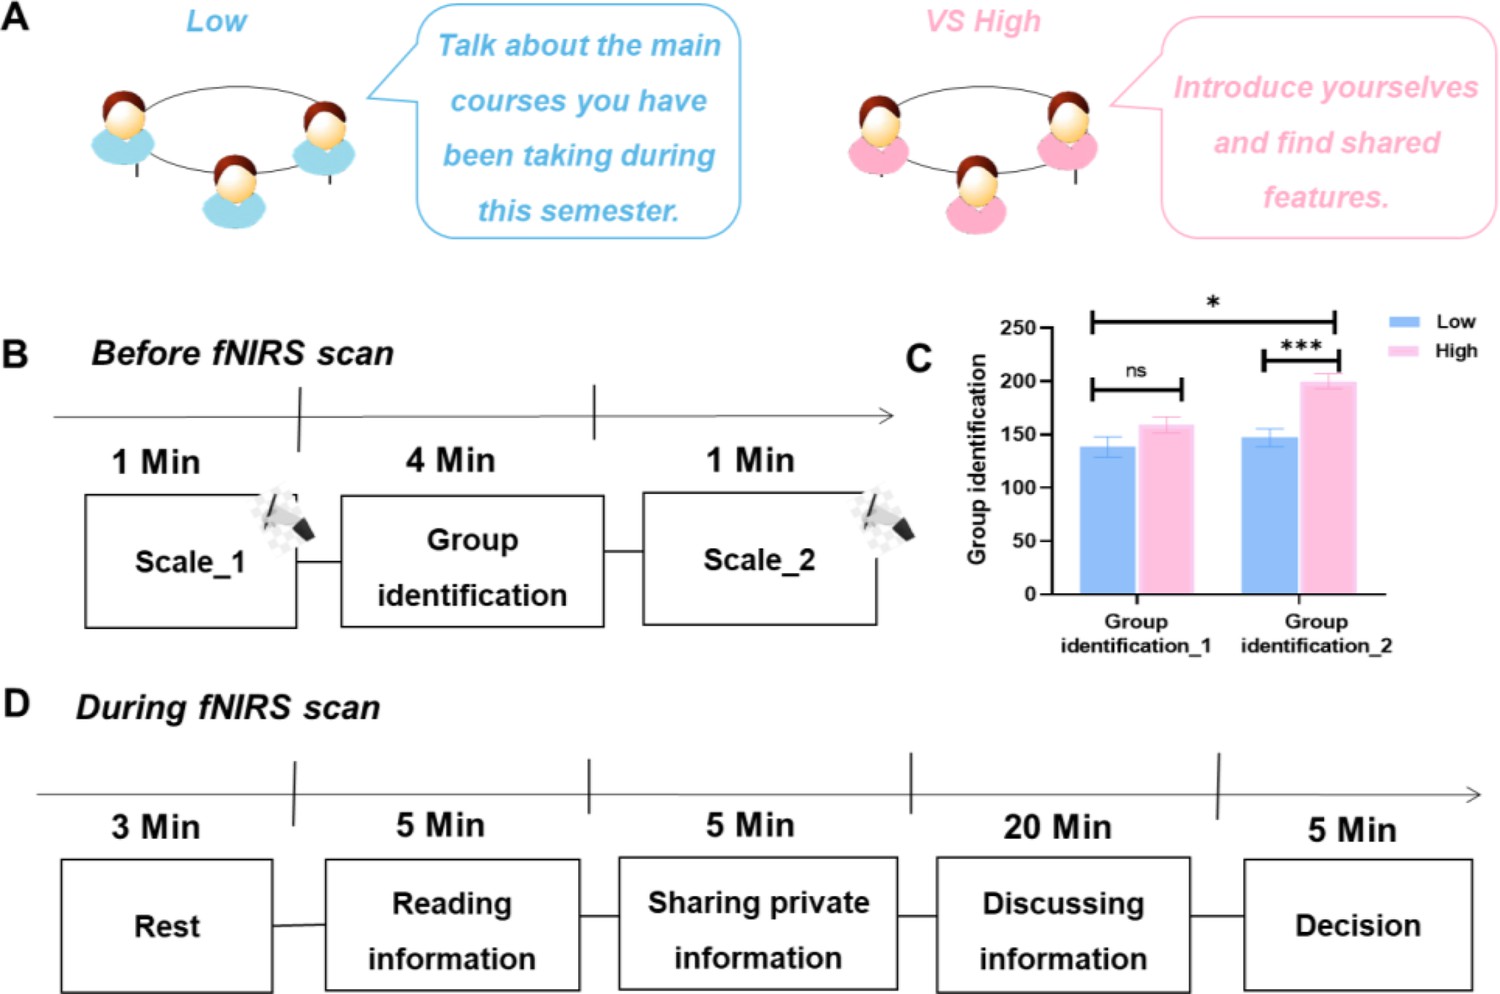
Experimental procedure.
(A) Group identification manipulation. For each High Group Identification condition, the participants in each triad were invited to chat with each other to introduce themselves and find three-person-shared features for minutes. For each Low Group Identification condition, the participants in each triad were asked to chat with each other about the main courses they had been taking during this semester without being explicitly asked to find shared features. (B) The rate of group identification. The participants in each triad rated the group identification in their group before and after the manipulation. (C) Group identification manipulation check. We examined how the level of group identification changed when we manipulated it, for both High and Low Group Identification conditions. Group identification_1, Group identification before manipulation; Group identification _2, Group identification after manipulation. (D) The procedure of task. First, participants completed a series of individual difference questionnaires before the task. Then, each group member received 18 common information and 2 private information. They read their information within 5 min. After that, each triad was required to complete verbal information exchange, comprising both group sharing and group discussion. Each group member texted the private information to other members by Tencent Meeting during group sharing for 5 min, and they discussed the information currently disclosed with others orally during the group discussion for 20 min. Ultimately, the groups had a period of 5 min to answer the questions. *p < 0.05, ***p < 0.001.
Figure 8—figure supplement 1

Probe location and measure the brain activity simultaneously.
Optode probe sets. The sets were placed over the prefrontal and left TPJ regions.
Additional files
-
Supplementary file 1
MNI coordinate Position of 3×5 optode probe set.
- https://cdn.elifesciences.org/articles/100000/elife-100000-supp1-v1.docx
-
Supplementary file 2
MNI coordinate Position of 2×4 optode probe set.
- https://cdn.elifesciences.org/articles/100000/elife-100000-supp2-v1.docx
-
Supplementary file 3
The results of HbR.
- https://cdn.elifesciences.org/articles/100000/elife-100000-supp3-v1.docx
Download links
A two-part list of links to download the article, or parts of the article, in various formats.
Downloads (link to download the article as PDF)
Open citations (links to open the citations from this article in various online reference manager services)
Cite this article (links to download the citations from this article in formats compatible with various reference manager tools)
Group identification drives brain integration for collective performance
eLife 13:RP100000.
https://doi.org/10.7554/eLife.100000.4


