Dynamics and regulatory roles of RNA m6A methylation in unbalanced genomes
- Key Laboratory of Cell Proliferation and Regulation Biology of Ministry of Education, College of Life Sciences, Beijing Normal University, China
- Beijing Key Laboratory of Gene Resource and Molecular Development, College of Life Sciences, Beijing Normal University, China
Figures
Figure 1 with 2 supplements
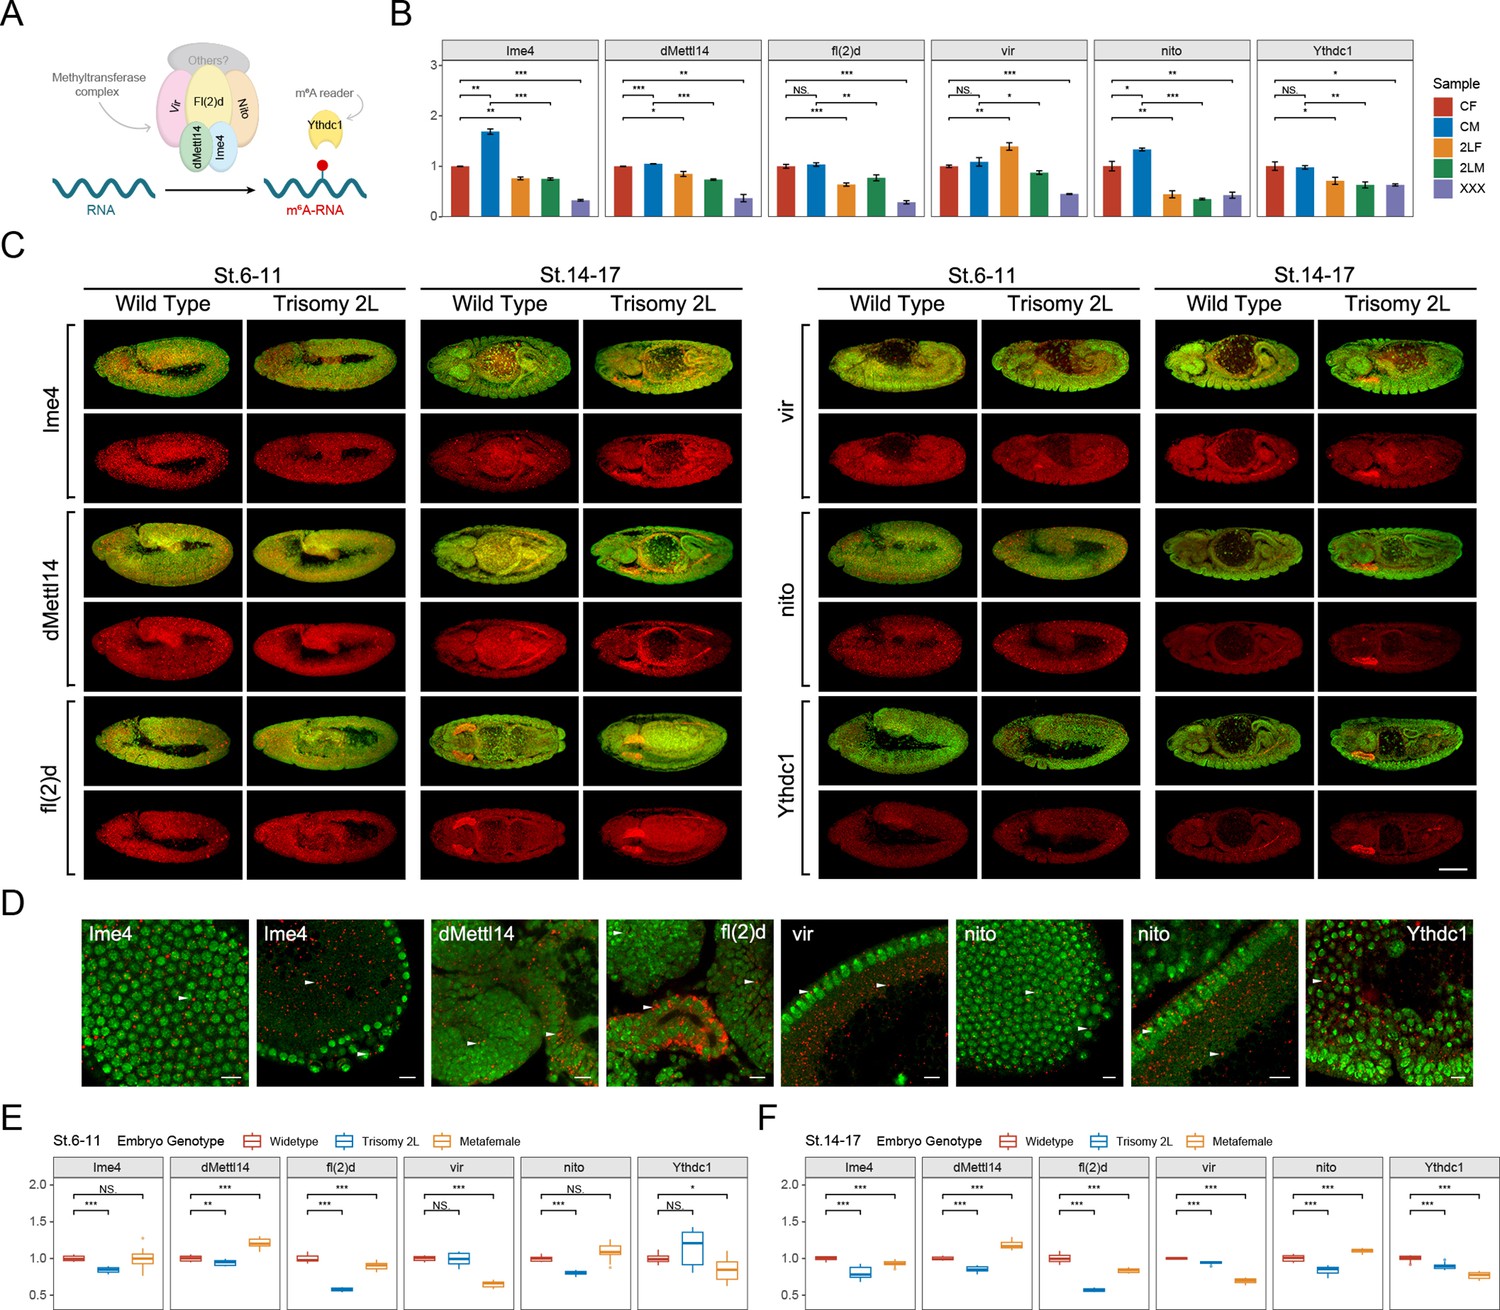
The responses of m6A methyltransferases and reader protein under the condition of genomic imbalance.
(A) Schematic diagram of m6A components in Drosophila. (B) RT-qPCR analysis of messenger RNA (mRNA) levels of m6A methyltransferases and reader protein in third instar larvae of wildtype and trisomy Drosophila. CF, wildtype female control; CM, wildtype male control; 2LF, trisomy 2L female; 2LM, trisomy 2L male; XXX, metafemale; 2L, chromosome 2 left arm. Sample size = 3. Student’s t test *p<0.05, **p<0.01, ***p<0.001. (C) Subembryonic distribution patterns of the transcripts of m6A components in wildtype and trisomy 2L Drosophila. The names of the genes were shown in the left of the pictures; the genotypes and stages were shown above. Red, probes; green, DAPI. Scale bar, 100 μm. (D) Subcellular localization of probe signals. Probe name was written in the corner of each picture. Red, probe; green, DAPI. Arrowheads indicate the foci of probe signals. The tissue types are (1) blastoderm nuclei; (2) yolk plasm and pole cells; (3) brain and midgut; (4) salivary gland and midgut; (5) blastoderm nuclei and yolk cortex; (6) blastoderm nuclei and pole cells; (7) blastoderm nuclei and yolk cortex; (8) germ band. Scale bars, 10 μm. (E,F) The expression levels of m6A component genes in stage 6–11 (E) and stage 14–17 (F) represented by relative fluorescence intensity of probes compared with DAPI signals. The expression of wildtype embryos was set as one. Sample size = 10. Student’s t test *p<0.05, **p<0.01, ***p<0.001.
Figure 1—figure supplement 1
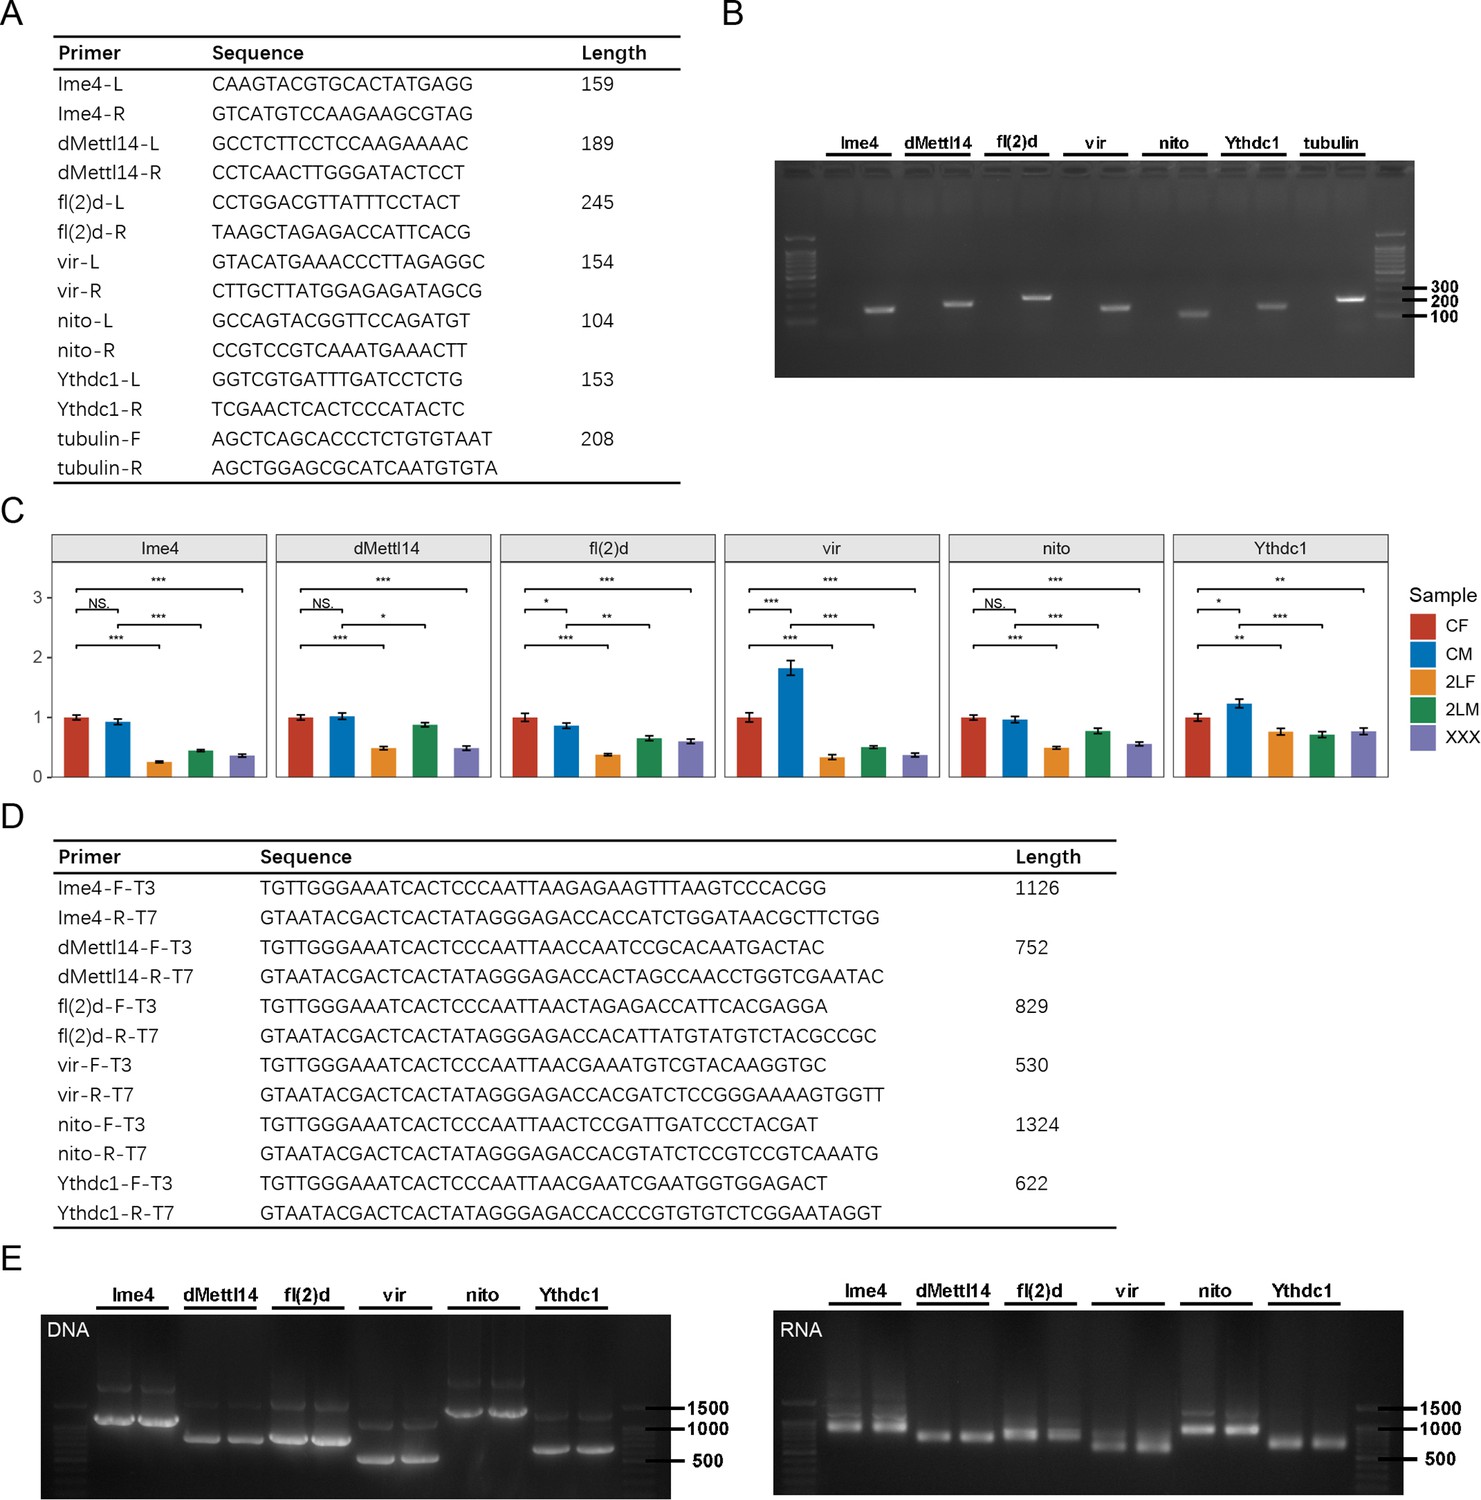
Primers of m6A methyltransferases and reader protein for RT-qPCR and TSA-FISH.
(A) The sequences of RT-qPCR primers. (B) Agarose gel electrophoresis validation of qPCR primers. The left lane of each gene is negative control with primers only and no DNA substrate. (C) RT-qPCR analysis of messenger RNA (mRNA) levels of m6A methyltransferases and reader protein in the brains of wildtype and trisomy Drosophila larvae. CF, wildtype female control; CM, wildtype male control; 2LF, trisomy 2L female; 2LM, trisomy 2L male; XXX, metafemale. Sample size = 3. Student’s t test *p<0.05, **p<0.01, ***p<0.001. (D) The sequences of FISH primers. (E) The sizes of the products of the FISH primers after PCR amplification and in vitro transcription were tested by agarose gel electrophoresis. 2L, chromosome 2 left arm; RT-qPCR, real-time quantitative PCR; TSA-FISH, tyramide signal amplification-based fluorescence in situ hybridization.
Figure 1—figure supplement 2
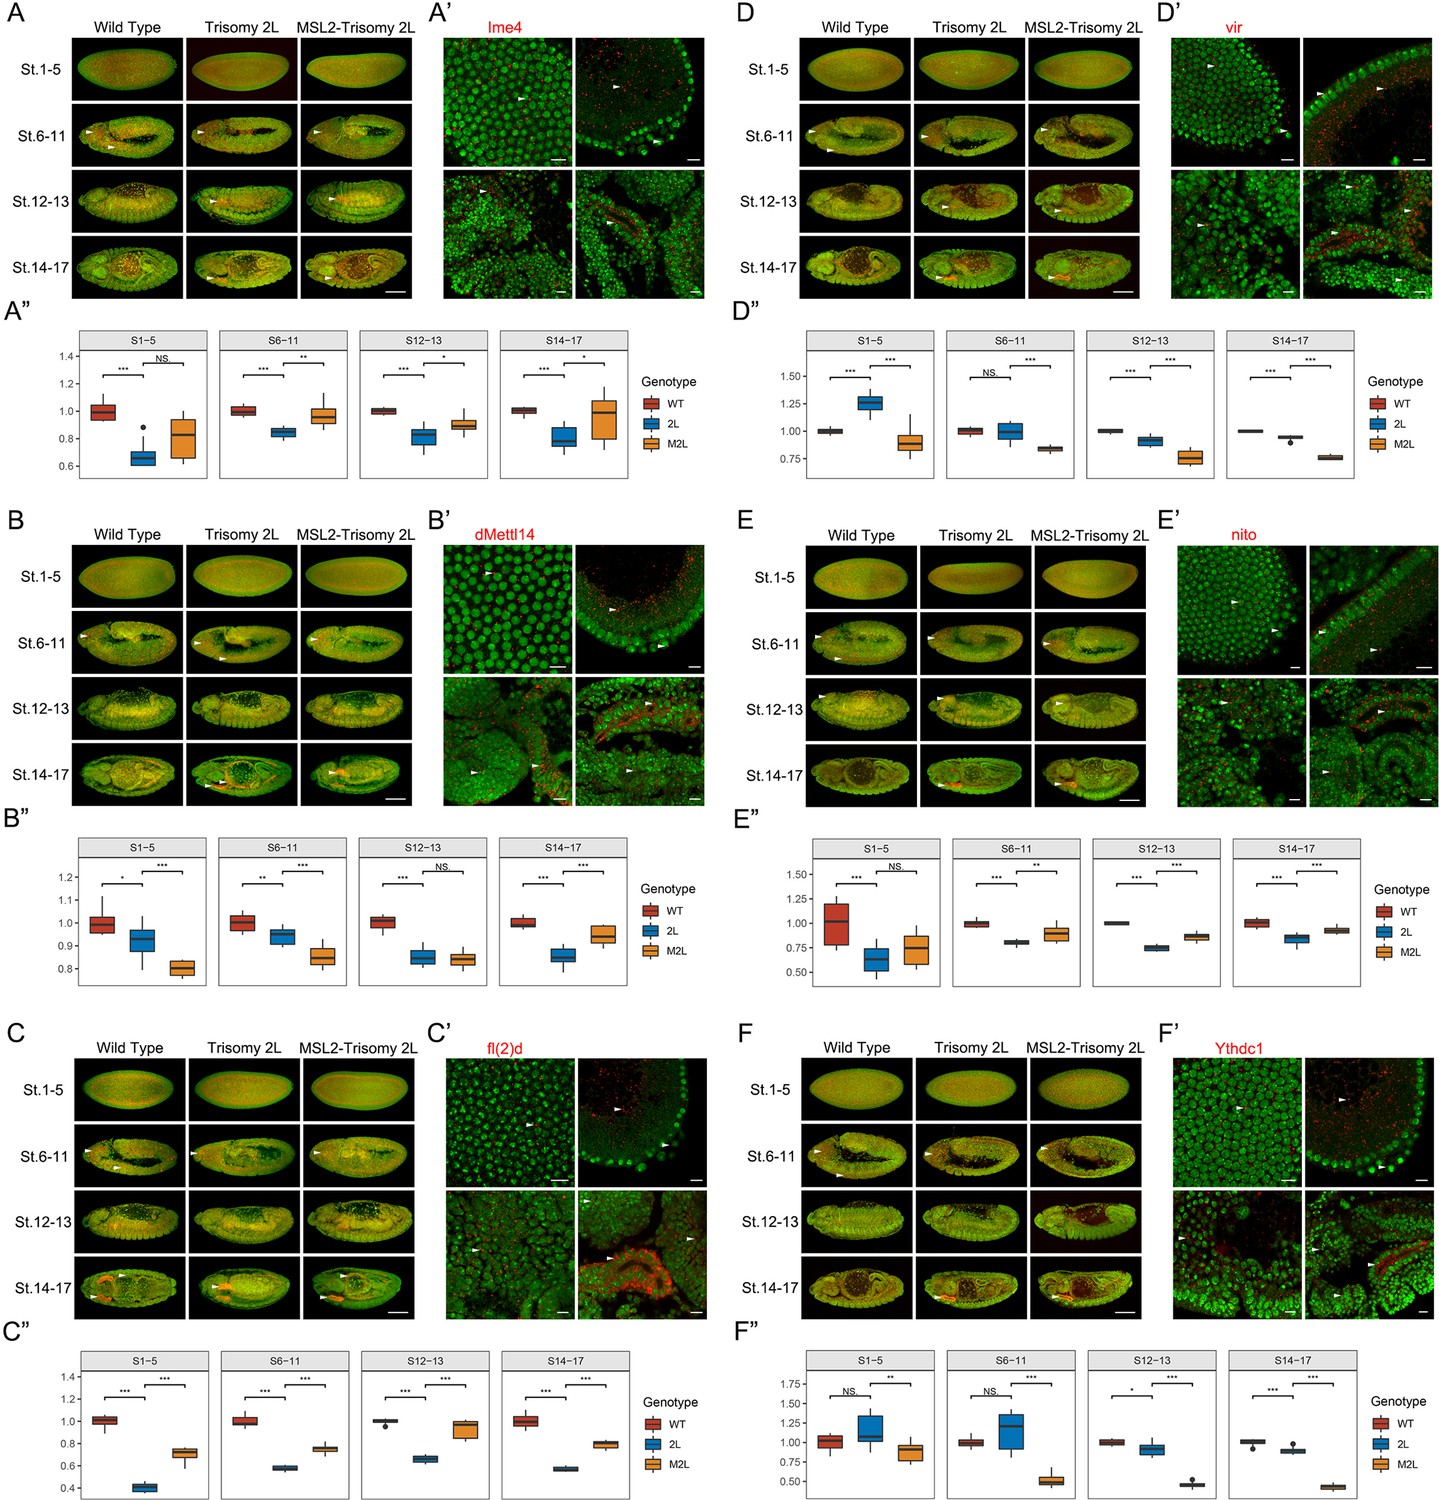
Embryo tyramide signal amplification-based fluorescence in situ hybridization (TSA-FISH) of m6A components in wildtype, trisomy, and MSL2-overexpressed trisomy Drosophila.
The images represent m6A component Ime4 (A–A”), dMettl14 (B–B”), fl(2)d (C–C”), vir (D–D”), nito (E–E”), and Ythdc1 (F–F”), respectively. (A–F) Gene expression patterns in entire embryos. The genotypes of the samples were shown above, and the development stages (St.) were shown in the left of the pictures. The red pseudocolor represents signal from the probes, and green is the signal of nucleus. Arrowheads indicate regions where the probe signal are enriched. Scale bars, 100 μm. (A’–F’) RNA subcellular location patterns of m6A components. Arrowheads indicate probe signals. Scale bars, 10 μm. (A”–F”) The expression levels of m6A component genes represented as relative fluorescence intensity of the probes compared with DAPI. The expression of wildtype embryos was set as base line. WT, wildtype; 2L, trisomy 2L; M2L, MSL2-overexpressed trisomy 2L. Sample size = 10. Student’s t test *p<0.05, **p<0.01, ***p<0.001.
Figure 2 with 2 supplements
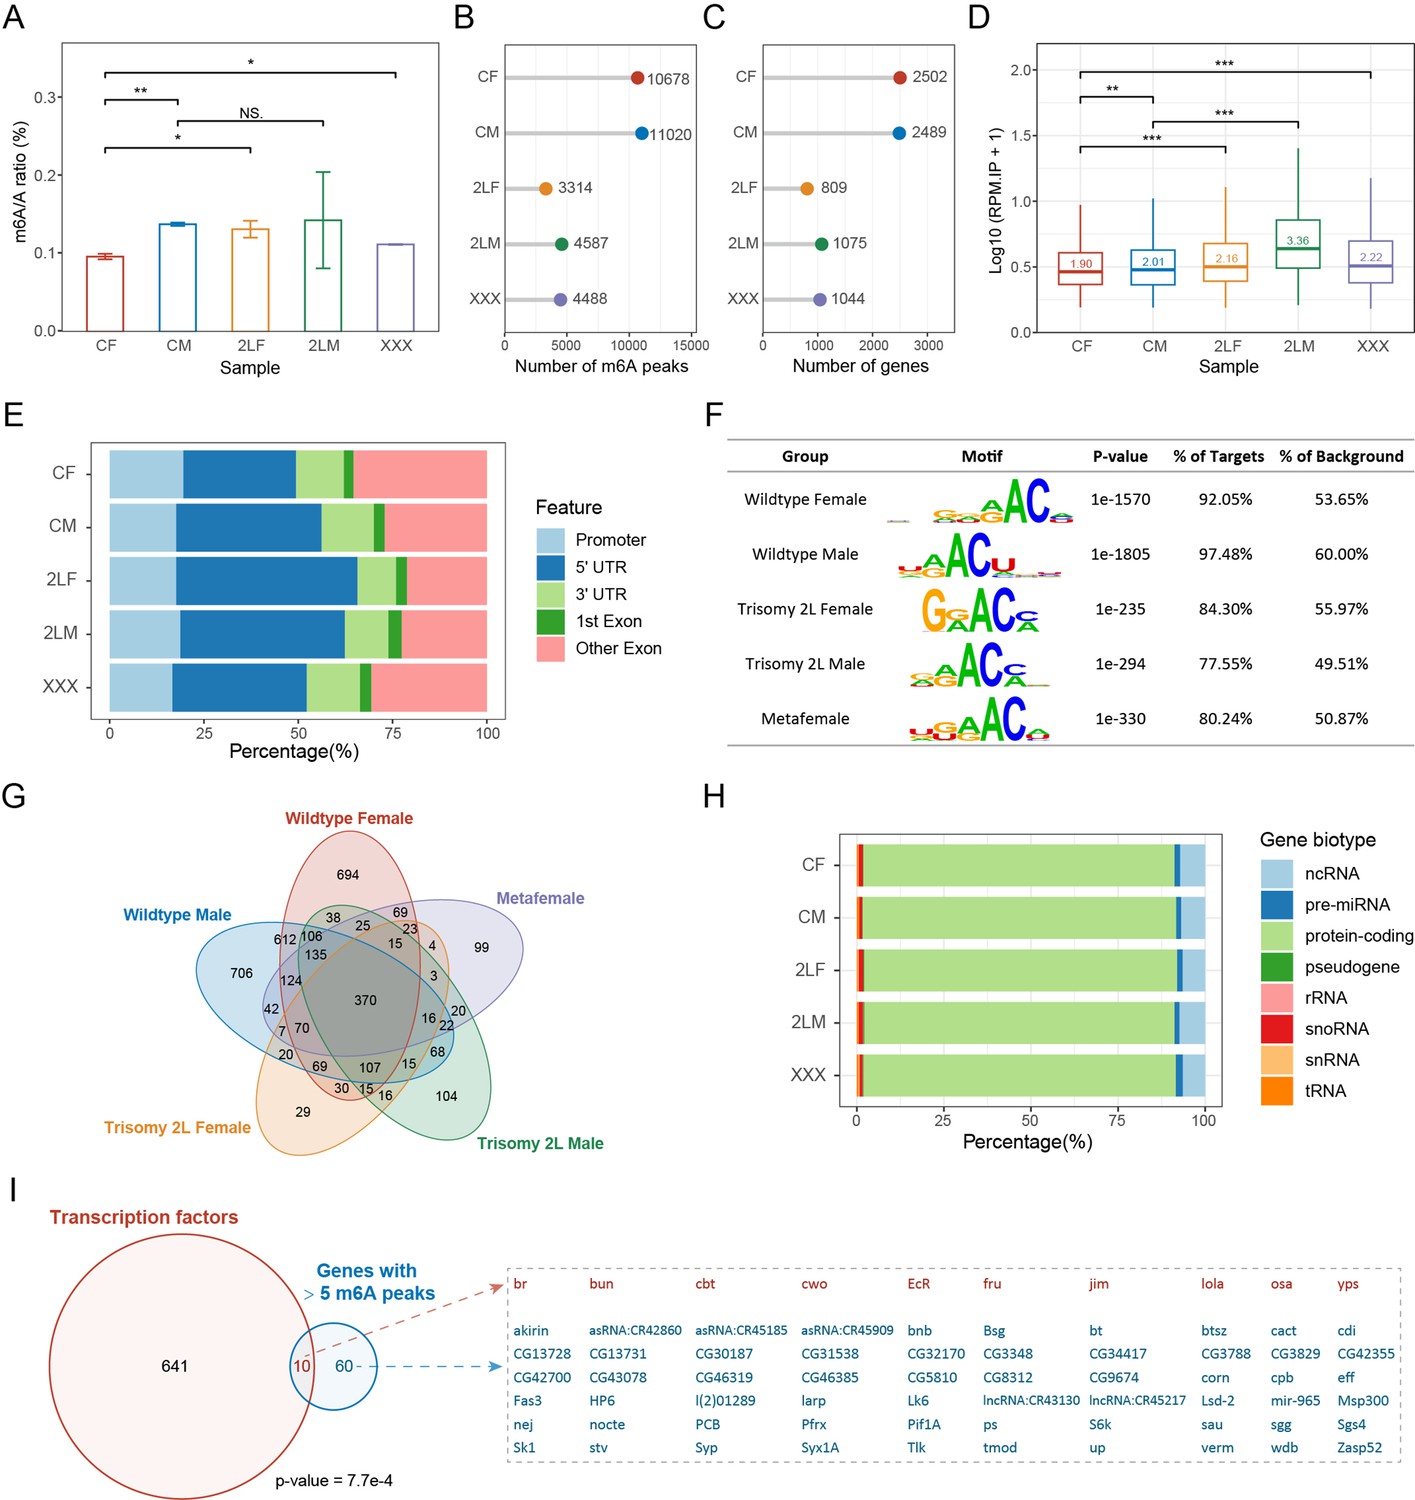
Overview of RNA m6A methylation in aneuploid Drosophila.
(A) Global m6A abundance in third instar larvae of wildtype and aneuploid Drosophila. Data represent the mean of two independent experiments, each containing three or four biological replicates. Quantification was performed using EpiQuik m6A RNA Methylation Quantification Kit. Error bar indicates the standard error of the means (SEM). Student’s t test *p<0.05, **p<0.01. (B) The number of m6A peaks identified by MeRIP-Seq. (C) The number of m6A-modified genes obtained by annotating the peaks. (D) Expression levels of m6A modification sites in IP samples expressed as log10-transformed reads per million (RPM). The number on the boxplot indicates the median RPM of each sample. Mann-Whitney U test *p<0.05, **p<0.01, ***p<0.001. (E) Percentages of peaks localized on different gene features. (F) The most enriched motifs obtained by de novo motif analysis of the m6A peaks. (G) Venn diagram showing the intersection of m6A-modified genes in each sample. (H) Gene biotypes of m6A-modified genes. (I) Venn diagram showing the intersection of transcription factors and m6A-modified genes with more than five m6A peaks in all samples. Seventy genes with more than five m6A peaks were listed on the right, with transcription factors in red and others in blue. p-Value indicates one-tailed Fisher’s exact test. CF, wildtype female control; CM, wildtype male control; 2LF, trisomy 2L female; 2LM, trisomy 2L male; XXX, metafemale; 5′UTR, 5′ untranslated region; 3′UTR, 3′ untranslated region; MeRIP-Seq, m6A methylated RNA immunoprecipitation sequencing.
Figure 2—figure supplement 1
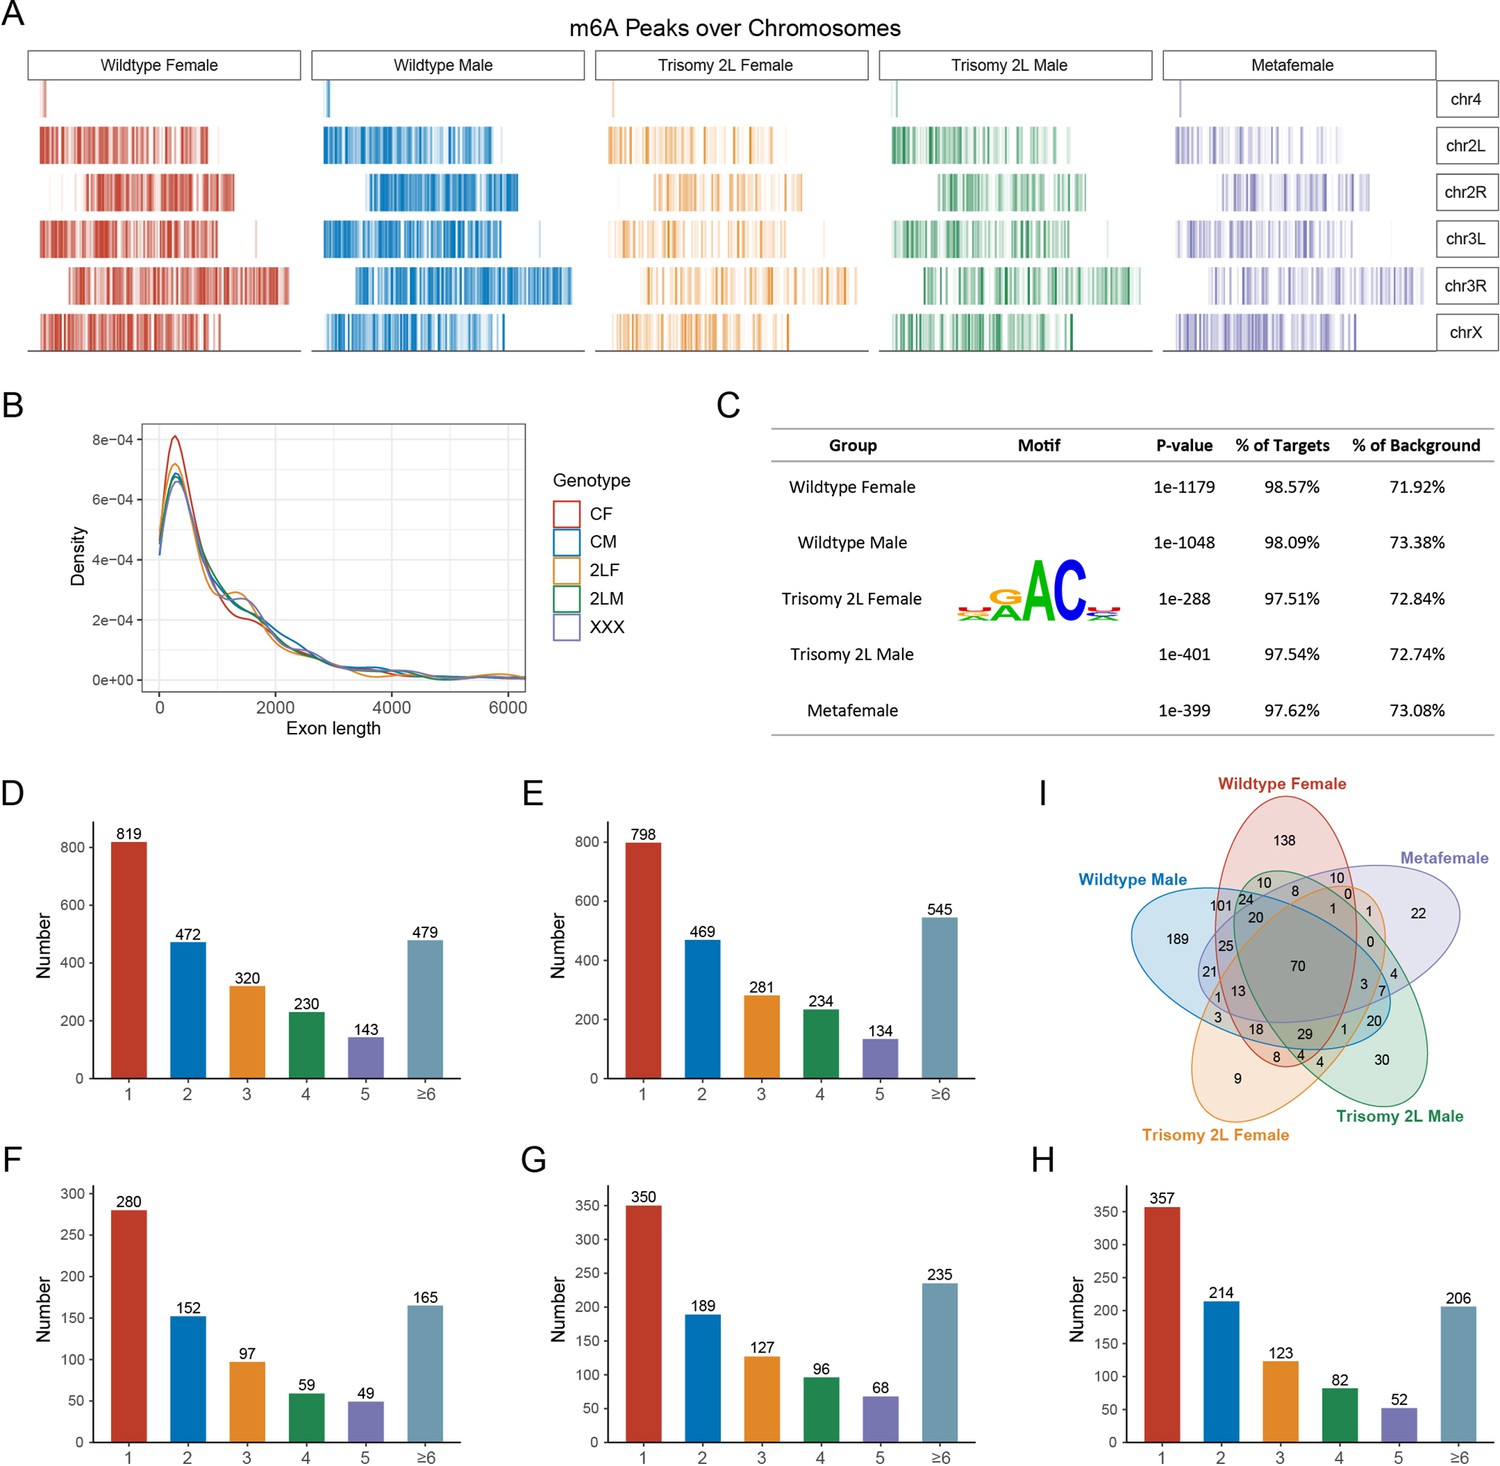
Characteristics of m6A-modified genes in wildtype and aneuploid Drosophila.
(A) Distribution of m6A peaks along each chromosome. (B) Kernel density plot showing the distribution of exon lengths of m6A-modified genes. CF, wildtype female control; CM, wildtype male control; 2LF, trisomy 2L female; 2LM, trisomy 2L male; XXX, metafemale. (C) Enrichment analysis performed on the known m6A consensus motif DRACH (D=G/A/U, R=G/A, H=U/A/C). (D–H) Statistics of the number of m6A peaks on m6A-modified genes in wildtype females (D), wildtype males (E), trisomy 2L females (F), trisomy 2L males (G), and metafemales (H). (I) Venn diagram showing the number of m6A-modified genes with more than five m6A peaks.
Figure 2—figure supplement 2
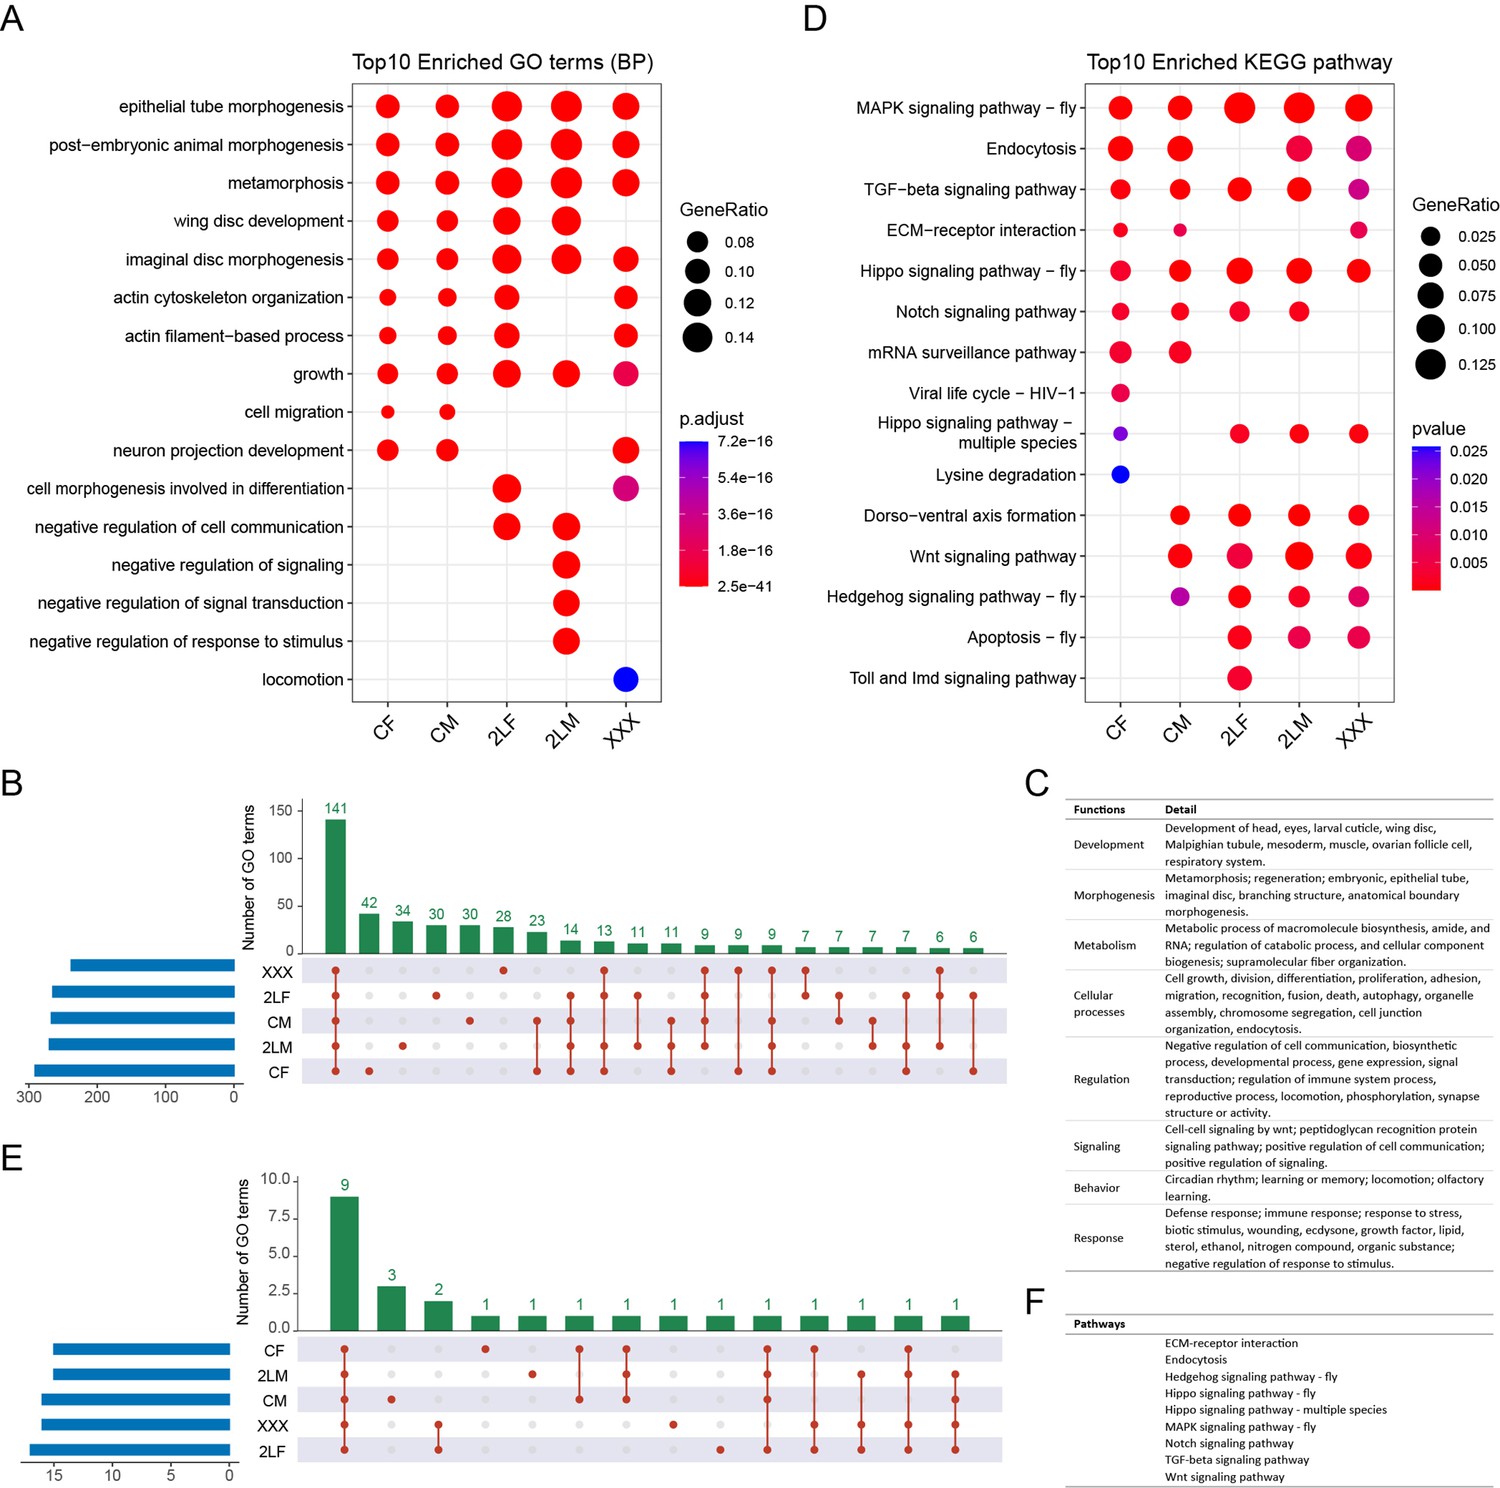
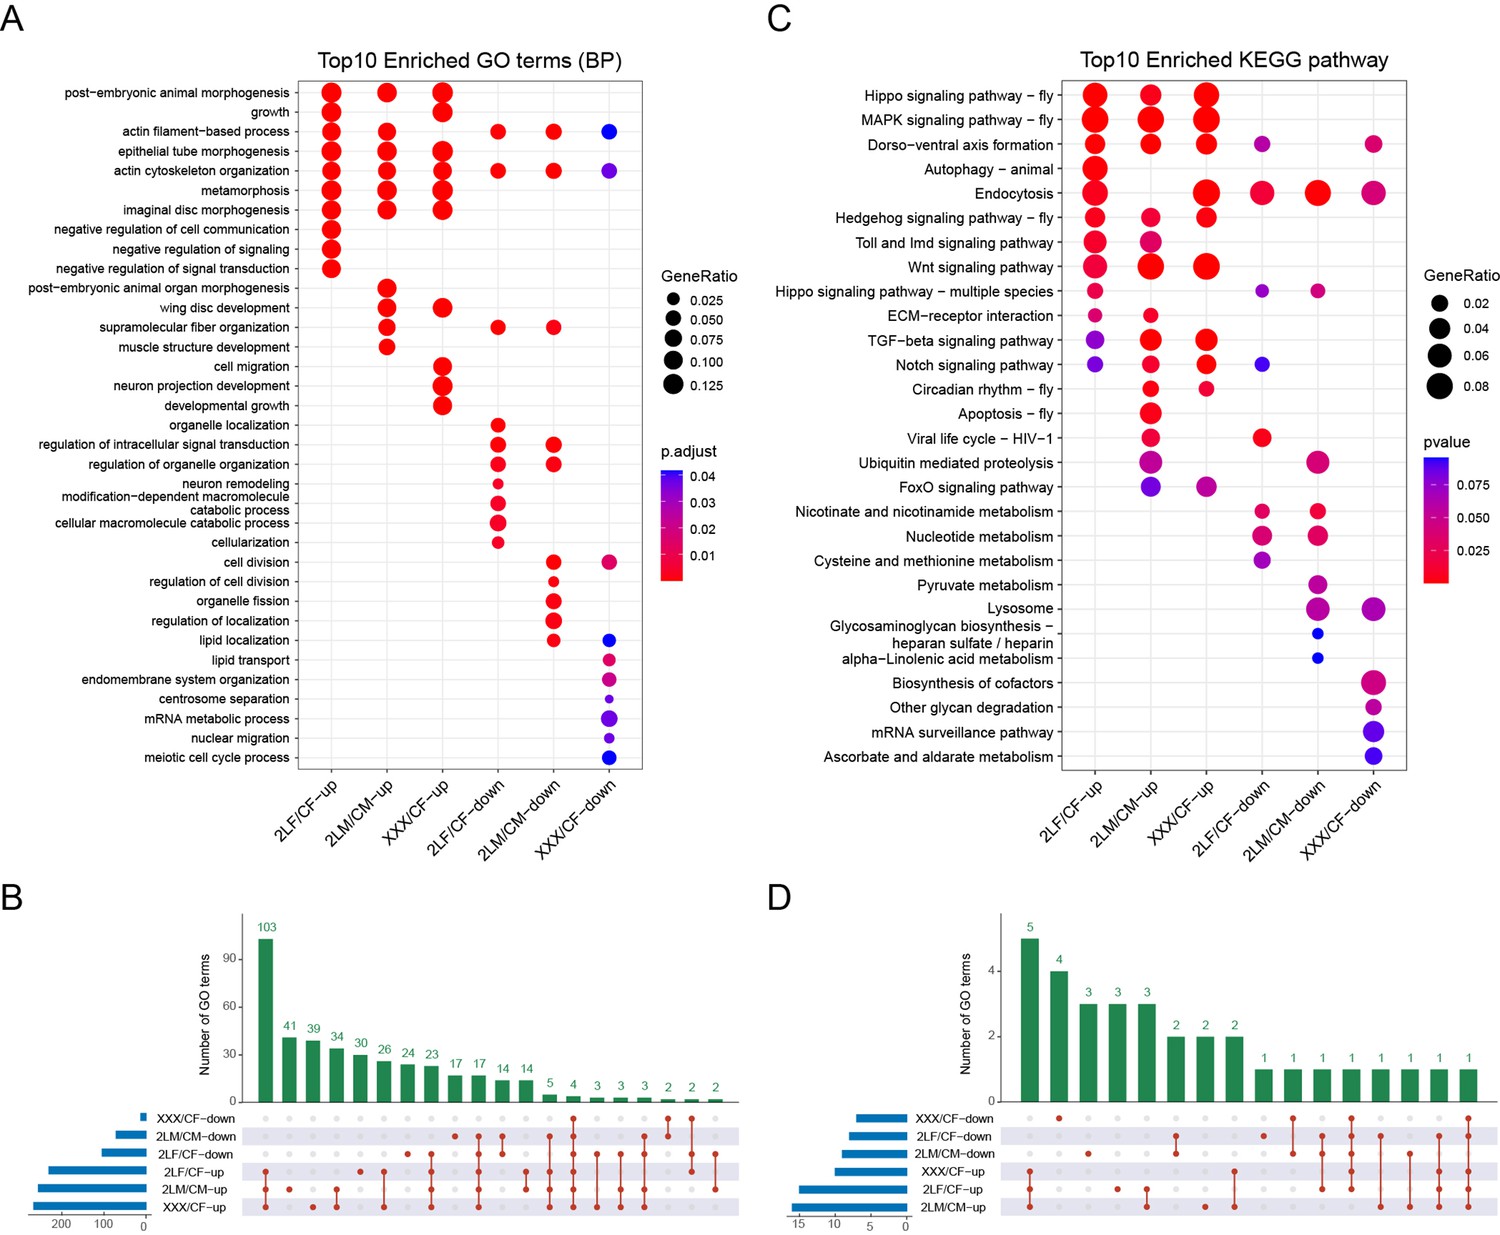
Functional and pathway analysis of m6A-modified genes in wildtype and aneuploid Drosophila.
(A) Functional enrichment analysis of m6A-modified genes. Top 10 enriched GO terms (Biological Process) with adjusted p-value<0.05 in each sample were shown. (B) UpSet plot showing the shared sets of enriched GO terms of m6A-modified genes in different groups. (C) Summary of the common functions enriched by m6A-modified genes in all genotypes. (D) KEGG pathway enrichment analysis of m6A-modified genes. Top 10 enriched pathways with p-value<0.05 in each sample were shown. (E) UpSet plot showing the shared sets of enriched KEGG pathways of m6A-modified genes in different groups. (F) The pathways enriched in all genotypes were listed. CF, wildtype female control; CM, wildtype male control; 2LF, trisomy 2L female; 2LM, trisomy 2L male; XXX, metafemale; GO, Gene Ontology; BP, Biological Process; KEGG, Kyoto Encyclopedia of Genes and Genomes.
Figure 3 with 1 supplement
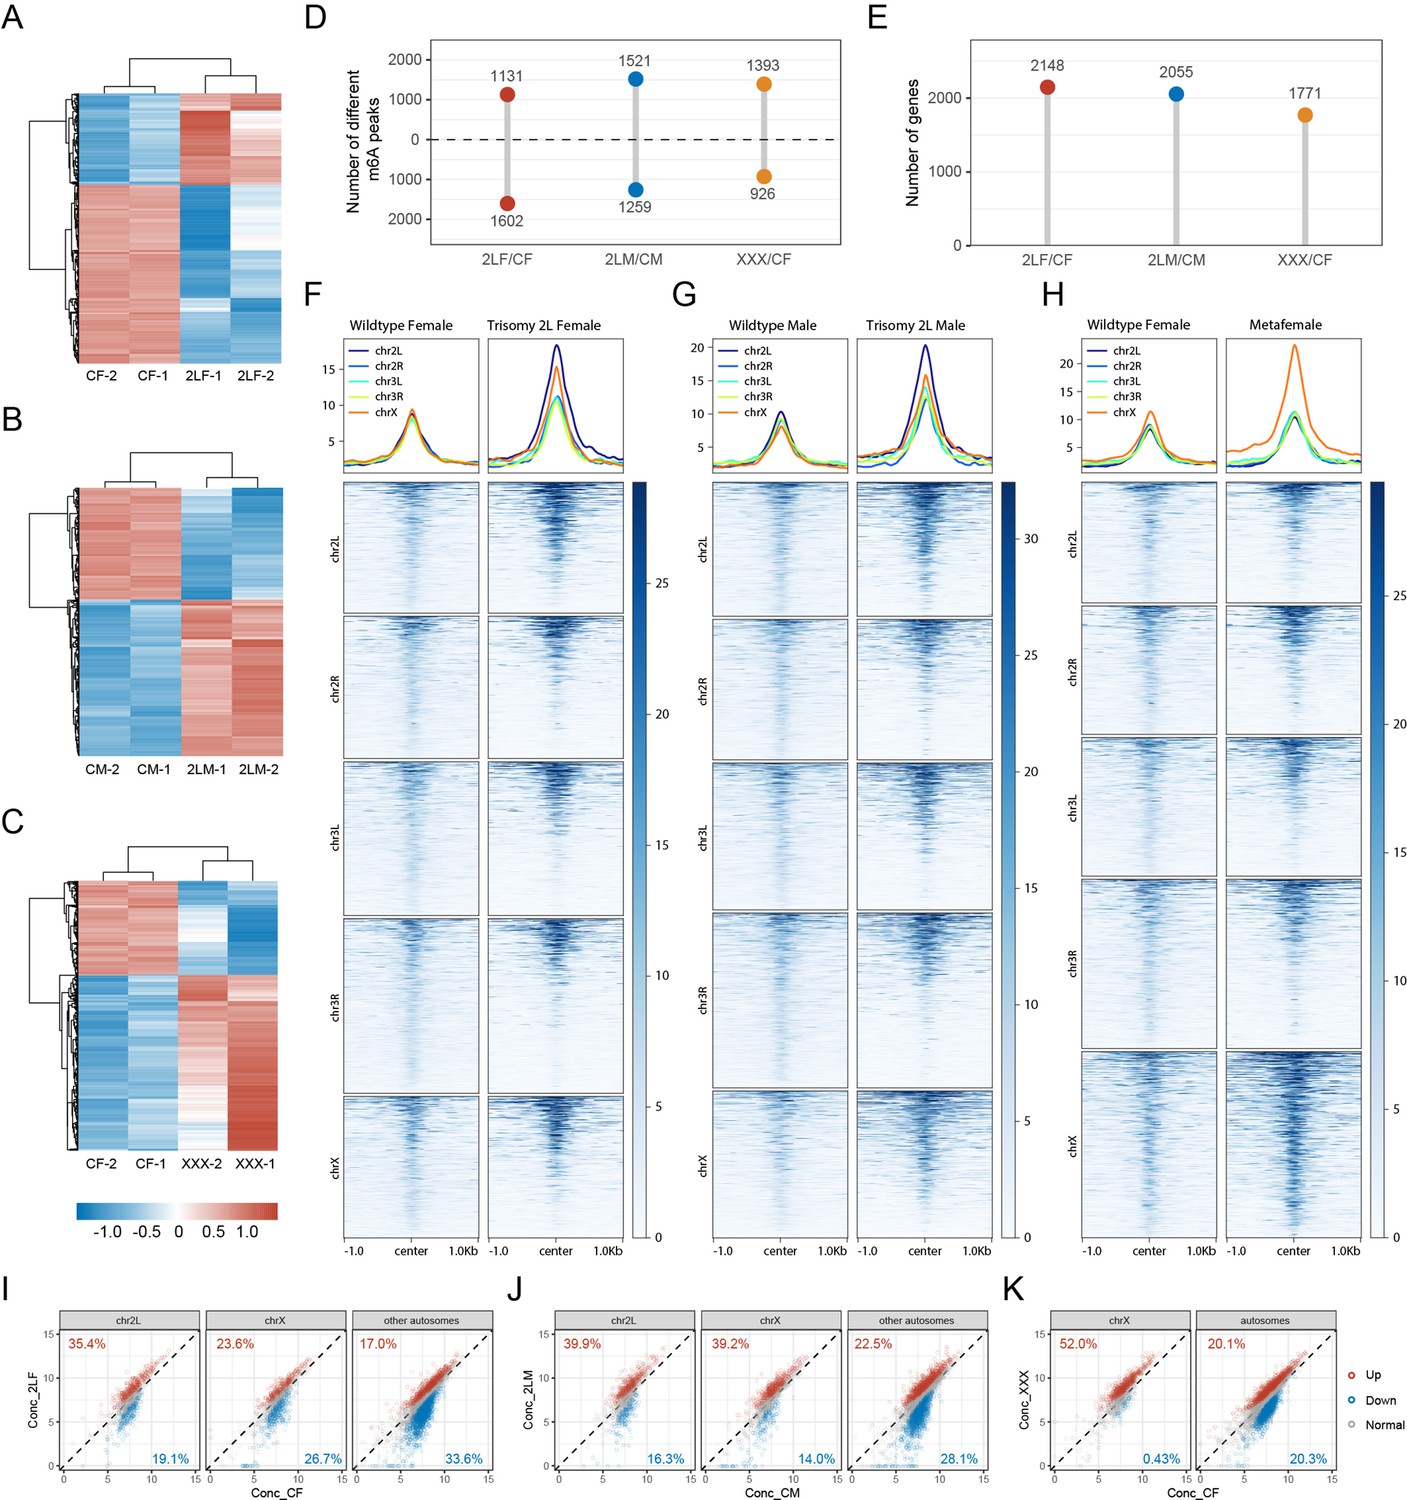
Differential m6A methylome analysis of aneuploid Drosophila.
(A–C) Heatmaps of differentially methylated peaks (DMPs) in trisomy 2L females (A), trisomy 2L males (B), and metafemales (C), and their corresponding control groups. The threshold of significance was p-value≤0.1. (D) The number of DMPs. The threshold of significance was set to p-value≤0.1. The numbers above the horizontal dashed lines indicate peaks with up-regulated methylation levels, and the numbers below indicate peaks with down-regulated methylation levels. (E) The number of DMP-associated genes. (F–H) Profiles and heatmaps illustrating the density of m6A-modified reads at the DMP positions in trisomy 2L females (F), trisomy 2L males (G), metafemales (H), and their corresponding controls. The DMPs were divided into five groups according to the chromosomes they located. (I–K) Scatter plots showing the concentration of reads at methylation sites on different chromosomes in trisomy 2L females (I), trisomy 2L males (J), and metafemales (K). Red points indicate significantly up-regulated m6A peaks, blue points indicate significantly down-regulated m6A peaks, and gray points indicate m6A peaks without significant changes. The percentages of DMPs on cis and trans chromosomes were indicated in the corners of the plots. CF, wildtype female control; CM, wildtype male control; 2LF, trisomy 2L female; 2LM, trisomy 2L male; XXX, metafemale.
Figure 3—figure supplement 1
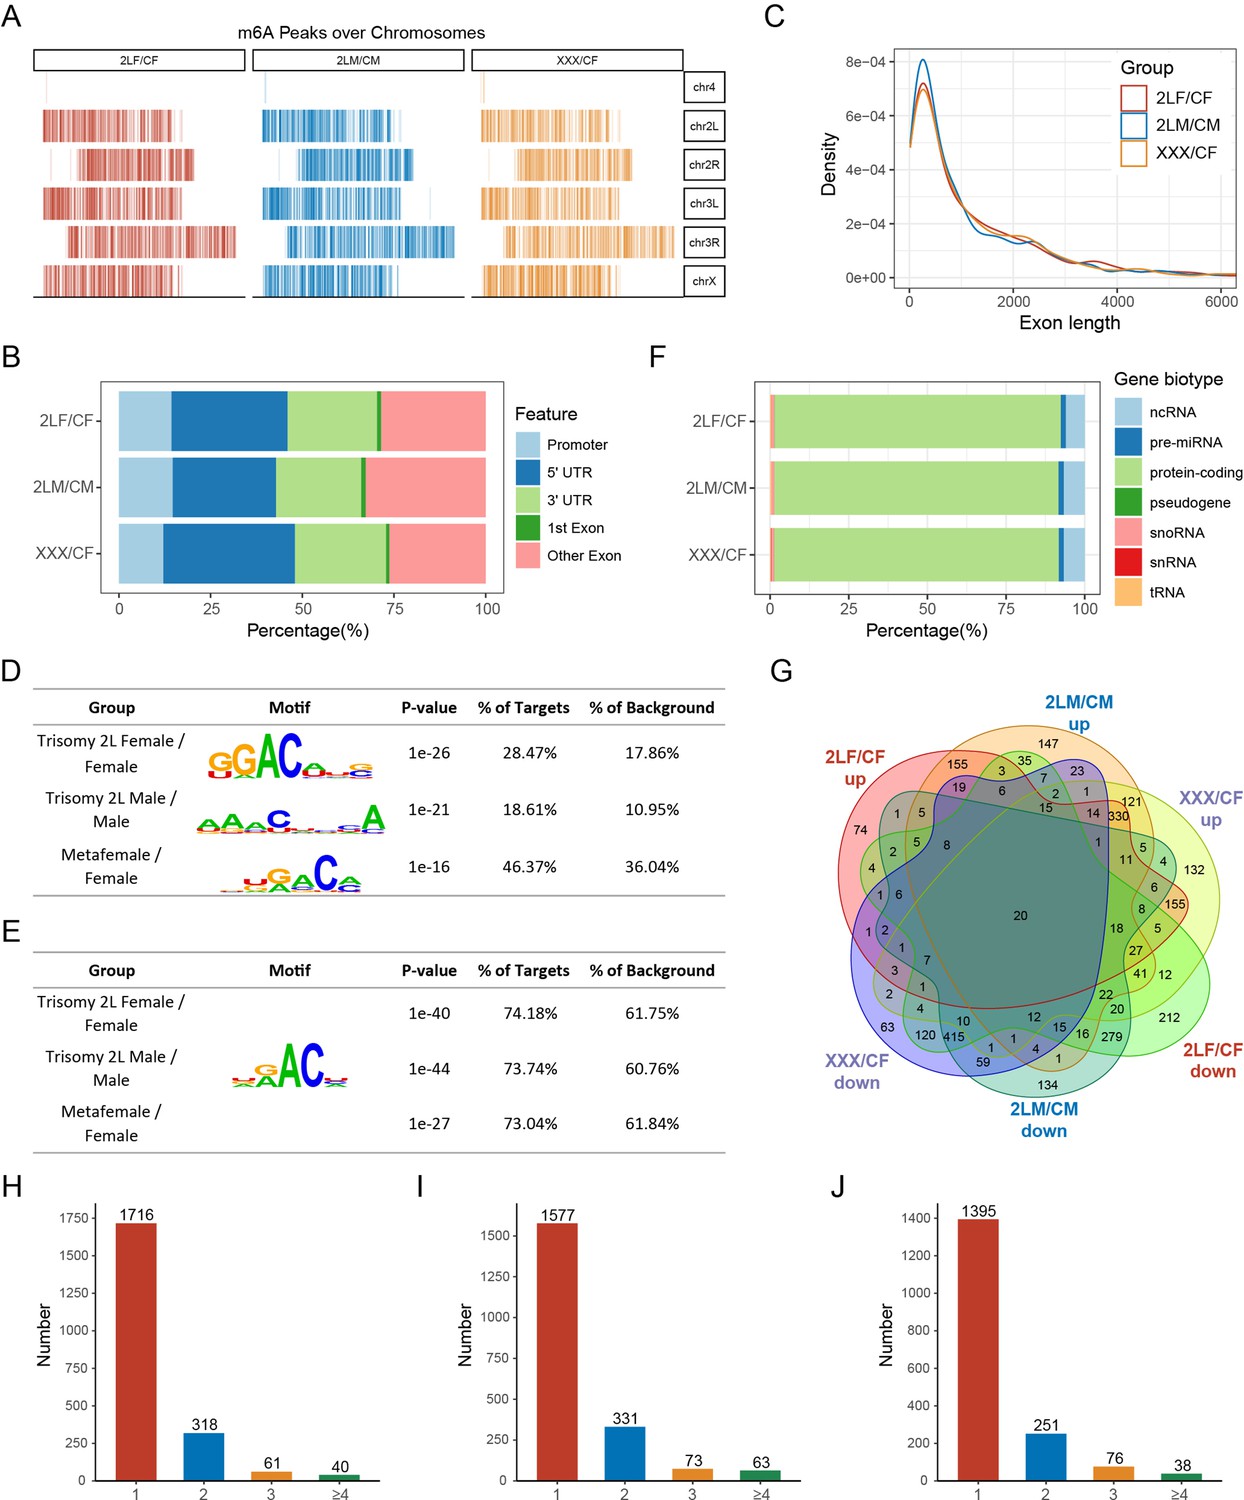
Characteristics of differentially methylated peak (DMP) associated genes.
(A) Distribution of DMPs along each chromosome. (B) Percentages of DMPs localized on different gene features. (C) Kernel density plot showing the distribution of exon lengths of DMP-associated genes. (D) The top enriched motifs with de novo motif analysis of DMPs in each comparison. (E) Enrichment analysis performed on the known m6A consensus motif DRACH (D=G/A/U, R=G/A, H=U/A/C). (F) Gene biotypes of DMP-associated genes. (G) Venn diagram showing the intersection of DMP-associated genes in each comparison. (H–J) Statistics of the number of DMPs on DMP-associated genes in trisomy 2L females compared with wildtype females (H), trisomy 2L males compared with wildtype males (I), and metafemales compared with wildtype females (J). CF, wildtype female control; CM, wildtype male control; 2LF, trisomy 2L female; 2LM, trisomy 2L male; XXX, metafemale; 5′UTR, 5′ untranslated region; 3′UTR, 3′ untranslated region.
Figure 4 with 1 supplement
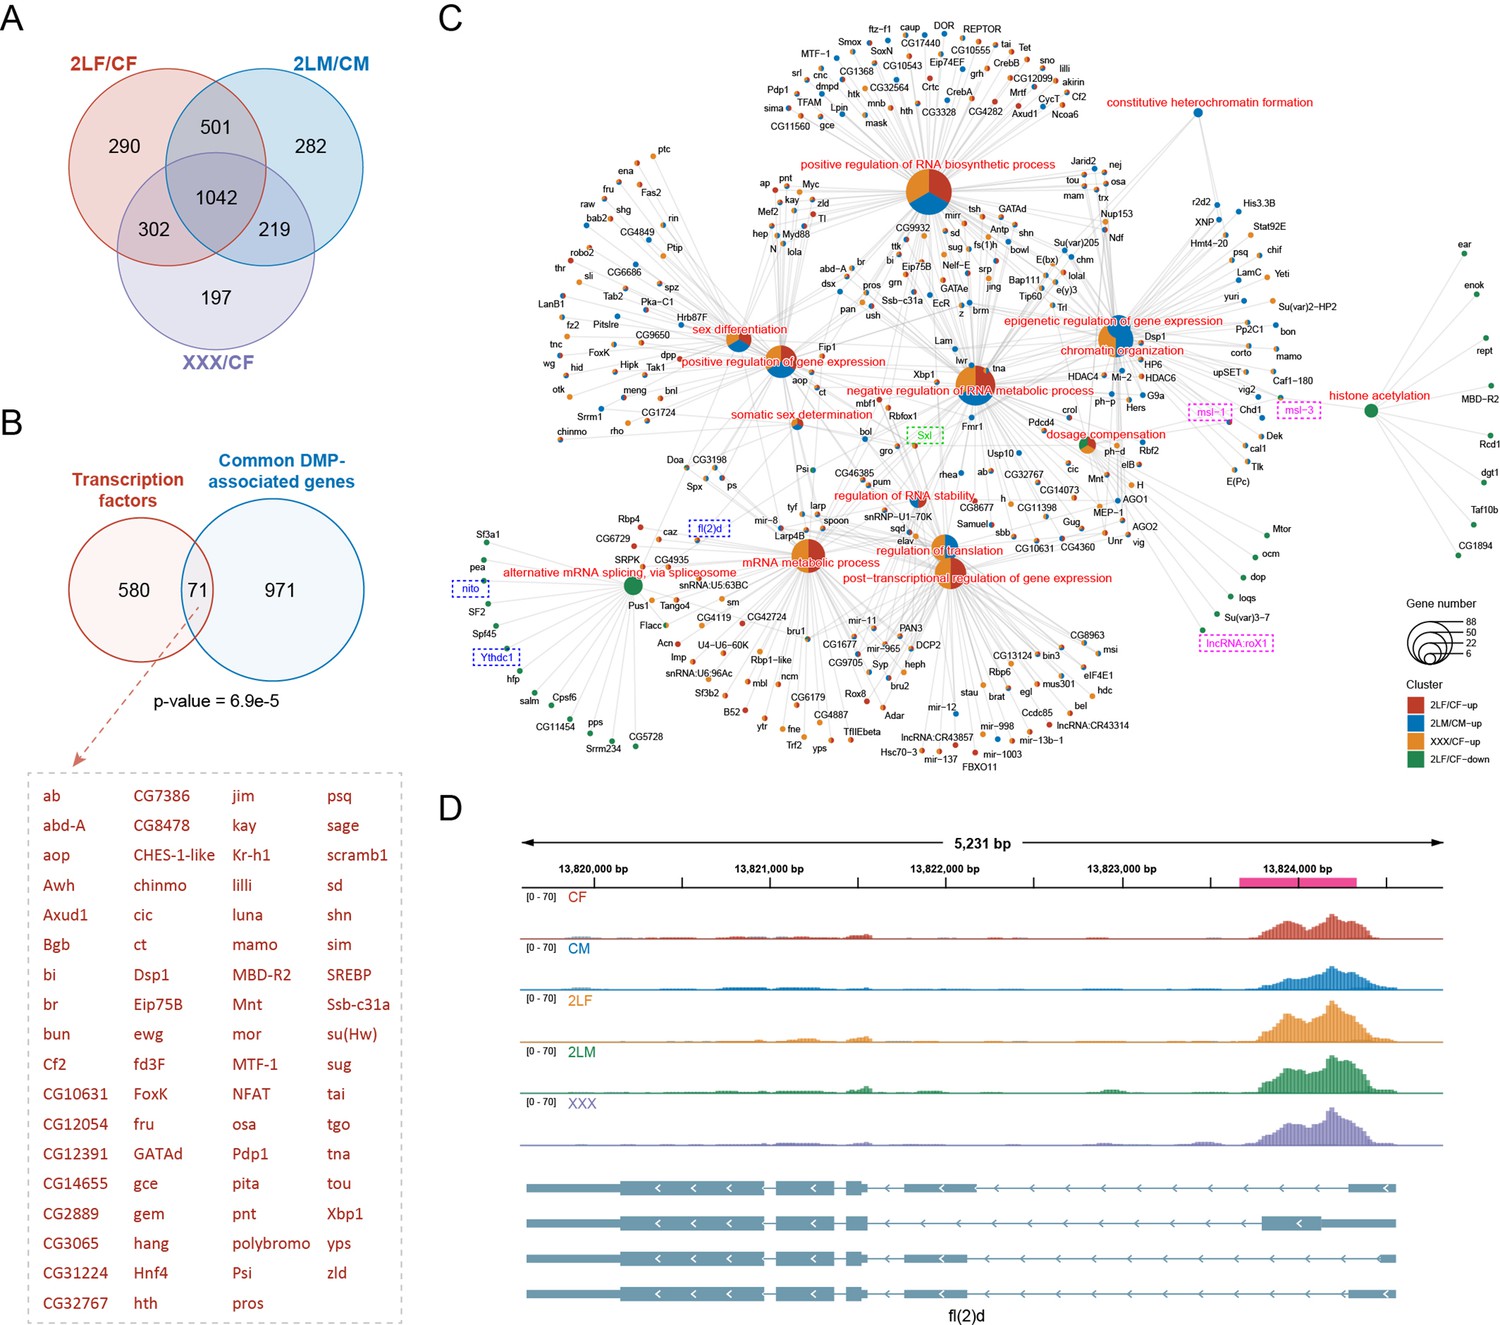
Differentially methylated peak (DMP) associated genes and their functions.
(A) Venn diagram showing the number of common DMP-associated genes in three types of aneuploidies compared with wildtypes. (B) Venn diagram showing the intersection of transcription factors and the common DMP-associated genes in all comparisons. Transcription factors with DMPs were listed on the right. p-Value indicates one-tailed Fisher’s exact test. (C) Network showing the functions related to expression regulation and dosage compensation enriched by DMP-associated genes. The color of the nodes indicates the comparison, and the size of the function nodes represents the number of DMP-associated genes connected with them. (D) Genome browser example of fl(2)d for indicated m6A methylated RNA immunoprecipitation sequencing (MeRIP-seq) data. Steelblue color represents input reads, while other colors represent IP reads. Signals were displayed as the mean counts per million (CPM) of two biological replicates. The gene architectures were shown at the bottom. The magenta rectangles at above represent DMP. CF, wildtype female control; CM, wildtype male control; 2LF, trisomy 2L female; 2LM, trisomy 2L male; XXX, metafemale.
Figure 4—figure supplement 1
Functional and pathway analysis of differentially methylated peak (DMP) associated genes.
(A) Functional enrichment analysis of DMP-associated genes. Top 10 enriched GO terms (Biological Process) with adjusted p-value<0.05 in each comparison were shown. (B) UpSet plot showing the shared sets of enriched GO terms of DMP-associated genes in different aneuploidies. (C) Kyoto Encyclopedia of Genes and Genomes (KEGG) pathway enrichment analysis of DMP-associated genes. Top 10 enriched pathways with p-value<0.1 in each comparison were shown. (D) UpSet plot showing the shared sets of enriched KEGG pathways of DMP-associated genes in different aneuploidies. CF, wildtype female control; CM, wildtype male control; 2LF, trisomy 2L female; 2LM, trisomy 2L male; XXX, metafemale.
Figure 5 with 1 supplement
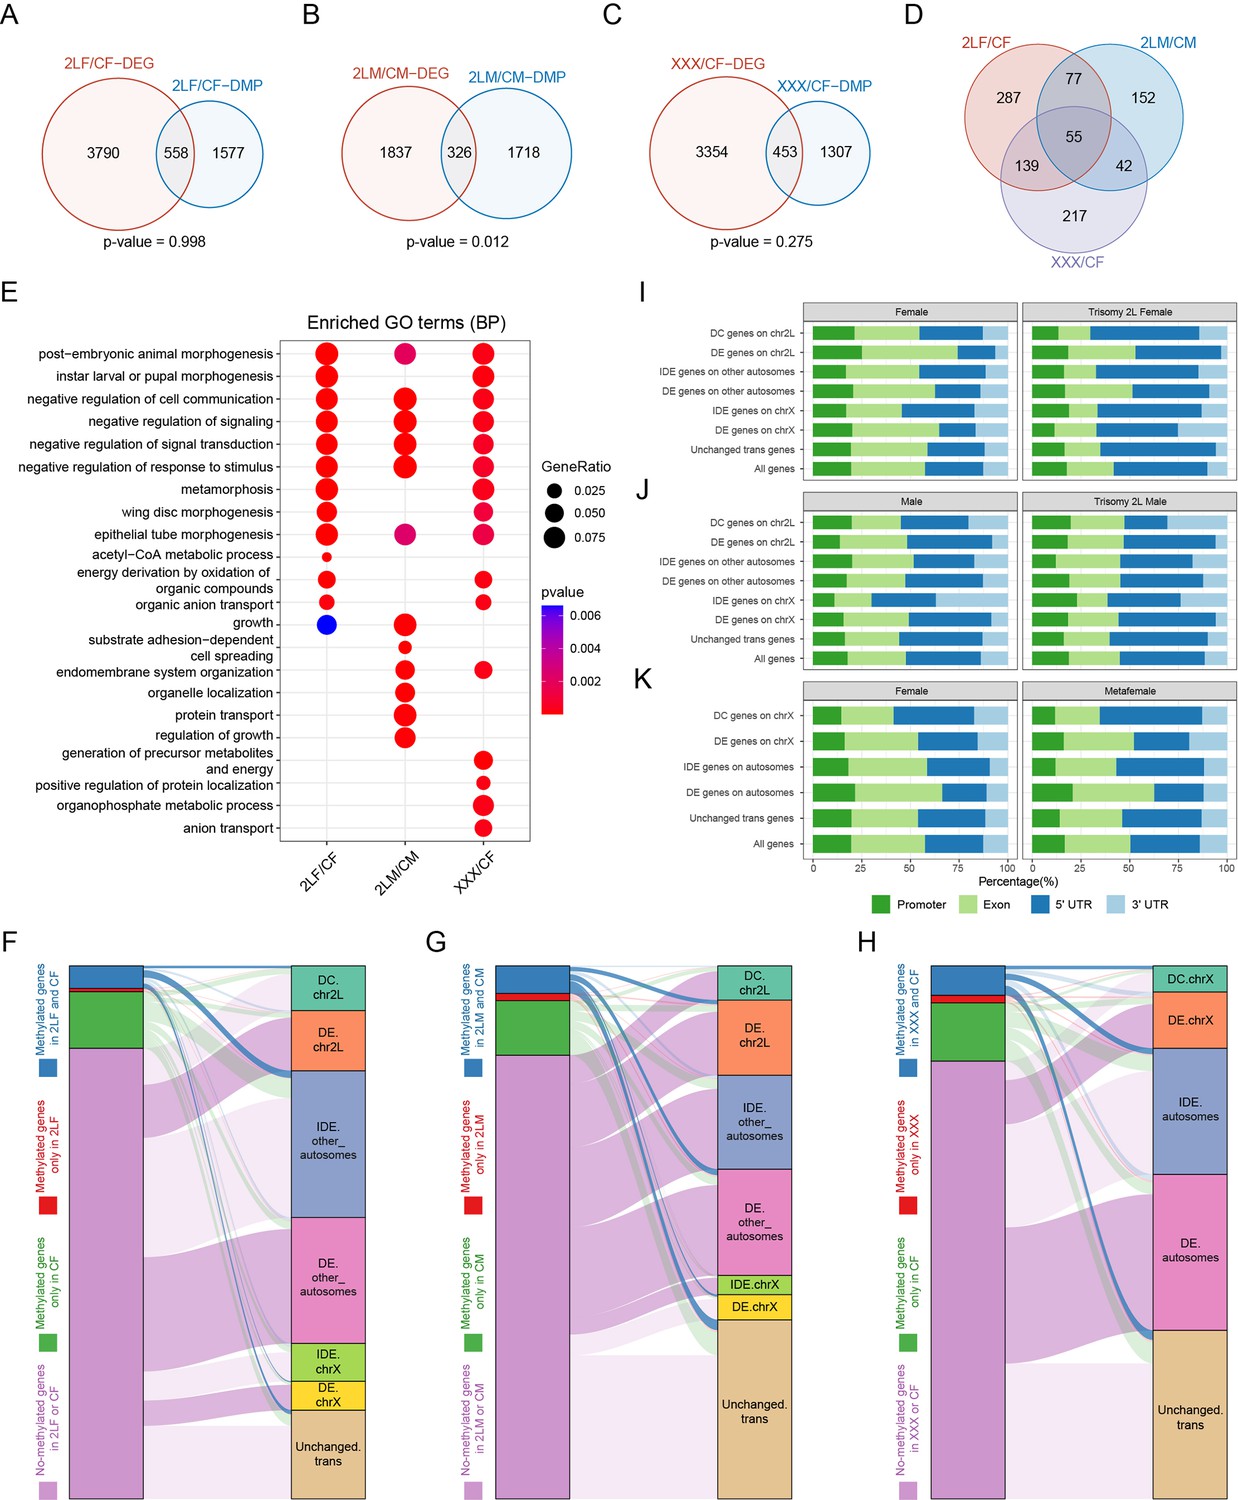
Relationships between RNA m6A methylation and gene expression in aneuploidy.
(A–C) Venn diagrams showing the intersections of differentially expressed genes (DEGs) and differentially methylated peak (DMP) associated genes in trisomy 2L females (A), trisomy 2L males (B), and metafemales (C) compared with their corresponding controls. p-Values indicate one-tailed Fisher’s exact tests. (D) The common differentially expressed and differentially methylated genes in all groups. (E) Functional enrichment analysis of simultaneously differentially expressed and differentially methylated genes. Top 10 enriched GO terms (Biological Process) with p-value<0.1 in each comparison were shown. (F–H) Sankey diagrams showing the relationships between genes with different m6A-modified states and genes with canonical dosage effect (DE), dosage compensation (DC), and inverse dosage effect (IDE) in trisomy 2L females (F), trisomy 2L males (G), and metafemales (H). Enrichment analysis was performed on each two groups of genes, and deep color lines indicate significant connection relationships (Fisher’s exact test p-value<0.05). (I–K) Gene feature distributions for m6A peaks on genes with canonical DE, DC, and IDE in trisomy 2L females (I), trisomy 2L males (J), metafemales (K), and their corresponding controls. CF, wildtype female control; CM, wildtype male control; 2LF, trisomy 2L female; 2LM, trisomy 2L male; XXX, metafemale; DEG, differentially expressed gene; DMP, differentially methylated peak; DE, dosage effect; DC, dosage compensation; IDE, inverse dosage effect. Canonical DE refers to ratio >1.25, DC stands for 0.8<ratio<1.25, IDE stands for 0.5<ratio<0.8, and unchanged refers to 0.8<ratio<1.25.
Figure 5—figure supplement 1
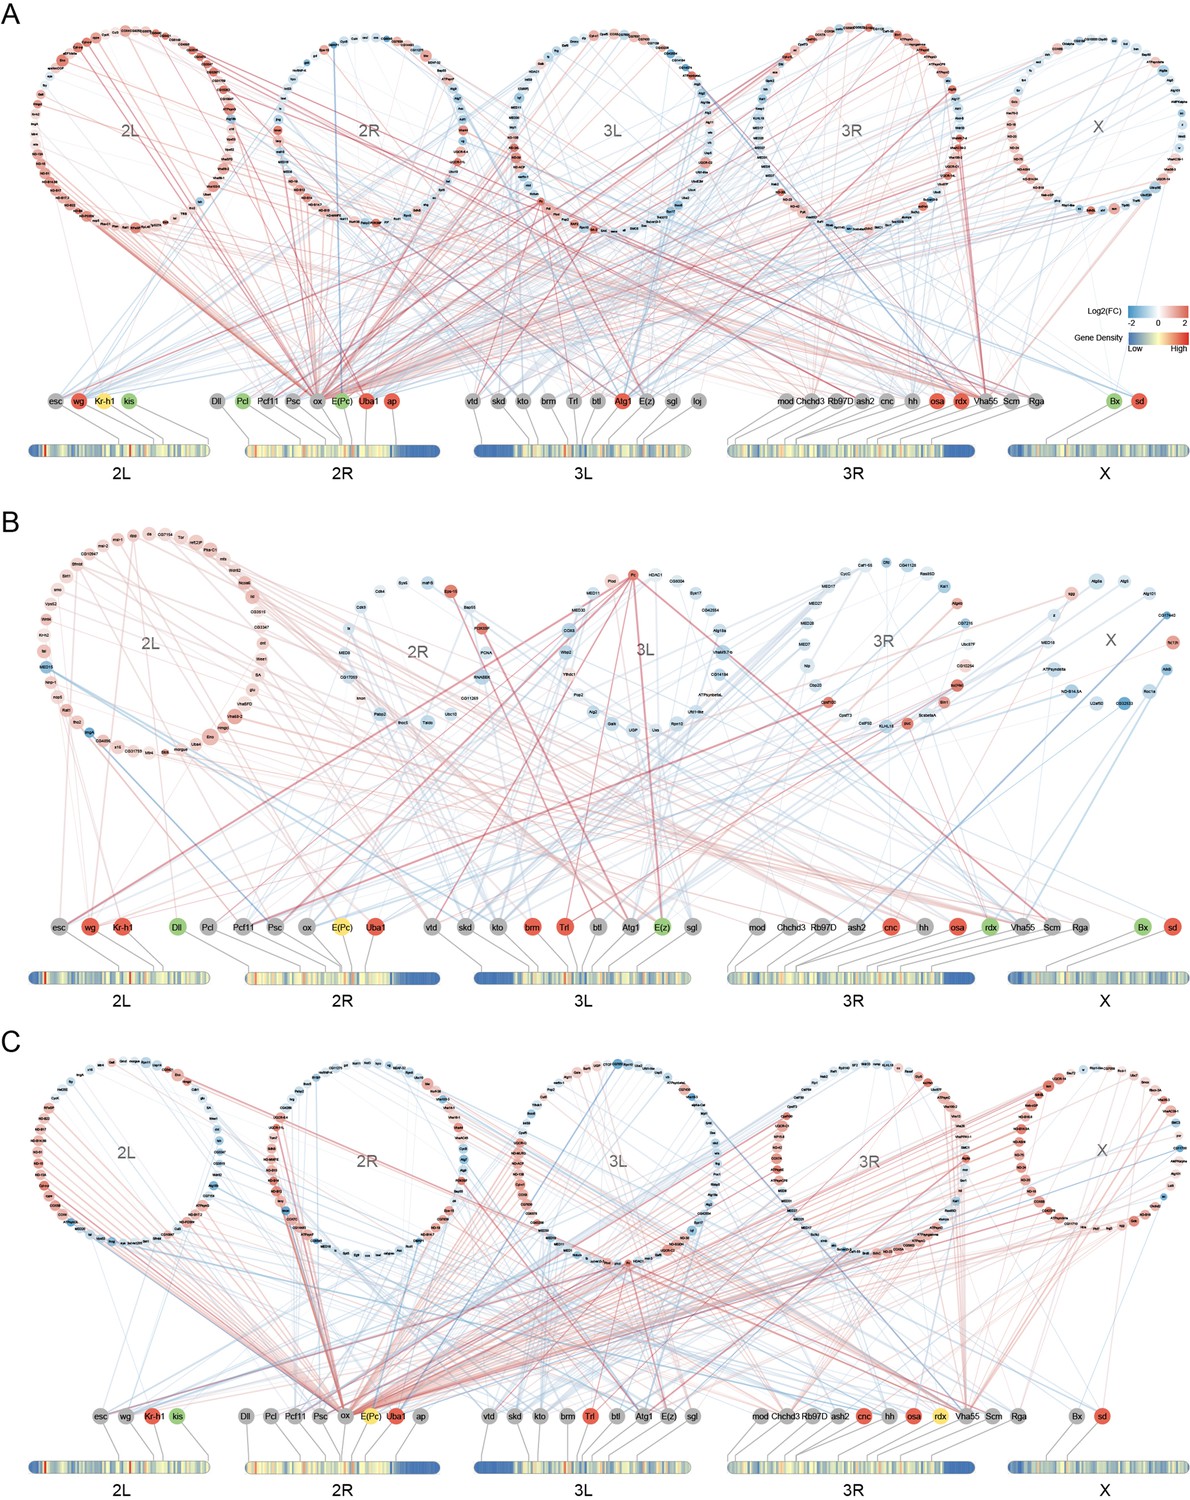
Dosage-sensitive modifiers and their interactors in aneuploid Drosophila.
(A–C) Networks showing the methylation status of known dosage-sensitive modifiers and the expression changes of genes interact with these modifiers in trisomy 2L females (A), trisomy 2L males (B), and metafemales (C), respectively. Protein-protein interaction (PPI) relationships were obtained from the STRING database. The colors of the heatmaps on chromosomes represent the gene density. Dosage-sensitive modifiers were arranged according to their localizations, with red indicating genes with up-regulated differentially methylated peaks (DMPs), green indicating genes with down-regulated DMPs, yellow indicating genes with both up- and down-regulated DMPs, and gray indicating genes without DMPs. The interactors of these modifiers were also separated by chromosomes, and the colors of the nodes and edges indicate the log2(fold changes) of gene expression in trisomies. The width of the edges represents the combined score, and only interactions with combined score ≥700 were selected for presentation.
Figure 6 with 1 supplement
Combined analysis of differential alternative splicing (DAS) and differential methylation.
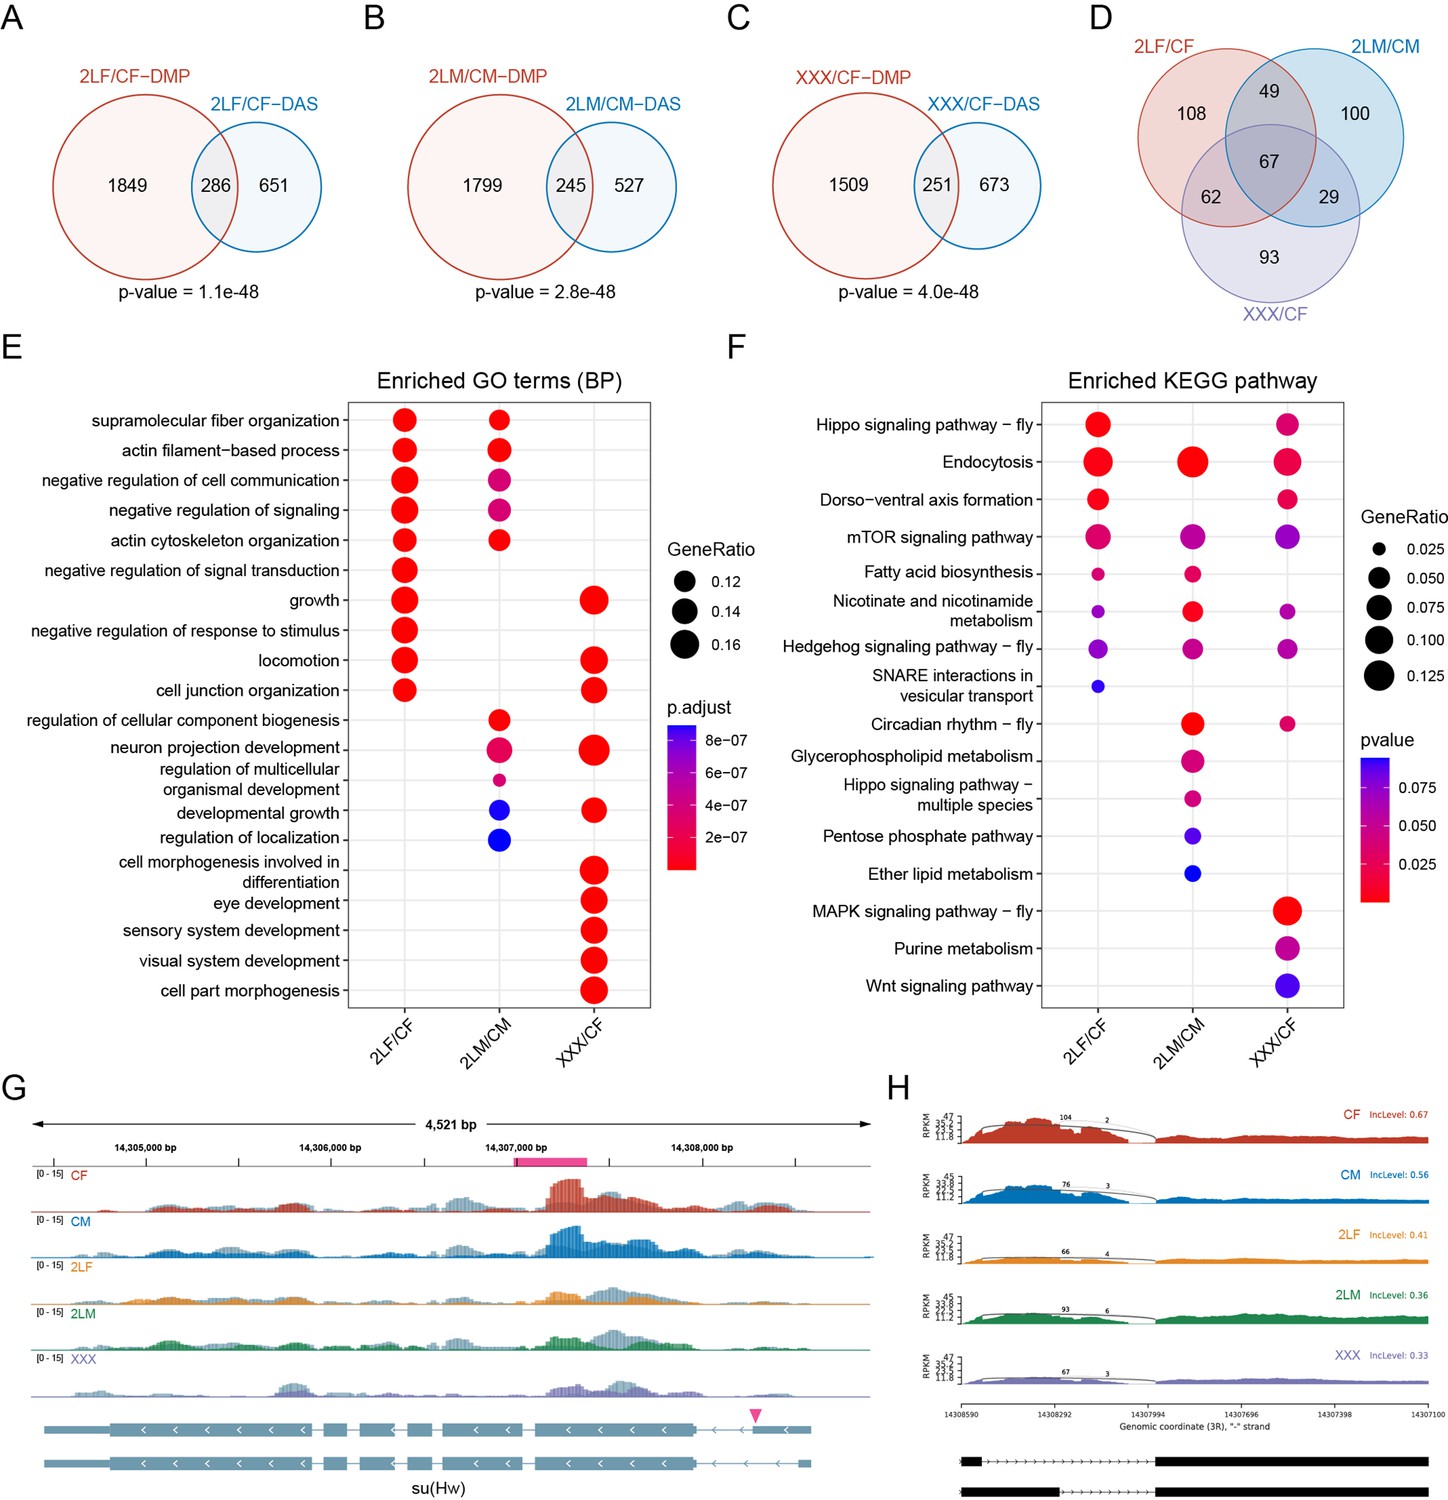
(A–C) Venn diagrams showing the intersections of DAS genes and differentially methylated peak (DMP) associated genes in trisomy 2L females (A), trisomy 2L males (B), and metafemales (C) compared with their corresponding controls. p-Values indicate one-tailed Fisher’s exact tests. (D) The common differentially alternatively spliced and differentially methylated genes in all groups. (E) Functional enrichment analysis of simultaneously differentially alternatively spliced and differentially methylated genes. Top 10 enriched GO terms (Biological Process) with p-value<0.05 in each comparison were shown. (F) Kyoto Encyclopedia of Genes and Genomes (KEGG) pathway enrichment analysis of simultaneously differentially alternatively spliced and differentially methylated genes. Top 10 enriched pathways with p-value<0.1 in each comparison were shown. (G) Genome browser example of su(Hw) for indicated m6A methylated RNA immunoprecipitation sequencing (MeRIP-Seq) data. Steelblue color represents input reads, while other colors represent IP reads. Signals were displayed as the mean CPM of two biological replicates. The gene architecture was shown at the bottom (only two representative transcript isoforms were shown). The magenta rectangle at above represents DMP. The magenta arrowhead indicates the position of differential alternative splicing. (H) Sashimi plot depicting RNA sequencing reads and exon junction reads at the position where the differential splicing events occur on su(Hw). The gene model was shown below. One of the biological replicates was chosen for representation. CF, wildtype female control; CM, wildtype male control; 2LF, trisomy 2L female; 2LM, trisomy 2L male; XXX, metafemale; DAS, differential alternative splicing; DMP, differentially methylated peak; CPM, counts per million; RPKM, reads per kilobase per million mapped reads.
Figure 6—figure supplement 1
Alternative splicing analysis in aneuploidies.
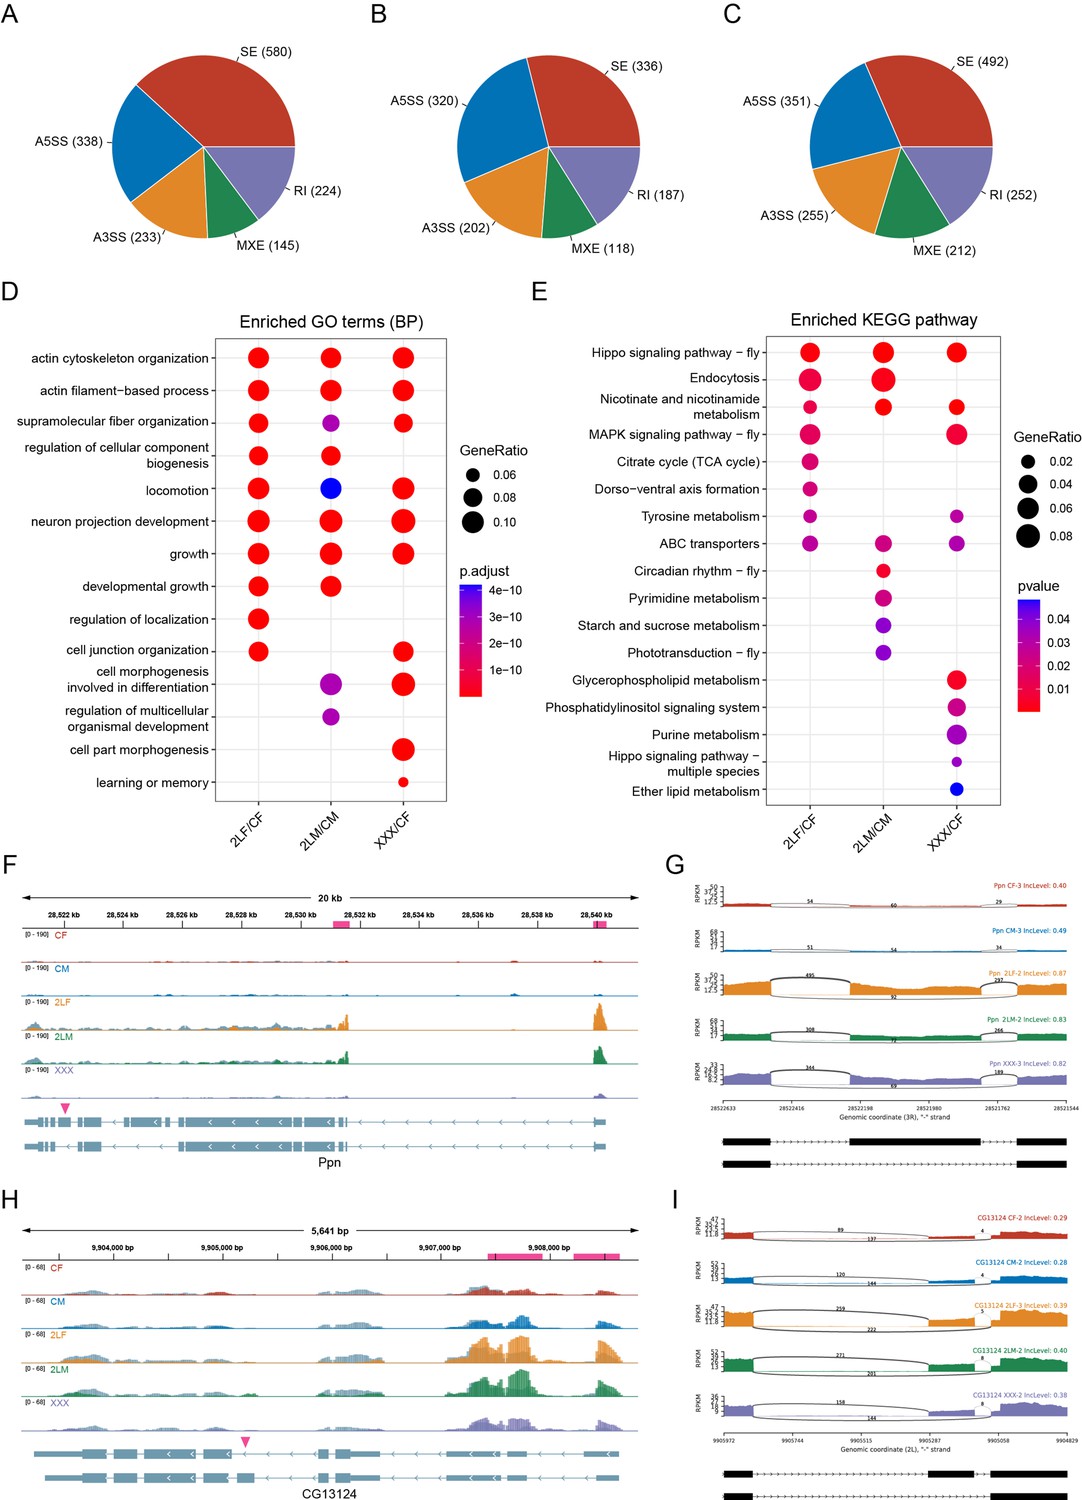
(A–C) Numbers of differential alternative splicing events in trisomy 2L females (A), trisomy 2L males (B), and metafemales (C). SE, skipped exon; A5SS, alternative 5’ splice site; A3SS, alternative 3’ splice site; MXE, mutually exclusive exons; RI, retained intron. (D) Functional enrichment analysis of differentially alternatively spliced genes. Top 10 enriched GO terms (Biological Process) with p-value<0.05 in each comparison were shown. (E) Kyoto Encyclopedia of Genes and Genomes (KEGG) pathway enrichment analysis of differentially alternatively spliced genes. Top 10 enriched pathways with p-value<0.05 in each comparison were shown. (F,H) Genome browser example of Ppn (F) and CG13124 (H) for indicated m6A methylated RNA immunoprecipitation sequencing (MeRIP-seq) data. Steelblue color represents input reads, while other colors represent IP reads. Signals were displayed as the mean CPM of two biological replicates. The gene architectures were shown at the bottom (only two representative transcript isoforms were shown). The magenta rectangles at above represent differentially methylated peaks (DMPs). The magenta arrowheads indicate the positions of differential alternative splicing. (G,I) Sashimi plots depicting RNA sequencing reads and exon junction reads at the positions where the differential splicing events occur on Ppn (G) and CG13124 (I). The gene models were shown below. One of the biological replicates was chosen for representation. CF, wildtype female control; CM, wildtype male control; 2LF, trisomy 2L female; 2LM, trisomy 2L male; XXX, metafemale; CPM, counts per million; RPKM, reads per kilobase per million mapped reads.
Figure 7 with 1 supplement
Interactions between m6A and Drosophila male-specific lethal (MSL) complex.
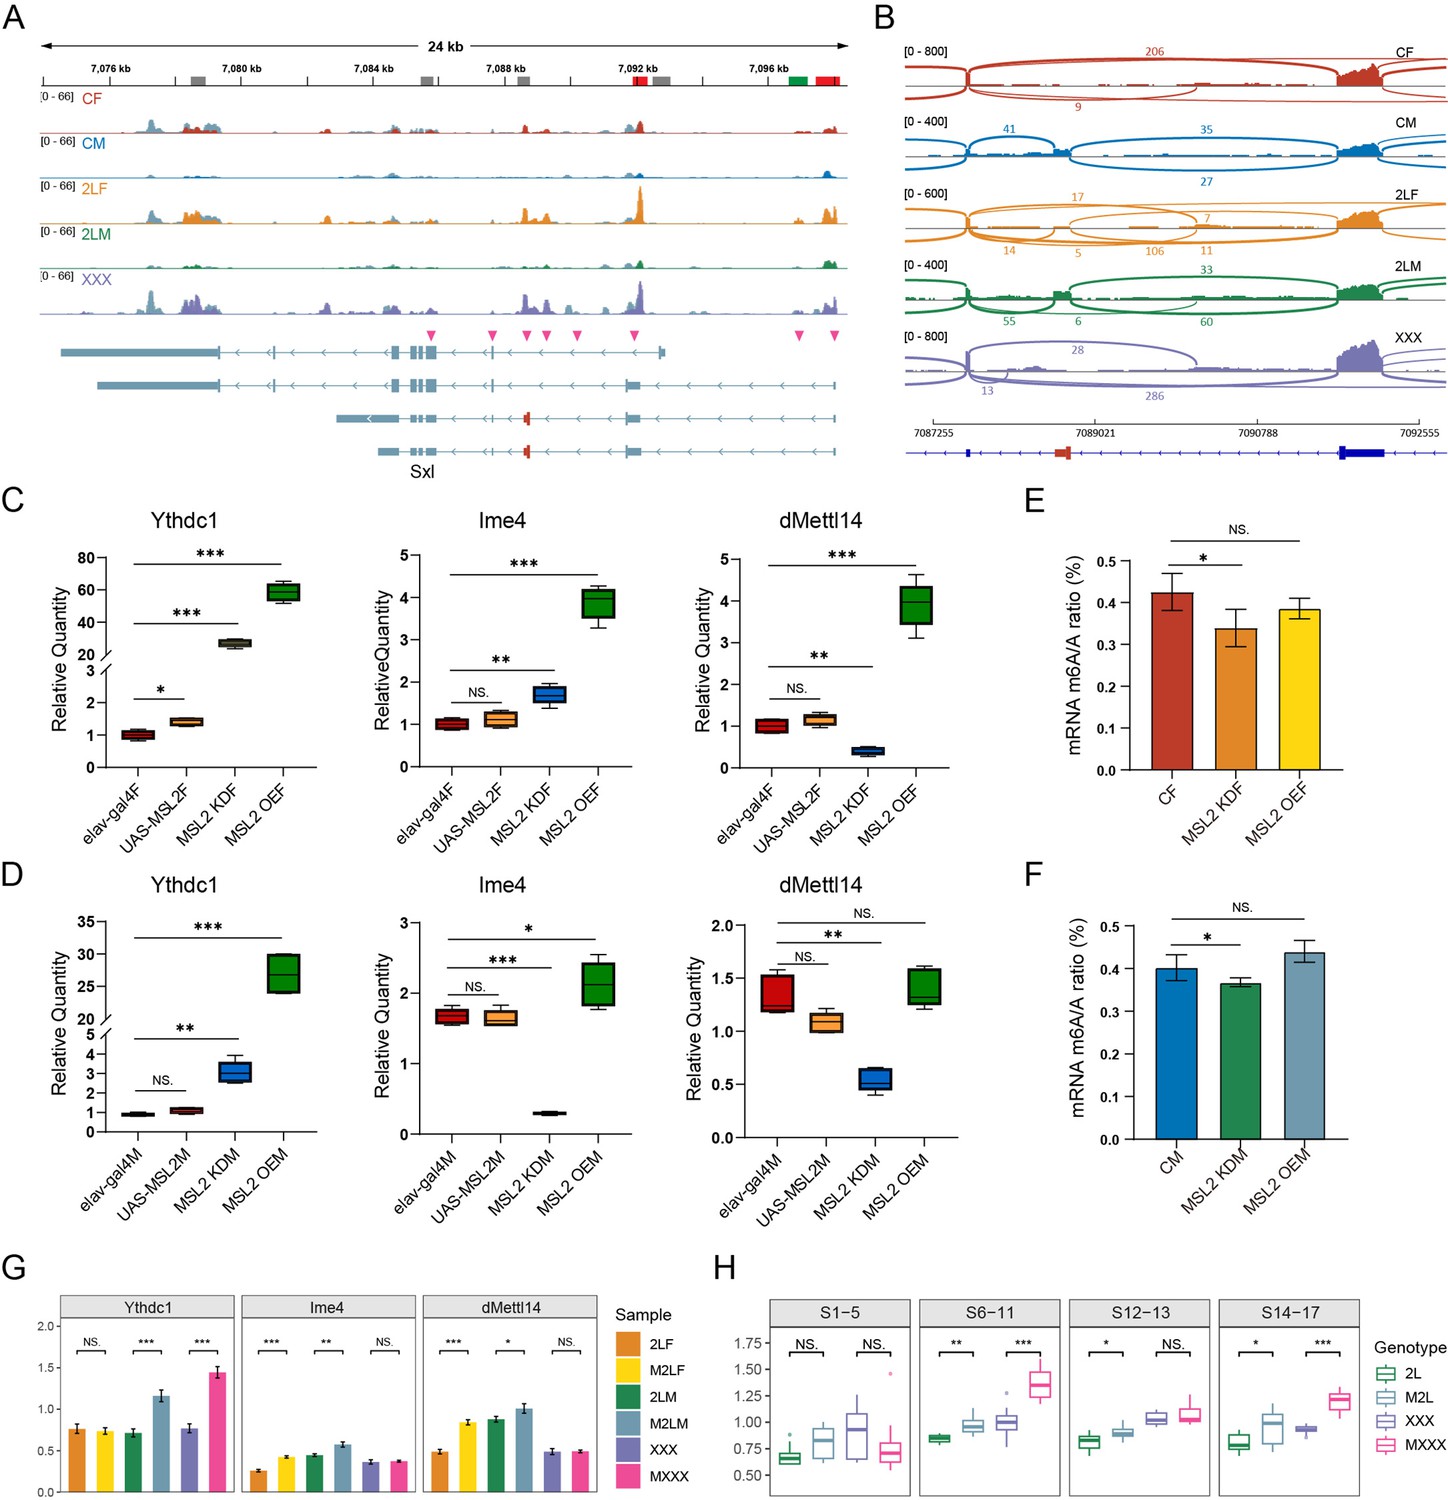
(A) Genome browser example of Sxl for indicated m6A methylated RNA immunoprecipitation sequencing (MeRIP-Seq) data. Steelblue color represents input reads, while other colors represent IP reads. Signals were displayed as the mean counts per million (CPM) of two biological replicates. The gene architecture was shown at the bottom (only four representative transcript isoforms were shown). The rectangles at above represent m6A peaks, where red indicates up-regulated differentially methylated peaks (DMPs), green indicates down-regulated DMP, and gray indicates no significant changes. The magenta arrowheads indicate the positions of alternative splicing. (B) Sashimi plot depicting RNA sequencing reads and exon junction reads at the position where the differential splicing events occurs on Sxl. The gene model was shown below, with the third exon indicated in red. One of the biological replicates was chosen for representation. CF, wildtype female control; CM, wildtype male control; 2LF, trisomy 2L female; 2LM, trisomy 2L male; XXX, metafemale. (C,D) RT-qPCR analysis of messenger RNA (mRNA) levels of m6A components in the heads of MSL2 transgenic female (C) and male (D) Drosophila adults. (E,F) Abundance of mRNA m6A modification in the heads of MSL2 transgenic females (E) and males (F). MSL2 KDF, MSL2 neural-knockdown female; MSL2 KDM, MSL2 neural-knockdown male; MSL2 OEF, MSL2-overexpressed female; MSL2 OEM, MSL2-overexpressed male. Sample size = 3. Student’s t test *p<0.05, **p<0.01, ***p<0.001. (G) RT-qPCR analysis of mRNA levels of m6A regulators in the brains of trisomy and MSL2-overexpressed trisomy Drosophila larvae. 2LF, trisomy 2L female; 2LM, trisomy 2L male; XXX, metafemale; M2LF, MSL2-overexpressed trisomy 2L female; M2LM, MSL2-overexpressed trisomy 2L male; MXXX, MSL2-overexpressed metafemale. Sample size = 3. Student’s t test *p<0.05, **p<0.01, ***p<0.001. (H) The expression levels of Ime4 in trisomy and MSL2-overexpressed trisomy embryos represented by relative fluorescence intensity of probes. The expression of wildtype embryos was set as one. 2L, trisomy 2L; M2L, MSL2-overexpressed trisomy 2L; XXX, metafemale; MXXX, MSL2-overexpressed metafemale. Sample size = 10. Student’s t test *p<0.05, **p<0.01, ***p<0.001.
Figure 7—figure supplement 1
The relationships between m6A methylation and male-specific lethal (MSL) complex.
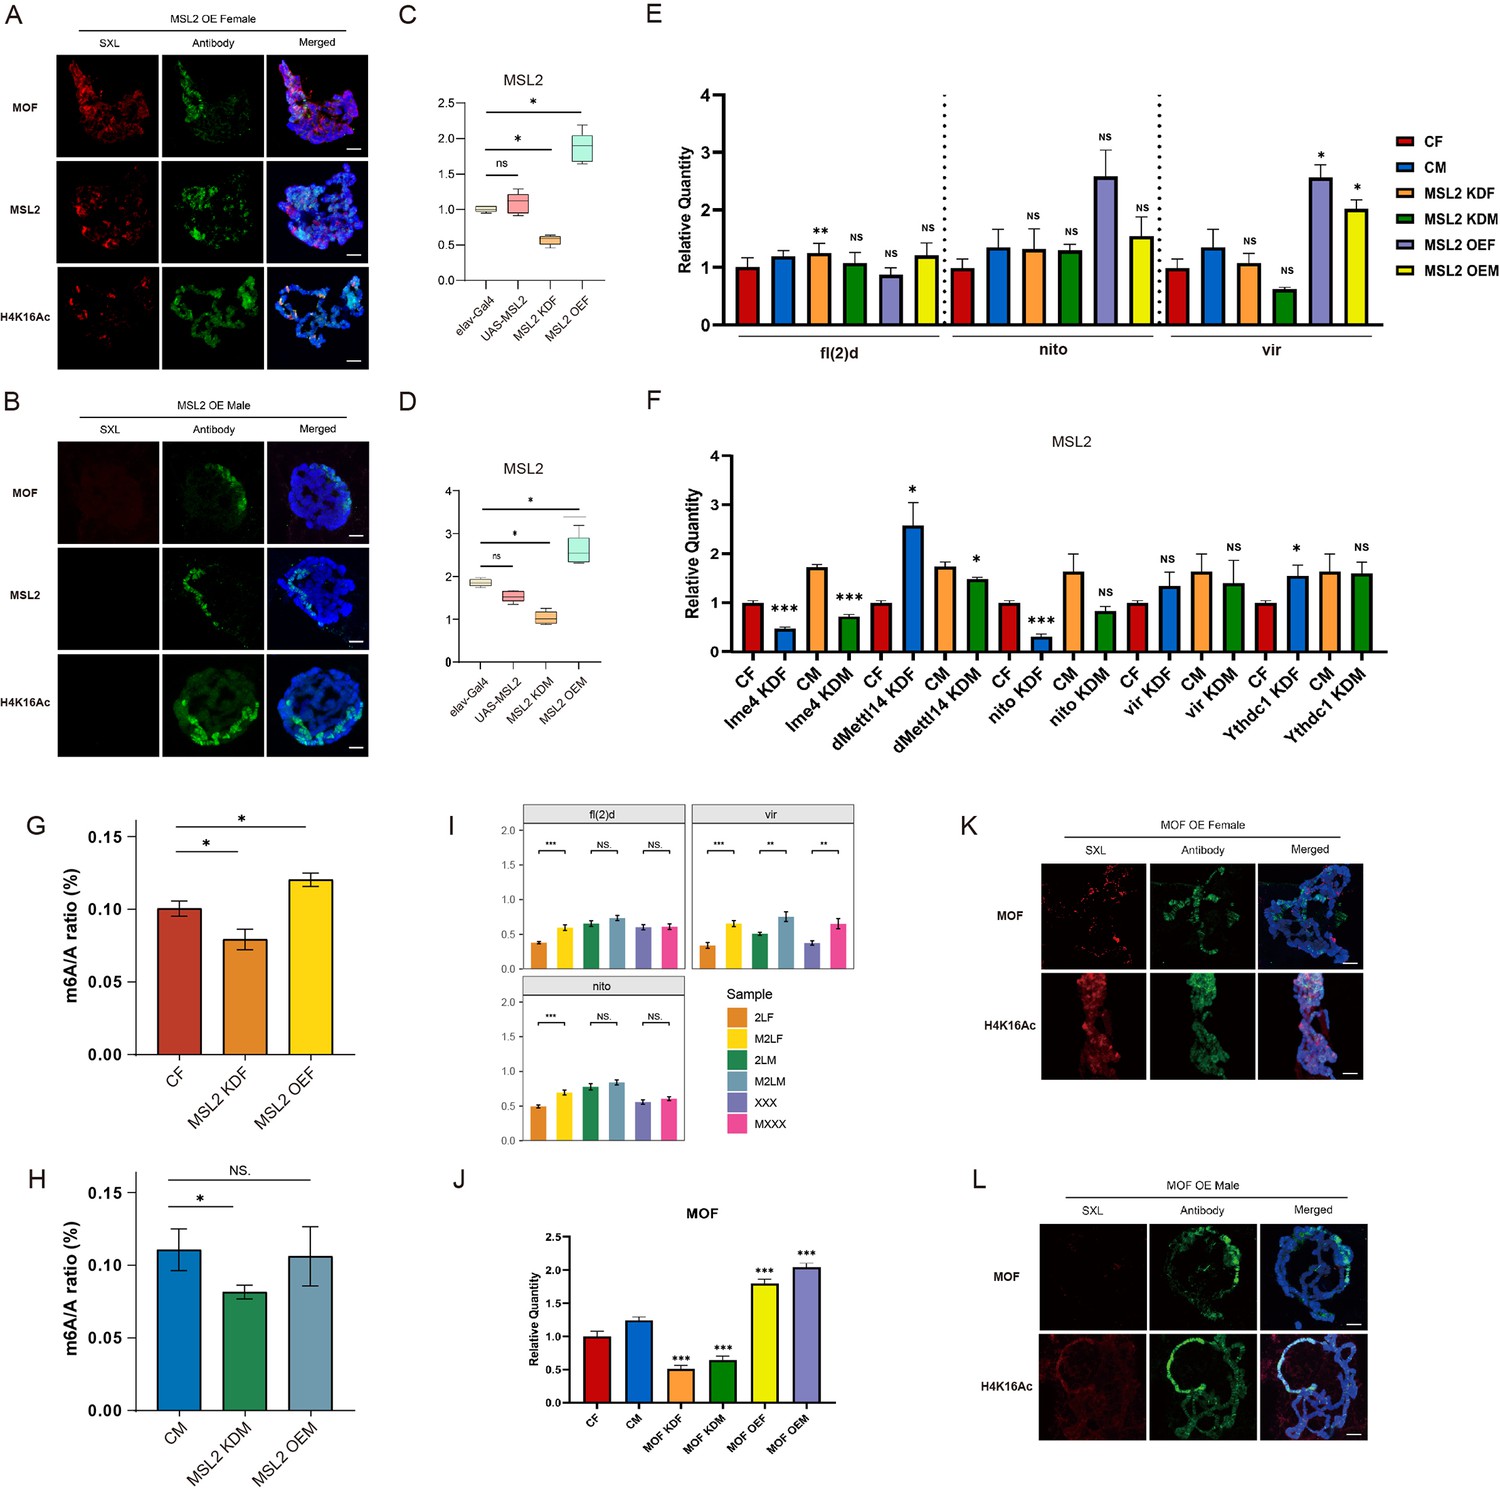
(A,B) Immunofluorescence of polytene chromosomes in MSL2-overexpressed female (A) and male (B) larvae. The red channel is the signal from SXL and the green channel is the signal from antibodies of MSL complex components. DNA is stained with DAPI in blue. Scale bars, 10 μm. OE, overexpressed. (C,D) RT-qPCR analysis of messenger RNA (mRNA) levels of MSL2 in the heads of MSL2 transgenic female (C) and male (D) Drosophila adults. Sample size = 3. Student’s t test *p<0.05, **p<0.01, ***p<0.001. OE, overexpressed. (E) RT-qPCR analysis of mRNA levels of m6A regulators in the heads of MSL2 transgenic Drosophila. CF, wildtype female control; CM, wildtype male control; OEF, overexpressed female; OEM, overexpressed male; KDF, knockdown female; KDM, knockdown male. Sample size = 3. Student’s t test *p<0.05, **p<0.01, ***p<0.001. (F) RT-qPCR analysis of mRNA levels of MSL2 in the heads of m6A regulators knockdown Drosophila. CF, wildtype female control; CM, wildtype male control; OEF, overexpressed female; OEM, overexpressed male; KDF, knockdown female; KDM, knockdown male. Sample size = 3. Student’s t test *p<0.05, **p<0.01, ***p<0.001.(G,H) Abundance of total RNA m6A modification in the heads of MSL2 transgenic females (G) and males (H). MSL2 KDF, MSL2 neural-knockdown female; MSL2 KDM, MSL2 neural-knockdown male; MSL2 OEF, MSL2-overexpressed female; MSL2 OEM, MSL2-overexpressed male. Sample size = 3. Student’s t test *p<0.05, **p<0.01, ***p<0.001.(I) RT-qPCR analysis of mRNA levels of m6A regulators in the brains of trisomy and MSL2-overexpressed trisomy Drosophila larvae. 2LF, trisomy 2L female; 2LM, trisomy 2L male; XXX, metafemale; M2LF, MSL2-overexpressed trisomy 2L female; M2LM, MSL2-overexpressed trisomy 2L male; MXXX, MSL2-overexpressed metafemale. Sample size = 3. Student’s t test *p<0.05, **p<0.01, ***p<0.001. (J) RT-qPCR analysis of mRNA levels of MOF in the heads of MOF transgenic Drosophila. CF, wildtype female control; CM, wildtype male control; OEF, overexpressed female; OEM, overexpressed male; KDF, knockdown female; KDM, knockdown male. Sample size = 3. Student’s t test *p<0.05, **p<0.01, ***p<0.001. (K,L) Immunofluorescence of polytene chromosomes in MOF-overexpressed female (H) and male (I) larvae. The red channel is the signal from SXL and the green channel is the signal from MOF or H4K16Ac. DNA is stained with DAPI in blue. Scale bars, 10 μm. OE, overexpressed.
Figure 8 with 2 supplements
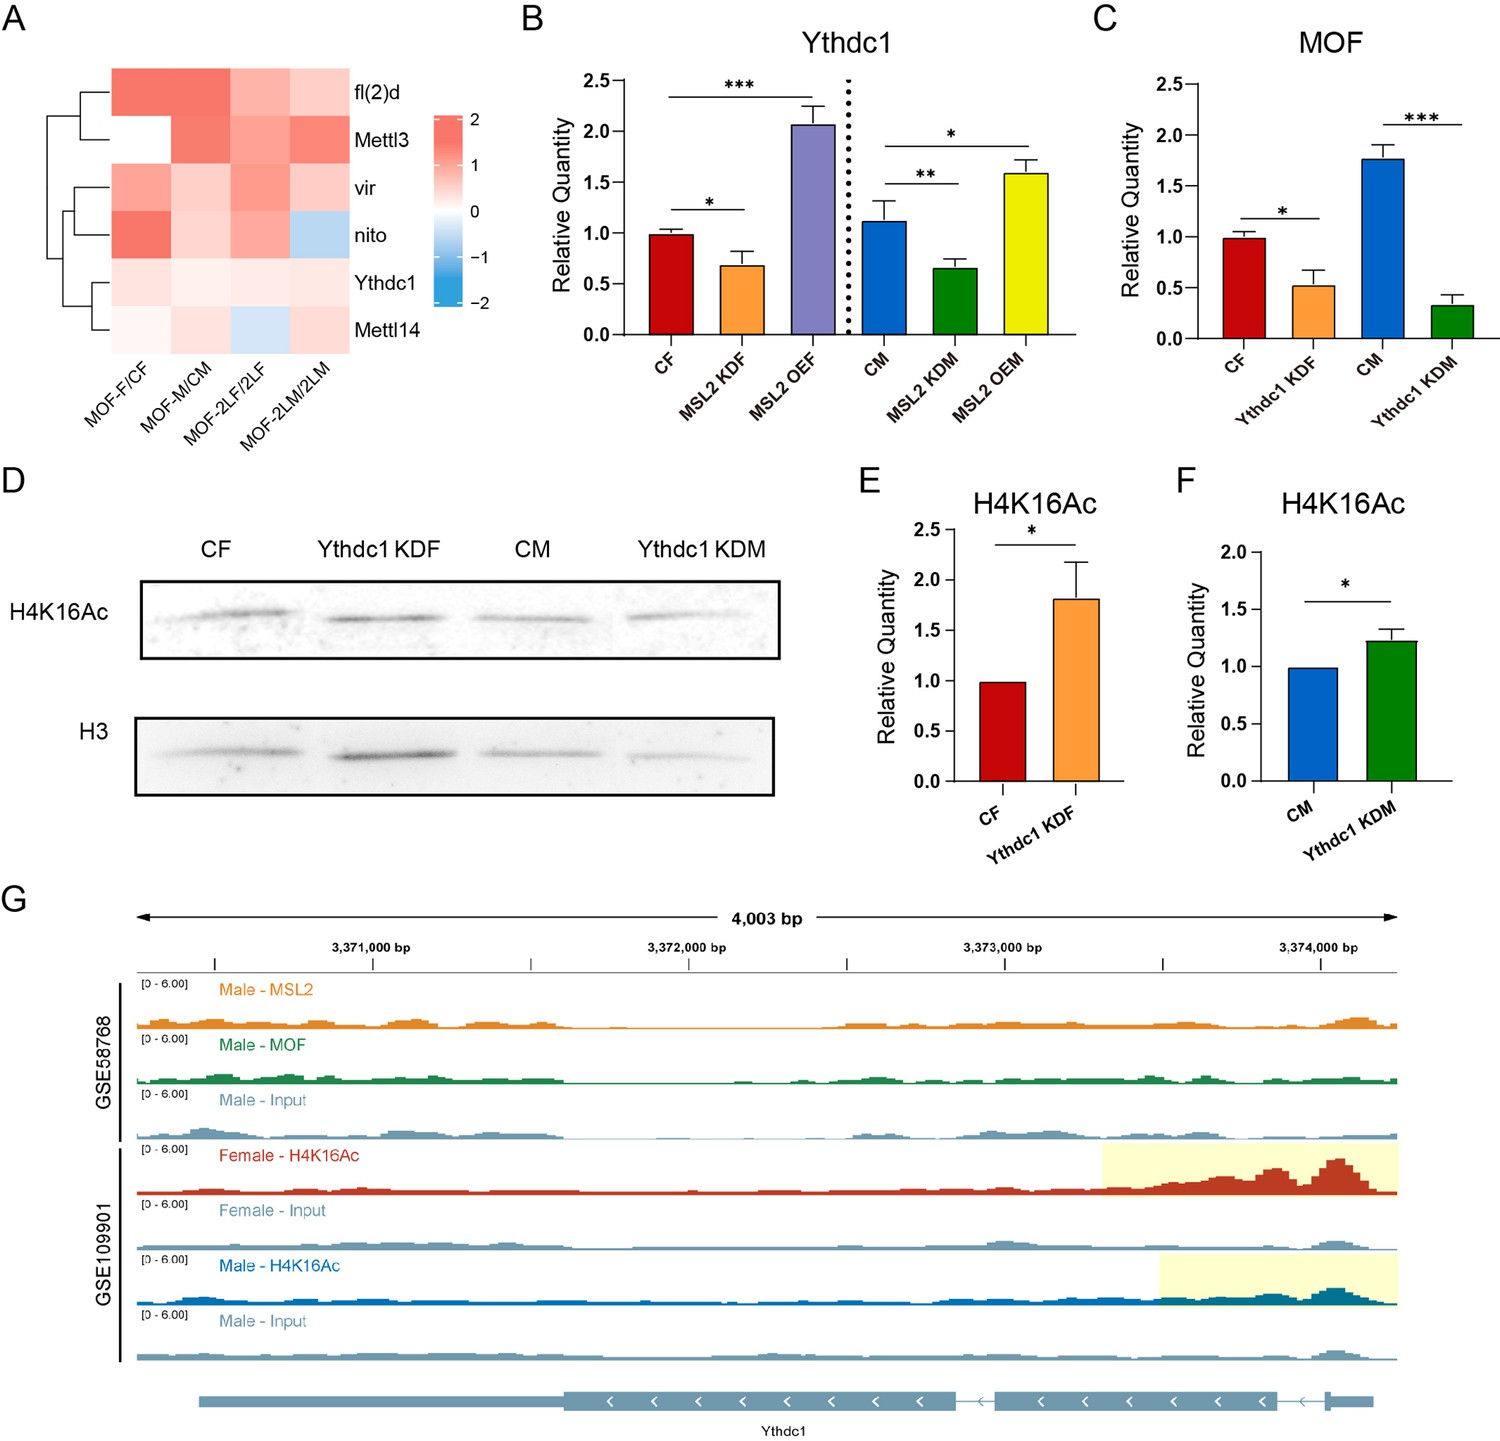
RNA m6A modification regulate histone acetyltransferase MOF and H4K16Ac.
(A) Heatmap of the expression changes of m6A regulators in MOF overexpressing Drosophila larvae. The color of the heatmap represents log2(ratio). CF, wildtype female control; CM, wildtype male control; MOF-F, MOF-overexpressed female; MOF-M, MOF-overexpressed male; 2LF, trisomy 2L female; 2LM, trisomy 2L male; MOF-2LF, MOF-overexpressed trisomy 2L female; MOF-2LM, MOF-overexpressed trisomy 2L male. (B) RT-qPCR analysis of messenger RNA (mRNA) levels of Ythdc1 in the heads of MSL2 transgenic Drosophila. MOF KDF, MOF neural-knockdown female; MOF KDM, MOF neural-knockdown male; MOF OEF, MOF-overexpressed female; MOF OEM, MOF-overexpressed male. Sample size = 3. Student’s t test *p<0.05, **p<0.01, ***p<0.001. (C) RT-qPCR analysis of mRNA levels of MOF in the heads of Ythdc1 knockdown Drosophila. Ythdc1 KDF, Ythdc1 neural-knockdown female; Ythdc1 KDM, Ythdc1 neural-knockdown male. Sample size = 3. Student’s t test *p<0.05, **p<0.01, ***p<0.001. (D) Western blot analysis of H4K16Ac in Drosophila. (E,F) Relative quantification of H4K16Ac in wildtype and Ythdc1 knockdown adult Drosophila based on western blot. Student’s t test * Ythdc1 KDF, Ythdc1-knockdown female; Ythdc1 KDM, Ythdc1-knockdown male. Sample size = 5. Student’s t test *p<0.05. (G) Genome browser example of Ythdc1 for indicated ChIP-seq data. Signals were displayed as counts per million (CPM) values. The gene architecture was shown at the bottom (only one representative transcript isoform was shown). The yellow shaded area indicates the presence of the H4K16Ac peaks.
-
Figure 8—source data 1
PDF file containing original western blots for Figure 8D, indicating the relevant bands and treatments.
- https://cdn.elifesciences.org/articles/100144/elife-100144-fig8-data1-v1.zip
-
Figure 8—source data 2
Original files for western blot analysis displayed in Figure 8D.
Figure supplements.
- https://cdn.elifesciences.org/articles/100144/elife-100144-fig8-data2-v1.zip
Figure 8—figure supplement 1
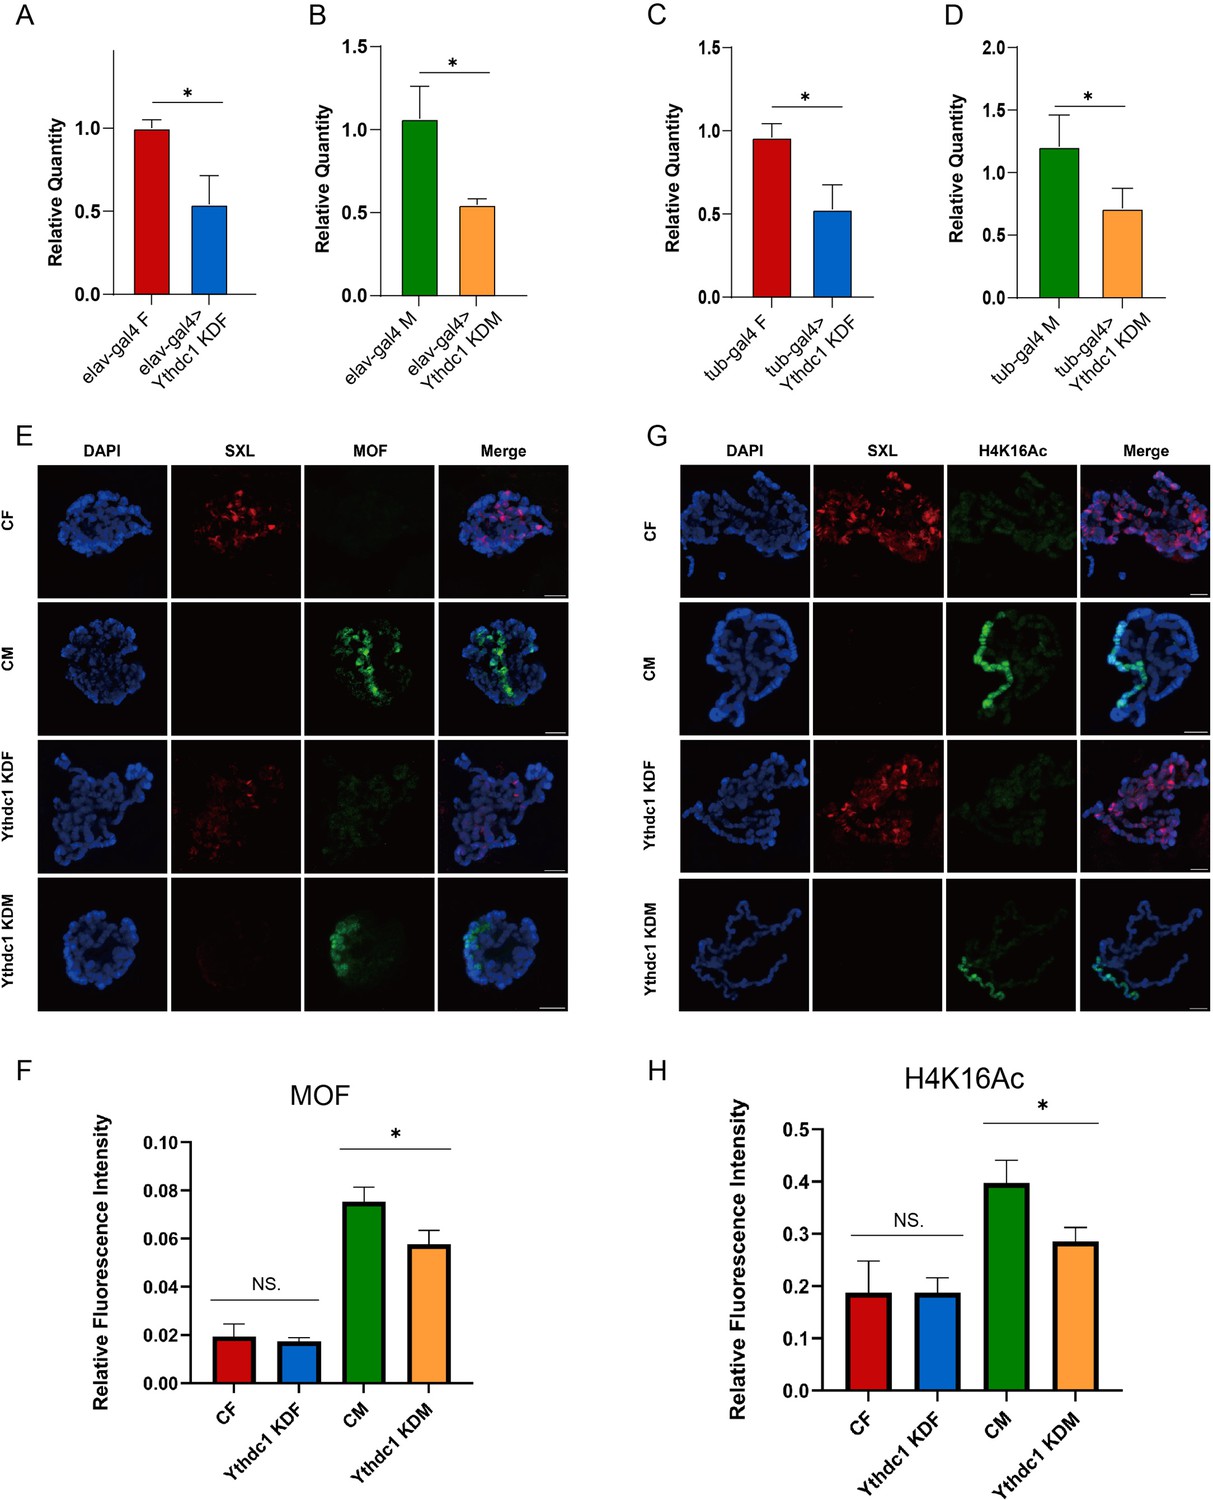
Ythdc1 may regulate H4K16Ac through histone acetyltransferase MOF.
(A,B) RT-qPCR analysis of messenger RNA (mRNA) levels of Ythdc1 in the heads of Ythdc1 neural-knockdown female (A) and male (B). elav-gal4>Ythdc1 KDF, Ythdc1 neural-knockdown female; elav-gal4>Ythdc1 KDM, Ythdc1 neural-knockdown male. Sample size = 3. Student’s t test *p<0.05, **p<0.01, ***p<0.001. (C,D) RT-qPCR analysis of mRNA levels of Ythdc1 in Ythdc1 knockdown female (C) and male (D) adult Drosophila. tub-gal4>Ythdc1 KDF, Ythdc1 knockdown female; tub-gal4>Ythdc1 KDM, Ythdc1 knockdown male. Sample size = 3. Student’s t test *p<0.05, **p<0.01, ***p<0.001. (E) Immunofluorescence of polytene chromosomes showed the signals of SXL (red channel) and MOF (green channel) in the salivary glands of Drosophila larvae of different genotypes. Scale bars, 10 μm. (F) The levels of MOF in the salivary glands of Ythdc1 knockdown Drosophila quantified by immunofluorescence. Sample size > 10. Student’s t test *p<0.05, **p<0.01, ***p<0.001.(G) Immunofluorescence of polytene chromosomes showed the signals of SXL (red channel) and H4K16Ac (green channel) in the salivary glands of Drosophila larvae of different genotypes. Scale bars, 10 μm. (H) The levels of H4K16Ac in the salivary glands of Ythdc1 knockdown Drosophila quantified by immunofluorescence. Ythdc1 KDF, Ythdc1 knockdown female; Ythdc1 KDM, Ythdc1 knockdown male. Sample size > 10. Student’s t test *p<0.05, **p<0.01, ***p<0.001.
Figure 8—figure supplement 2
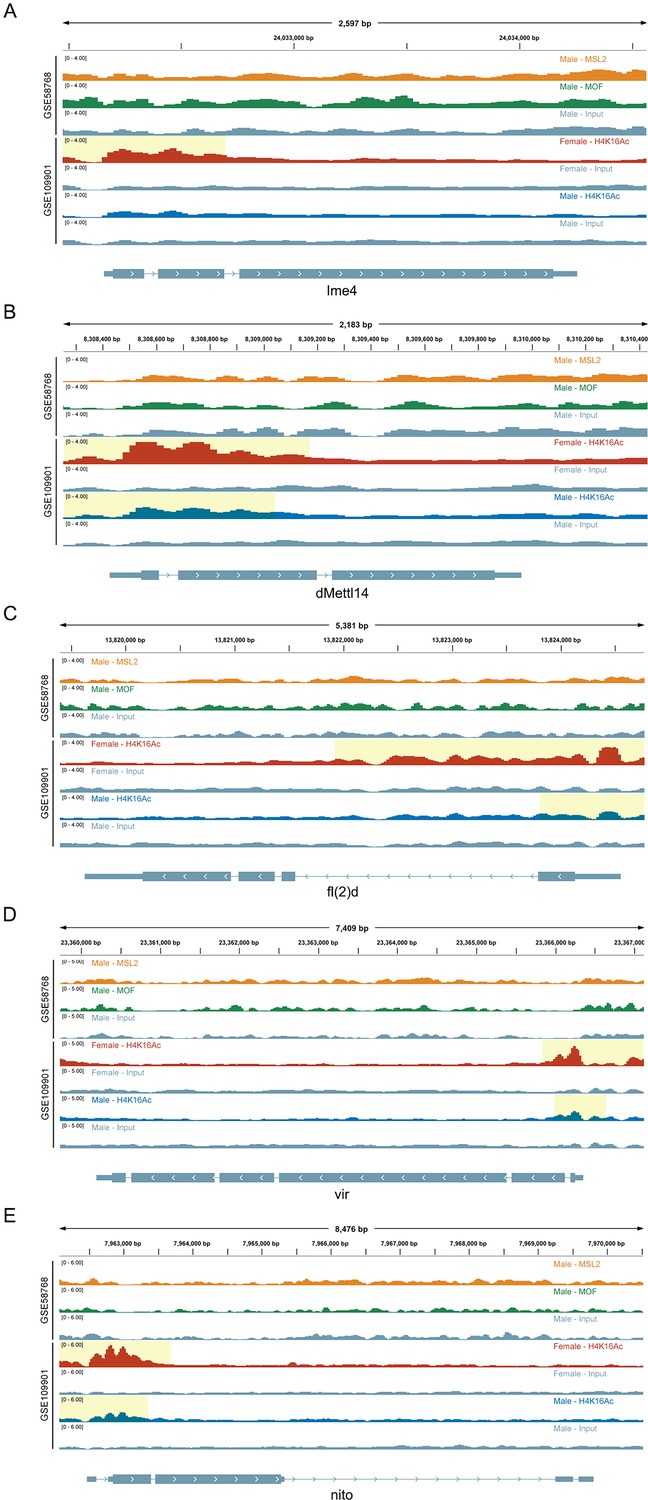
Genome browser example of m6A regulator genes for indicated ChIP-seq data.
H4K16Ac, MSL2, and MOF ChIP-seq results for gene Ime4 (A), dMettl14 (B), fl(2)d (C), vir (D), and nito (E) are shown, respectively. Signals were displayed as counts per million (CPM) values. The gene architectures were shown at the bottom (only one representative transcript isoform was shown). The yellow shaded area indicates the presence of the H4K16Ac peaks.
Tables
Appendix 1—key resources table
| Reagent type (species) or resource | Designation | Source or reference | Identifiers | Additional information |
|---|---|---|---|---|
| Antibody | anti-SXL (Mouse monoclonal) | Developmental Studies Hybridoma Bank | Cat# M18-s, RRID:AB_528464 | IF(1:100) |
| Antibody | anti-MSL2 (Goat monoclonal) | Santa Cruz | Cat# sc-32459, RRID:AB_672213 | IF(1:100) |
| Antibody | anti-MOF (Goat monoclonal) | Santa Cruz | Cat# sc-22351, RRID:AB_670132 | IF(1:100) |
| Antibody | anti-H3 (Rabbit polyclonal) | Novus | Cat# NB500-171, RRID:AB_10001790 | WB(1:1000) |
| Antibody | anti-H4K16Ac (Rabbit monoclonal) | EMD Millipore | Cat# 07-329, RRID:AB_310525 | IF(1:100) WB(1:1000) |
| Antibody | anti-Digoxigenin (Mouse monoclonal) | Jackson Immuno Research | Cat# 200-062-156, RRID:AB_233901 | TSA-FISH(1:400) |
| Antibody | Streptavidin-HRP (Rabbit polyclonal) | Invitrogen | Cat# S991 | TSA-FISH(1:1000) |
| Sequence-based reagent | Ime4-L | This paper | PCR primers | CAAGTACGTGCACTATGAGG |
| Sequence-based reagent | Ime4-R | This paper | PCR primers | GTCATGTCCAAGAAGCGTAG |
| Sequence-based reagent | dMettl14-L | This paper | PCR primers | GCCTCTTCCTCCAAGAAAAC |
| Sequence-based reagent | dMettl14-R | This paper | PCR primers | CCTCAACTTGGGATACTCCT |
| Sequence-based reagent | fl(2)d-L | This paper | PCR primers | CCTGGACGTTATTTCCTACT |
| Sequence-based reagent | fl(2)d-R | This paper | PCR primers | TAAGCTAGAGACCATTCACG |
| Sequence-based reagent | vir-L | This paper | PCR primers | GTACATGAAACCCTTAGAGGC |
| Sequence-based reagent | vir-R | This paper | PCR primers | CTTGCTTATGGAGAGATAGCG |
| Sequence-based reagent | nito-L | This paper | PCR primers | GCCAGTACGGTTCCAGATGT |
| Sequence-based reagent | nito-R | This paper | PCR primers | CCGTCCGTCAAATGAAACTT |
| Sequence-based reagent | Ythdc1-L | This paper | PCR primers | GGTCGTGATTTGATCCTCTG |
| Sequence-based reagent | Ythdc1-R | This paper | PCR primers | TCGAACTCACTCCCATACTC |
| Sequence-based reagent | tubulin-F | This paper | PCR primers | AGCTCAGCACCCTCTGTGTAAT |
| Sequence-based reagent | tubulin-R | This paper | PCR primers | AGCTGGAGCGCATCAATGTGTA |
| Sequence-based reagent | Ime4-F-T3 | This paper | FISH primers | TGTTGGGAAATCACTCCCAATTAAGAGAAGTTTAAGTCCCACGG |
| Sequence-based reagent | Ime4-R-T7 | This paper | FISH primers | GTAATACGACTCACTATAGGGAGACCACCATCTGGATAACGCTTCTGG |
| Sequence-based reagent | dMettl14-F-T3 | This paper | FISH primers | TGTTGGGAAATCACTCCCAATTAACCAATCCGCACAATGACTAC |
| Sequence-based reagent | dMettl14-R-T7 | This paper | FISH primers | GTAATACGACTCACTATAGGGAGACCACTAGCCAACCTGGTCGAATAC |
| Sequence-based reagent | fl(2)d-F-T3 | This paper | FISH primers | TGTTGGGAAATCACTCCCAATTAACTAGAGACCATTCACGAGGA |
| Sequence-based reagent | fl(2)d-R-T7 | This paper | FISH primers | GTAATACGACTCACTATAGGGAGACCACATTATGTATGTCTACGCCGC |
| Sequence-based reagent | vir-F-T3 | This paper | FISH primers | TGTTGGGAAATCACTCCCAATTAACGAAATGTCGTACAAGGTGC |
| Sequence-based reagent | vir-R-T7 | This paper | FISH primers | GTAATACGACTCACTATAGGGAGACCACGATCTCCGGGAAAAGTGGTT |
| Sequence-based reagent | nito-F-T3 | This paper | FISH primers | TGTTGGGAAATCACTCCCAATTAACTCCGATTGATCCCTACGAT |
| Sequence-based reagent | nito-R-T7 | This paper | FISH primers | GTAATACGACTCACTATAGGGAGACCACGTATCTCCGTCCGTCAAATG |
| Sequence-based reagent | Ythdc1-F-T3 | This paper | FISH primers | TGTTGGGAAATCACTCCCAATTAACGAATCGAATGGTGGAGACT |
| Sequence-based reagent | Ythdc1-R-T7 | This paper | FISH primers | GTAATACGACTCACTATAGGGAGACCACCCGTGTGTCTCGGAATAGGT |
| Commercial assay or kit | m6A RNA Methylation Quantification Kit (Colorimetric) | EpiQuik | P-9005–96 | |
| Commercial assay or kit | 2×EasyTaq PCR Super Mix (+Dye) | TransGen Biotech | AS111-12 | |
| Commercial assay or kit | TransTaq-T DNA Polymerase | TransGen Biotech | AP122 | |
| Commercial assay or kit | TransScript one-step gDNA Removal and cDNA Synthesis SuperMix | TransGen Biotech | AT311-03 | |
| Commercial assay or kit | TransStart Tip Green qPCR SuperMix (+Dye II) | TransGen Biotech | AQ142-24 | |
| Chemical compound, drug | Cyanine 3 Tyramide | Akoya Biosciences | FP1046 | |
| Chemical compound, drug | Proteinase K | Sigma | H4784 | |
| Chemical compound, drug | Heparin sodium salt | Sigma | P2308 | |
| Chemical compound, drug | Salmon sperm single-stranded DNA | Sigma | D9156 | |
| Chemical compound, drug | Digoxigenin-11-UTP | Sigma (Roche Diagnostics) | 11209256910 | |
| Chemical compound, drug | Ribonucleoside Triphosphate Set (NTP) | Sigma (Roche Diagnostics) | 11277057001 | |
| Chemical compound, drug | Donkey Serum | Solarbio | N/A | |
| Chemical compound, drug | 5×Transcription buffer | Thermo Scientific | N/A | |
| Chemical compound, drug | T7 RNA polymerase | Thermo Scientific | EP0111 | |
| Software, algorithm | R v4.2.2 | http://www.R-project.org | ||
| Software, algorithm | trim-galore v0.6.10 | https://www.bioinformatics.babraham.ac.uk/projects/trim_galore/ | ||
| Software, algorithm | FastQC v0.12.1 | https://www.bioinformatics.babraham.ac.uk/projects/fastqc/ | ||
| Software, algorithm | HISAT2 v2.2.1 | Kim et al., 2019 | ||
| Software, algorithm | StringTie v2.1.5 | Pertea et al., 2015 | ||
| Software, algorithm | exomePeak2 v1.10.0 | Meng et al., 2013 | ||
| Software, algorithm | HOMER v4.11 | Heinz et al., 2010 | ||
| Software, algorithm | DiffBind v3.8.4 | Stark and Brown, 2013 | ||
| Software, algorithm | ChIPseeker v1.34.1 | Yu et al., 2015 | ||
| Software, algorithm | deepTools v3.5.4 | Ramírez et al., 2014 | ||
| Software, algorithm | rMATS v4.2.0 | Shen et al., 2014 | ||
| Software, algorithm | ggplot2 v3.4.0 | Villanueva and Chen, 2019 | ||
| Software, algorithm | clusterProfiler v4.6.0 | Wu et al., 2021 | ||
| Software, algorithm | org.Dm.eg.db v3.16.0 | https://www.bioconductor.org/ | ||
| Software, algorithm | DESeq2 v1.38.2 | Love et al., 2014 | ||
| Software, algorithm | Integrative Genomics Viewer v2.12.0 | Thorvaldsdóttir et al., 2013 | ||
| Software, algorithm | Fiji v1.53c | Schindelin et al., 2012 | ||
| Software, algorithm | AnimalTFDB | Hu et al., 2019 | ||
| Other | DAPI stain | Sigma | 28718-90-3 | (1 µg/mL) |
Additional files
Download links
A two-part list of links to download the article, or parts of the article, in various formats.
Downloads (link to download the article as PDF)
Open citations (links to open the citations from this article in various online reference manager services)
Cite this article (links to download the citations from this article in formats compatible with various reference manager tools)
Dynamics and regulatory roles of RNA m6A methylation in unbalanced genomes
eLife 13:RP100144.
https://doi.org/10.7554/eLife.100144.3


