Cntnap2 loss drives striatal neuron hyperexcitability and behavioral inflexibility
- Helen Wills Neuroscience Institute, University of California, Berkeley, United States
- Department of Neuroscience, University of California, Berkeley, United States
- Department of Molecular and Cell Biology, University of California, Berkeley, United States
Figures
Figure 1 with 1 supplement
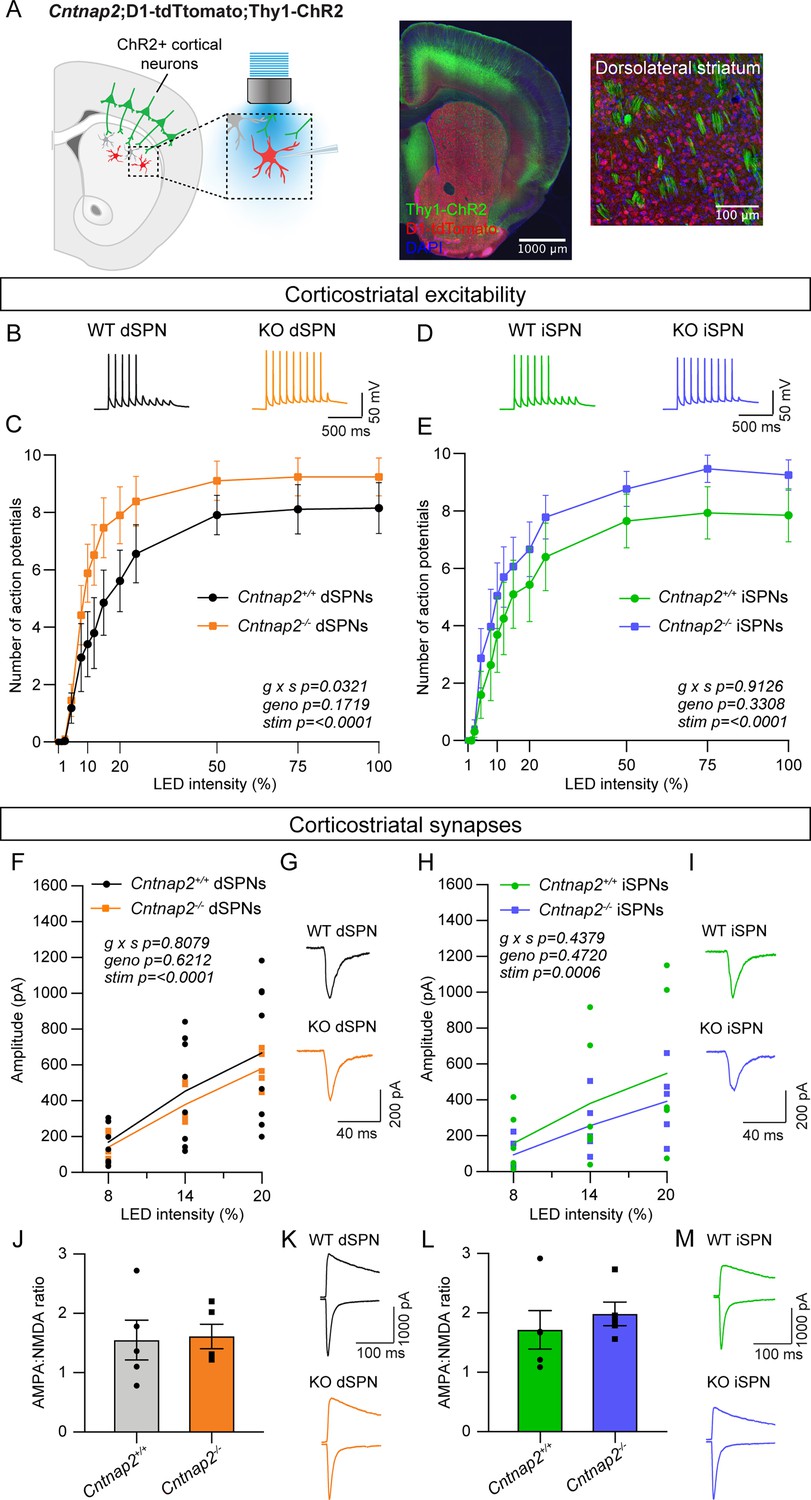
Cntnap2-/- dSPNs exhibit increased cortical drive.
(A) Left: schematic of the corticostriatal connectivity experiments. For corticostriatal excitability, cortical terminals expressing ChR2 were stimulated with 10 pulses of blue light at 10 Hz and responses were recorded from dSPNs (red) and iSPNs (grey) in dorsolateral striatum. For corticostriatal synaptic strength, cortical terminals expressing ChR2 were stimulated with blue light at increasing intensity and synaptic currents were recorded from dSPNs (red) and iSPNs (grey) in dorsolateral striatum. Center: 10 x confocal image of the striatum from a Cntnap2+/+;D1-tdTomato;Thy1-ChR2 mouse. Right: 20 x confocal image of dorsolateral striatum from a Cntnap2+/+;D1-tdTomato;Thy1-ChR2 mouse. YFP (green) labels cell bodies and axons of a subset of layer V pyramidal neurons, tdTomato (red) labels dSPNs, and DAPI stained nuclei are in blue. (B) Example single traces of action potentials (APs) in dSPNs evoked by cortical terminal stimulation at 20% light intensity for the indicated genotypes. (C) Quantification (mean ± SEM) of the number of APs evoked in dSPNs at different light intensities. Cntnap2+/+ n = 9 mice, 24 cells, Cntnap2-/- n=10 mice, 22 cells. Repeated measures two-way ANOVA p values are shown; g x s F (12, 204)=1.935, geno F (1, 17)=2.034, stim F (1.931, 32.83)=86.12. (D) Example single traces of APs in iSPNs evoked by cortical terminal stimulation at 20% light intensity for the indicated genotypes. (E) Quantification (mean ± SEM) of the number of APs evoked in iSPNs at different light intensities. Cntnap2+/+ n = 9 mice, 23 cells, Cntnap2-/- n=10 mice, 21 cells. Repeated measures two-way ANOVA p values are shown; g x s F (12, 216)=0.5012, geno F (1, 18)=0.9989, stim F (2.331, 41.96)=60.62. (F) Average EPSC traces from example dSPNs of each genotype induced by optogenetic cortical terminal stimulation at 14% light intensity. (G) Quantification of EPSC amplitude evoked in dSPNs at different light intensities (line represents the mean, dots/squares represent average EPSC amplitude for each mouse). Cntnap2+/+ n = 8 mice, 17 cells, Cntnap2-/- n=5 mice, 13 cells. Repeated measures two-way ANOVA p values are shown; g x s F (2, 22)=0.2154, geno F (1, 11)=0.2585, stim F (1.053, 11.58)=49.68. (H) Average EPSC traces from example iSPNs of each genotype induced by optogenetic cortical terminal stimulation at 14% light intensity. (I) Quantification of EPSC amplitude evoked in iSPNs at different light intensities (line represents mean, dots/squares represent average EPSC amplitude for each mouse). Cntnap2+/+ n = 6 mice, 13 cells, Cntnap2-/- n=5 mice, 11 cells. Repeated measures two-way ANOVA p values are shown; g x s F (2, 18)=0.4428, geno F (1, 9)=0.5635, stim F (1.095, 9.851)=23.82. (J) Quantification (mean ± SEM) of AMPA:NMDA ratio in dSPNs evoked by 20% light intensity (dots/squares represent average AMPA:NMDA ratio for each mouse). Cntnap2+/+ n = 5 mice, 22 cells, Cntnap2-/- n=5 mice, 22 cells, p=0.8413, Mann-Whitney test. (K) Example traces show pairs of EPSCs evoked by optogenetic corticostriatal stimulation (20% light intensity) recorded at +40 mV (top traces) and −70 mV (bottom traces) from Cntnap2+/+ and Cntnap2-/- dSPNs. (L) Quantification (mean ± SEM) of AMPA:NMDA ratio in iSPNs evoked by 20% light intensity (dots/squares represent average AMPA:NMDA ratio for each mouse). Cntnap2+/+ n = 5 mice, 21 cells, Cntnap2-/- n=5 mice, 21 cells, p=0.3095, Mann-Whitney test. (M) Example traces show pairs of EPSCs evoked by optogenetic corticostriatal stimulation (20% light intensity) recorded at +40 mV (top traces) and −70 mV (bottom traces) from Cntnap2+/+ and Cntnap2-/- iSPNs.
Figure 1—figure supplement 1
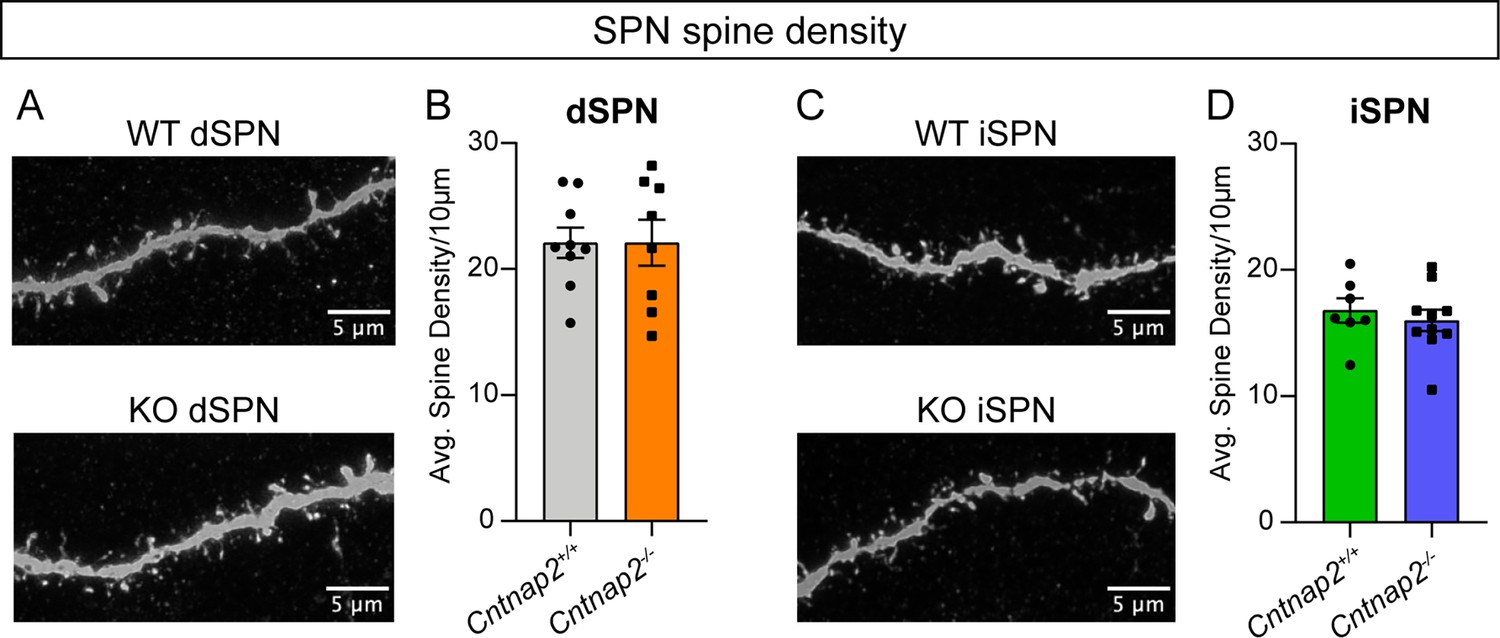
Cntnap2-/- SPNs do not have altered spine density.
(A) Representative deconvoluted images of dendritic spines from dSPNs for the indicated genotypes. (B) Quantification (mean ± SEM) of dendritic spine density per 10 μm of dendrite in Cntnap2+/+ and Cntnap2-/- dSPNs. Dots/squares represent the average spine density per neuron. Cntnap2+/+ n = 9 neurons (15 dendrites) from 6 mice, Cntnap2-/- n=8 neurons (15 dendrites) from 6 mice. p=0.9964, two-tailed unpaired t test. (C) Representative deconvoluted images of dendritic spines from iSPNs for the indicated genotypes. (D) Quantification (mean ± SEM) of dendritic spine density per 10 μm of dendrite in Cntnap2+/+ and Cntnap2-/- iSPNs. Dots/squares represent the average spine density per neuron. Cntnap2+/+ n = 7 neurons (15 dendrites) from 4 mice, Cntnap2-/- n=10 neurons (15 dendrites) from 7 mice. p=0.5362, Mann-Whitney test.
Figure 2 with 2 supplements
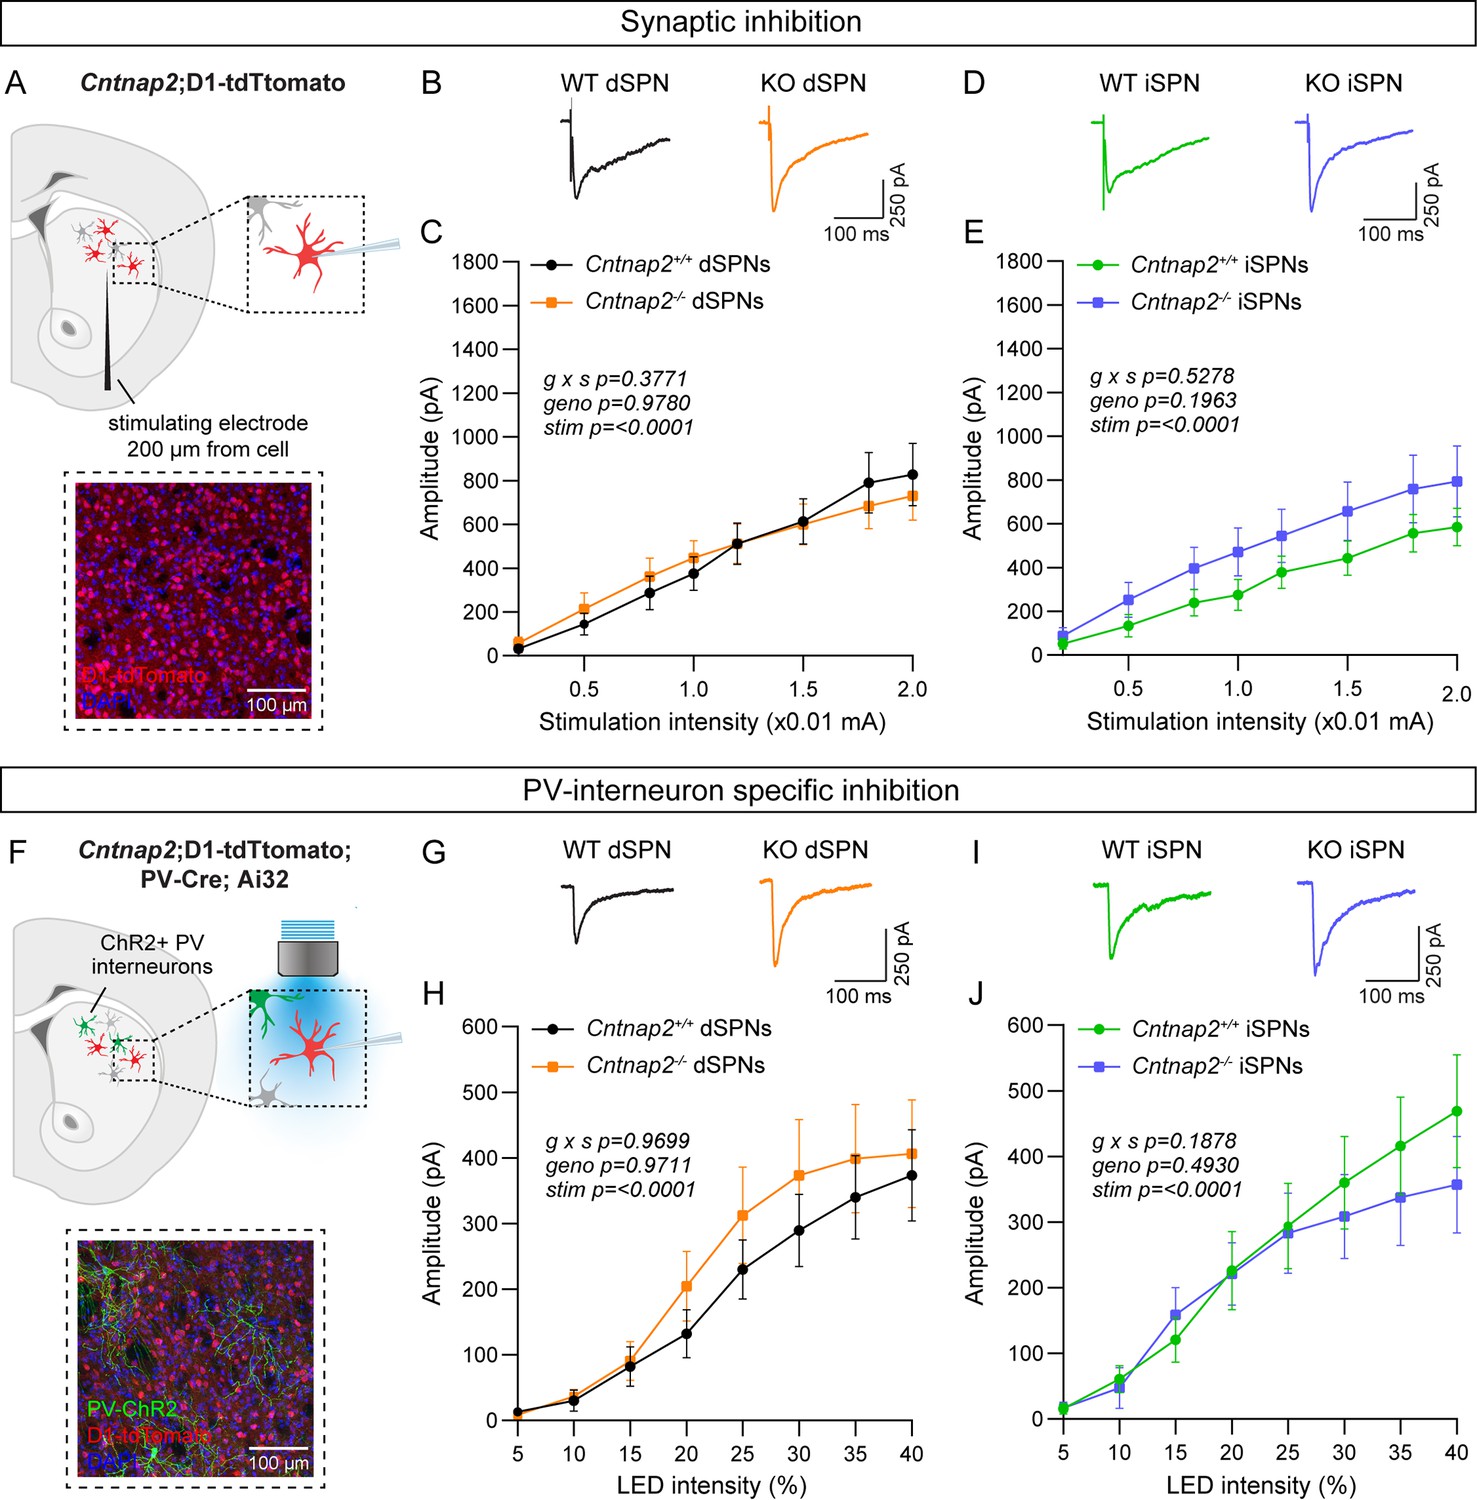
Inhibition is not altered in Cntnap2-/- SPNs.
(A) Top: schematic of the experiment. A bipolar stimulating electrode was placed approximately 200 μm from the recording site. A range of electrical stimulation intensities was applied to the tissue while IPSCs were recorded from dSPNs (red) and iSPNs (grey) in dorsolateral striatum. Bottom: 20 x confocal image of dorsolateral striatum from a Cntnap2+/+;D1-tdTomato mouse. tdTomato (red) labels dSPNs, DAPI stained nuclei are in blue. (B) Average IPSC traces from example dSPNs of each genotype evoked by electrical stimulation at 1.5 (x0.01 mA) intensity for the indicated genotypes. (C) Quantification (mean ± SEM) of IPSC amplitude in dSPNs at different stimulation intensities. Cntnap2+/+ n = 17 cells from 9 mice, Cntnap2-/- n=16 cells from 9 mice. Repeated measures two-way ANOVA p values are shown; g x s F (7, 217)=1.080, geno F (1, 31)=0.0007751, stim F (1.815, 56.28)=54.92. (D) Average IPSC traces from example iSPNs of each genotype evoked by electrical stimulation at 1.5 (x0.01 mA) intensity for the indicated genotypes. (E) Quantification (mean ± SEM) of IPSC amplitude in iSPNs at different stimulation intensities. Cntnap2+/+ n = 16 cells from 9 mice, Cntnap2-/- n=16 cells from 10 mice. Repeated measures two-way ANOVA p values are shown; g x s F (7, 210)=0.8741, geno F (1, 30)=1.746, stim F (1.591, 47.73)=45.66. (F) Top: schematic of the experiment. PV interneuron terminals expressing ChR2 were stimulated with blue light at a range of intensities, and optically evoked IPSCs were recorded from dSPNs (red) and iSPNs (grey) in dorsolateral striatum. Bottom: 20 x confocal image of dorsolateral striatum from a Cntnap2+/+;D1-tdTomato;PV-Cre;Ai32 mouse. YFP (green) labels PV interneurons, tdTomato (red) labels dSPNs, DAPI-stained nuclei are in blue. (G) Average IPSC traces from example dSPNs of each genotype evoked by optogenetic PV interneuron stimulation at 30% light intensity. (H) Quantification (mean ± SEM) of IPSC amplitude in dSPNs at different light intensities. Cntnap2+/+ n = 29 cells from 15 mice, Cntnap2-/- n=23 cells from 11 mice. Repeated measures two-way ANOVA p values are shown; g x s F (7, 441)=0.2566, geno F (1, 63)=0.001322, stim F (1.433, 90.25)=32.57. (I) Average IPSC traces from example iSPNs of each genotype evoked by optogenetic PV interneuron stimulation at 30% light intensity. (J) Quantification (mean ± SEM) of IPSC amplitude in iSPNs at different light intensities. Cntnap2+/+ n = 24 cells from 14 mice, Cntnap2-/- n=27 cells from 13 mice. Repeated measures two-way ANOVA p values are shown; g x s F (7, 343)=1.441, geno F (1, 49)=0.4771, stim F (1.622, 79.46)=38.49.
Figure 2—figure supplement 1
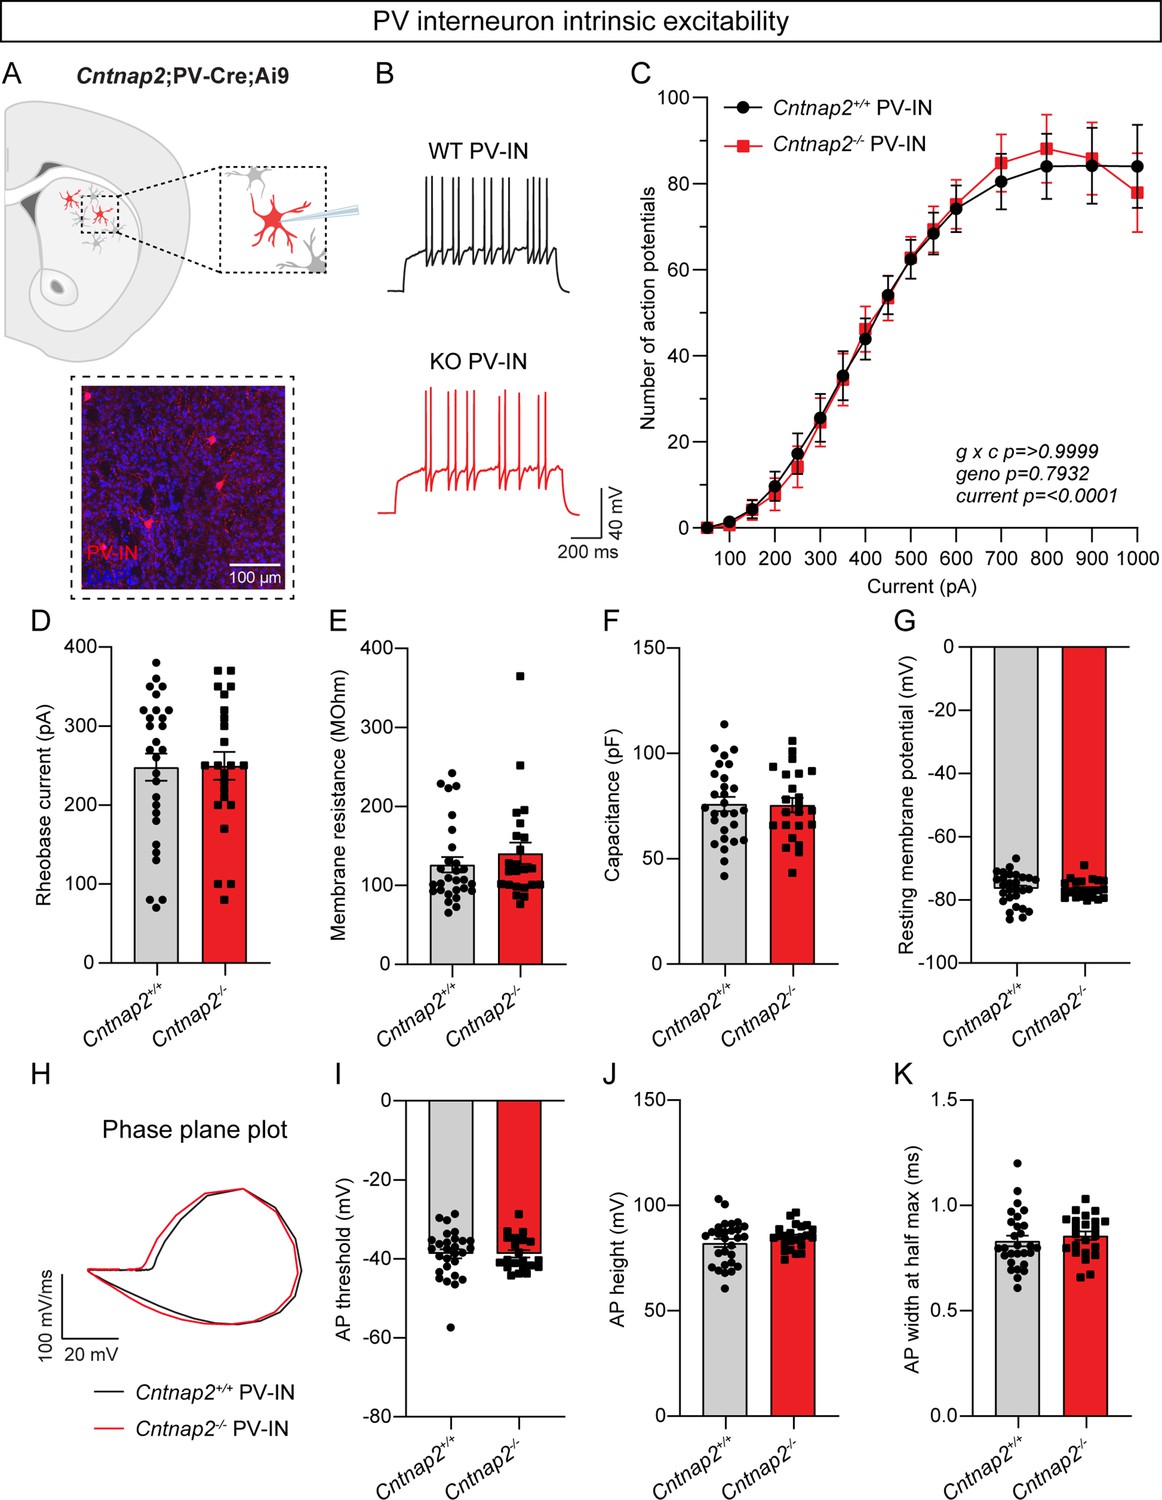
PV interneuron intrinsic excitability is unchanged in Cntnap2-/- mice.
(A) Top: schematic of the experiment. tdTomato-expressing PV interneurons were recorded in the dorsolateral striatum and injected with current steps of increasing magnitude to evoke firing. Bottom: 20 x confocal image of dorsolateral striatum from a Cntnap2+/+;PV-Cre;Ai9 mouse. tdTomato (red) labels PV interneurons, DAPI stained nuclei are in blue. (B) Example traces of APs in PV interneurons evoked by a 200 pA current step for the indicated genotypes. (C) Quantification (mean ± SEM) of the number of APs evoked in PV interneurons at different current step amplitudes. Cntnap2+/+ n = 28 cells from 6 mice, Cntnap2-/- n=23 cells from 4 mice. Repeated measures two-way ANOVA p values are shown; g x c F (40, 1960)=0.1251, geno F (1, 49)=0.06951, current F (2.033, 99.60)=107.5. (D) Quantification (mean ± SEM) of the rheobase current. Dots/squares represent the rheobase current for each neuron. n is the same as in panel C. p=0.8852, two-tailed unpaired t test. (E–G) Quantification (mean ± SEM) of the membrane resistance (E), p=0.3422, Mann-Whitney test; membrane capacitance (F), p=0.9055, two-tailed unpaired t test; and resting membrane potential (G), p=0.9510, two-tailed unpaired t test. Dots/squares represent the average value for each neuron. n is the same as in panel C. (H) Phase plane plot of a single AP evoked in PV interneurons from Cntnap2+/+ (black) and Cntnap2-/- (red) mice. (I–K) Quantification (mean ± SEM) of the AP threshold (I), p=0.8438, Mann-Whitney test; AP height (J), p=0.2742, two-tailed unpaired t test; and AP width at half max (K), p=0.4619, two-tailed unpaired t test. Dots/squares represent the value for the first spike evoked at rheobase for each neuron. n is the same as in panel C.
Figure 2—figure supplement 2
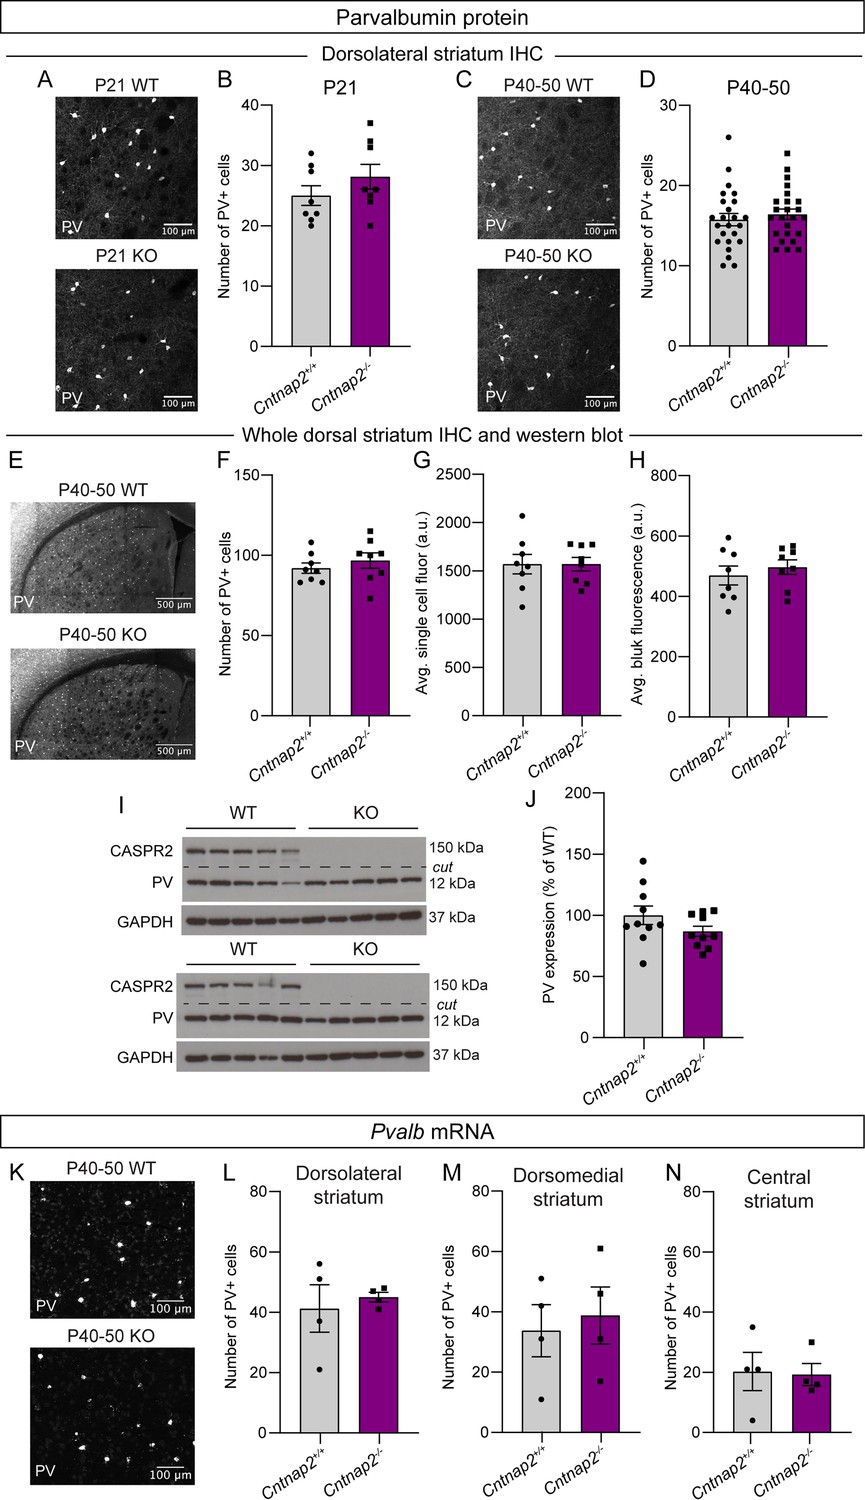
Cntnap2-/- mice do not exhibit changes in PV-positive cell number or expression.
(A) Representative confocal images of dorsolateral striatum labeled with an antibody against Parvalbumin (PV) protein for the indicated genotypes, mice aged postnatal day 21 (P21). (B) Quantification (mean ± SEM) of the number of PV-positive cells per ROI at P21, p=0.2554, two-tailed unpaired t test. Cntnap2+/+ n = 8 sections from 4 mice (two sections imaged per mouse), Cntnap2-/- n=8 sections from 4 mice (two sections imaged per mouse). (C) Representative confocal images of dorsolateral striatum labeled with an antibody against PV for the indicated genotypes, mice aged P40-50. (D) Quantification (mean ± SEM) of the number of PV-positive cells per ROI, p=0.5144, two-tailed unpaired t test. Cntnap2+/+ n = 24 sections from 12 mice (two sections imaged per mouse), Cntnap2-/- n=24 sections from 12 mice (two sections imaged per mouse). (E) Representative confocal images of dorsal striatum labeled with an antibody against PV for the indicated genotypes, mice aged P40-50. (F) Quantification (mean ± SEM) of the number of PV positive cells in the whole dorsal striatum at P40-50, p=0.4201, two-tailed unpaired t test. Cntnap2+/+ n = 8 sections from 4 mice (two sections imaged per mouse), Cntnap2-/- n=8 sections from 4 mice (two sections imaged per mouse). (G) Quantification (mean ± SEM) of the average single cell fluorescence of PV antibody staining in dorsal striatum, p=0.9996, two-tailed unpaired t test. Cntnap2+/+ n = 8 sections from 4 mice (two sections imaged per mouse), Cntnap2-/- n=8 sections from 4 mice (two sections imaged per mouse). (H) Quantification (mean ± SEM) of the average bulk fluorescence of PV antibody staining in dorsal striatum per section, p=0.4878, two-tailed unpaired t test. Cntnap2+/+ n = 8 sections from 4 mice (two sections imaged per mouse), Cntnap2-/- n=8 sections from 4 mice (two sections imaged per mouse). (I) Representative western blots for CASPR2, PV, and GAPDH protein in dorsal striatal tissue punches. 10 independent samples per genotype are shown. (J) Quantification (mean ± SEM) of PV protein expression normalized to GAPDH. Data are presented as a percentage of Cntnap2+/+ levels, p=0.1485, two-tailed unpaired t test. Cntnap2+/+ n = 10 mice, Cntnap2-/- n=10 mice. (K) Representative confocal images of in situ hybridization for Pvalb in dorsolateral striatum for the indicated genotypes, mice aged P40-50. (L–N) Quantification (mean ± SEM) of the number of Pvalb-positive cells in the dorsolateral striatum per section (L), p>0.9999, Mann-Whitney test; dorsomedial striatum (M), p=0.7429, Mann-Whitney test; and central striatum (N), p=0.6286, Mann-Whitney test. Cntnap2+/+ n = 4 sections from 2 mice (two sections imaged per mouse), Cntnap2-/- n=4 sections from 2 mice (two sections imaged per mouse).
-
Figure 2—figure supplement 2—source data 1
PDF file containing original western blots for Figure 2—figure supplement 2, indicating the relevant bands and treatments.
- https://cdn.elifesciences.org/articles/100162/elife-100162-fig2-figsupp2-data1-v1.zip
-
Figure 2—figure supplement 2—source data 2
Original files for western blot analysis displayed in Figure 2—figure supplement 2.
- https://cdn.elifesciences.org/articles/100162/elife-100162-fig2-figsupp2-data2-v1.zip
Figure 3 with 1 supplement
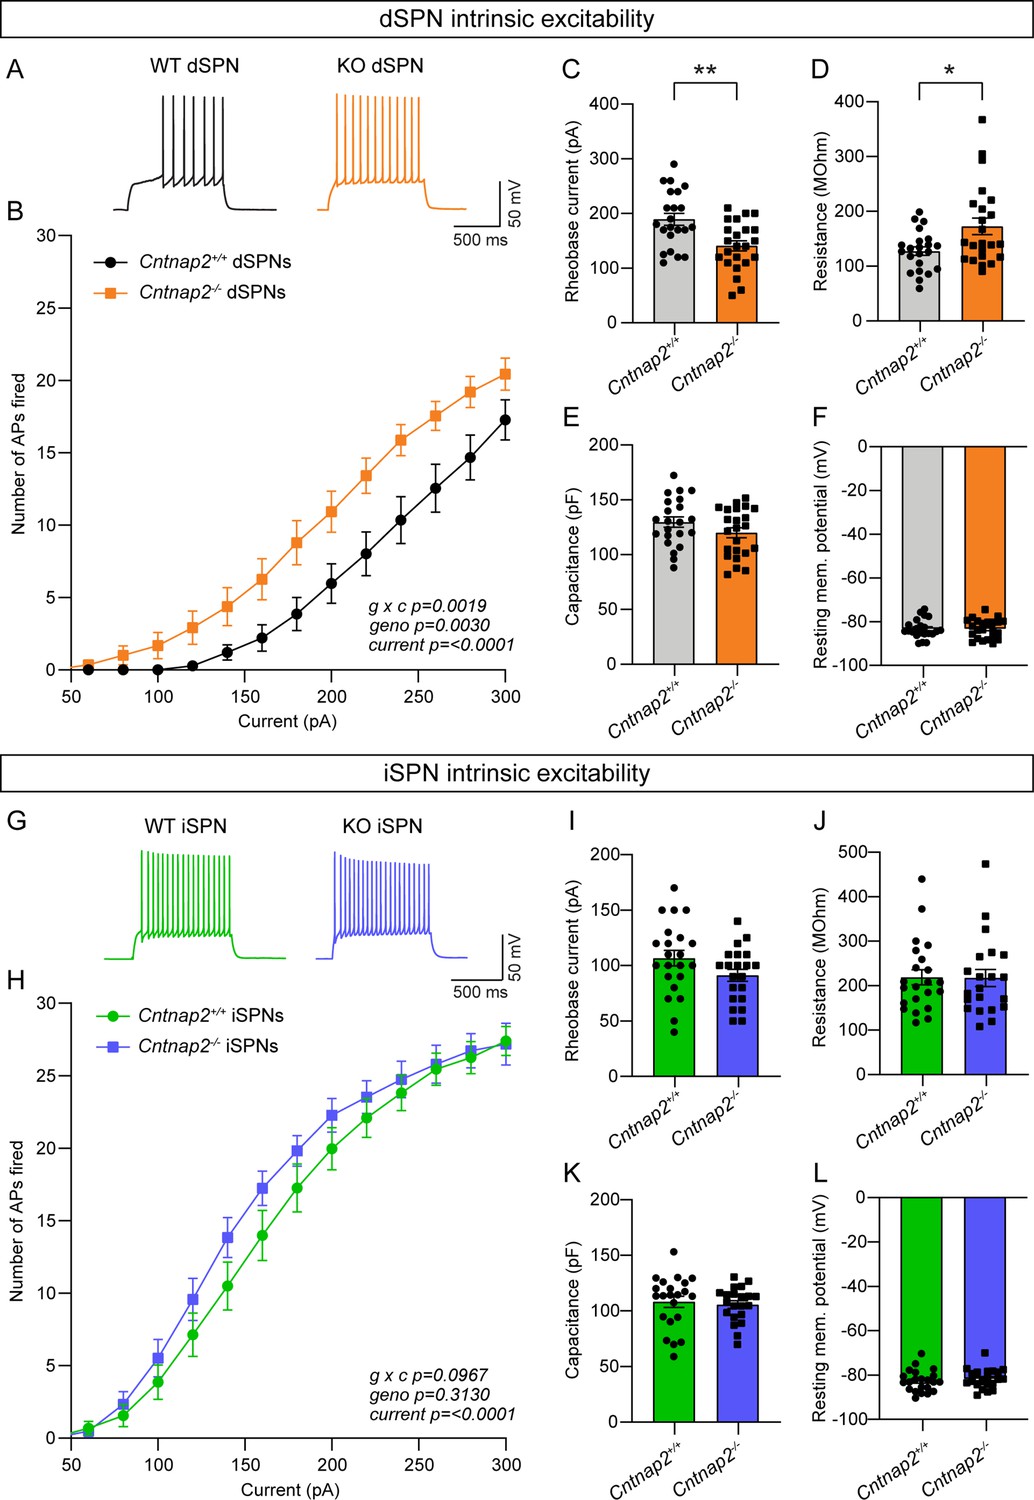
Intrinsic excitability is increased in Cntnap2-/- dSPNs.
(A) Example AP traces in dSPNs evoked by a 200 pA current step for the indicated genotypes. (B) Quantification (mean ± SEM) of the number of APs evoked in dSPNs at different current step amplitudes. Cntnap2+/+ n = 22 cells from 8 mice, Cntnap2-/- n=23 cells from 8 mice. Repeated measures two-way ANOVA p values are shown; g x c F (12, 528)=2.649, geno F (1, 44)=107.5, current F (1.974, 86.86)=147.5. (C) Quantification (mean ± SEM) of the rheobase current in dSPNs. Dots/squares represent the rheobase current for each neuron. n is the same as in panel B. **p=0.0016, two-tailed unpaired t test. (D–F) Quantification (mean ± SEM) of dSPN membrane resistance (D), *p=0.0328, Mann-Whitney test; membrane capacitance (E), p=0.2182, Mann-Whitney test; and resting membrane potential (F), p=0.9914, two-tailed unpaired t test. Dots/squares represent the average value for each neuron. n is the same as in panel B. (G) Example AP traces in iSPNs evoked by a 200 pA current step for the indicated genotypes. (H) Quantification (mean ± SEM) of the number of APs evoked in iSPNs at different current step amplitudes. Cntnap2+/+ n = 22 cells from 8 mice, Cntnap2-/- n=21 cells from 8 mice. Repeated measures two-way ANOVA p values are shown; g x c F (12, 516)=1.569, geno F (1, 43)=1.042, current F (2.041, 87.78)=284.7. (I) Quantification (mean ± SEM) of the rheobase current in iSPNs. Dots/squares represent the rheobase current for each neuron. n is the same as in panel H. p=0.0923, two-tailed unpaired t test. (J–L) Quantification (mean ± SEM) of iSPN membrane resistance (J), p=0.8193, Mann-Whitney test; membrane capacitance (K), p=0.6886, two-tailed unpaired t test; and resting membrane potential (L), P=0.4859, two-tailed unpaired t test. Dots/squares represent the average value for each neuron. n is the same as in panel H.
Figure 3—figure supplement 1
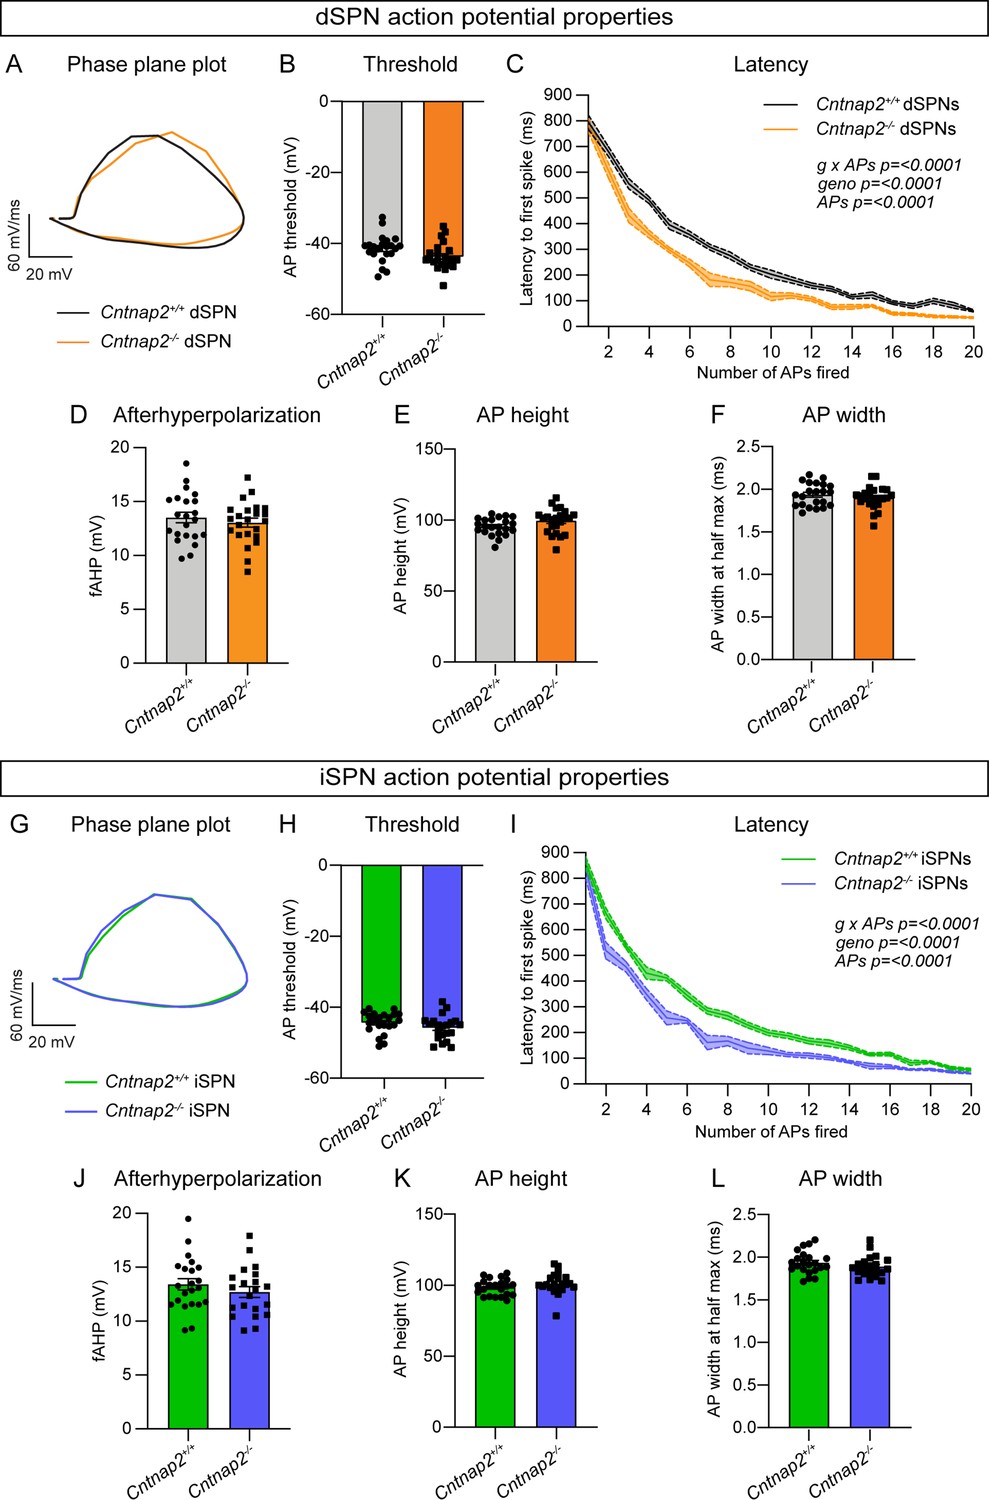
Latency to spike is reduced in Cntnap2-/- SPNs.
(A) Phase plane plot of a single AP evoked in dSPNs from Cntnap2+/+ (black) and Cntnap2-/- (orange) mice. (B) Quantification (mean ± SEM) of the dSPN AP threshold. Dots/squares represent the threshold for each neuron. Cntnap2+/+ n = 22 cells from 8 mice, Cntnap2-/- n=23 cells from 8 mice, p=0.0516, two-tailed unpaired t test. (C) Quantification (mean ± SEM) of dSPN AP latency to first spike plotted by number of APs fired in the current pulse. Shaded area around line represents SEM. Mixed-effects model with Geisser-Greenhouse correction p values are shown; g x APs F (19, 387)=7.870, geno F (1, 43)=24.98, APs F (1.740, 35.44)=913.5. (D–F) Quantification (mean ± SEM) of the dSPN AP fast afterhyperpolarization (D), p=0.4664, two-tailed unpaired t test; AP height (E), p=0.0833, two-tailed unpaired t test; and AP width at half max (F), p=0.3792, two-tailed unpaired t test. Dots/squares represent the value for the first spike evoked at rheobase for each neuron, n same as in panel B. (G) Phase plane plot of a single AP evoked in iSPNs in Cntnap2+/+ (green) and Cntnap2-/- (blue) mice. (H) Quantification (mean ± SEM) of the iSPN AP threshold. Dots/squares represent the threshold for each neuron. Cntnap2+/+ n = 22 cells from 8 mice, Cntnap2-/- n=21 cells from 8 mice, p=0.1495, two-tailed unpaired t test. (I) Quantification (mean ± SEM) of iSPN AP latency to first spike plotted by number of APs fired in the current pulse. Shaded area around line represents SEM. Mixed-effects model with Geisser-Greenhouse correction p values are shown; g x APs F (19, 343)=3.300, geno F (1, 41)=45.55, APs F (1.817, 32.81)=680.4. (J–L) Quantification (mean ± SEM) of iSPN AP fast afterhyperpolarization (J), p=0.3281, two-tailed unpaired t test; AP height (K), p=0.1794, Mann-Whitney test; and AP width at half max (L), p=0.2409, two-tailed unpaired t test. Dots/squares represent the value for the first spike evoked at rheobase for each neuron, n same as in panel H.
Figure 4 with 2 supplements
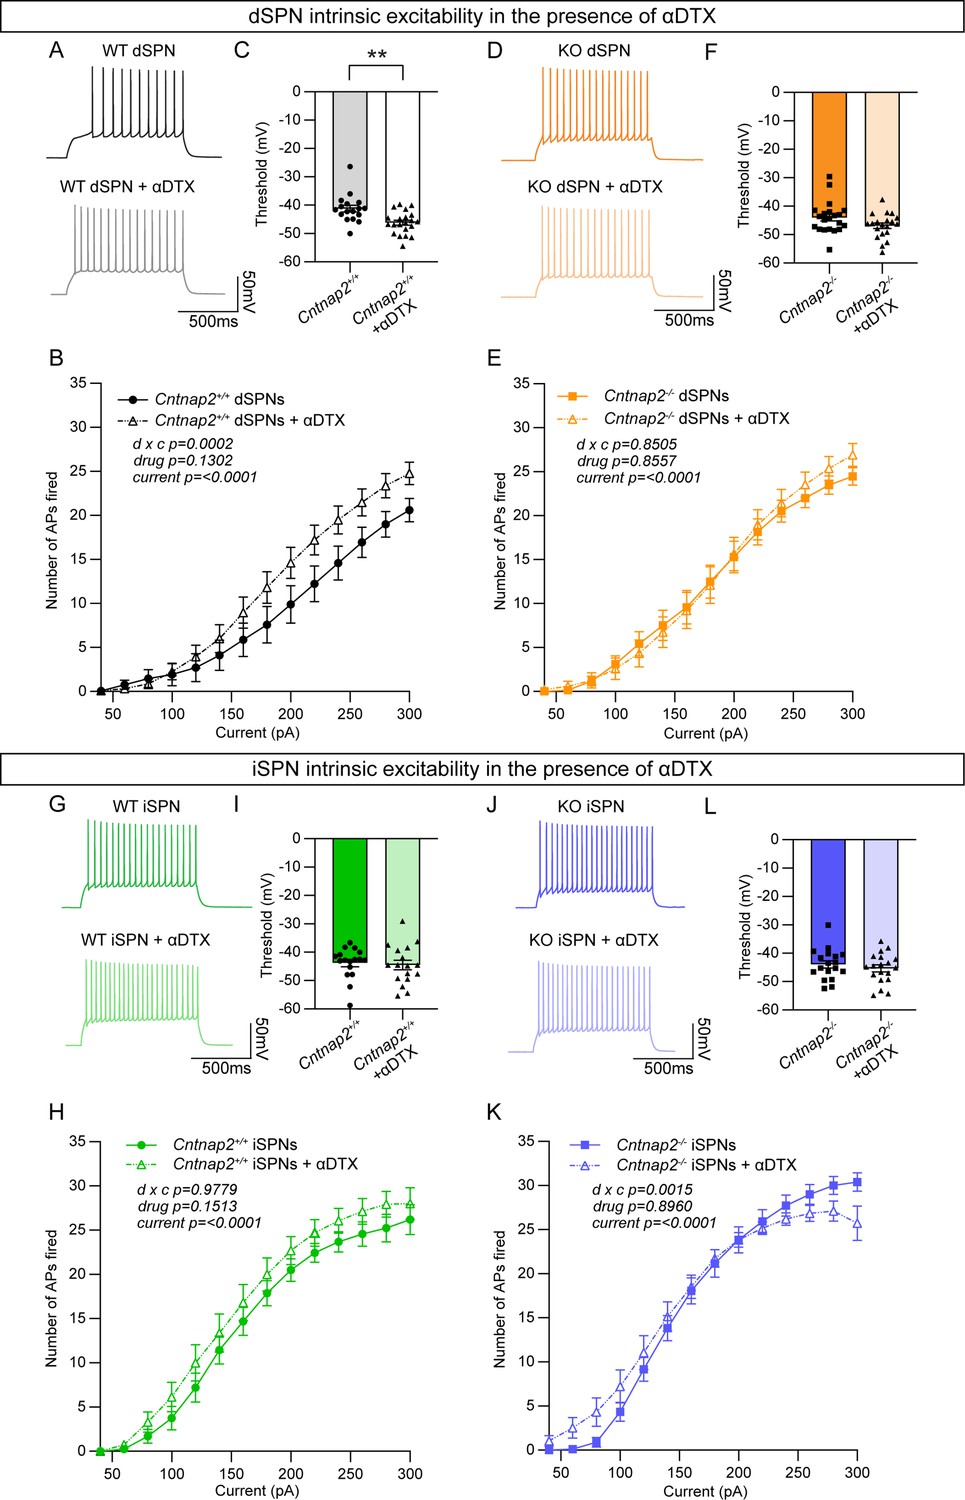
The effects of Kv1.2 blockade are occluded in Cntnap2-/- dSPNs.
(A) Example AP traces from Cntnap2+/+ dSPNs evoked by a 200 pA current step in the absence or presence of α-Dendrotoxin (α-DTX). (B) Quantification (mean ± SEM) of the number of APs evoked in Cntnap2+/+ dSPNs in the absence or presence of α-DTX at different current step amplitudes. Cntnap2+/+ n = 17 cells from 8 mice, Cntnap2+/+ + α-DTX n=21 cells from 8 mice. Repeated measures two-way ANOVA p values are shown; drug x c F (13, 468)=3.097, drug F (1, 36)=2.399, current F (2.091, 75.28)=172.0. (C) Quantification (mean ± SEM) of the AP threshold in Cntnap2+/+ dSPNs in the absence or presence of α-DTX. Dots/triangles represent the threshold for each neuron. n is the same as in panel B. **p=0.0010, Mann-Whitney test. (D) Example AP traces from Cntnap2-/- dSPNs evoked by a 200 pA current step in the absence or presence of α-DTX. (E) Quantification (mean ± SEM) of the number of APs evoked in Cntnap2-/- dSPNs. Cntnap2-/- n=21 cells from 9 mice, Cntnap2-/- + α-DTX n=20 cells from 9 mice. Repeated measures two-way ANOVA p values are shown; drug x c F (13, 507)=0.6054, drug F (1, 39)=0.03352, current F (2.156, 84.07)=247.8. (F) Quantification (mean ± SEM) of the AP threshold in Cntnap2-/- dSPNs. Squares/triangles represent the threshold for each neuron. n is the same as in panel E. p=0.1348, Mann-Whitney test. (G) Example AP traces in Cntnap2+/+ iSPNs evoked by a 200 pA current step in the absence or presence of α-DTX. (H) Quantification (mean ± SEM) of the number of APs evoked in Cntnap2+/+ iSPNs. Cntnap2+/+ n = 17 cells from 9 mice, Cntnap2+/+ + α-DTX n=17 cells from 9 mice. Repeated measures two-way ANOVA p values are shown; drug x c F (13, 416)=0.3719, drug F (1, 32)=2.161, current F (1.955, 62.57)=215.9. (I) Quantification (mean ± SEM) of the AP threshold in Cntnap2+/+ iSPNs. Dots/triangles represent the threshold for each neuron. n is the same as in panel H. p=0.5401, Mann-Whitney test. (J) Example AP traces in Cntnap2-/- iSPNs evoked by a 200 pA current step in the absence or presence of α-DTX. (K) Quantification (mean ± SEM) of the number of APs evoked in Cntnap2-/- iSPNs. Cntnap2-/- n=18 cells from 10 mice, Cntnap2-/- + α-DTX n=19 cells from 10 mice. Repeated measures two-way ANOVA p values are shown; drug x c F (13, 455)=2.623, drug F (1, 35)=0.01734, current F (1.721, 60.23)=227.4. (L) Quantification (mean ± SEM) of the AP threshold in Cntnap2-/- iSPNs. Squares/triangles represent the threshold for each neuron. n is the same as in panel K. p=0.4250, two-tailed unpaired t test.
Figure 4—figure supplement 1
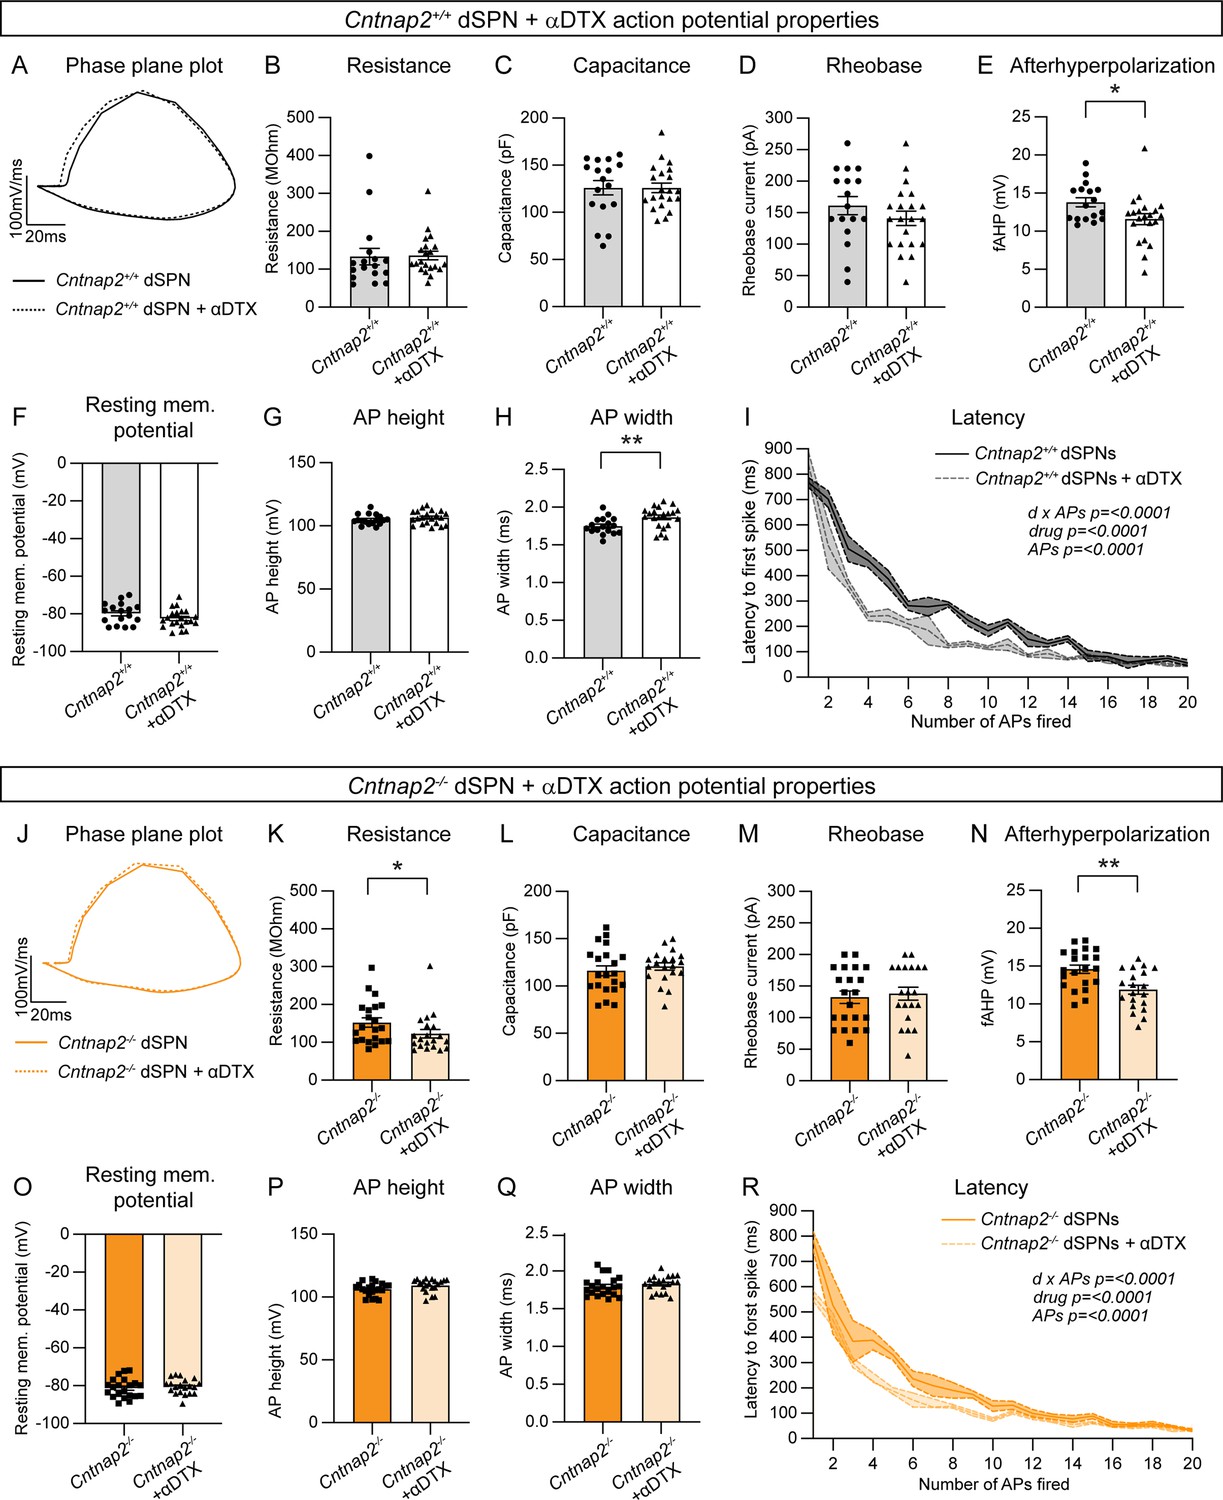
Inhibition of Kv1.2 differentially impacts action potential properties in Cntnap2+/+ and Cntnap2-/- dSPNs.
(A) Phase plane plot of a single AP evoked in Cntnap2+/+ dSPNs in the absence (solid black) or presence (dotted black) of α-Dendrotoxin (α-DTX). (B, C) Quantification (mean ± SEM) of the Cntnap2+/+ dSPN membrane resistance (B), p=0.2681, Mann-Whitney test; and membrane capacitance (C), p=0.9886, two-tailed unpaired t test. Dots/triangles represent the average value for each neuron, Cntnap2+/+ n = 17 cells from 8 mice, Cntnap2+/+ + α-DTX n=21 cells from 8 mice. (D) Quantification (mean ± SEM) of the rheobase current in Cntnap2+/+ dSPNs. Dots/triangles represent the rheobase current for each neuron. n is the same as in panels B-C. p=0.2703, two-tailed unpaired t test. (E–H) Quantification (mean ± SEM) of the Cntnap2+/+ dSPN fast afterhyperpolarization (E), *p=0.0274, two-tailed unpaired t test; resting membrane potential (F), p=0.1207, two-tailed unpaired t test; AP height (G), p=0.3037, two-tailed unpaired t test; and AP width at half max (H), **p=0.0084, two-tailed unpaired t test. Dots/triangles represent the value for the first spike evoked at rheobase for each neuron. n is the same as in panels B, C. (I) Quantification (mean ± SEM) of Cntnap2+/+ dSPN AP latency to first spike, plotted by number of APs fired in the current pulse. Shaded area around line represents SEM. Mixed-effects model with Geisser-Greenhouse correction p values are shown; d x APs F (19, 126)=4.825, drug F (1, 36)=23.33, APs F (19.00, 126.0)=106.7. (J) Phase plane plot of a single AP evoked in Cntnap2-/- dSPNs in the absence (solid orange) or presence (dotted orange) of α-Dendrotoxin (α-DTX). (K, L) Quantification (mean ± SEM) of the Cntnap2-/- dSPNs membrane resistance (K), *p=0.0452, Mann-Whitney test; and membrane capacitance (L), p=0.4950, two-tailed unpaired t test. Squares/triangles represent the average value for each neuron, Cntnap2-/- n=21 cells from 9 mice, Cntnap2-/- + α-DTX n=20 cells from 9 mice. (M) Quantification (mean ± SEM) of the rheobase current in Cntnap2-/- dSPNs. Squares/triangles represent the rheobase current for each neuron. n is the same as in panels K-L. p=0.6239, Mann-Whitney test. (N–Q) Quantification (mean ± SEM) of the Cntnap2-/- dSPN fast afterhyperpolarization (N), **p=0.0017, two-tailed unpaired t test; resting membrane potential (O), p=0.5681, two-tailed unpaired t test; AP height (P), p=0.0652, two-tailed unpaired t test; and AP width at half max (Q), p=0.3400, two-tailed unpaired t test. Squares/triangles represent the value for the first spike evoked at rheobase for each neuron. n is the same as in panels K-L. (R) Quantification (mean ± SEM) of Cntnap2-/- dSPN AP latency to first spike, plotted by number of APs fired in the current pulse. Shaded area around line represents SEM. Mixed-effects model with Geisser-Greenhouse correction p values are shown; d x APs F (19, 135)=3.362, drug F (1, 39)=30.66, APs F (19.00, 135.0)=123.8.
Figure 4—figure supplement 2
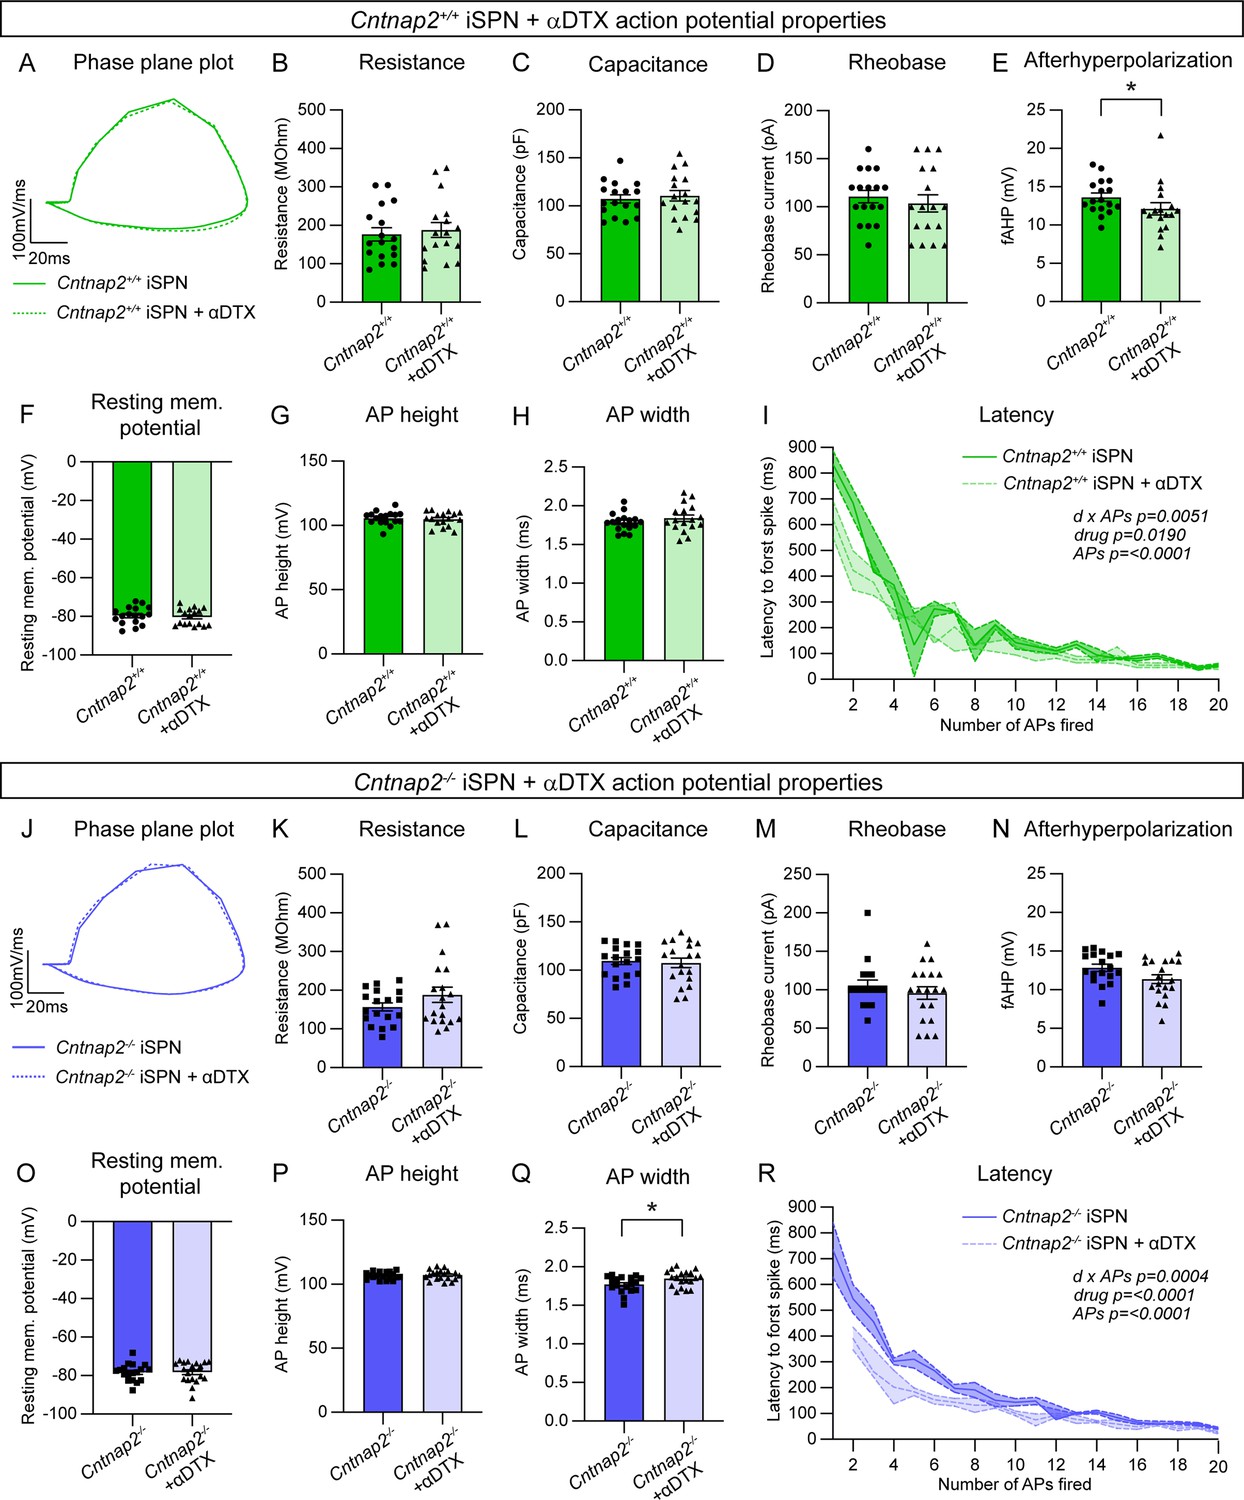
Inhibition of Kv1.2 does not strongly affect the excitability of iSPNs.
(A) Phase plane plot of a single AP evoked in Cntnap2+/+ iSPNs in the absence (solid green) or presence (dotted green) of α-Dendrotoxin (α-DTX). (B, C) Quantification (mean ± SEM) of the Cntnap2+/+ iSPN membrane resistance (B), p=0.6624, two-tailed unpaired t test; and membrane capacitance (C), p=0.6444, two-tailed unpaired t test. Dots/triangles represent the average value for each neuron, Cntnap2+/+ n = 17 cells from 9 mice, Cntnap2+/+ + α-DTX n=17 cells from 9 mice. (D) Quantification (mean ± SEM) of the rheobase current in Cntnap2+/+ iSPNs. Dots/triangles represent the rheobase current for each neuron. n is the same as in panels B-C. p=0.5267, two-tailed unpaired t test. (E–H) Quantification (mean ± SEM) of the Cntnap2+/+ iSPN fast afterhyperpolarization (E), *p=0.0238, Mann-Whitney test; resting membrane potential (F), p=0.6832, Mann-Whitney test; AP height (G), p=0.6448, two-tailed unpaired t test; and AP width at half max (H), p=0.3070, two-tailed unpaired t test. Dots/triangles represent the value for the first spike evoked at rheobase for each neuron. n is the same as in panels B-C. (I) Quantification (mean ± SEM) of Cntnap2+/+ iSPN AP latency to first spike, plotted by number of APs fired in the current pulse. Shaded area around line represents SEM. Mixed-effects model with Geisser-Greenhouse correction p values are shown; d x APs F (17, 82)=2.375, drug F (1, 32)=6.104, APs F (17.00, 82.00)=40.22. (J) Phase plane plot of a single AP evoked in Cntnap2-/- iSPNs in the absence (solid blue) or presence (dotted blue) of α-Dendrotoxin (α-DTX). (K, L) Quantification (mean ± SEM) of the Cntnap2-/- iSPNs membrane resistance (K), p=0.1746, two-tailed unpaired t test; and membrane capacitance (L), p=0.7511, two-tailed unpaired t test. Squares/triangles represent the average value for each neuron, Cntnap2-/- n=18 cells from 10 mice, Cntnap2-/- + α-DTX n=19 cells from 10 mice. (M) Quantification (mean ± SEM) of the rheobase current in Cntnap2-/- iSPNs. Squares/triangles represent the rheobase current for each neuron. n is the same as in panels K-L. p=0.6589, Mann-Whitney test. (N–Q) Quantification (mean ± SEM) of the Cntnap2-/- iSPN fast afterhyperpolarization (N), p=0.0538, two-tailed unpaired t test; resting membrane potential (O), p=0.9461, two-tailed unpaired t test; AP height (P), p=0.5920, two-tailed unpaired t test; and AP width at half max (Q), *p=0.0335, two-tailed unpaired t test, in the absence or presence of α-DTX. Squares/triangles represent the value for the first spike evoked at rheobase for each neuron. n is the same as in panels K-L. (R) Quantification (mean ± SEM) of Cntnap2-/- iSPN AP latency to first spike in the absence or presence of α-DTX, plotted by number of APs fired in the current pulse. Shaded area around line represents SEM. Mixed-effects model with Geisser-Greenhouse correction p values are shown; d x APs F (17, 68)=3.181, drug F (1, 35)=20.66, APs F (17.00, 68.00)=82.73.
Figure 5 with 1 supplement
Cntnap2-/- mice have increased repetitive behaviors.
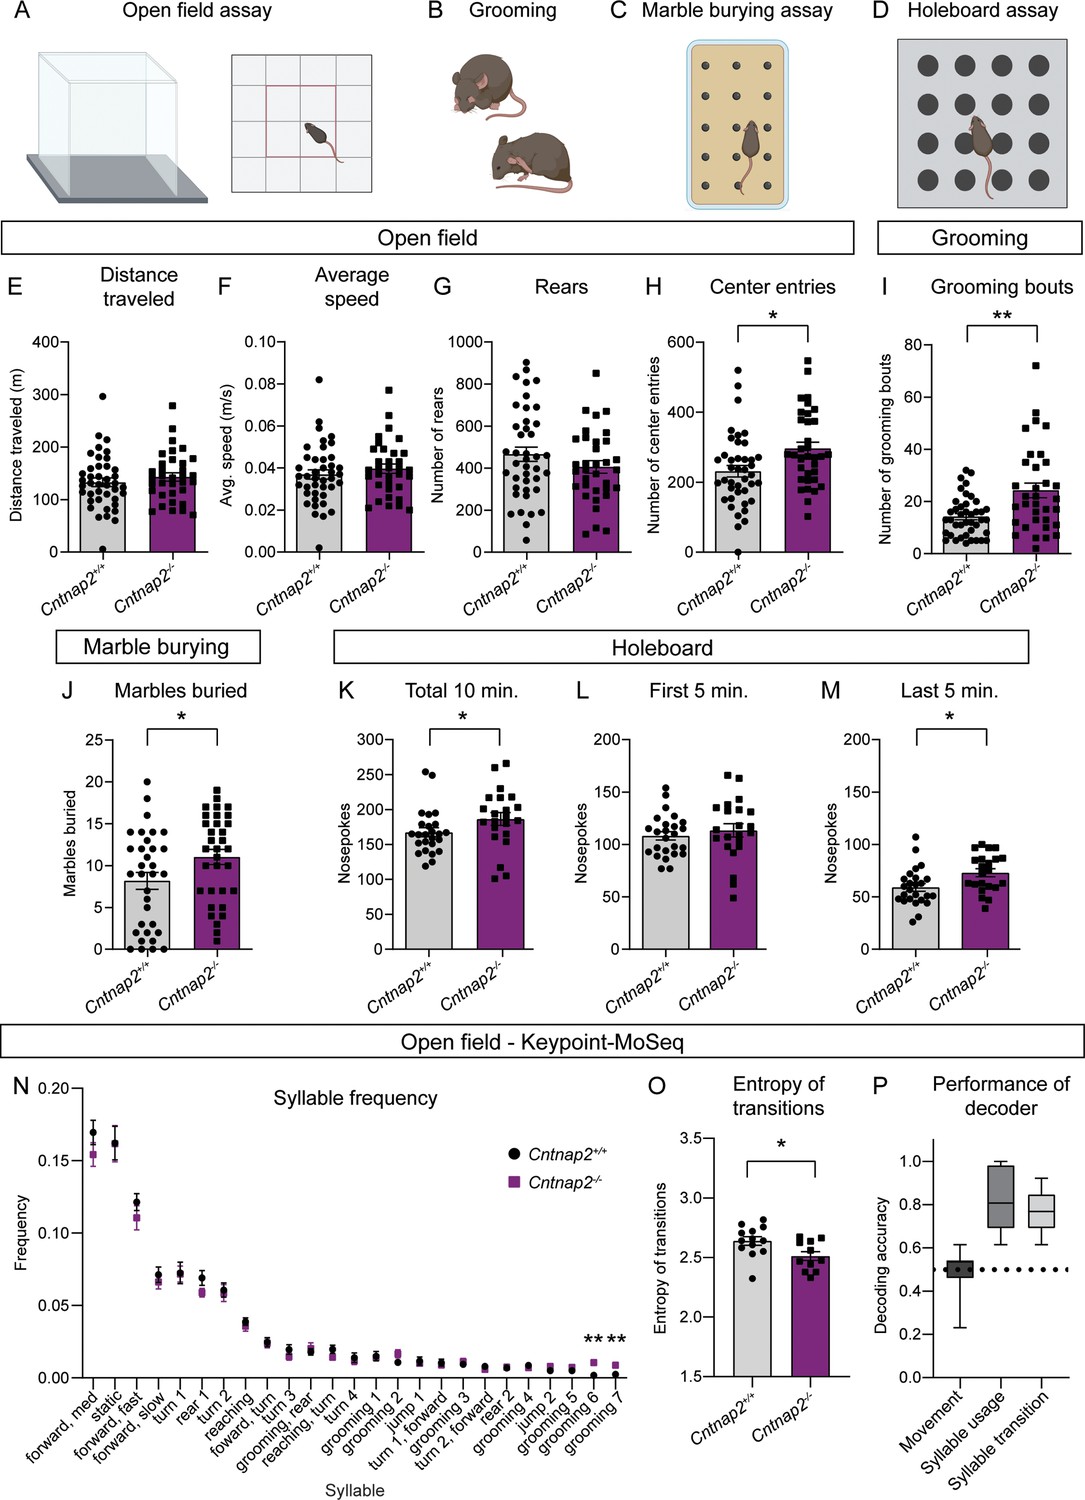
(A–D) Schematics of the behavioral assays used to measure repetitive behaviors in Cntnap2+/+ and Cntnap2-/- mice. Created with BioRender.com. Male and female mice were used for all tests. (E–H) Quantification (mean ± SEM) of open field activity over 60 min. (E) Total distance traveled, p=0.3538, Mann-Whitney test; (F) average speed, p=0.3832, Mann-Whitney test; (G) number of rears, p=0.1892, two-tailed unpaired t test; (H) number of center entries, *p=0.0101, two-tailed unpaired t test. Cntnap2+/+ n = 41 mice, Cntnap2-/- n=34 mice. (I) Quantification (mean ± SEM) of the number of manually scored grooming bouts in the first 20 min of the open field test, **p=0.0034, Mann-Whitney test, Cntnap2+/+ n = 41 mice, Cntnap2-/- n=34 mice. (J) Quantification (mean ± SEM) of total marbles buried in the marble burying assay. Cntnap2+/+ n = 33 mice and Cntnap2-/- n=33 mice, *p=0.0396, two-tailed unpaired t test. (K–M) Quantification (mean ± SEM) of performance in the holeboard assay. (K) Total number of nose pokes in 10 min, *p=0.0212, Mann-Whitney test; (L) nose pokes in the first 5 min, p=0.4811, two-tailed unpaired t test; and (M) nose pokes in the last 5 min, *p=0.0116, two-tailed unpaired t test. Cntnap2+/+ n = 25 mice, Cntnap2-/- n=22 mice. (N) Quantification (mean ± SEM) of the frequency of movement syllables (top 25 most frequent syllables) in the open field assay defined by Keypoint-MoSeq. Cntnap2+/+ n = 13 mice and Cntnap2-/- n=11 mice, **p=0.0013 for grooming 6, **p=0.0013 for grooming 7, Kruskal-Wallis test with Dunn’s correction for multiple comparisons. (O) Quantification (mean ± SEM) of the entropy of syllable transitions in the open field assay. Cntnap2+/+ n = 13 mice and Cntnap2-/- n=11 mice, *p=0.0236, two-tailed unpaired t test. (P) Accuracy of a Random Forest decoder trained on DeepLabCut basic locomotor data (Movement), Keypoint-MoSeq syllable usage data (Syllable usage), or Keypoint-MoSeq syllable transition data (Syllable transition) in distinguishing between Cntnap2+/+ and Cntnap2-/- mice. Dotted line represents chance performance. For panels E-M and O, dots/squares represent the value for each mouse.
Figure 5—figure supplement 1
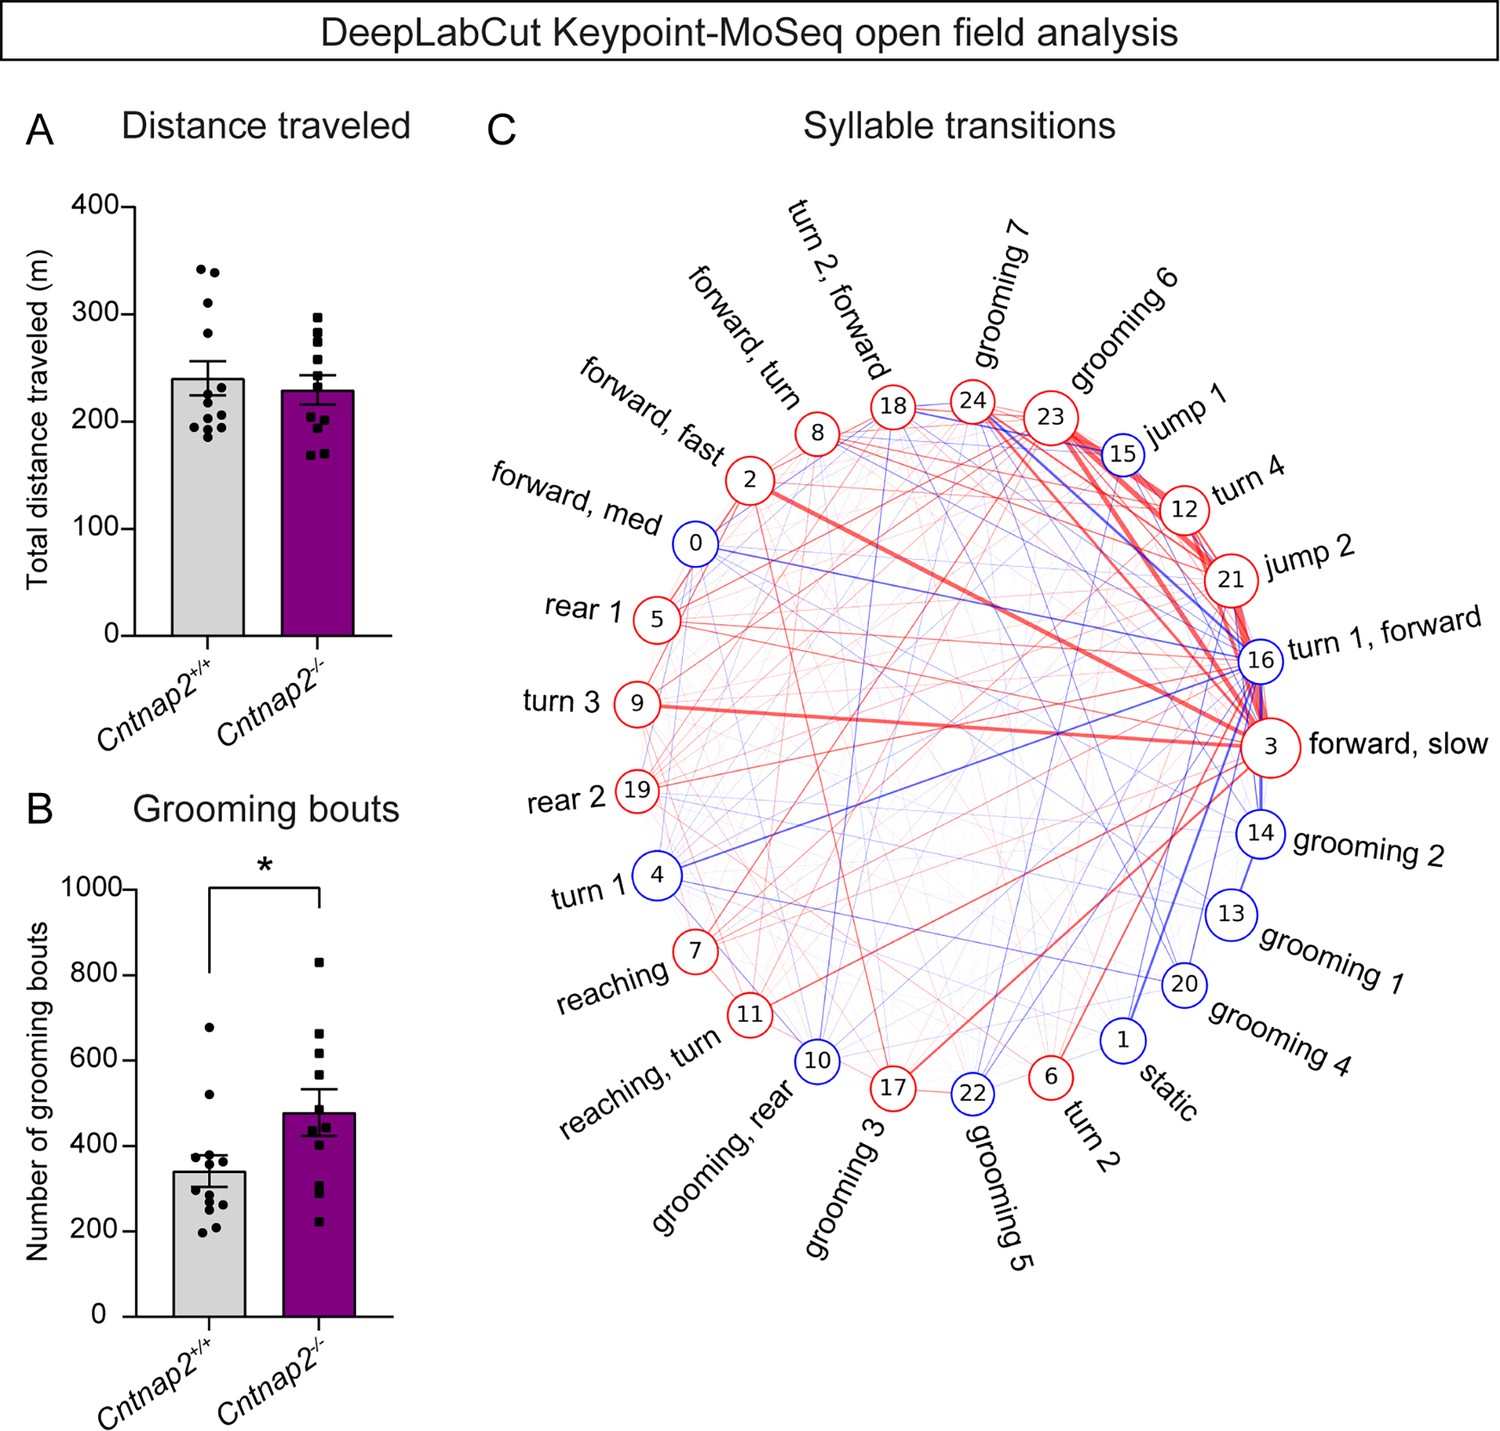
DeepLabCut and Keypoint-MoSeq analysis of Cntnap2-/- mice.
(A) Quantification (mean ± SEM) of the total distance traveled in the open field measured by DeepLabCut, p=0.8201, Mann-Whitney test; Cntnap2+/+ n = 13 mice and Cntnap2-/- n=11 mice. (B) Quantification (mean ± SEM) of the number of grooming bouts in the open field assessed by Keypoint-MoSeq, calculated as the number of instances of all grooming syllables. Cntnap2+/+ n = 13 mice and Cntnap2-/- n=11 mice, *p=0.0352, Mann-Whitney test. (C) Map depicting the difference in transitions between syllables (top 25 most frequent syllables) for Cntnap2+/+ and Cntnap2-/- mice (represented as Cntnap2-/- minus Cntnap2+/+). A red circle around a syllable number indicates increased usage of that syllable in Cntnap2-/- mice, a blue circle indicates decreased usage of that syllable in Cntnap2-/- mice. A red line between syllable numbers indicates increased usage of that syllable transition in Cntnap2-/- mice, and a blue line indicates decreased usage of that syllable transition in Cntnap2-/- mice. The thickness of the line scales with the size of the difference and the size of the circle surrounding the syllable number scales with the usage of the syllable.
Figure 6
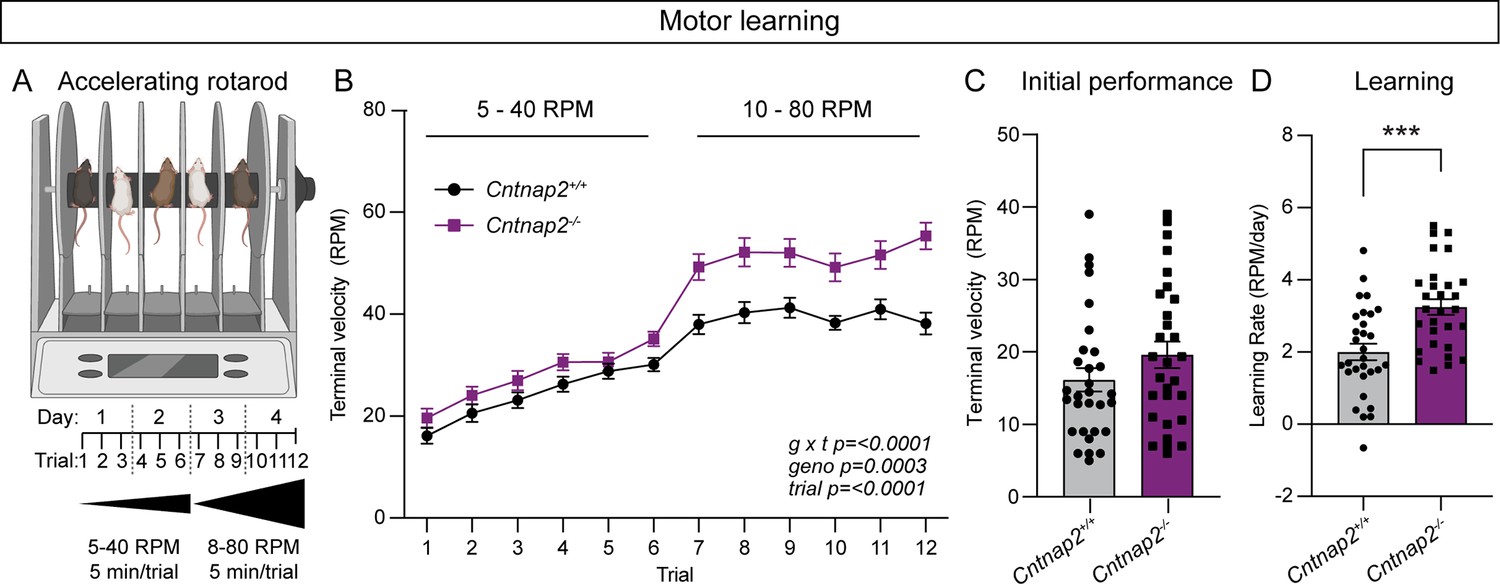
Cntnap2-/- mice exhibit enhanced motor learning.
(A) Schematic of the rotarod apparatus (top), and design of the task (bottom). Created with BioRender.com. Mice walk to stay on the rotating rod for three 5-min trials a day for 2 days at 5–40 RPM acceleration over 5 min, followed by three trials a day for 2 days at 10–80 RPM. (B) Quantification (mean ± SEM) of accelerating rotarod performance across 12 trials for the indicated genotypes. Cntnap2+/+ n = 30 mice, Cntnap2-/- n=29 mice. Repeated measures two-way ANOVA p values are shown; g x t F (11, 616)=4.935, geno F (1, 56)=15.29, trial F (7.245, 405.7)=108.4. (C) Quantification (mean ± SEM) of rotarod performance on trial 1 quantified as terminal speed. Dots/squares represent the performance of individual mice. n is same as in panel B, p=0.1518, Mann-Whitney test. (D) Quantification (mean ± SEM) of learning rate (RPM/day) calculated as the slope of the line of performance from the first trial (1) to the last trial (12) for each mouse. Dots/squares represent the learning rate for individual mice. n is the same as in panel B, ***p=0.0002, two-tailed unpaired t test.
Figure 7
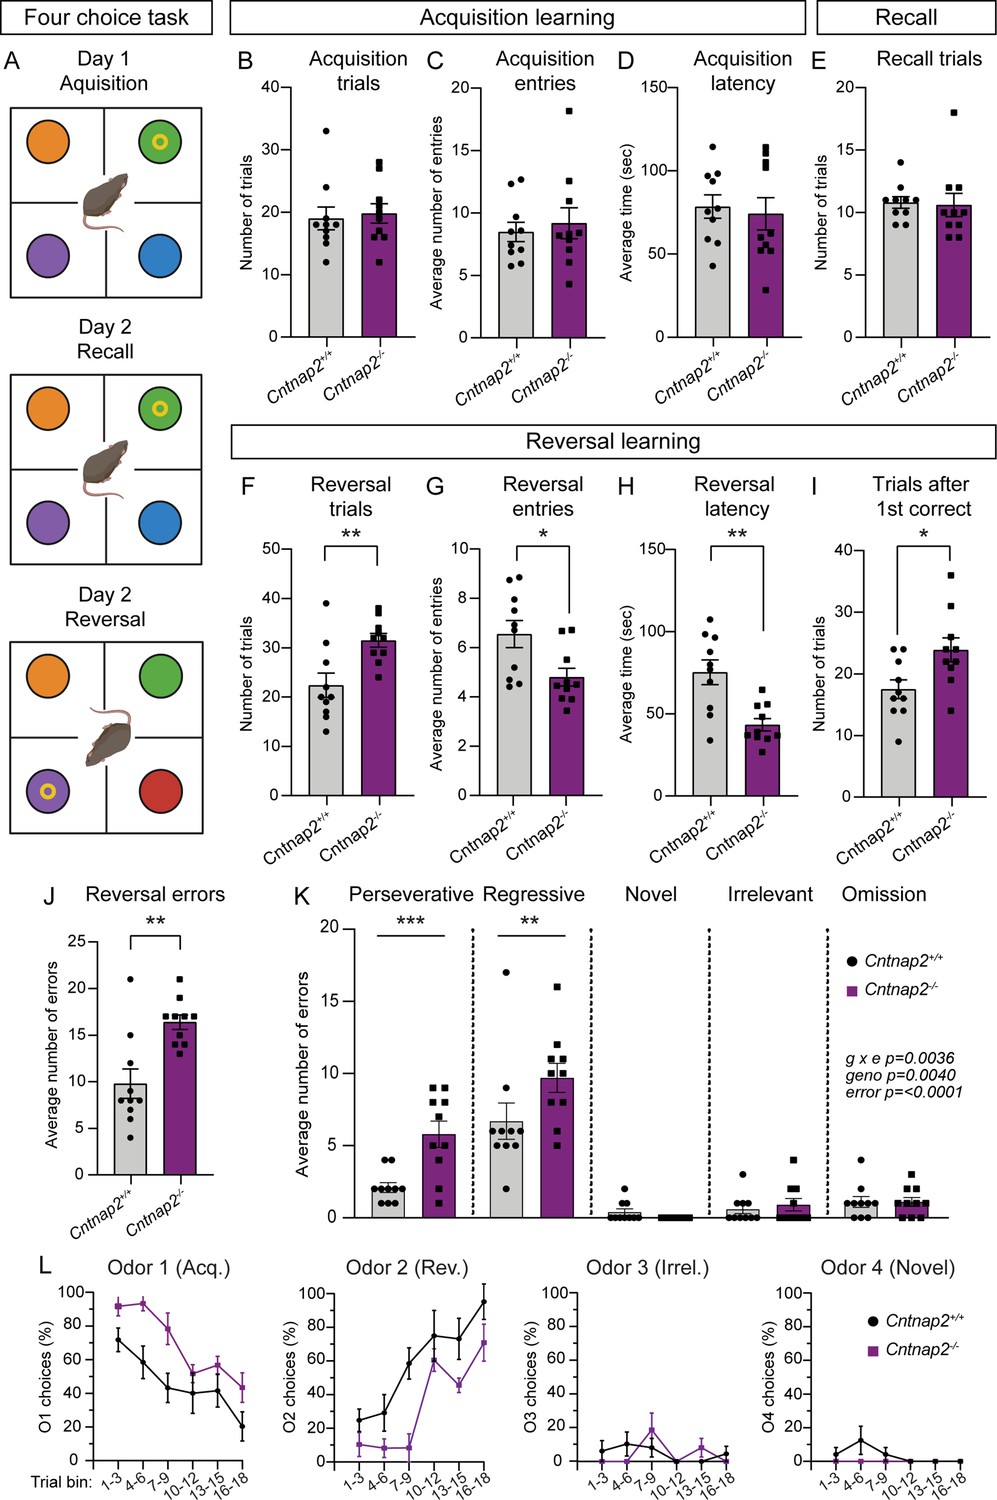
Cntnap2-/- mice demonstrate cognitive inflexibility.
(A) Schematic of the four-choice odor-based reversal learning task. Created with BioRender.com. Colored circles represent pots with different scented wood shavings. Yellow ring represents the food reward. Red circle in the Day 2 Reversal panel indicates a novel odor. (B–D) Quantification of parameters during acquisition learning. Mean ± SEM number of trials to reach criterion (B, at least 8 out of last 10 trials correct), p=0.5397, Mann-Whitney test; number of quadrant entries before making a choice (C), p=0.9118, Mann-Whitney test; and latency to make a choice (D), p=0.7224, two-tailed unpaired t test. Dots/squares represent the value for each mouse. (E) Quantification (mean ± SEM) of the number of trials to reach criterion (at least 8 out of last 10 trials correct) during the recall test on day 2, p=0.3737, Mann-Whitney test. (F–I) Quantification of parameters during reversal learning. Mean ± SEM number of trials to reach criterion (F, at least 8 out of last 10 trials correct), **p=0.0048, two-tailed unpaired t test; number of quadrant entries before making a choice (G), *p=0.0158, two-tailed unpaired t test; latency to make a choice (H), **p=0.0013, two-tailed unpaired t test; and number of trials to reach criterion after the first correct choice (I), *p=0.0183, two-tailed unpaired t test. (J) Quantification (mean ± SEM) of the total number of errors made during reversal learning, **p=0.0034, Mann-Whitney test. (K) Quantification (mean ± SEM) of the different error types made during reversal learning. Perseverative errors, ***p=0.0005, regressive errors **p=0.0068, novel errors, p=0.9955, irrelevant errors p=0.9988, omissions, p=>0.9999, repeated measures two-way ANOVA with Šídák’s multiple comparisons test; g x e F (4, 72)=4.292, geno F (1, 18)=10.91, error F (4, 72)=53.49. (L) Quantification (mean ± SEM) of the percent of choices made for each odor, binned across three trials, during reversal learning. Odor 1 was rewarded during acquisition learning. Odor 2 was rewarded during reversal learning. Odor 3 was never rewarded (irrelevant). Odor 4 was a novel odor introduced during the reversal learning phase. For panels B-L, n=10 Cntnap2+/+ mice and 10 Cntnap2-/- mice.
Author response image 1
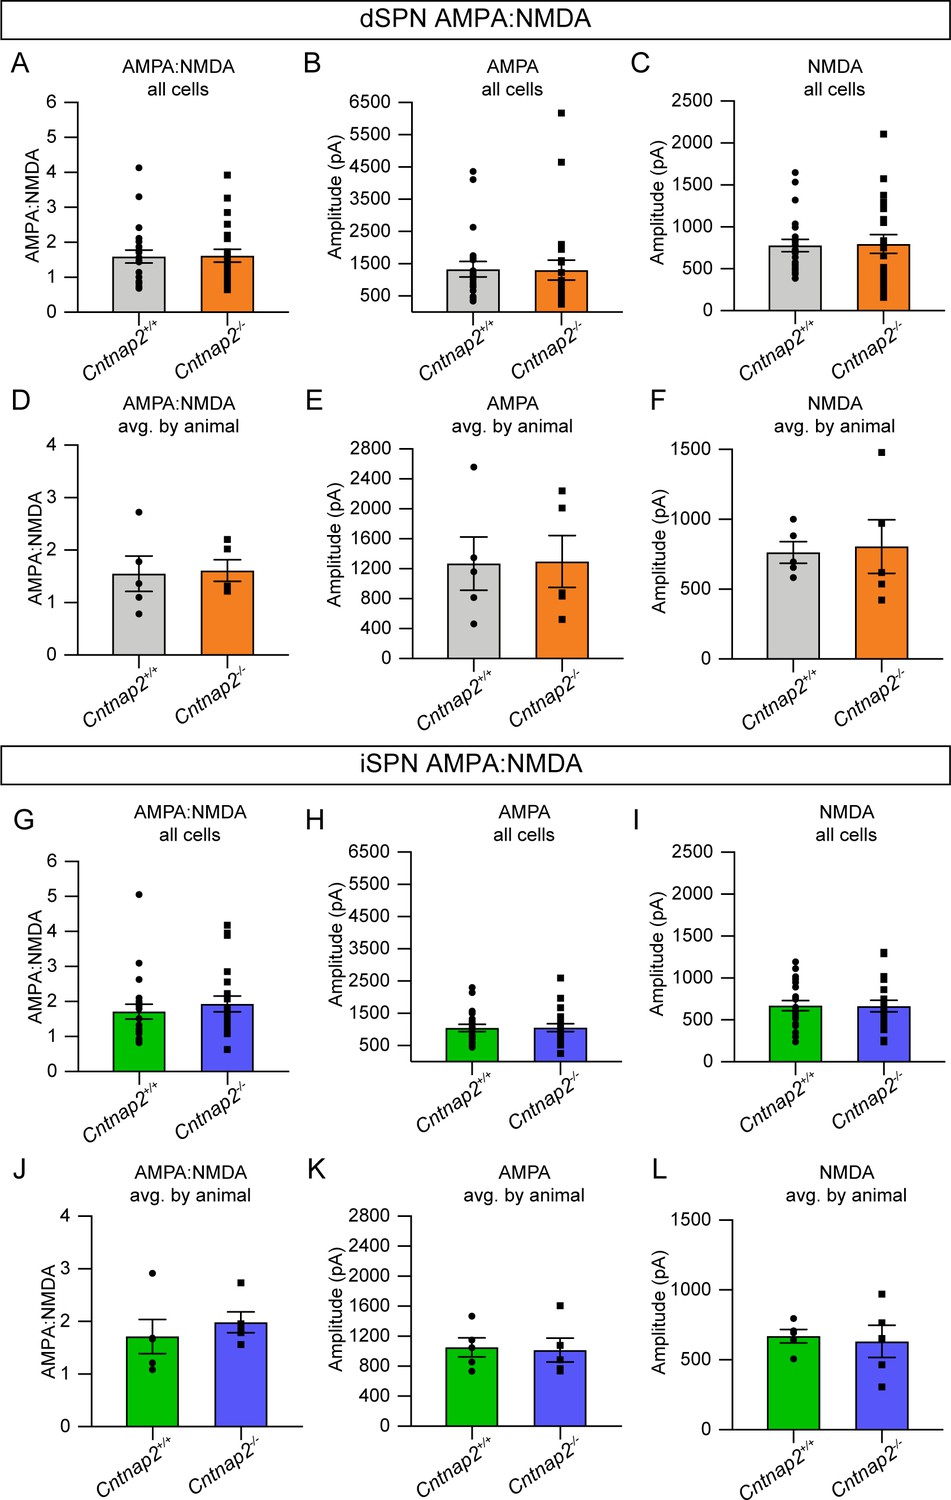
AMPA and NMDA receptor-mediated EPSCs are unchanged in Cntnap2-/- SPNs.
(A) Quantification (mean ± SEM) of AMPA:NMDA ratio per cell for Cntnap2+/+ and Cntnap2-/- dSPNs, p=0.9537, Mann-Whitney test. (B) dSPN AMPA current per cell, p=0.6172, Mann-Whitney test. (C) dSPN NMDA current per cell, p=0.6009, Mann-Whitney test. (D) dSPN AMPA:NMDA ratio averaged by animal, p=0.8413, Mann-Whitney test. (E) dSPN AMPA current averaged by animal, p>0.9999, Mann-Whitney test. (F) dSPN NMDA current averaged by animal, p=0.6905, Mann-Whitney test. (G) Quantification (mean ± SEM) of AMPA:NMDA ratio per cell for Cntnap2+/+ and Cntnap2-/- iSPNs, p=0.4104, Mann-Whitney test. (H) iSPN AMPA current per cell, p=0.9010, Mann-Whitney test. (I) iSPN NMDA current per cell, p=0.9512, two-tailed unpaired t test. (J) iSPN AMPA:NMDA averaged by animal, p=0.3095, Mann-Whitney test. (K) iSPN AMPA current averaged by animal, p=>0.9999, Mann-Whitney test. (L) iSPN NMDA current averaged by animal, p=0.8413, Mann-Whitney test. All values were recorded using 20% blue light intensity. For dSPNs: Cntnap2+/+ n=22 cells from 5 mice, Cntnap2-/- n=22 cells from 5 mice. For iSPNs: Cntnap2+/+ n=21 cells from 5 mice, Cntnap2-/- n=21 cells from 5 mice.
Author response image 2
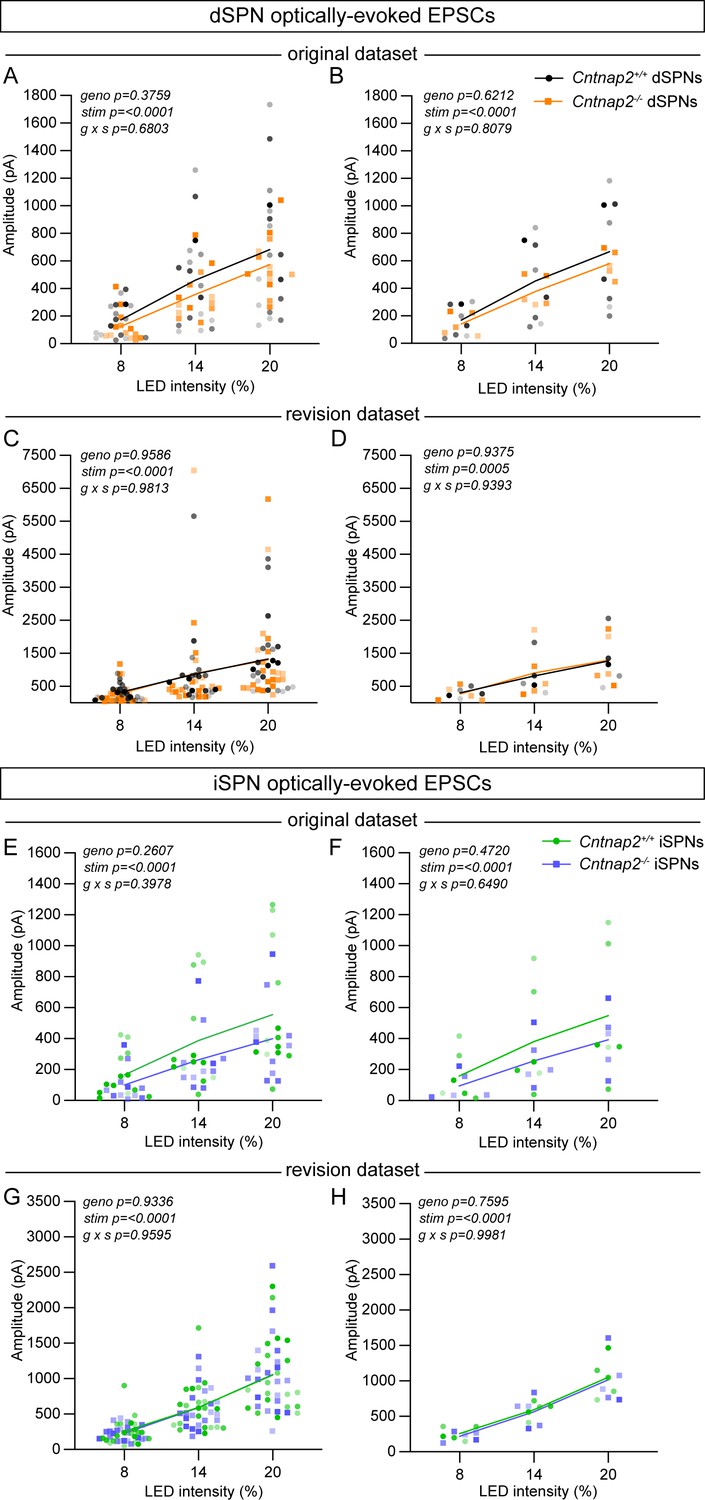
Optically-evoked AMPAR EPSCs exhibit within- and between-animal variability.
(A) Quantification of EPSC amplitude evoked in dSPNs at different light intensities from the original dataset, plotted by cell (line represents the mean, dots/squares represent average EPSC amplitude for each recorded cell). Cntnap2+/+ n=17 cells from 8 mice, Cntnap2-/- n=13 cells from 5 mice. Repeated measures two-way ANOVA p values are shown; g x s F (2, 56) = 0.3879, geno F (1, 28) = 0.8098, stim F (1.047, 29.32) = 76.56. (B) Quantification of EPSC amplitude evoked in dSPNs, averaged by mouse (line represents the mean, dots/squares represent average EPSC amplitude for each mouse). Cntnap2+/+ n=8 mice, Cntnap2-/- n=5 mice. Repeated measures two-way ANOVA p values are shown; g x s F (2, 22) = 0.2154, geno F (1, 11) = 0.2585, stim F (1.053, 11.58) = 49.68. (C) Quantification of EPSC amplitude in dSPNs from the revision dataset, plotted by cell (line represents the mean, dots/squares represent average EPSC amplitude for each recorded cell). Cntnap2+/+ n=22 cells from 5 mice, Cntnap2-/- n=22 cells from 5 mice. Repeated measures two-way ANOVA p values are shown; g x s F (2, 84) = 0.01885, geno F (1, 42) = 0.002732, stim F (1.863, 78.26) = 20.93. (D) Quantification of EPSC amplitude in dSPNs from the revision dataset, averaged by mouse (line represents the mean, dots/squares represent average EPSC amplitude for each mouse). Cntnap2+/+ n=5 mice, Cntnap2-/- n=5 mice. Repeated measures two-way ANOVA p values are shown; g x s F (2, 16) = 0.06288, geno F (1, 8) = 0.006548, stim F (1.585, 12.68) = 16.97. (E) Quantification of EPSC amplitude evoked in iSPNs from the original dataset, plotted by cell (line represents the mean, dots/squares represent average EPSC amplitude for each recorded cell). Cntnap2+/+ n=13 cells from 6 mice, Cntnap2-/- n=11 cells from 5 mice. Repeated measures two-way ANOVA p values are shown; g x s F (2, 44) = 0.9414, geno F (1, 22) = 1.333, stim F (1.099, 24.18) = 52.26. (F) Quantification of EPSC amplitude evoked in iSPNs from original dataset, averaged by mouse (line represents the mean, dots/squares represent average EPSC amplitude for each mouse). Cntnap2+/+ n=6 mice, Cntnap2-/- n=5 mice. Repeated measures two-way ANOVA p values are shown; g x s F (2, 18) = 0.4428, geno F (1, 9) = 0.5635, stim F (1.095, 9.851) = 23.82. (G) Quantification of EPSC amplitude evoked in iSPNs from the revision dataset, plotted by cell (line represents the mean, dots/squares represent average EPSC amplitude for each recorded cell). Cntnap2+/+ n=21 cells from 5 mice, Cntnap2-/- n=21 cells from 5 mice. Repeated measures two-way ANOVA p values are shown; g x s F (2, 80) = 0.04134, geno F (1, 40) = 0.007025, stim F (1.208, 48.31) = 102.9. (H) Quantification of EPSC amplitude evoked in iSPNs from the revision dataset, averaged by mouse (line represents the mean, dots/squares represent average EPSC amplitude for each mouse). Cntnap2+/+ n=5 mice, Cntnap2-/- n=5 mice. Repeated measures two-way ANOVA p values are shown; g x s F (2, 16) = 0.001865, geno F (1, 8) = 0.1004, stim F (1.179, 9.433) = 61.31.
Author response image 3
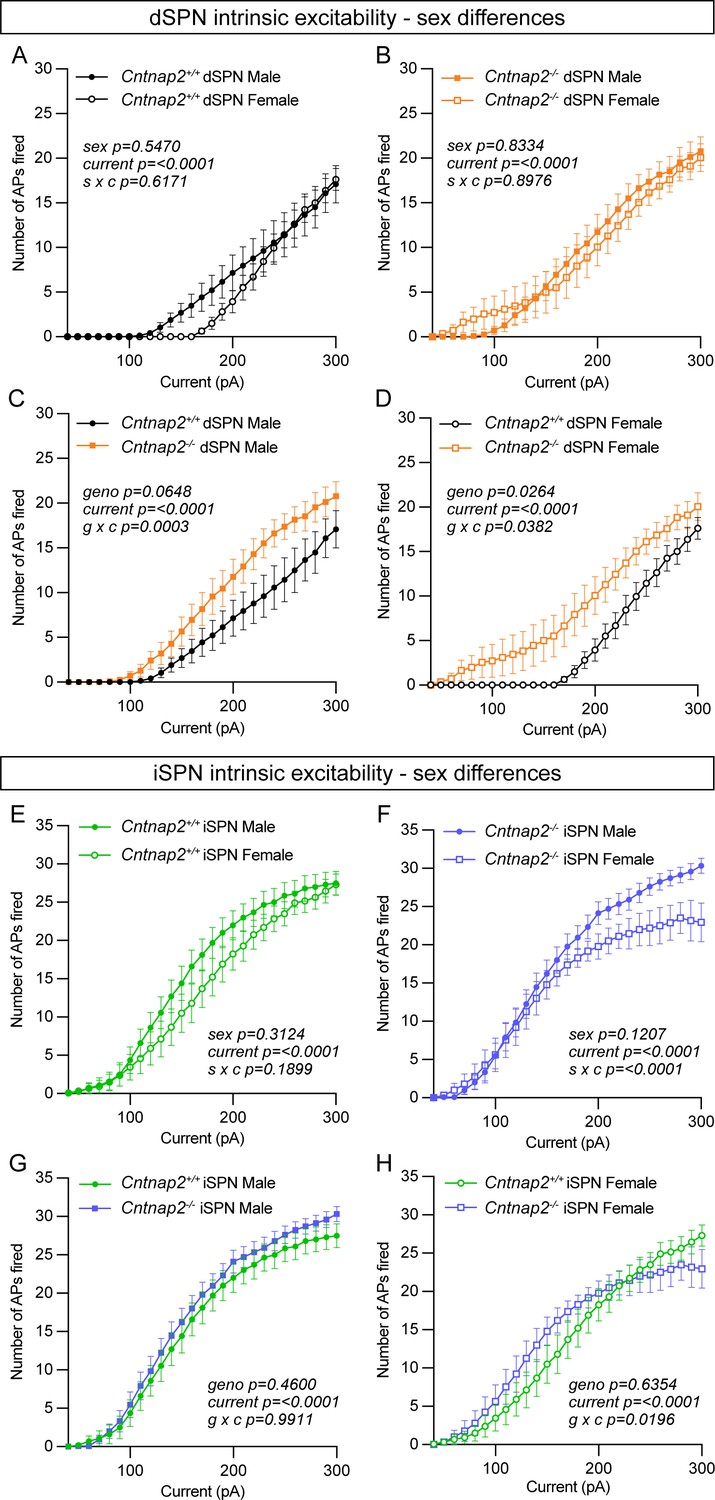
Enhanced excitability of Cntnap2-/- dSPNs is present in both males and females.
(A) Quantification (mean ± SEM) of the number of APs evoked in dSPNs in Cntnap2+/+ males and females at different current step amplitudes. Cntnap2+/+ males n=12 cells from 4 mice, Cntnap2+/+ females n=8 cells from 4 mice. Repeated measures two-way ANOVA p values are shown; s x c F (28, 560) = 0.8992, sex F (1, 20) = 0.3754, current F (1.279, 25.57) = 56.85. (B) Quantification (mean ± SEM) of the number of APs evoked in dSPNs in Cntnap2-/- males and females at different current step amplitudes. Cntnap2-/- males n=12 cells from 4 mice, Cntnap2-/- females n=11 cells from 4 mice. Repeated measures two-way ANOVA p values are shown; s x c F (28, 588) = 0.6752, sex F (1, 21) = 0.04534, current F (2.198, 46.15) = 78.89. (C) Quantification (mean ± SEM) of the number of APs evoked in dSPNs in Cntnap2+/+ males and Cntnap2-/- males at different current step amplitudes. Cntnap2+/+ males n=12 cells from 4 mice, Cntnap2-/- males n=12 cells from 4 mice. Repeated measures two-way ANOVA p values are shown; g x c F (28, 672) = 2.233, geno F (1, 24) = 3.746, current F (1.708, 40.98) = 79.82. (D) Quantification (mean ± SEM) of the number of APs evoked in dSPNs in Cntnap2+/+ females and Cntnap2-/- females at different current step amplitudes. Cntnap2+/+ females n=8 cells from 4 mice, Cntnap2-/- females n=11 cells from 4 mice. Repeated measures two-way ANOVA p values are shown; g x c F (28, 476) = 1.547, geno F (1, 17) = 5.912, current F (1.892, 32.17) = 58.76. (E) Quantification (mean ± SEM) of the number of APs evoked in iSPNs in Cntnap2+/+ males and females at different current step amplitudes. Cntnap2+/+ males n=10 cells from 4 mice, Cntnap2+/+ females n=12 cells from 4 mice. Repeated measures two-way ANOVA p values are shown; s x c F (28, 560) = 1.236, sex F (1, 20) = 1.074, current F (2.217, 44.34) = 179.6. (F) Quantification (mean ± SEM) of the number of APs evoked in iSPNs in Cntnap2-/- males and females at different current step amplitudes. Cntnap2-/- males n=12 cells from 4 mice, Cntnap2-/- females n=9 cells from 4 mice. Repeated measures two-way ANOVA p values are shown; s x c F (28, 532) = 2.513, sex F (1, 19) = 2.639, current F (1.858, 35.31) = 152.5. (G) Quantification (mean ± SEM) of the number of APs evoked in iSPNs in Cntnap2+/+ males and Cntnap2-/- males at different current step amplitudes. Cntnap2+/+ males n=10 cells from 4 mice, Cntnap2-/- males n=12 cells from 4 mice. Repeated measures two-way ANOVA p values are shown; g x c F (28, 560) = 0.4723, geno F (1, 20) = 0.5675, current F (2.423, 48.47) = 301.7. (H) Quantification (mean ± SEM) of the number of APs evoked in iSPNs in Cntnap2+/+ females and Cntnap2-/- females at different current step amplitudes. Cntnap2+/+ females n=12 cells from 4 mice, Cntnap2-/- females n=9 cells from 4 mice. Repeated measures two-way ANOVA p values are shown; g x c F (28, 532) = 1.655, geno F (1, 19) = 0.2322, current F (2.081, 39.55) = 99.45.
Author response image 4
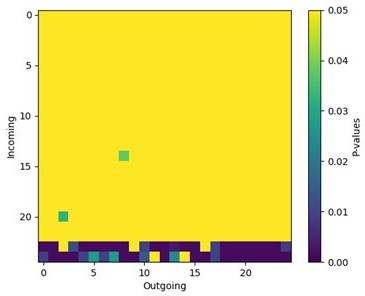
Grooming syllables contribute to some but not all differences in syllable transitions in Cntnap2-/- mice.
We calculated the entropy of each syllable pair using 𝑢𝑖 × 𝑝𝑖,𝑗 × log2 𝑝𝑖,𝑗 for every syllable pair and every animal. We then statistically tested the difference between genotypes for each syllable pair using Mann-Whitney tests. This plot displays those adjusted p-values for each syllable pair between WT and Cntnap2-/- groups. The significant p-values suggest that the transitions to syllables 24 and 25 are different between genotypes (note that these correspond to grooming syllables, see Figure 5N). However, since the overall entropy is a summation of every pair, it is difficult to conclude that syllables 24 and 25 are the sole contributors to the different entropy we observed.
Author response image 5

Time in the center of the open field and time spent grooming trend towards an increase in Cntnap2-/- mice.
(A) Quantification (mean ± SEM) of total time spent in the center of the open field during a 60 minute test, p=0.0656, Mann-Whitney test. (B) Time spent self-grooming during the first 20 minutes of the open field test, p=0.0611, Mann-Whitney test. For both measurements, Cntnap2+/+ n=18 mice, Cntnap2-/- n=19 mice.
Tables
Table 1
Summary of mouse lines used.
| Experiment | Mouse line | Allele 1 (reference; JAX strain #) | Allele 2 (reference; JAX strain #) | Allele 3 (reference; JAX strain #) | Allele 4 (reference; JAX strain #) |
|---|---|---|---|---|---|
| Corticostriatal transmission (Figure 1) | Cntnap2;D1-tdTomato;Thy1-ChR2 | Cntnap2 (Poliak et al., 2003; #017482) | Drd1a-tdTomato (Ade et al., 2011; #016204) | Thy1-ChR2-YFP (Arenkiel et al., 2007; #007612) | |
| General inhibition (Figure 2A–E) | Cntnap2;D1-tdTomato | Cntnap2 (Poliak et al., 2003; #017482) | Drd1a-tdTomato (Ade et al., 2011; #016204) | ||
| PV-specific inhibition (Figure 2F–J) | Cntnap2;D1-tdTomato;PV-Cre;Ai32 | Cntnap2 (Poliak et al., 2003; #017482) | Drd1a-tdTomato (Ade et al., 2011; #016204) | Pvalb-Cre (Hippenmeyer et al., 2005; #017320) | Ai32 (Madisen et al., 2012; #012569) |
| SPN intrinsic excitability (Figure 3, Figure 3—figure supplement 1) | Cntnap2;D1-tdTomato | Cntnap2 (Poliak et al., 2003; #017482) | Drd1a-tdTomato (Ade et al., 2011; #016204) | ||
| SPN intrinsic excitability in the presence of α-DTX (Figure 4, Figure 4—figure supplement 1, Figure 4—figure supplement 2) | Cntnap2;D1-tdTomato | Cntnap2 (Poliak et al., 2003; #017482) | Drd1a-tdTomato (Ade et al., 2011; #016204) | ||
| Behavior experiments* (Figures 5—7, Figure 5—figure supplement 1) | Cntnap2;D1-tdTomato | Cntnap2 (Poliak et al., 2003; #017482) | Drd1a-tdTomato (Ade et al., 2011; #016204) | ||
| Spine analysis, PV cell counting (Figure 1—figure supplement 1, Figure 2—figure supplement 2A–H) | Cntnap2;D1-tdTomato | Cntnap2 (Poliak et al., 2003; #017482) | Drd1a-tdTomato (Ade et al., 2011; #016204) | ||
| PV intrinsic excitability (Figure 2—figure supplement 1) | Cntnap2;PV-Cre;Ai9 | Cntnap2 (Poliak et al., 2003; #017482) | Pvalb-Cre (Hippenmeyer et al., 2005; #017320) | Ai9 (Madisen et al., 2010; #007909) | |
| PV in situ, western blot (Figure 2—figure supplement 2I–N) | Cntnap2 | Cntnap2 (Poliak et al., 2003; #017482) |
-
*
Littermate animals both positive and negative for D1-tdTomato were used in behavior experiments.
Author response table 1
Numbers of male and female mice used for the intrinsic excitability experiments.
| Cell Type | Genotype | Sex | Cells (Animals) |
|---|---|---|---|
| dSPN | Cntnap2+/+ | Male | 12 (4) |
| Female | 8 (4) | ||
| Cntnap2-/- | Male | 12 (4) | |
| Female | 11 (4) | ||
| iSPN | Cntnap2+/+ | Male | 10 (4) |
| Female | 12 (4) | ||
| Cntnap2-/- | Male | 12 (4) | |
| Female | 9 (4) |
Additional files
-
Supplementary file 1
Summary of behavior data by sex and genotype.
Table reporting the behavior test results for each assay, separated by sex and genotype.
- https://cdn.elifesciences.org/articles/100162/elife-100162-supp1-v1.docx
-
Source data 1
Source data for all figures, broken down by figure panel.
Excel spreadsheet containing the numerical data used to create all figures, broken down into tabs for each figure panel.
- https://cdn.elifesciences.org/articles/100162/elife-100162-data1-v1.xlsx
-
MDAR checklist
- https://cdn.elifesciences.org/articles/100162/elife-100162-mdarchecklist1-v1.docx
Download links
A two-part list of links to download the article, or parts of the article, in various formats.
Downloads (link to download the article as PDF)
Open citations (links to open the citations from this article in various online reference manager services)
Cite this article (links to download the citations from this article in formats compatible with various reference manager tools)
Cntnap2 loss drives striatal neuron hyperexcitability and behavioral inflexibility
eLife 13:RP100162.
https://doi.org/10.7554/eLife.100162.3


