Single-cell transcriptomes of zebrafish germline reveal progenitor types and feminization by Foxl2l
- National Center for Biomodels, National Applied Research Laboratories, Taiwan
- Institute of Molecular Biology, Academia Sinica, Taiwan
- Institute of Statistical Science, Academia Sinica, Taiwan
- Statistics Department, University of California, Los Angeles, United States
- Graduate Institute of Biomedical Sciences, China Medical University, Taiwan
- Neuroscience and Brain Disease Center, China Medical University, Taiwan
Figures
Figure 1 with 4 supplements
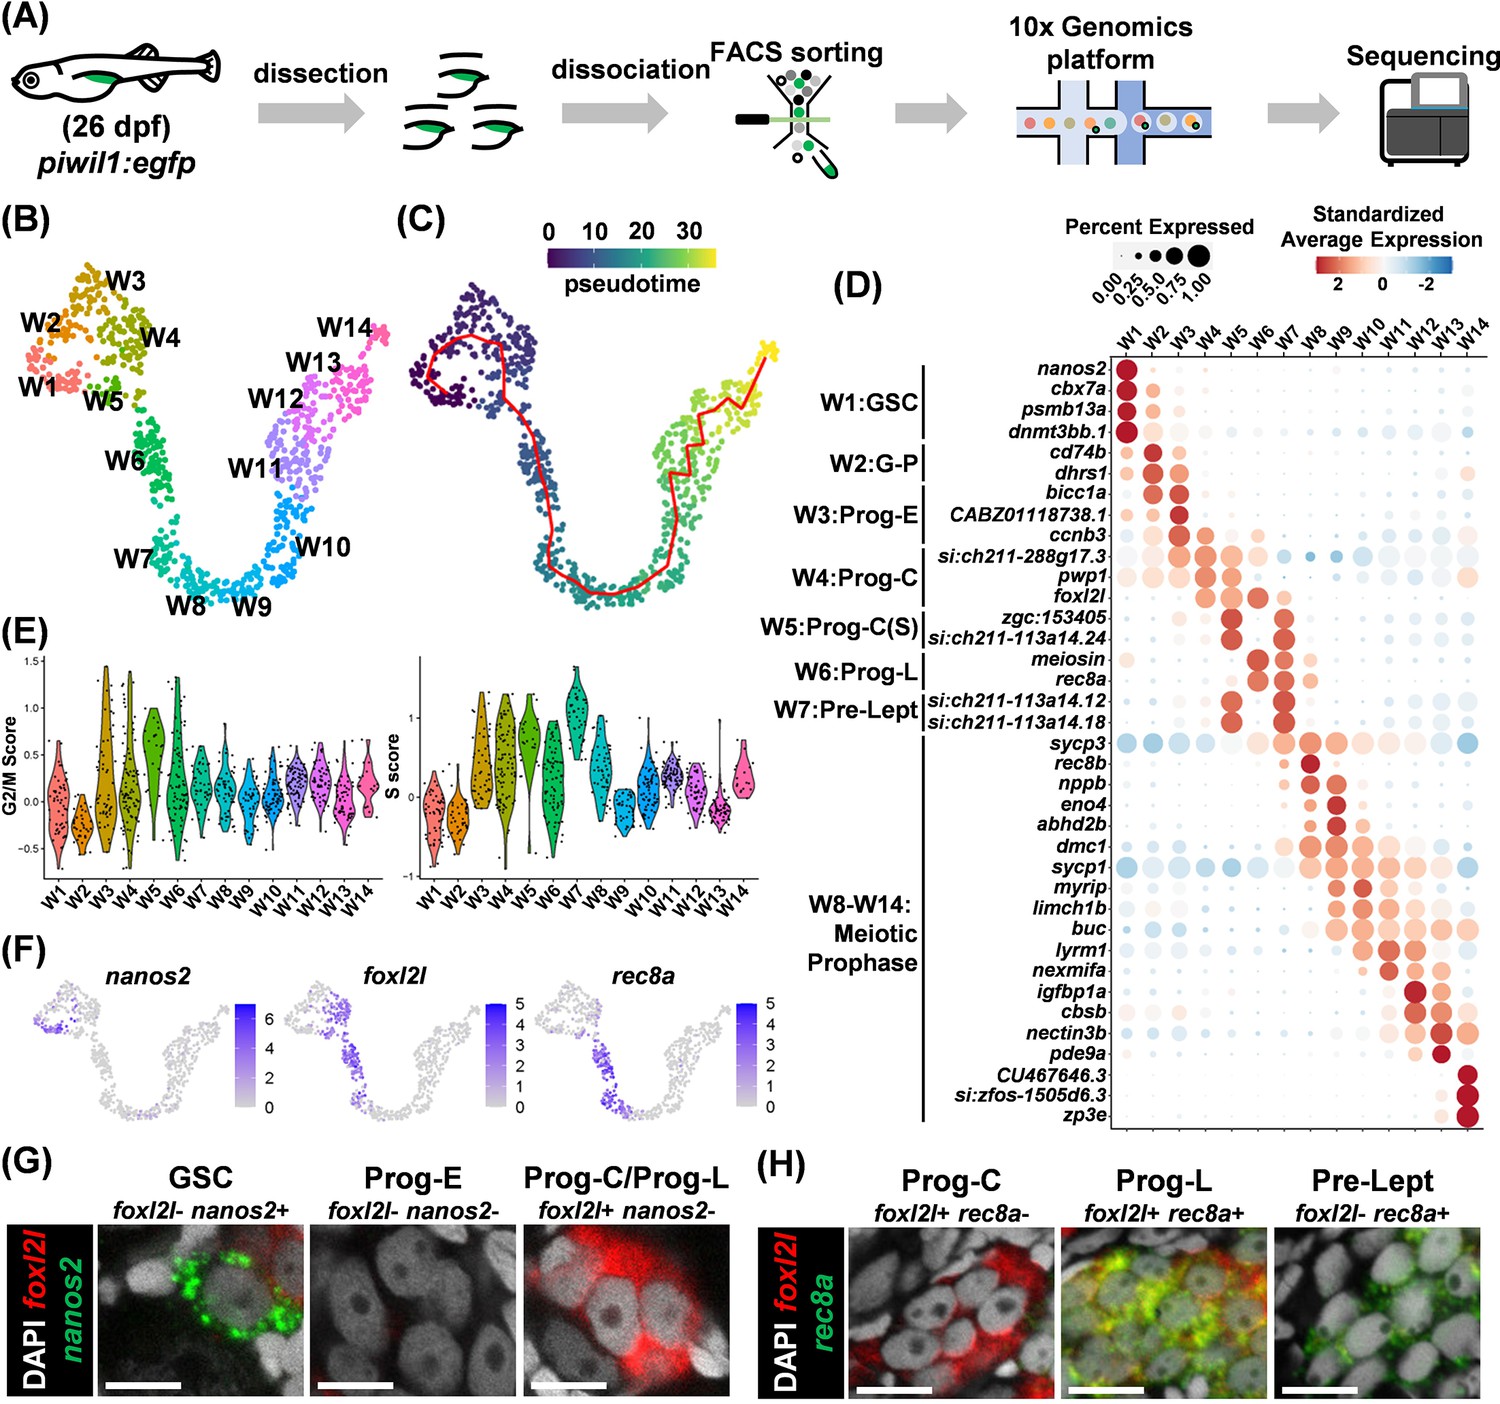
Single-cell transcriptome landscape of zebrafish germ cell development.
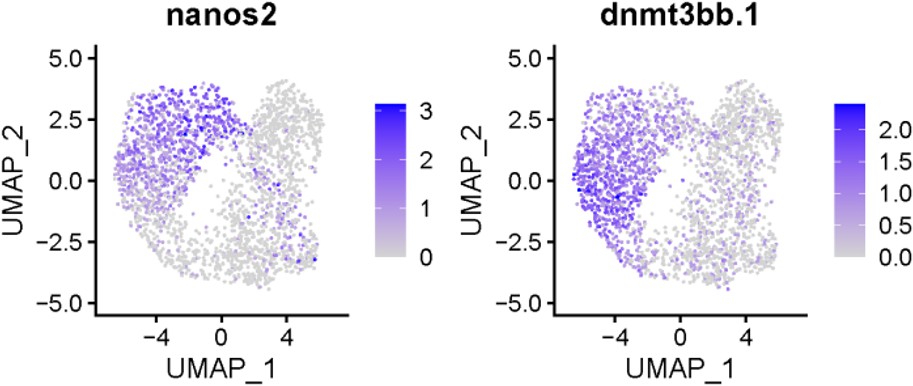
(A) Flowchart for sample collection and RNA sequencing. (B) Uniform Manifold Approximation and Projection (UMAP) visualization of wild-type (WT) germ cells in 14 clusters. (C) Pseudotime shown by the color bar and the trajectory shown by a red line. (D) Dot plot showing the expression of top marker genes for each cluster. (E) Violin plots displaying S and G2/M cell-cycle scores for each cluster. (F) UMAP visualization of marker gene expression for nanos2, foxl2l, and rec8a. (G,H) Identification of germ cell types by RNA fluorescent in situ hybridization (FISH) of marker genes, nanos2 and foxl2l in (G), rec8a and foxl2l in (H), in 26 days post fertilization (dpf) gonads. Scale bar: 10 µm.
Figure 1—figure supplement 1
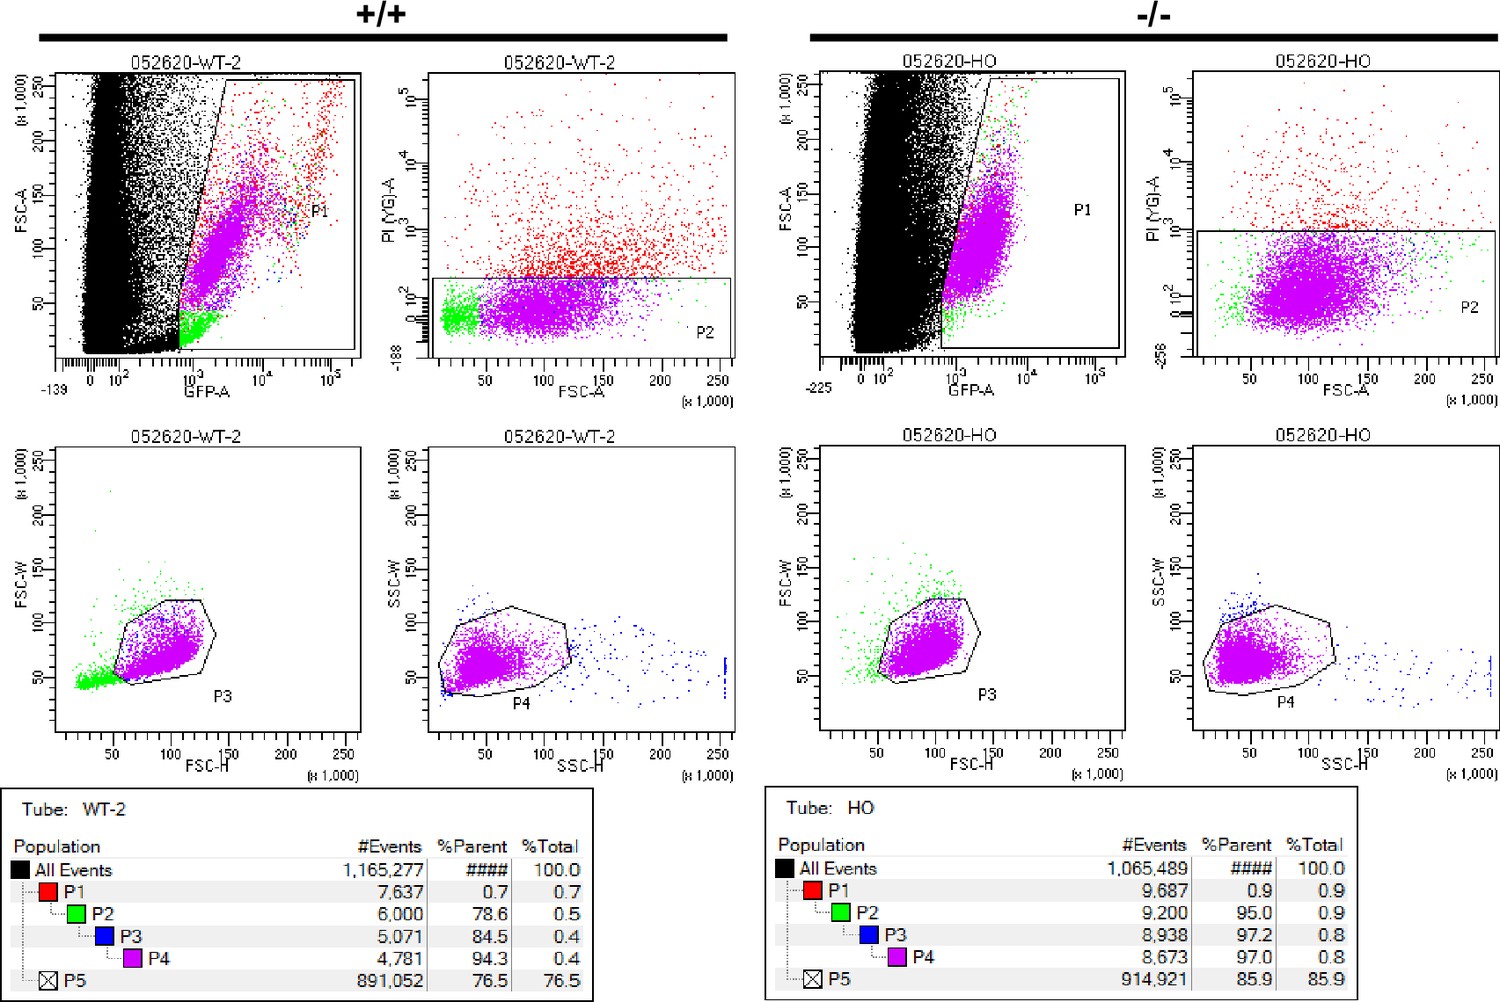
Germ cell sorted by fluorescence-activated cell sorting (FACS).
Sorting of fluorescent germ cells from 26 days post fertilization (dpf) gonad by FACS. Cells within the rectangular or irregular box were selected. Pseudocolors indicate four different gating, P1 to P4. After gating, germ cells from wild-type (WT) (+/+) or foxl2l10i/10i (-/-) with piwil1:egfp transgenic background were collected.
Figure 1—figure supplement 2
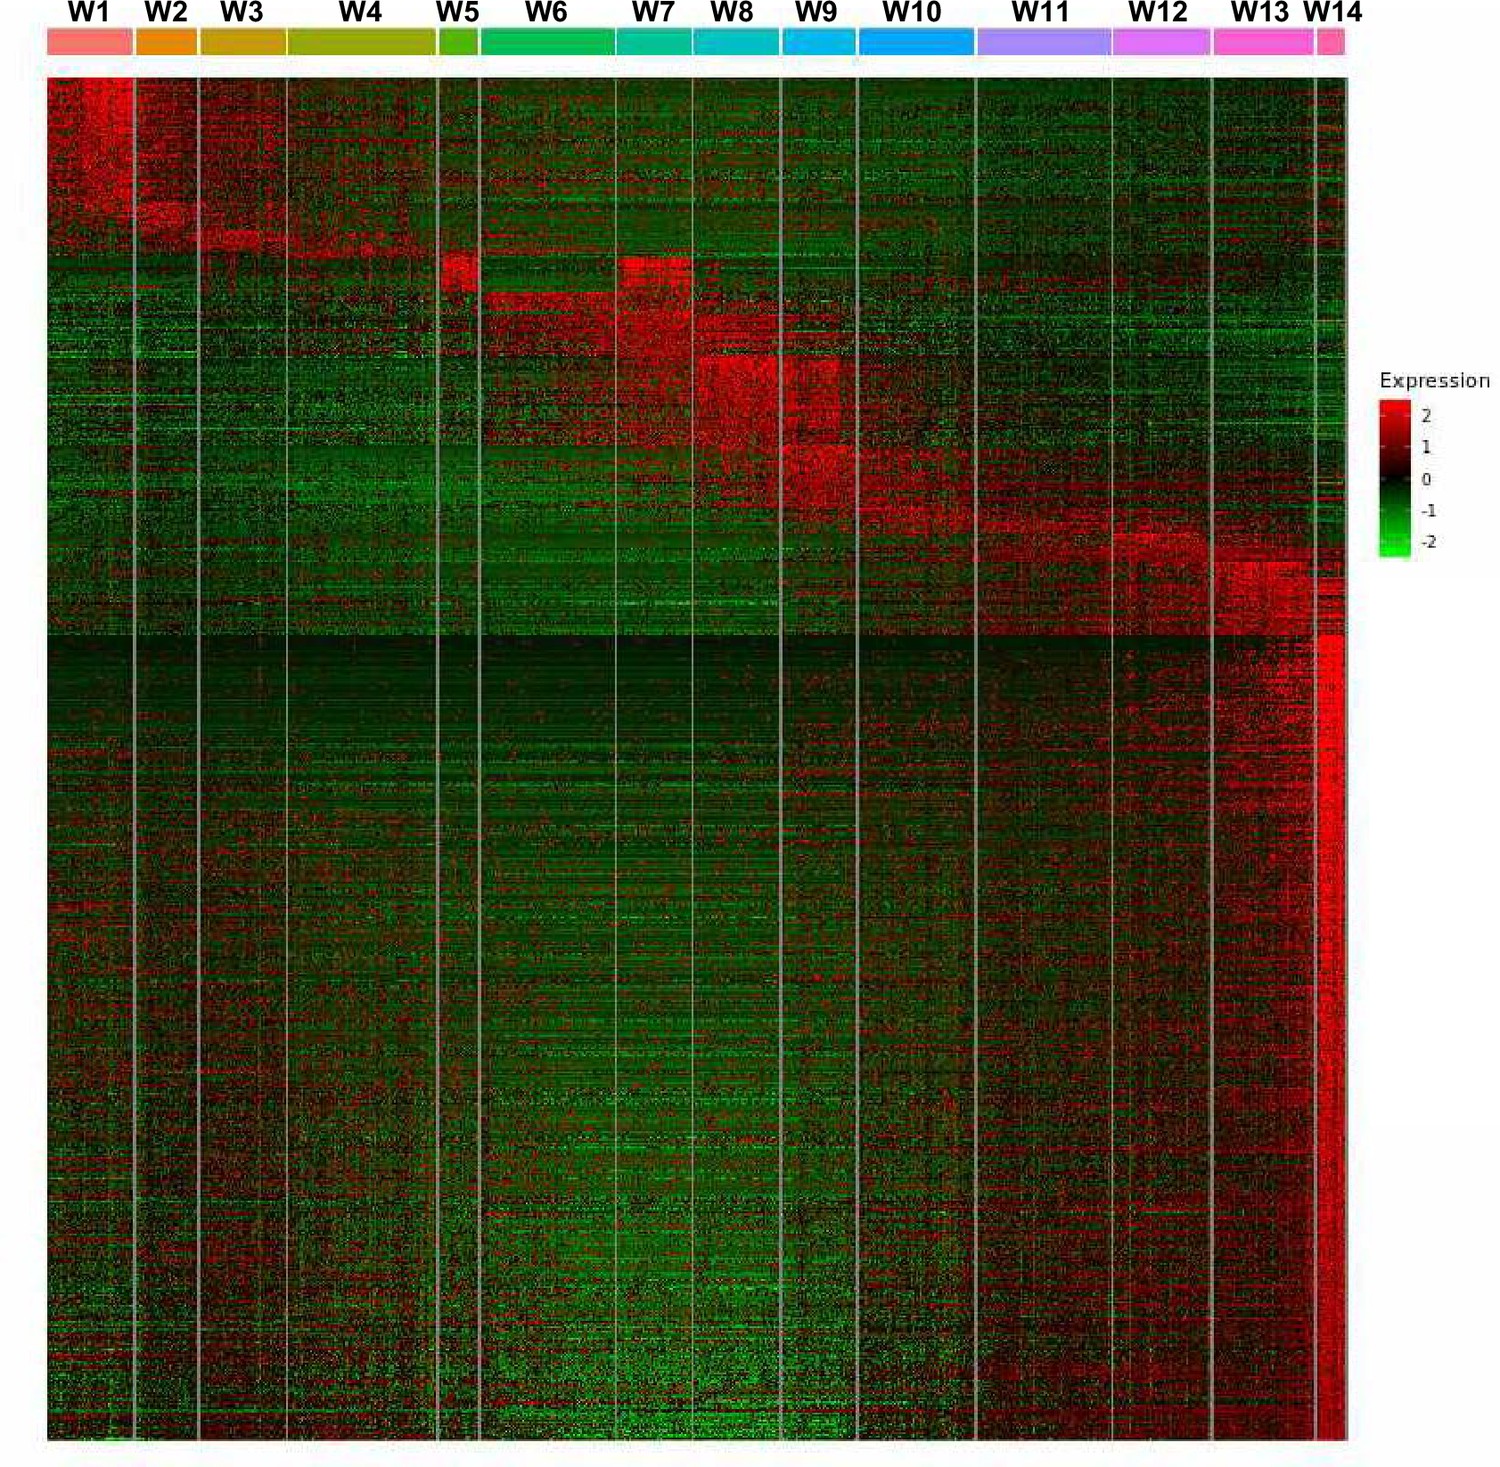
Analysis of wild-type (WT) clusters.
Expression of marker genes (Y-axis) in each WT cluster (X-axis) in a heatmap. Genes that reach the criteria (fraction ≥0.8, specificity ≥0.2, q-value ≤0.01) are defined as marker genes. Expression value is visualized with a range between –2 and 2.
Figure 1—figure supplement 3
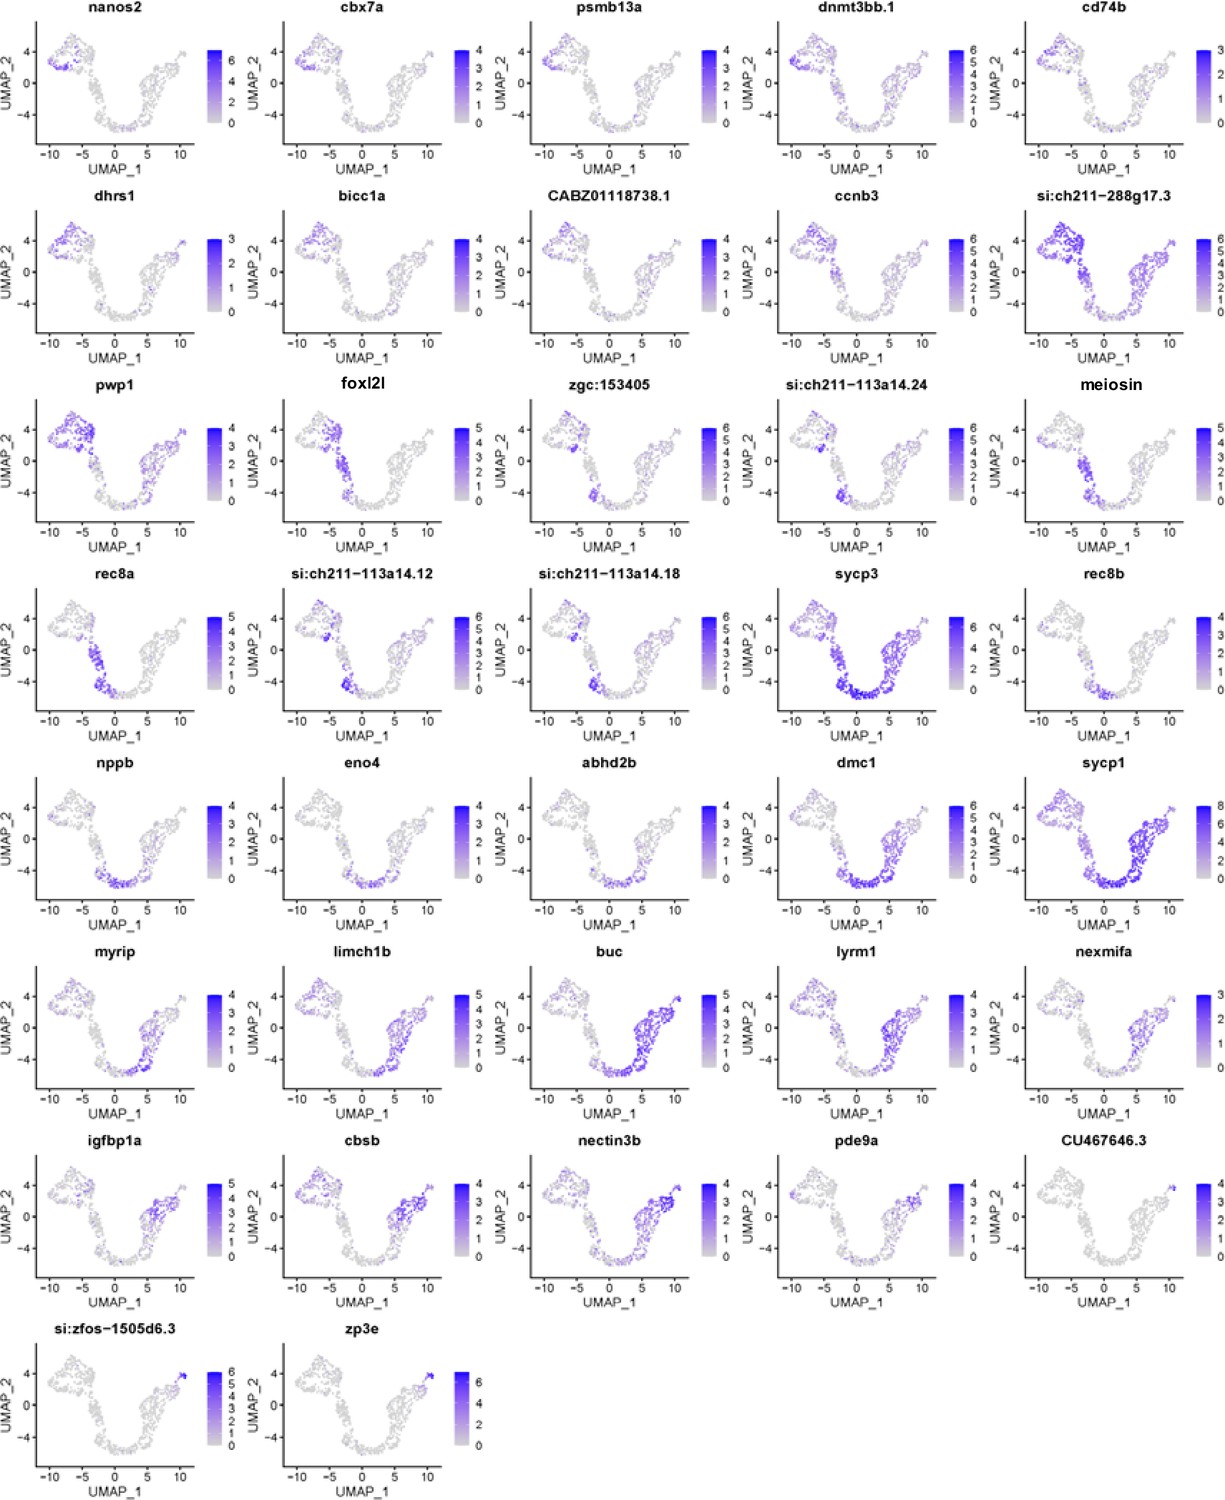
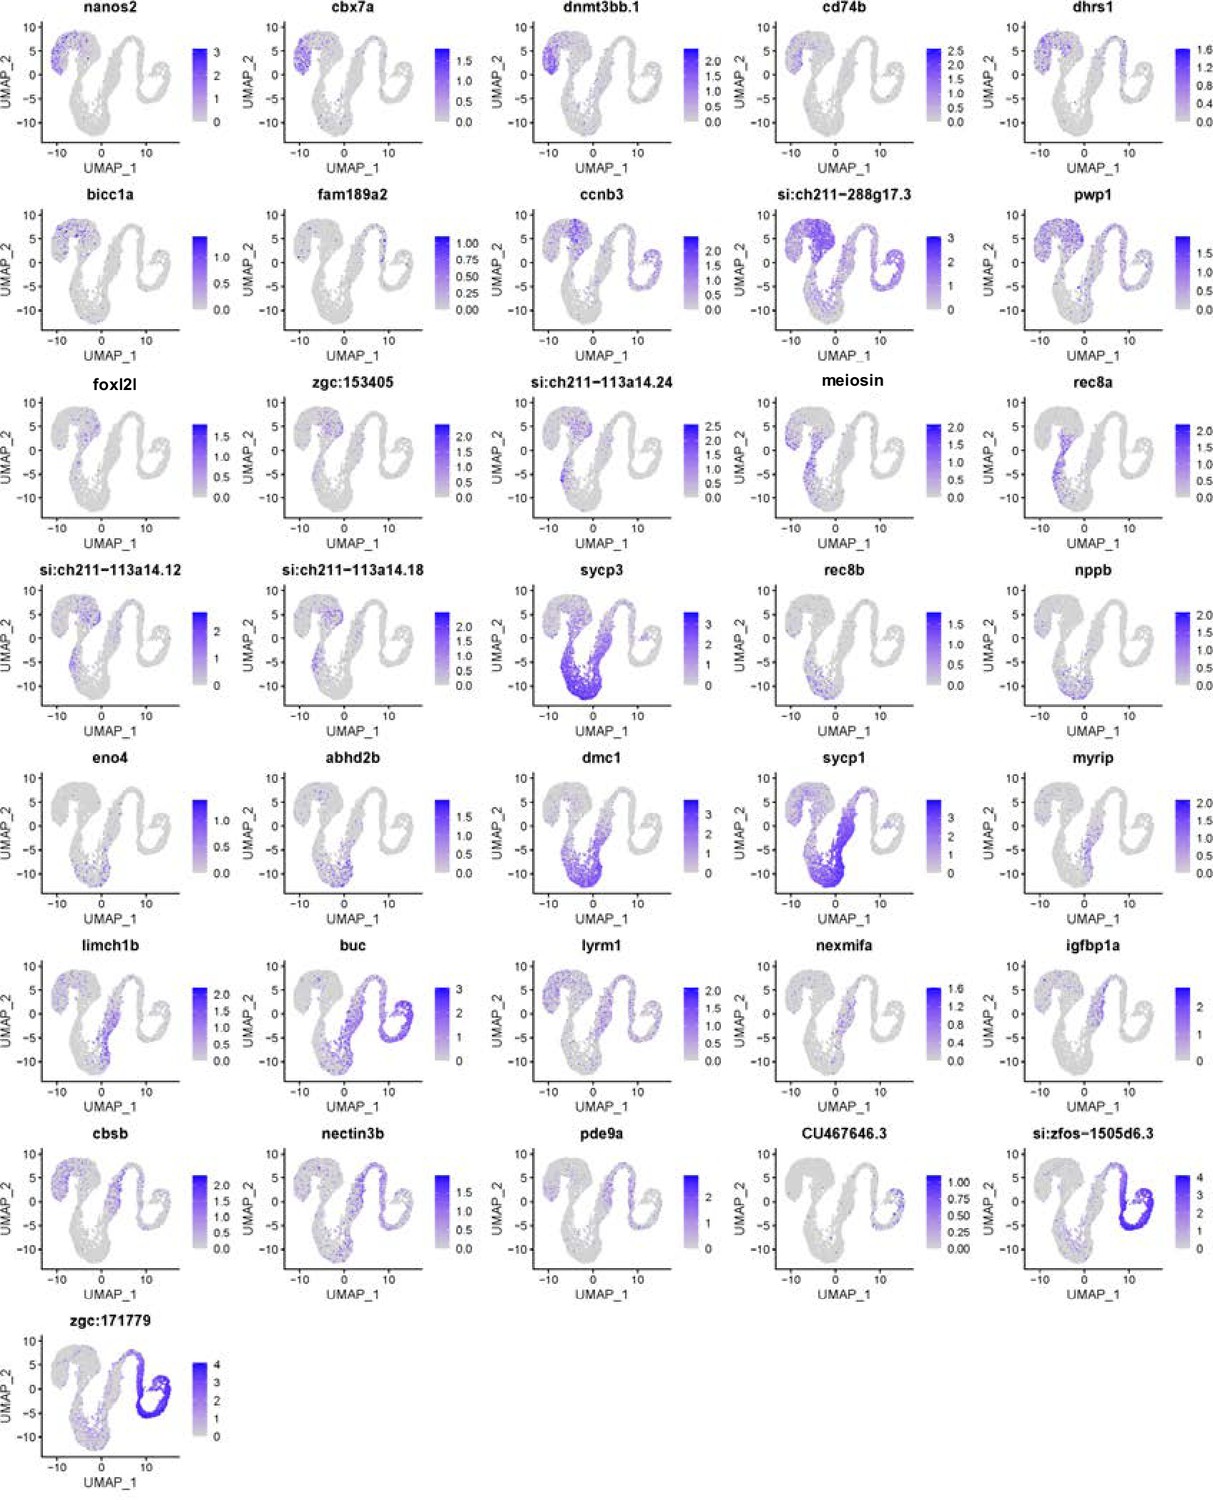
Expression profiles of top and known marker genes in wild-type (WT) germ cells at 26 days post fertilization (dpf).
Expression of representative WT marker genes shown by Uniform Manifold Approximation and Projection (UMAP). The scales of expression levels are shown at the right of each UMAP.
Figure 1—figure supplement 4
Expression profiles of top and known wild-type (WT) markers extracted from the database.
Expression of representative WT marker genes in 40 days post fertilization (dpf) germ cells obtained from Liu et al., 2022, as shown by Uniform Manifold Approximation and Projection (UMAP). The representative WT markers were selected from our 26 dpf single-cell RNA sequencing (scRNAseq) analysis. The scales of expression levels are shown at the right of each UMAP.
Figure 2 with 1 supplement
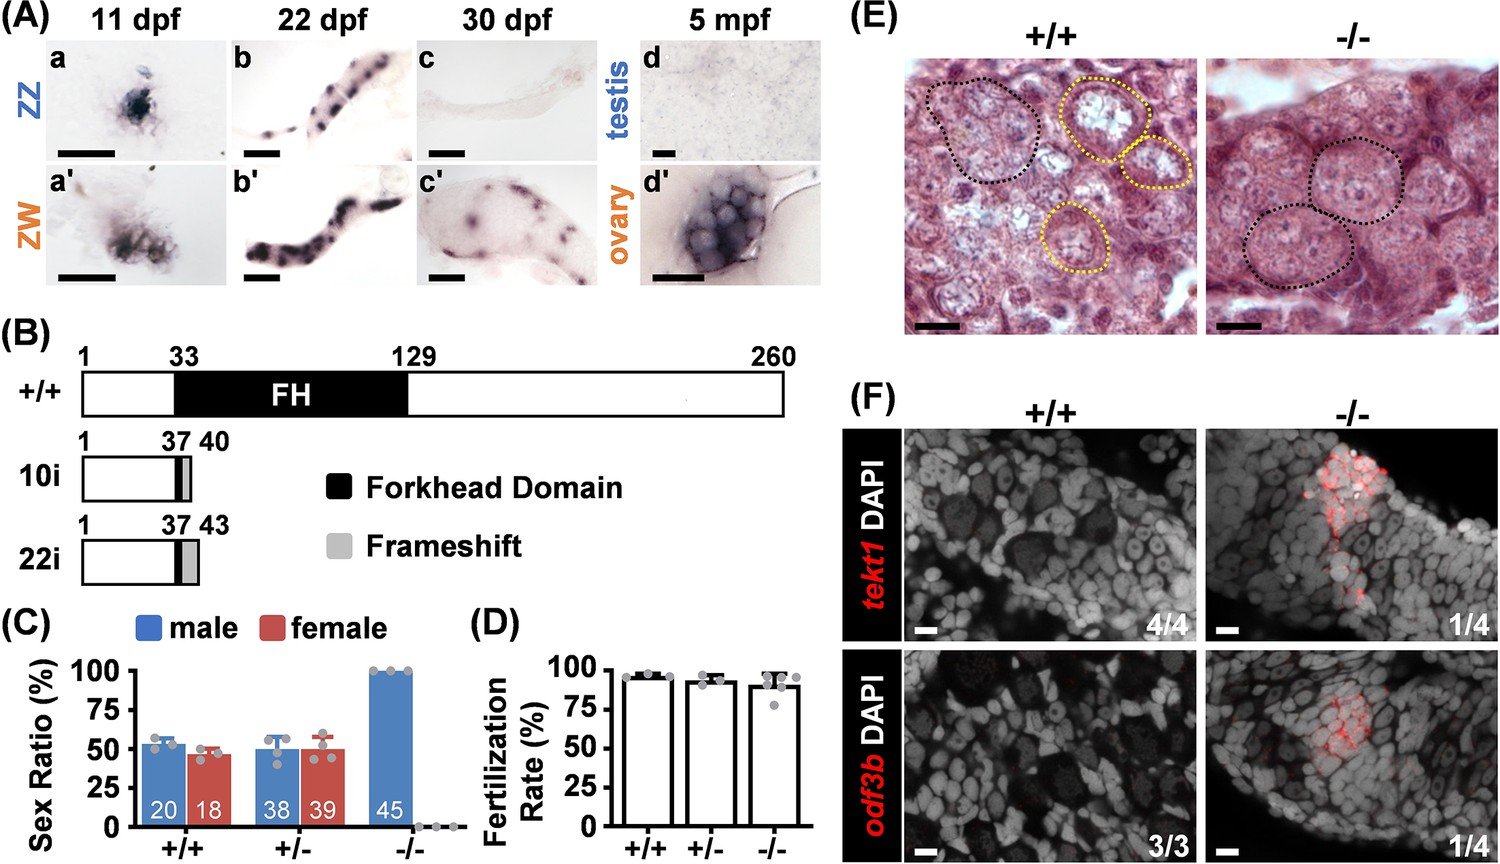
Foxl2l is required for female differentiation.
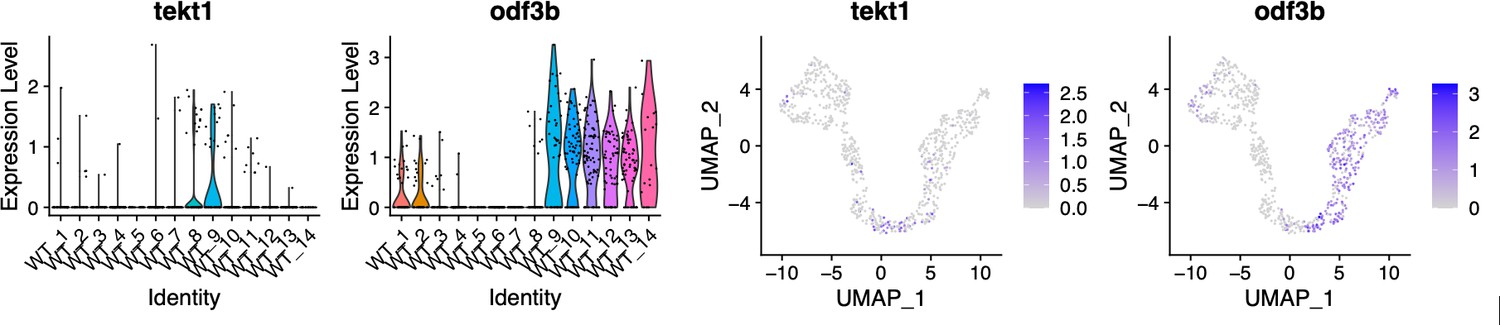
(A) In situ hybridization detects foxl2l transcripts in indifferent gonads at 11 days post fertilization (dpf) (a, a’). Expression of foxl2l becomes female biased when female differentiation initiates at 22 dpf (b, b’), and becomes female-specific at the initiation of male differentiation at 30 dpf (c, c’). In adults, foxl2l is expressed in cystic cells in ovary but not in testis (d, d’). mpf: months post fertilization. All samples were collected from Nadia strain. Scale bars are 50 µm in (a, a’), 100 µm in (b, b’, c, c’), 20 µm in (d, d’). (B) Domain structure of wild-type (WT) and the predicted mutant of Foxl2l with 10 base pairs insertion (10i) or 22 base pairs insertion (22i) generated by CRISPR/Cas9 system. (C) Sex ratios of WT (+/+), foxl2l+/22i heterozygous (+/-), and foxl2l22i/22i homozygous (-/-) mutants at 4 months of age reveal that foxl2l mutant fish are all males. The total numbers of fish in each genotype and gender are labeled in white. Dot: sex ratio of each batch. (D) All foxl2l10i/10i mutant males (-/-) are fertile. Dot: individual fish used in the test, n=3 in WT and heterozygous mutants, n=6 in homozygous mutants. (E) The foxl222i/22i homozygous (-/-) mutants lack meiotic oocytes at 20 dpf shown by histological staining. Black dashed circle: germ cell cysts with one to three nucleoli in each cell. Yellow dashed circle: meiotic oocyte. Scale bars represent 20 µm. (F) The foxl2l22i/22i mutants (-/-) express male markers (tekt1 or odf3b) detected by RNA fluorescence in situ hybridization (FISH) at 28 dpf. Scale bars are 10 µm.
Figure 2—figure supplement 1
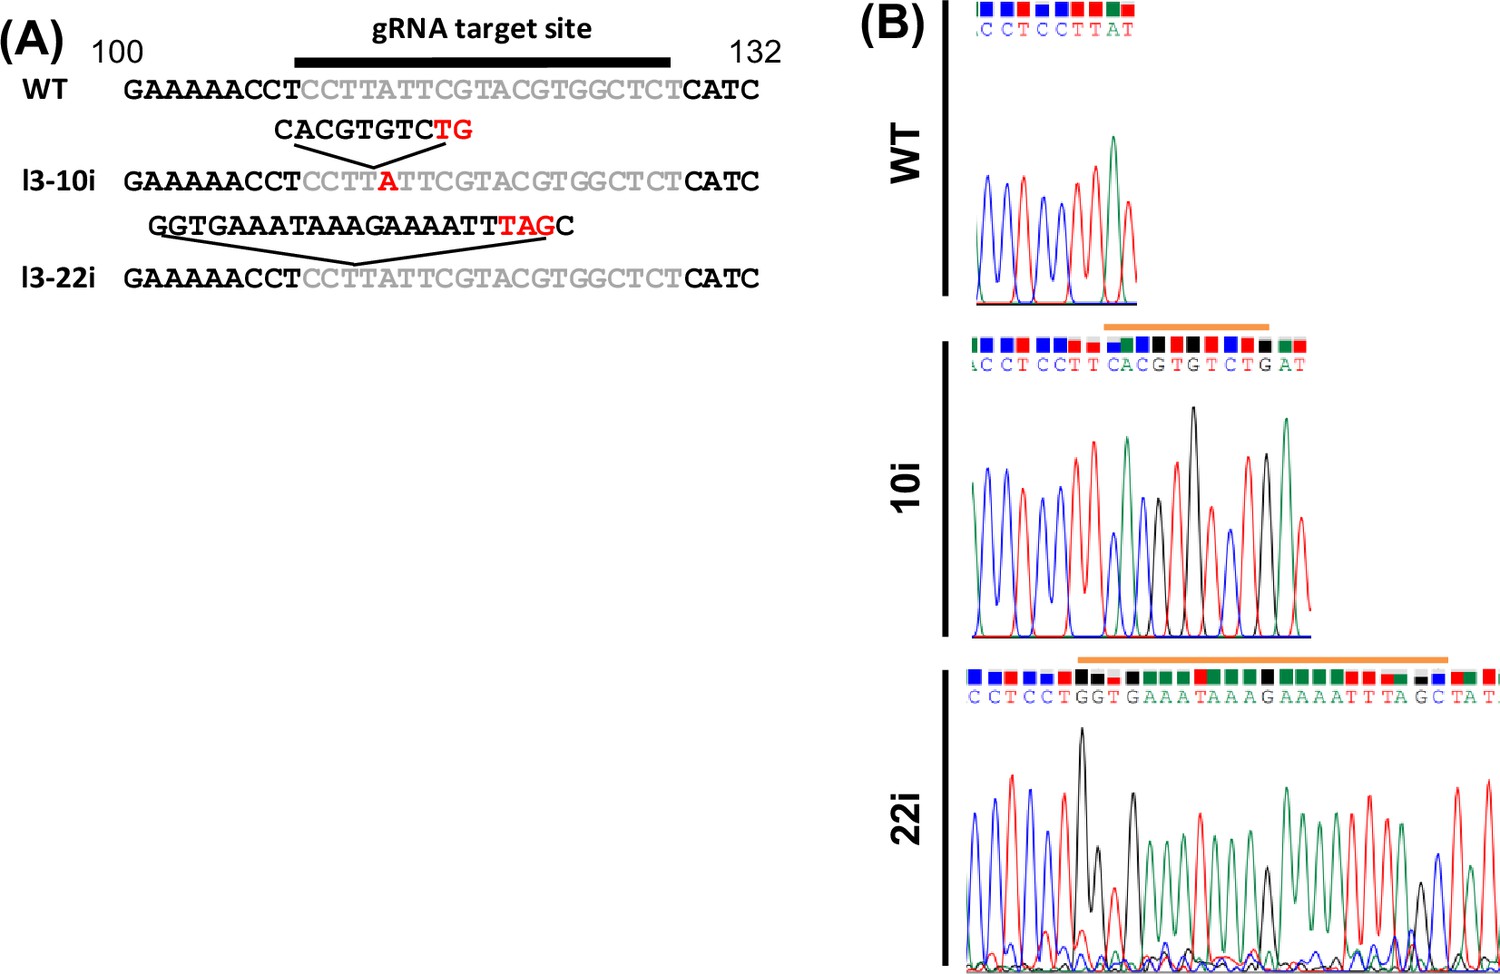
Generation and the phenotype analysis of foxl2l mutant.
(A) The foxl2l sequence of wild-type (WT) and two foxl2l mutant lines, 10 base pairs insertion (10i) and 22 base pairs insertion (22i). Gray letters represent gRNA targeting region. Red letters represent stop codons. (B) Sequencing results of WT and two foxl2l mutant lines, 10i and 22i. The inserted sequences are marked with horizontal orange lines.
Figure 3 with 4 supplements
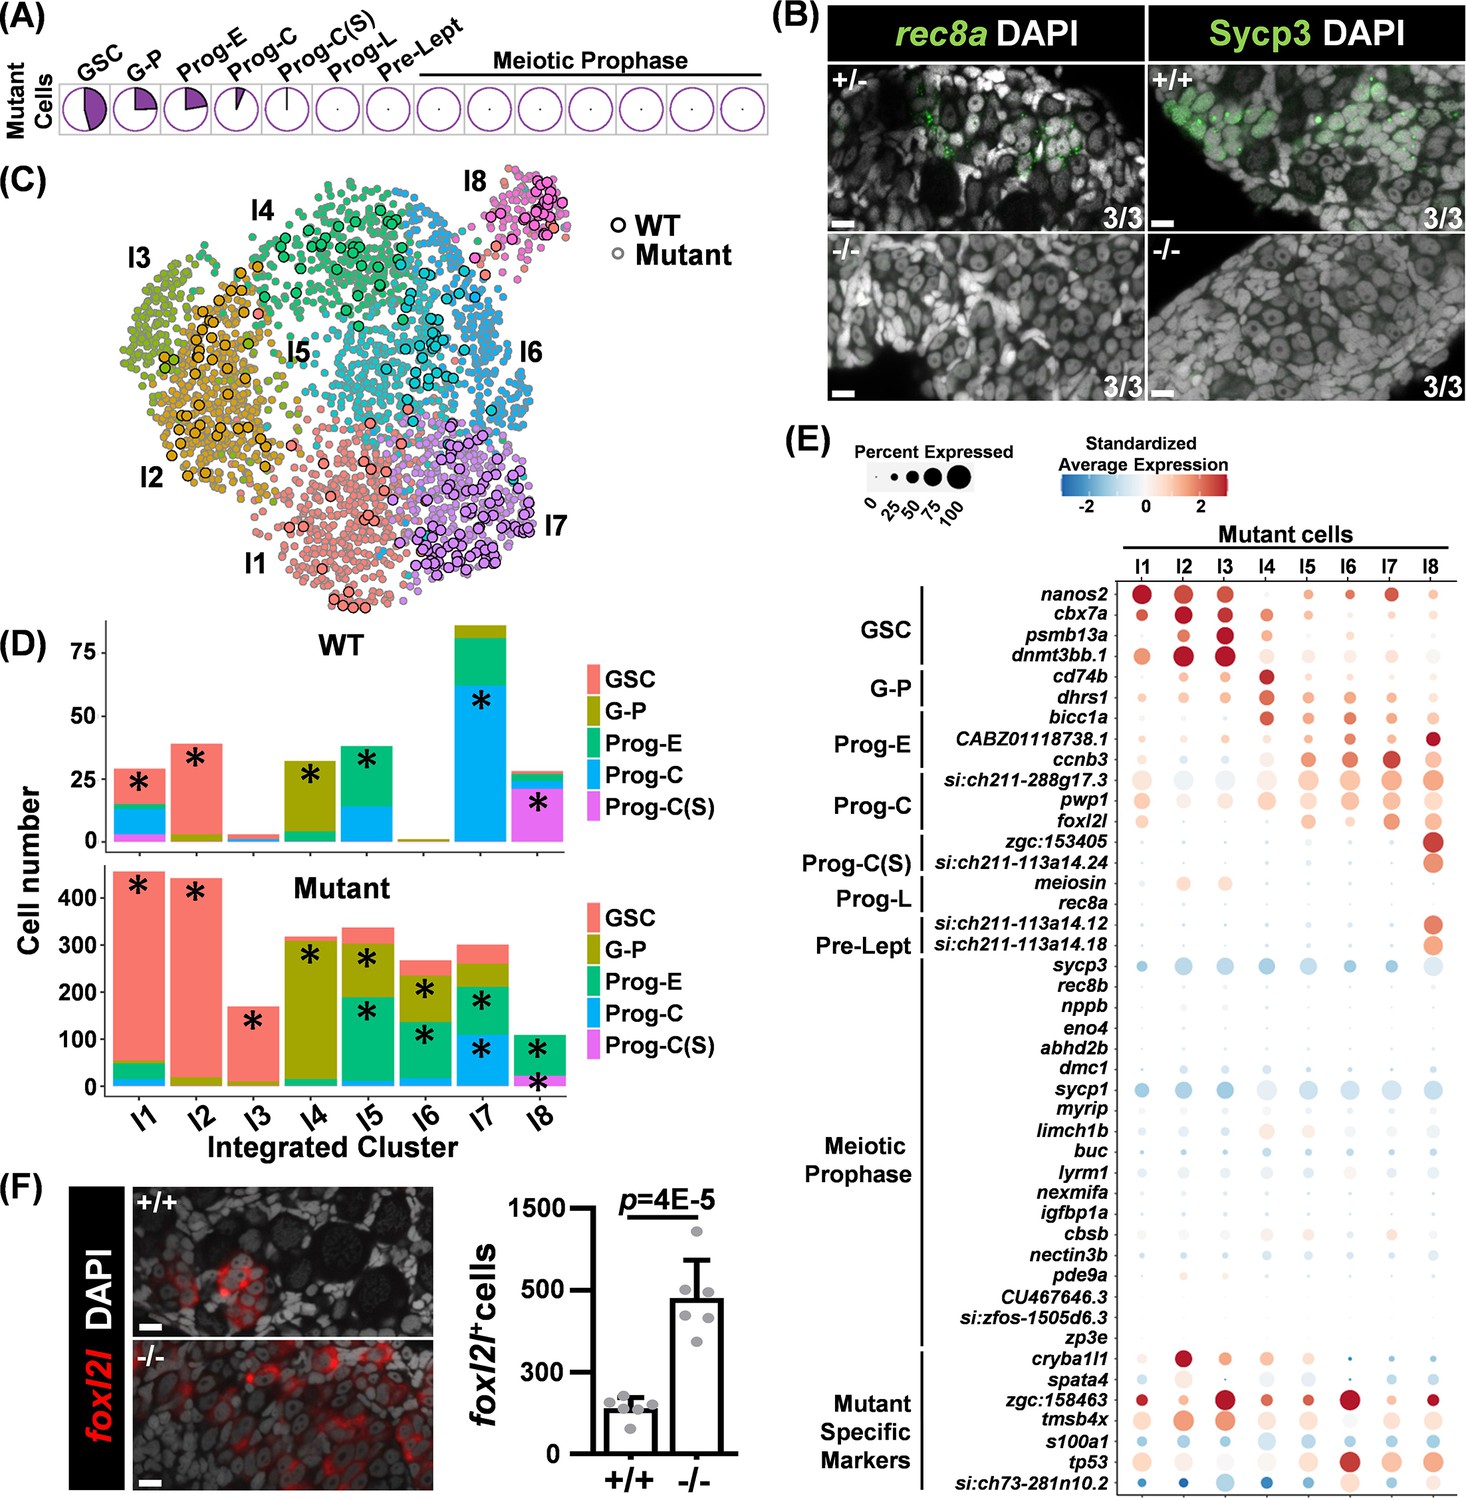
Germ cells in foxl2l mutants are arrested at the stage of committed progenitor with aberrant gene expression.
(A) Pie charts showing the proportion of mutant cells classified into different developmental stages. (B) Absence of the Prog-L marker rec8a and meiotic marker Sycp3 in foxl2l mutant gonads. (Left) RNA fluorescence in situ hybridization (FISH) and (right) immunofluorescence staining of wild-type (WT) (+/+), foxl2l+/10i (+/-), and foxl2l10i/10i (-/-) gonads at 28 days post fertilization (dpf) (left) and 21 dpf (right), respectively. The numbers at the bottom right corner indicate that all three gonads in each genotype have the same staining pattern. Scale bars represent 10 µm. (C) Uniform Manifold Approximation and Projection (UMAP) visualization of integrated cells grouped into eight clusters. Circles with black outline: WT cell. Circles with gray outline: mutant cell. (D) Bar graphs showing the proportions of developmental stages for WT and mutant cells in each integrated group. Prominent stages with statistical significance were marked by asterisks (*). (E) Dot plot showing the expression of marker genes (Y-axis) in the mutant cells across integrated groups (X-axis). (F) foxl2l10i/10i (-/-) gonads contain an increased number of foxl2l+ cells at 26 dpf. Left: in situ hybridization of the gonads with foxl2l. Right: quantification of the staining data. One dot in the graph represents one gonad, n=6 in each genotype.
Figure 3—figure supplement 1
Transcriptome analysis of mutant germ cells.
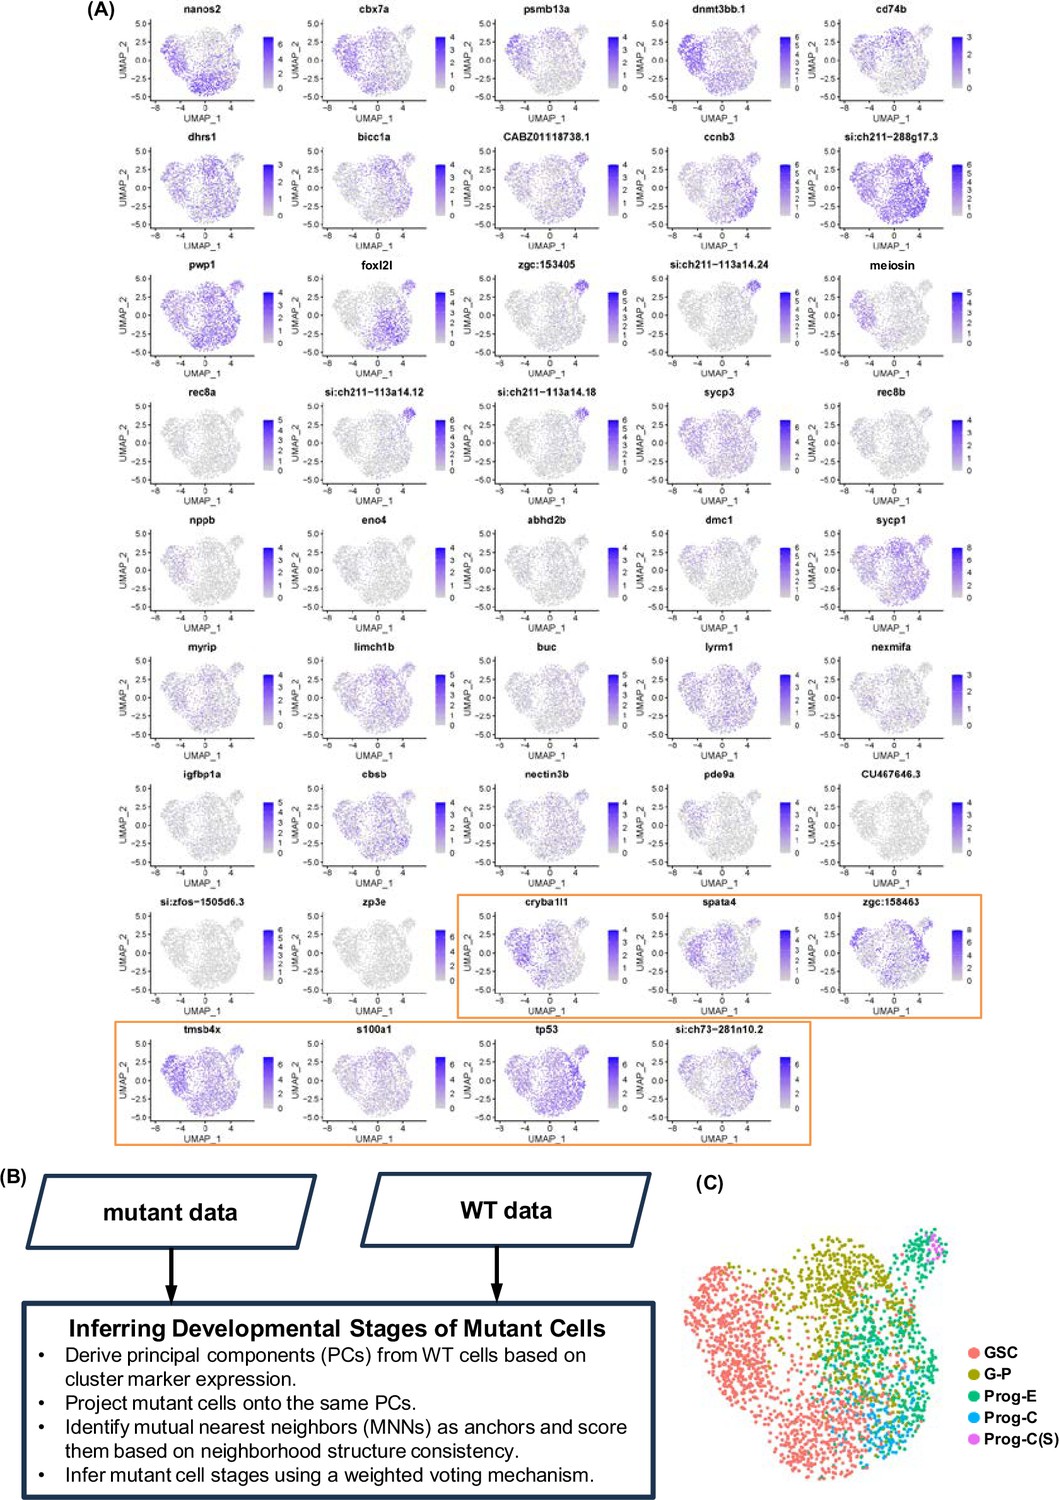
(A) Expression of 27 wild-type (WT) top marker genes and mutant top marker genes (in orange box) in mutant cells shown by Uniform Manifold Approximation and Projection (UMAP). The scales of the scores are shown at the right. (B) Flowchart of the inferring developmental stages of mutant cells. (C) Mutant cells shown in UMAP. Color of each mutant cell represents annotated developmental stage.
Figure 3—figure supplement 2
Transcriptome analysis of integrated groups.
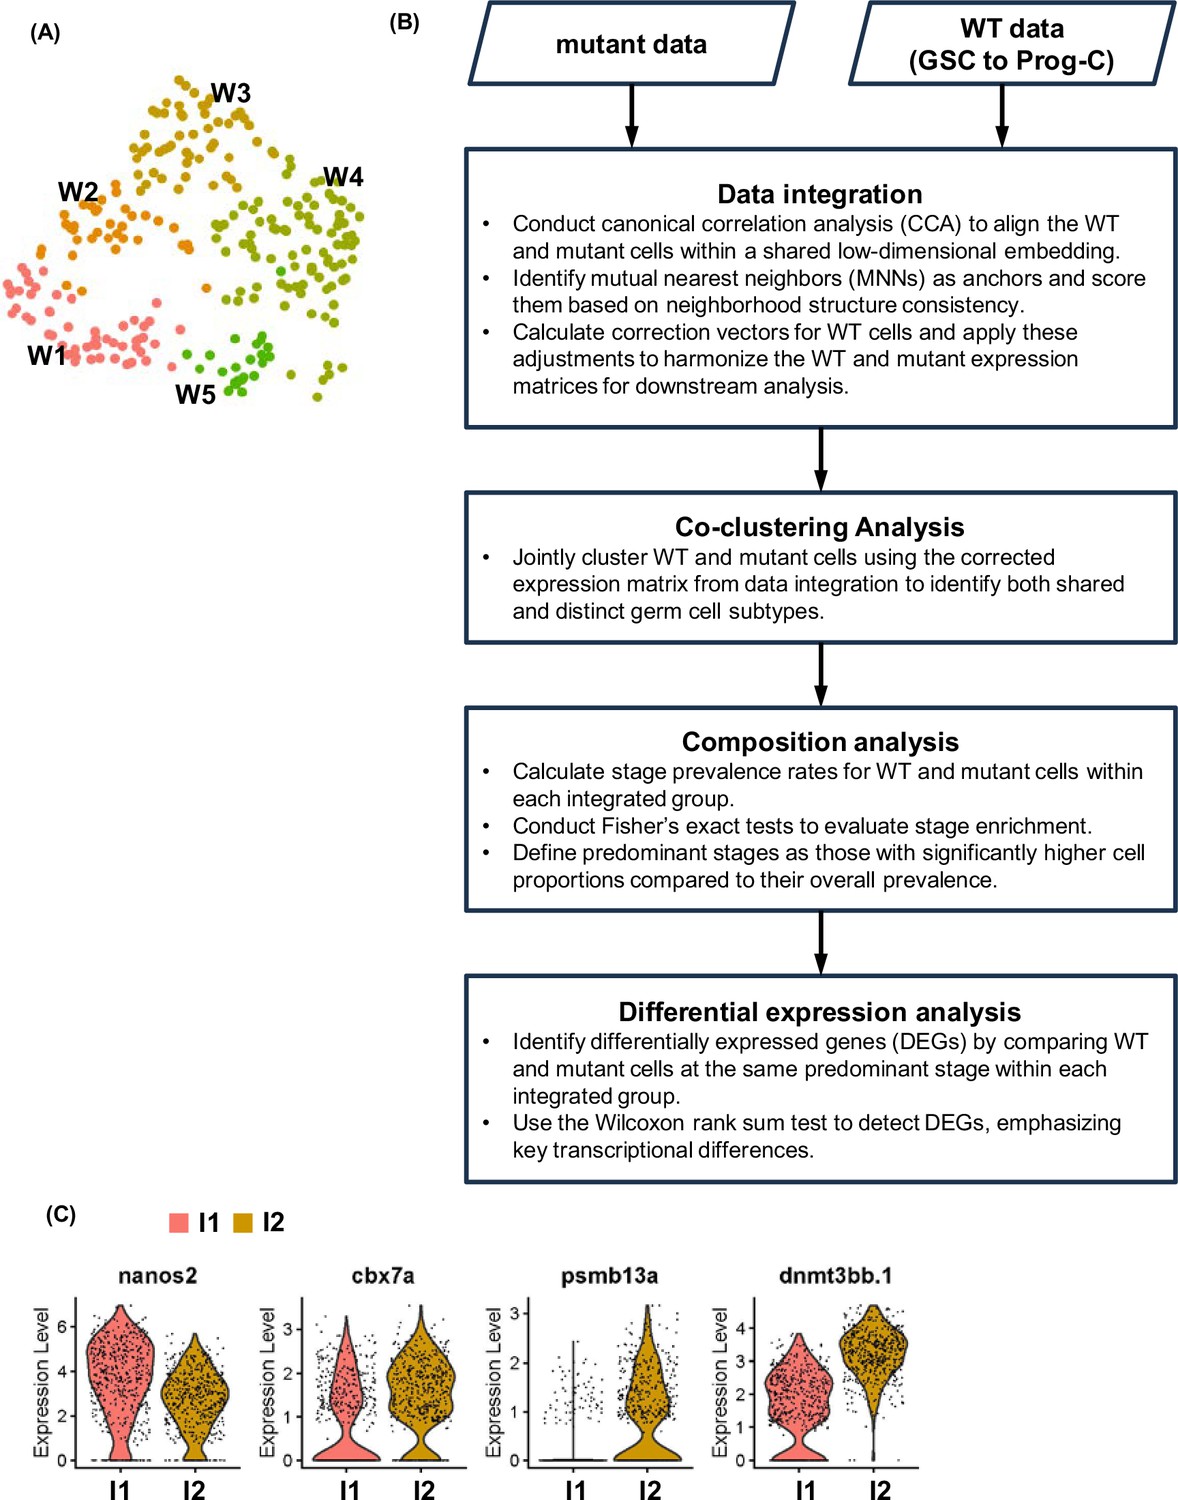
(A) Wild-type (WT) germ cells in clusters W1 to W5 visualized by Uniform Manifold Approximation and Projection (UMAP). (B) The flowchart of the co-clustering analysis. (C) Split-violin plots showing the distribution of cells expressing four top germline stem cell (GSC) markers in integrated groups I1 and I2.
Figure 3—figure supplement 3
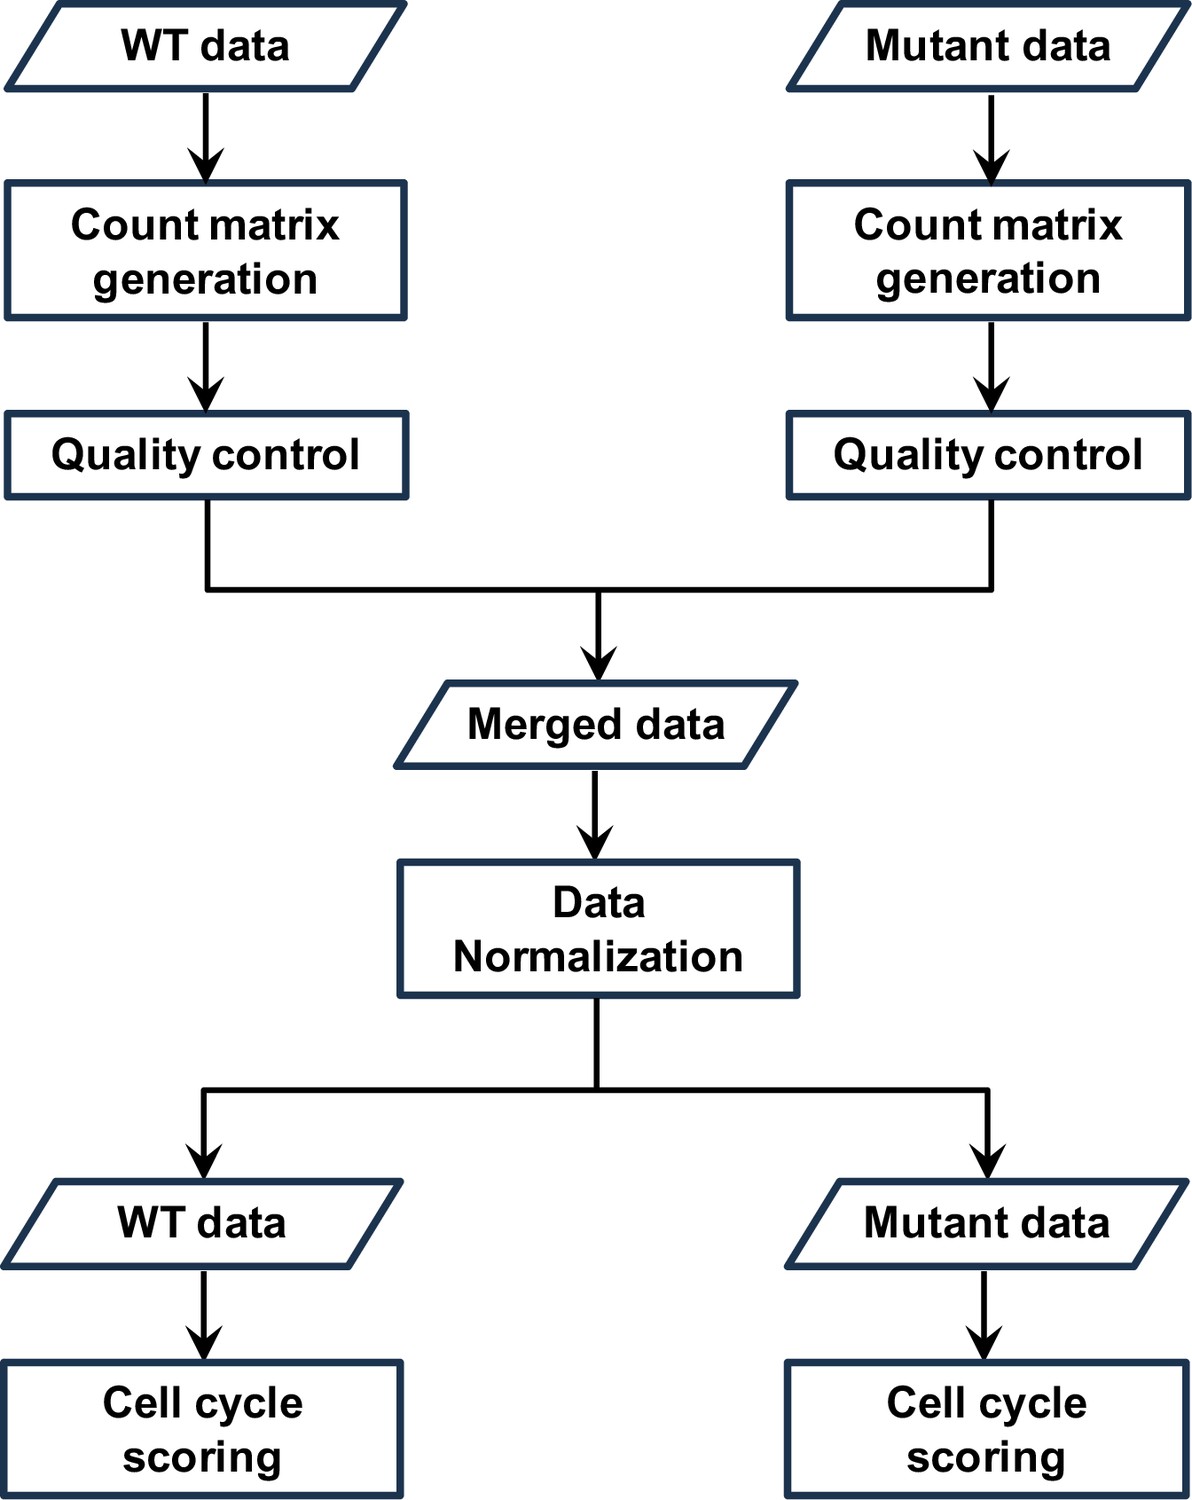
The flowchart of data processing and cell-cycle scoring for wild-type (WT) and mutant single-cell RNA sequencing (scRNAseq) transcriptome.
Figure 3—figure supplement 4
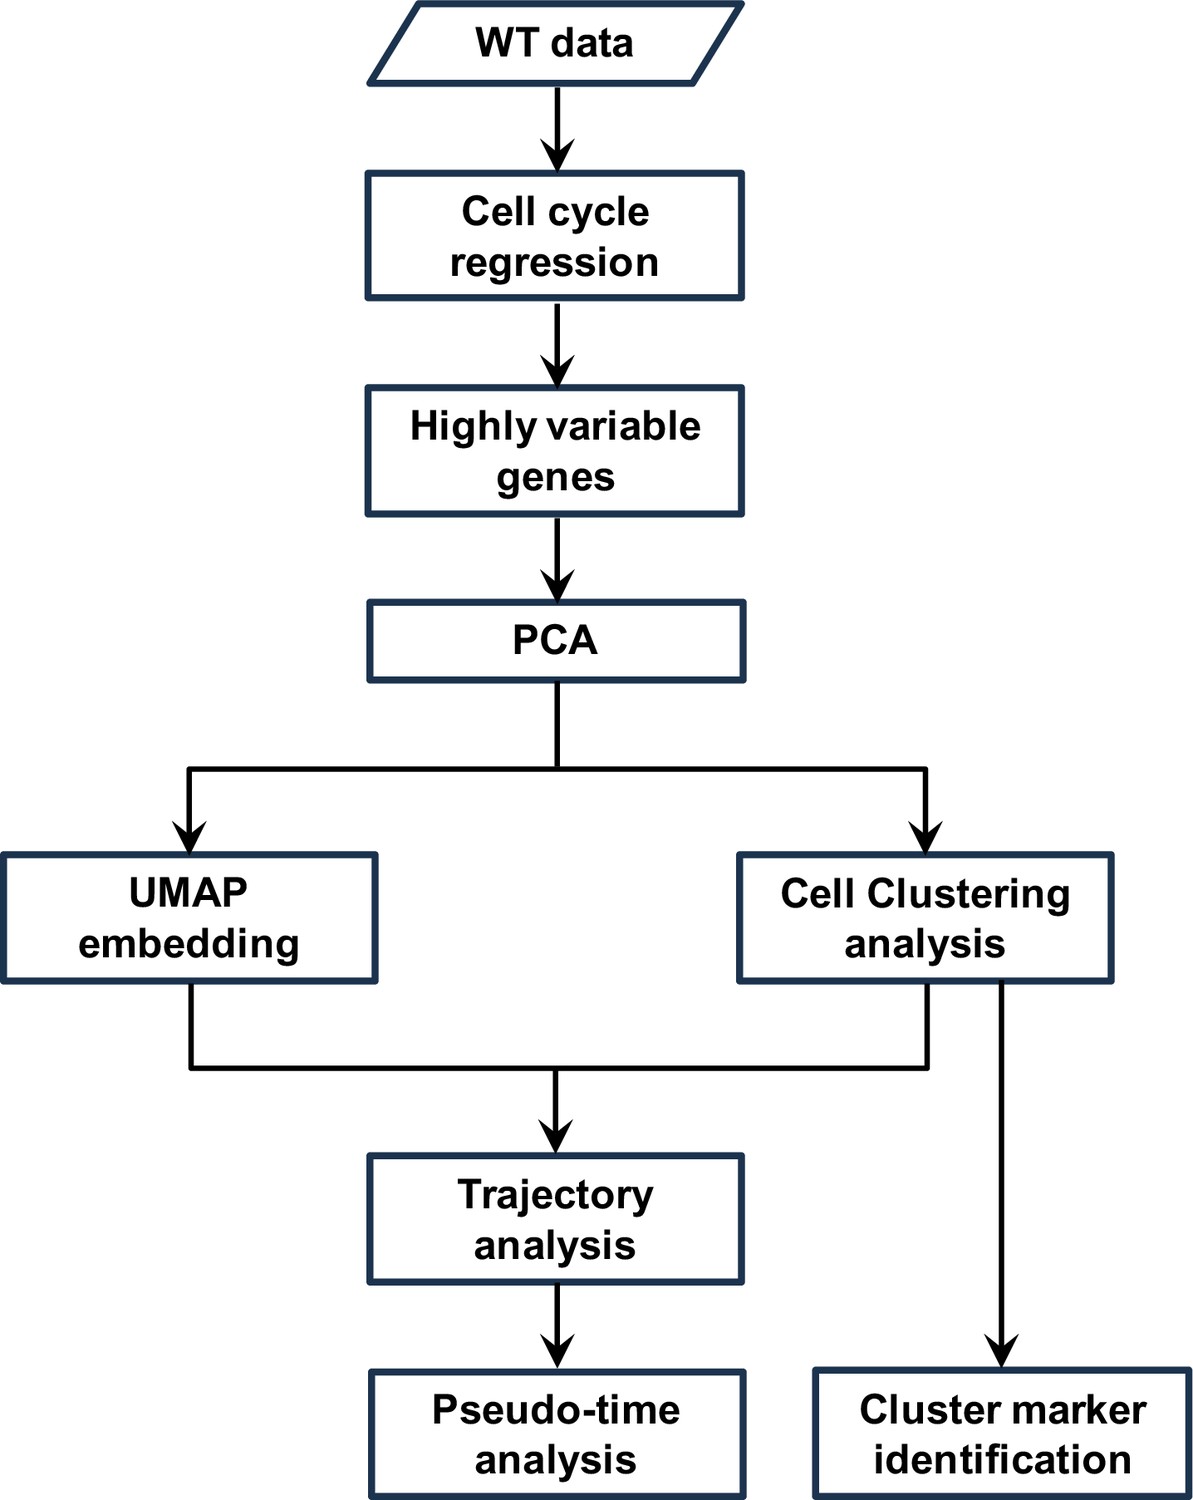
The flowchart of cell clustering analysis for wild-type (WT) cells.
Figure 4 with 1 supplement
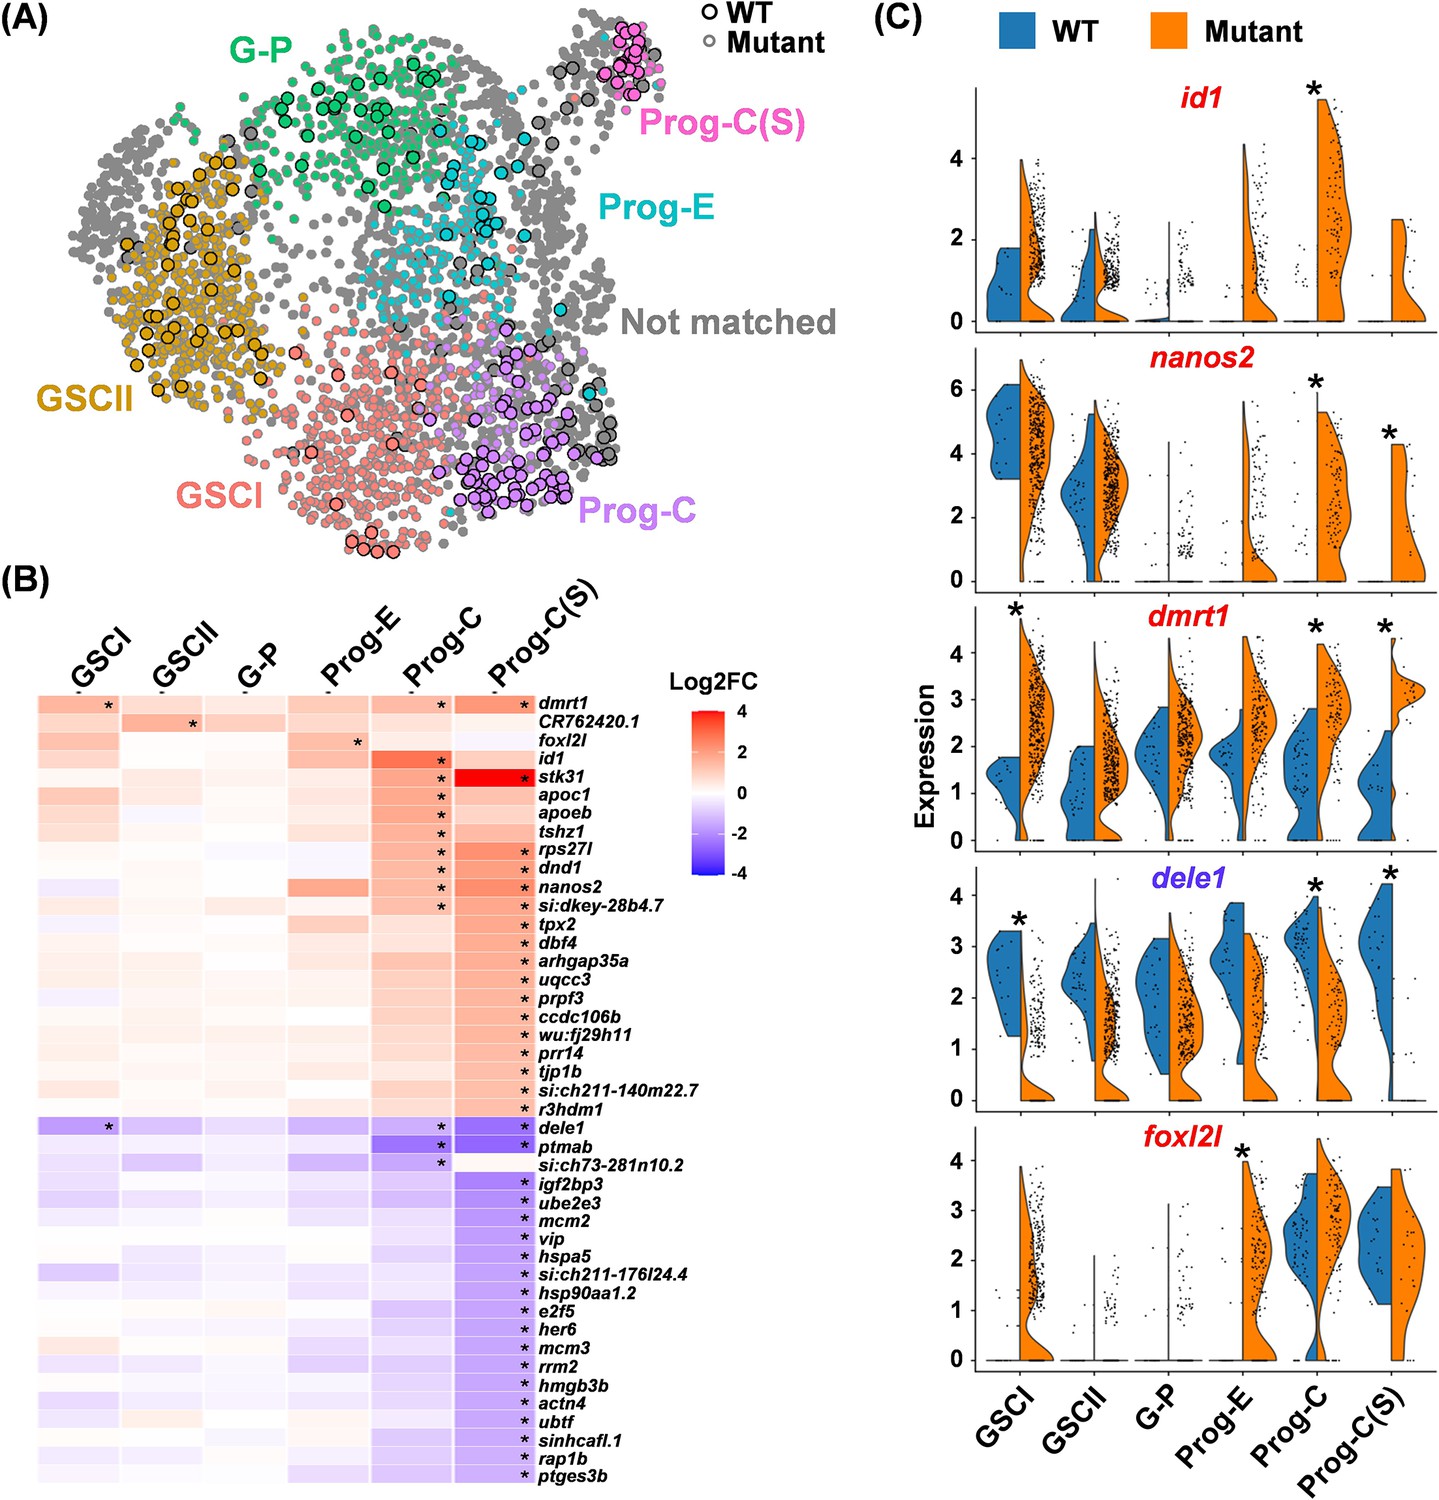
Identification of differentially expressed genes (DEGs) in wild-type (WT) and foxl2l mutants.
(A) Uniform Manifold Approximation and Projection (UMAP) visualization of integrated cells, with six matched stages of WT and mutant cells displayed in different colors. Unmatched cells are labeled in gray. Circles with a black outline: WT cells. Circles with gray outline: mutant cells. (B) Heatmap showing the fold change (FC) between the mutant versus WT (mutant/WT) for all DEGs at each stage. Developmental stages are displayed on the X-axis, and gene names are displayed on the Y-axis. (C) Split-violin plots showing the distribution of cells expressing top DEGs at different development stages (X-axis) between WT and mutant. Asterisks in (B) and (C) indicate significant differences in gene expression between WT and mutants.
Figure 4—figure supplement 1
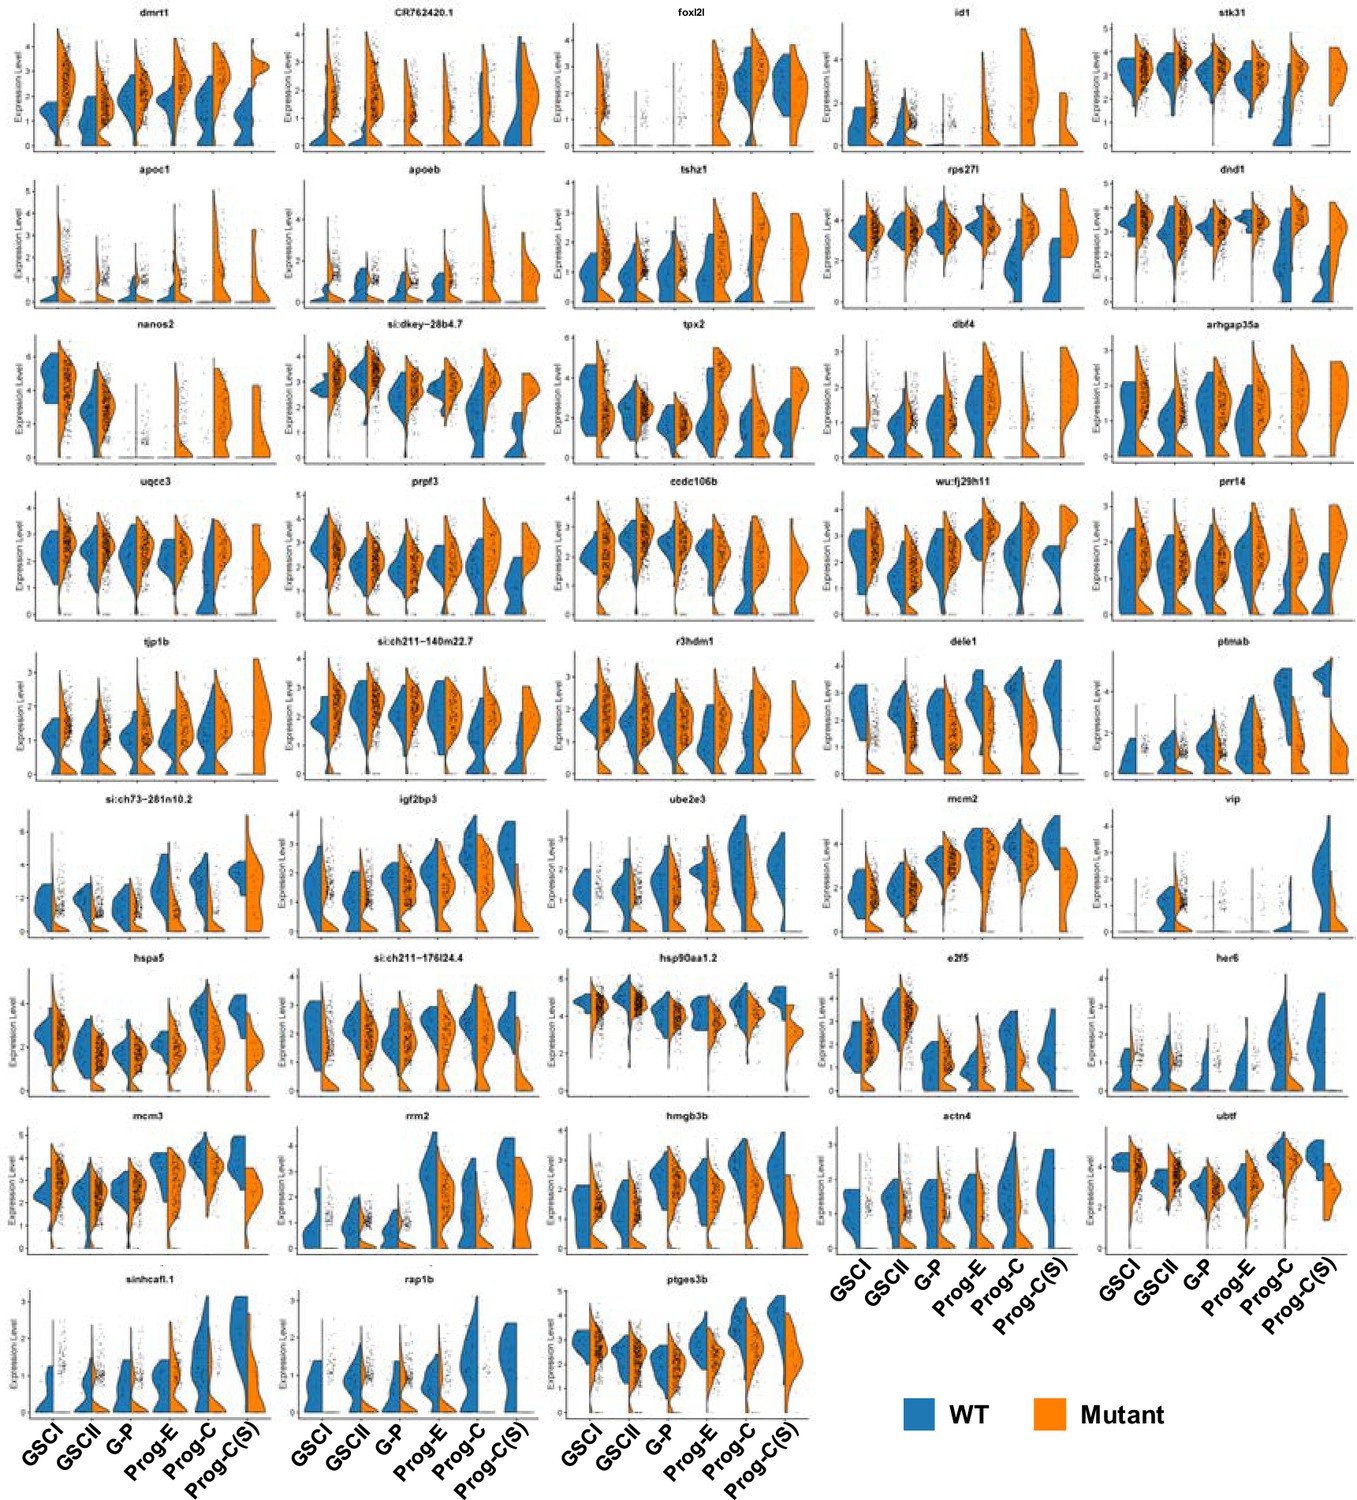
Expression of differentially expressed genes (DEGs) in wild-type (WT) and mutant germ cells.
Split-violin plots showing the distribution of WT and mutant cells expressing DEGs at different developmental stages (X-axis).
Figure 5 with 1 supplement
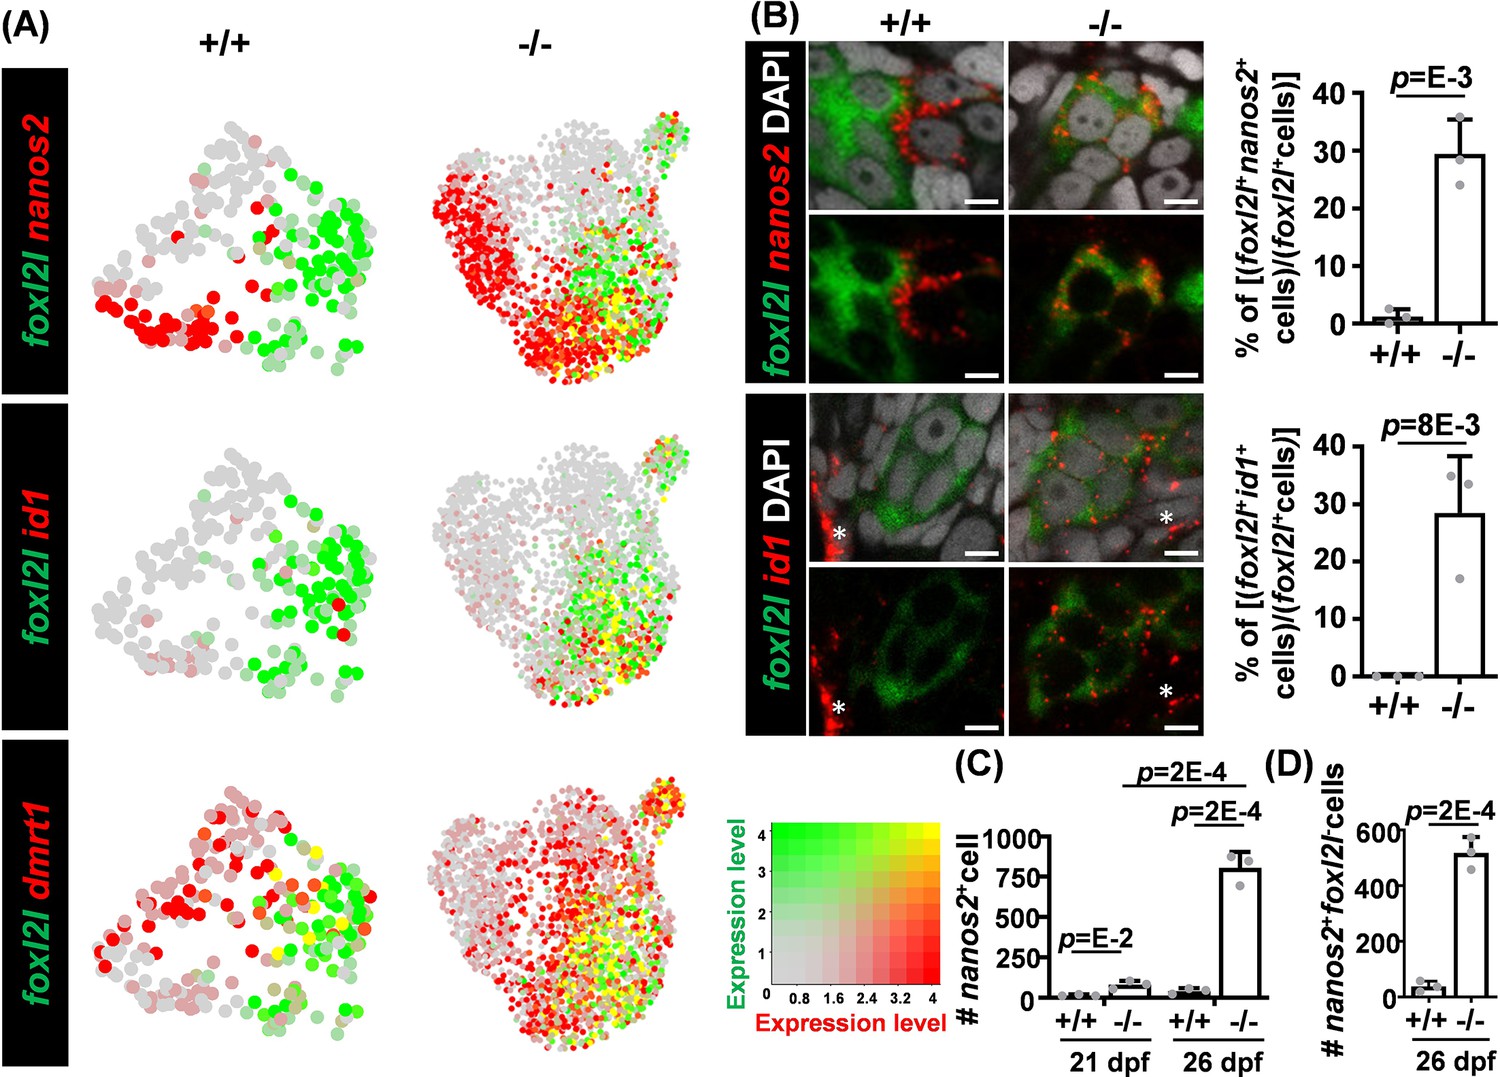
Aberrant co-expression of foxl2l with dmrt1, id1, and nanos2.
(A) Uniform Manifold Approximation and Projection (UMAP) visualization of dmrt1+, nanos2+, or id1+ cells and foxl2l+ cells. Left: wild-type (WT) cells in clusters W1 to W5 (+/+). Right: foxl2l mutant (-/-) cells. Yellow dots indicate cells co-expressing both genes. (B) Increased proportions of foxl2l mutant cells co-expressing foxl2l with nanos2 or id1. (Left) Double RNA fluorescence in situ hybridization (FISH) detecting nanos2 or id1 with foxl2l in WT (+/+) or foxl2l10i/10i homozygous mutant (-/-) gonads at 26 days post fertilization (dpf). Stained images are shown with (top panels) or without (bottom panels) DAPI in each set. Asterisks represent the expression of id1 in somatic cells. Scale bars represent 5 µm. (Right) Quantitation of the proportion of double positive cells in each gonad is shown. One dot represents the data from one gonad, n=3 in each genotype of each graph. (C) Increased numbers of nanos2-expressing cells in foxl2l10i/10i homozygous mutant gonad (-/-). One dot represents the data from one gonad, n=3 in each genotype of each age. (D) Increased number of nanos2+foxl2l- germline stem cells (GSCs) in foxl2l10i/10i homozygous mutant gonad (-/-). One dot represents the data from one gonad, n=3 in each genotype.
Figure 5—figure supplement 1
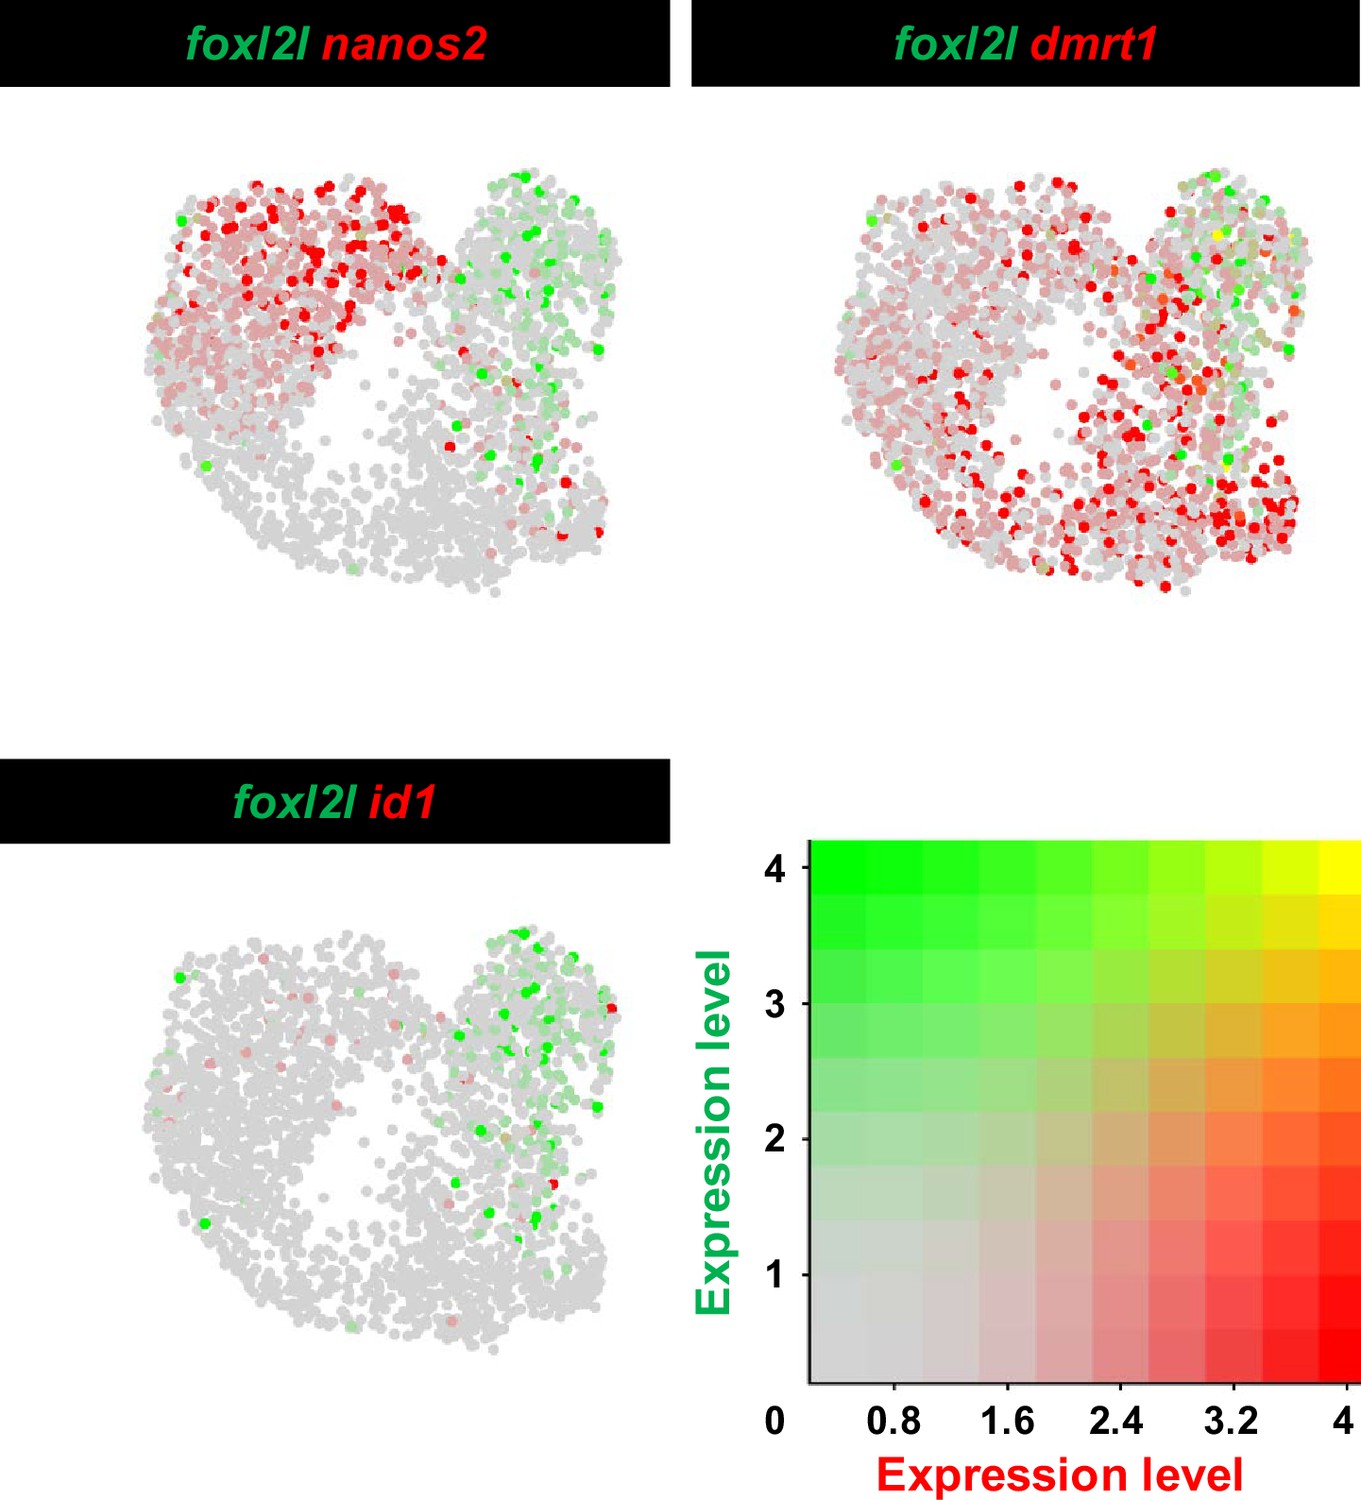
Very few germ cells express foxl2l together with nanos2, id1, or dmrt1 in 40 days post fertilization (dpf) wild-type (WT) gonad.
Expression profile of foxl2l with nanos2, id1, or dmrt1 in 40 dpf germ cells shown in Uniform Manifold Approximation and Projection (UMAP). The data was obtained from a published database (GSE191137). The expression values are visualized by colors ranging between 4 and 0.
Figure 6
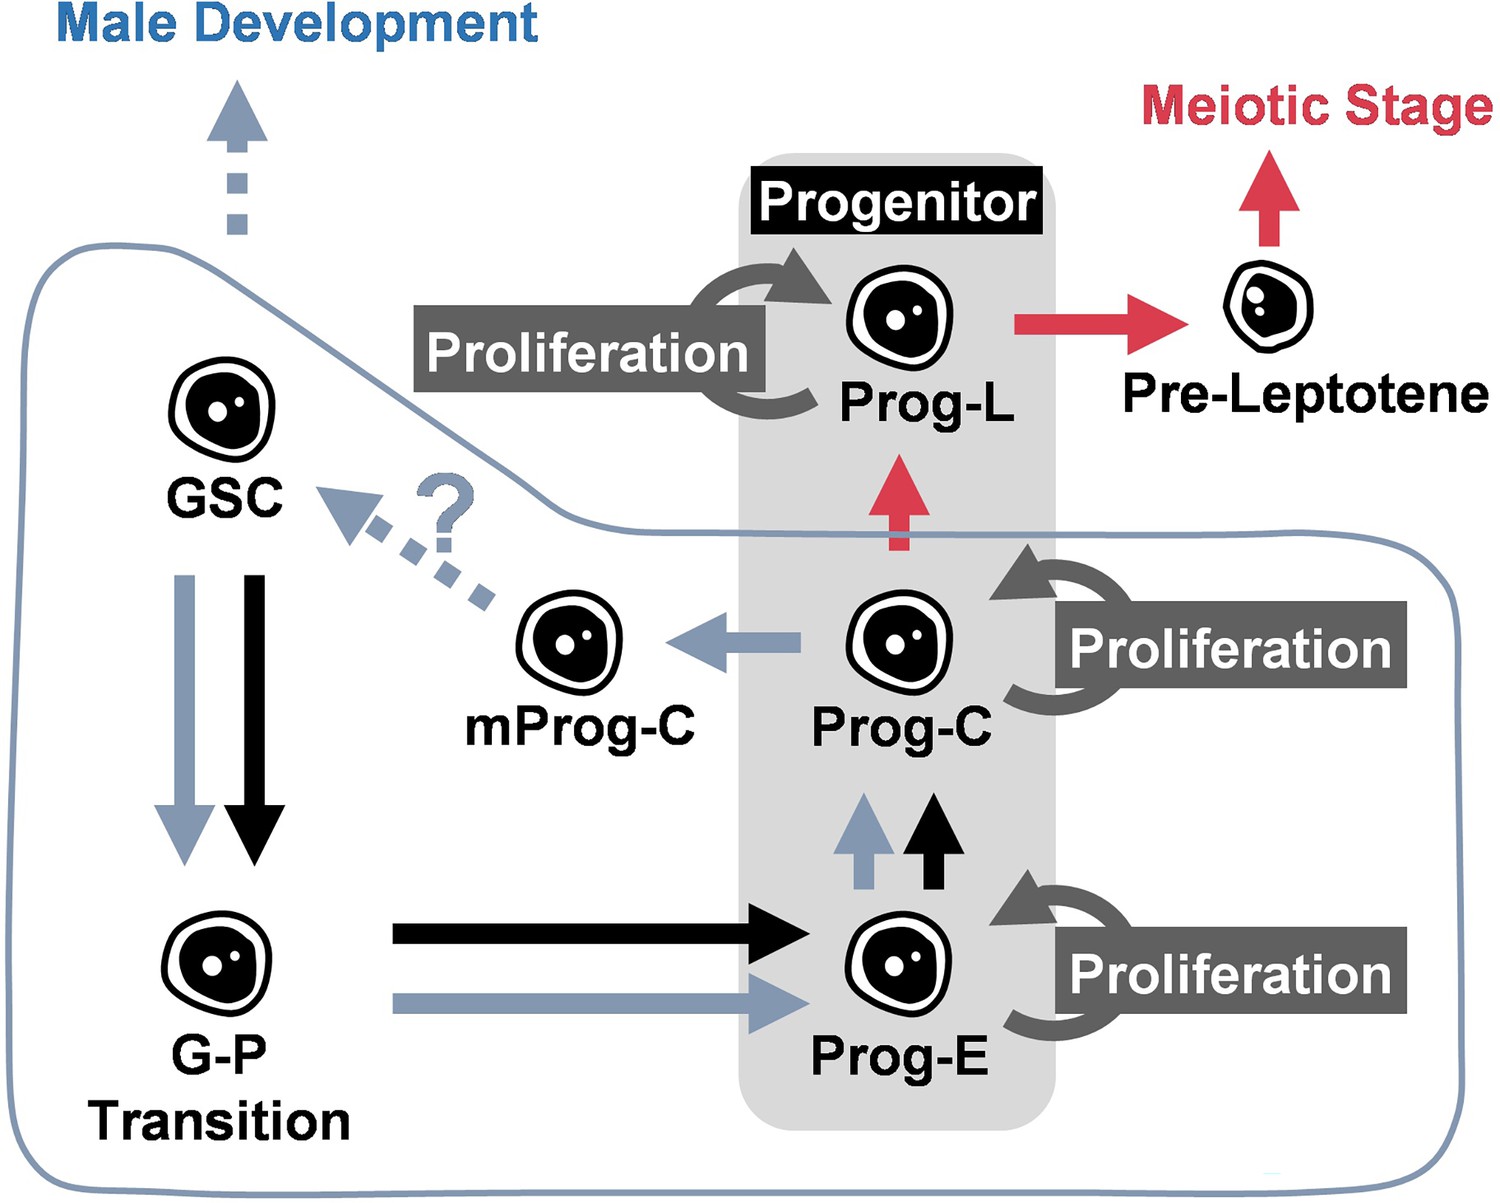
Schematic illustration of the function of Foxl2l during germ cell development in juvenile gonad.
During the sex determination period, germ cells develop following the trajectory from germline stem cell (GSC), GSC to progenitor (G–P) transition, early progenitor (Prog-E), committed progenitor (Prog-C), late progenitor (Prog-L) to the female meiotic stage. Foxl2l is essential for the maturation of Prog-C and the ensuing Prog-L development. In foxl2l mutant, germ cells are arrested at Prog-C. Some mutant Prog-C cells (mProg-C) express nanos2. The absence of functional Foxl2l eventually triggers male development. Blue symbols indicate alternative development in foxl2l mutants. Red arrows indicate the developmental trajectory of females.
Author response image 1

Author response image 2
Author response image 3

Author response image 4
Additional files
-
MDAR checklist
- https://cdn.elifesciences.org/articles/100204/elife-100204-mdarchecklist1-v2.docx
-
Supplementary file 1
The list and the expression of marker genes in each cluster.
- https://cdn.elifesciences.org/articles/100204/elife-100204-supp1-v2.xlsx
Download links
A two-part list of links to download the article, or parts of the article, in various formats.
Downloads (link to download the article as PDF)
Open citations (links to open the citations from this article in various online reference manager services)
Cite this article (links to download the citations from this article in formats compatible with various reference manager tools)
Single-cell transcriptomes of zebrafish germline reveal progenitor types and feminization by Foxl2l
eLife 14:e100204.
https://doi.org/10.7554/eLife.100204


