Reported transgenerational responses to Pseudomonas aeruginosa in Caenorhabditis elegans are not robust
- Department of Molecular and Cellular Biology, Harvard University, Divinity Avenue, The Biological Laboratory, United States
Figures
Figure 1 with 3 supplements
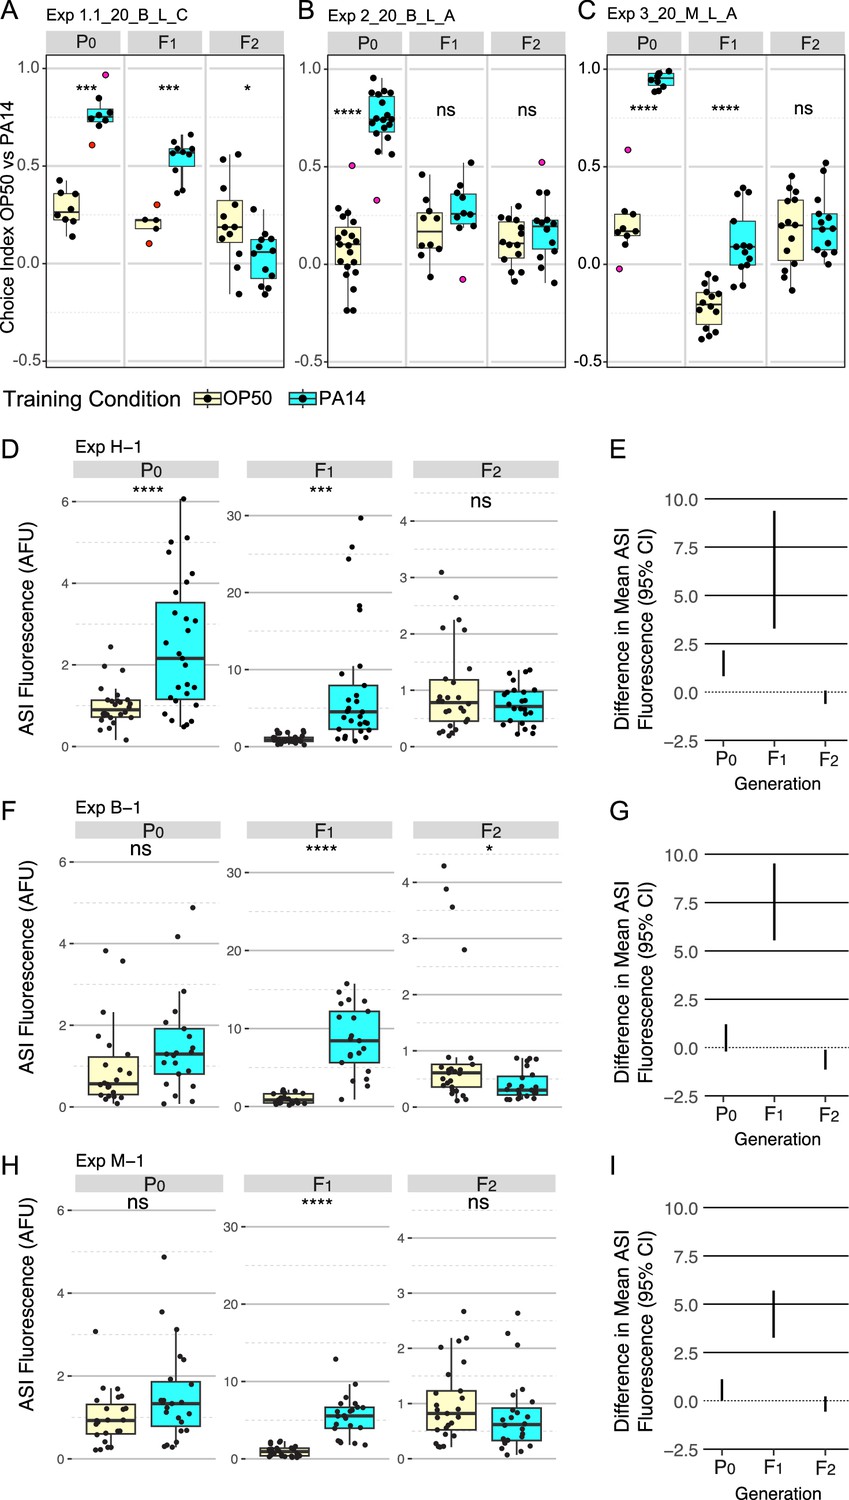
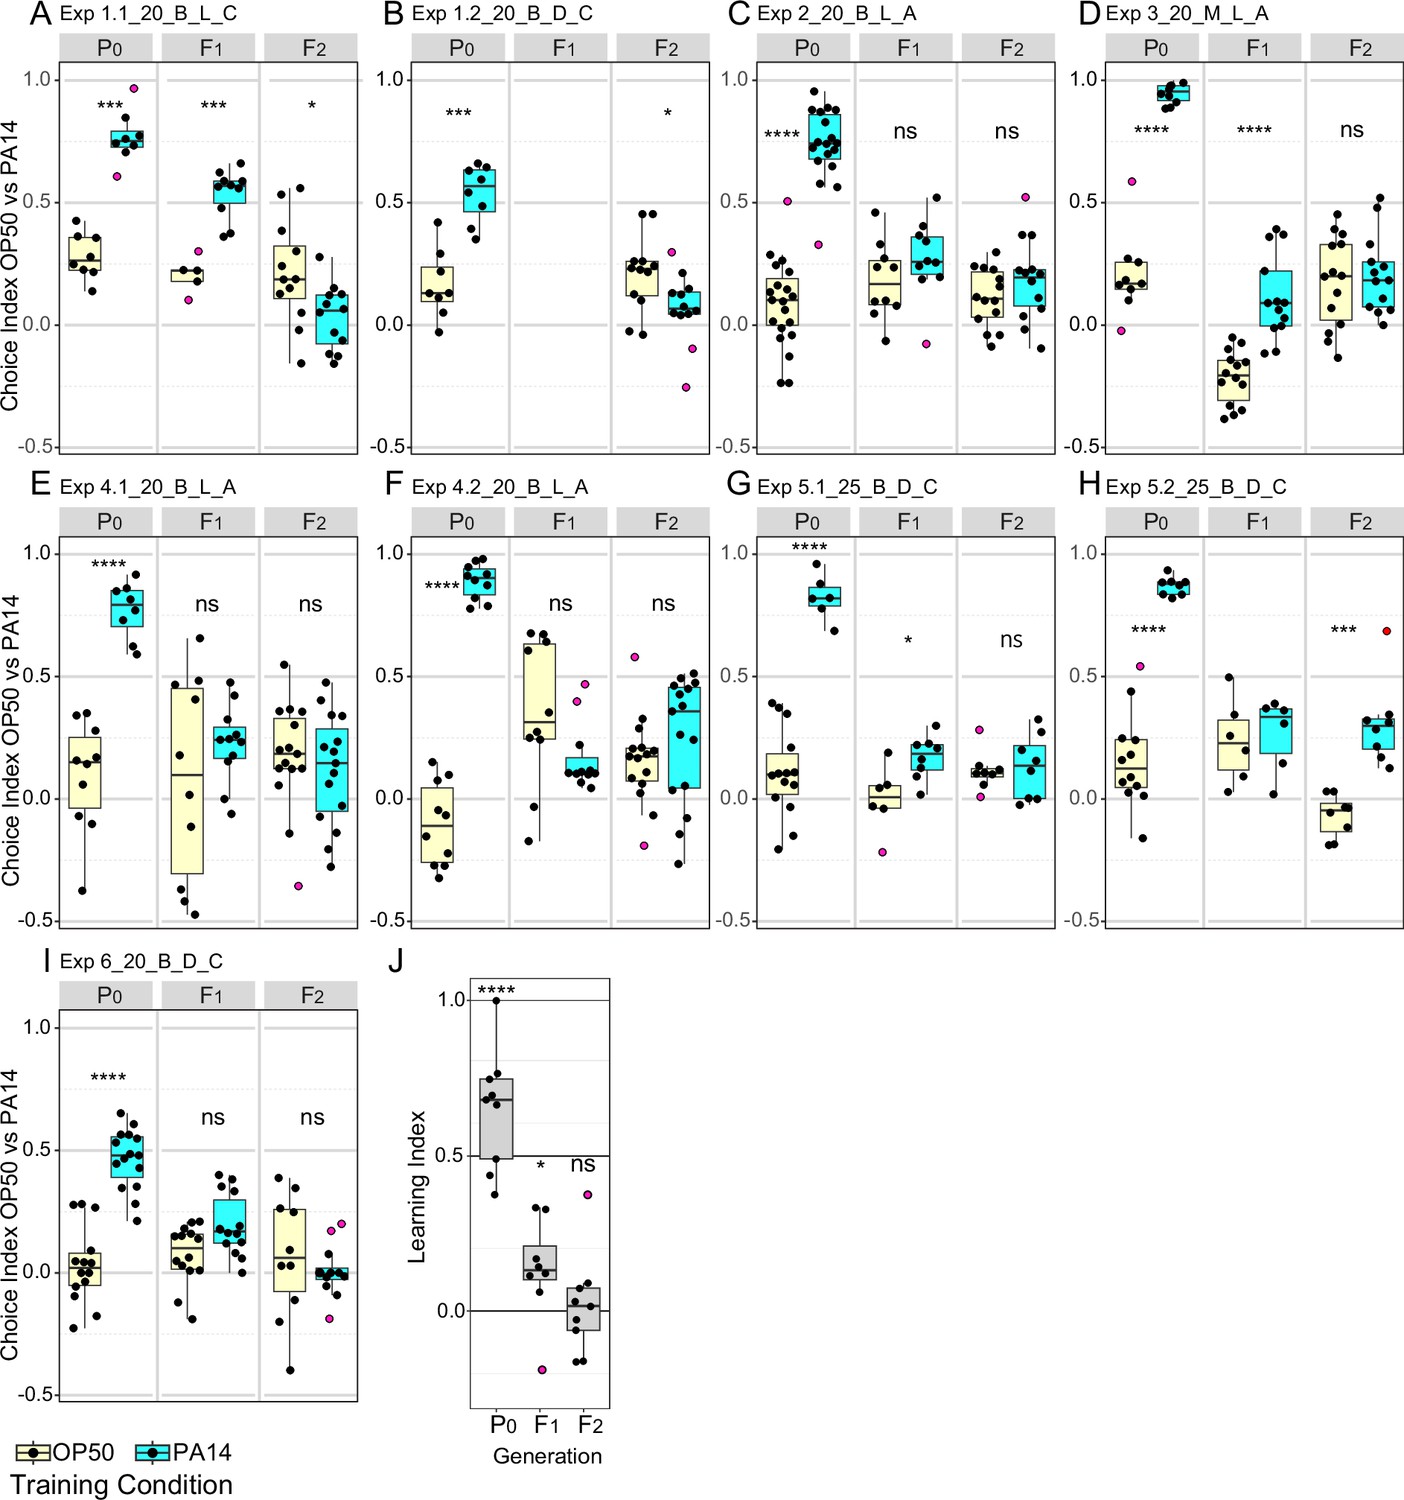
P0, F1, and F2 generation responses to P0 PA14 exposure.
Three representative experimental results for trained and inherited aversion behavior (A–C) and induced and inherited elevated daf-7p::gfp in ASI neurons (D–I). (A-C) Quartile box plots for each generation and training condition showing the distribution of choice index values ([number of animals choosing OP50 - number of animals choosing PA14] / total number of choices) for each OP50 vs PA14 choice assay plate following the published protocols. The experimental and assay conditions are indicated in the panel titles; [Exp #] [growth temperature (20 °C or 25 °C)] PA14 isolate (B, Balskus or M, Murphy) light/dark assay condition (L or D) azide/cold paralytic (A or C). (D, F, H) Quartile box plots displaying average ASI neuron daf-7p::gfp expression levels per worm and (E, G, I) show the 95% confidence intervals for the difference in absolute mean between the conditions. For these experiments, the FK181 strain (integrated multi-copy [MC] daf-7p::gfp reporter) was cultured at 20 °C at all generations and was exposed to one of three different PA14 isolates (H, Hunter; B, Balskus; M, Murphy labs). AFU arbitrary fluorescence units normalized to mean OP50 levels. Red dots in choice assay results indicate outlier data points that were included in all statistical tests. Statistical significance **** p<0.0001, ***<0.001, **<0.01, *<0.05, ns >0.05. See Methods section for statistical methods.
Figure 1—figure supplement 1

P0 generation response to PA14 exposure.
Results from two independent experiments in which training of P0 animals began 48–52 hr post bleach and too few F1 embryos were recovered to continue the experiment. (A) Quartile box plots and training condition showing distribution of choice index values for each individual choice assay plate. Red dots indicate outlier data points that were included in all statistical tests. (B) The same data as presented in panel A but expressed as a proportion of all individual choices across all assay plates. For both PA14 training and OP50 control animals the total number of OP50 and PA14 choices were summed across all choice plates and analyzed using a 2X2 contingency table and Fisher’s exact test. Plotted is the percent OP50 choice for each condition (the PA14 choice is 100% minus the OP50 choice). The number of OP50 choice and PA14 choice animals scored for each experiment and training condition is indicated on each bar plot. The p-values represent the probability that the two observations came from identical, binomially distributed populations. These two experiments were performed with 20 °C grown worms, the Balskus lab PA14 isolate was used, P0-1 was performed in the light, P0-2 in the dark and in both cases cold-induced rigor was used to preserve their choice. Statistical significance **** p<0.0001, ** p<0.1. See Methods section for additional statistical methods. Data for this figure is presented in Figure 1—figure supplement 1—source data 1.
-
Figure 1—figure supplement 1—source data 1
This file contains data on the age of P0 animals at initiation of training.
- https://cdn.elifesciences.org/articles/100254/elife-100254-fig1-figsupp1-data1-v1.xlsx
Figure 1—figure supplement 2
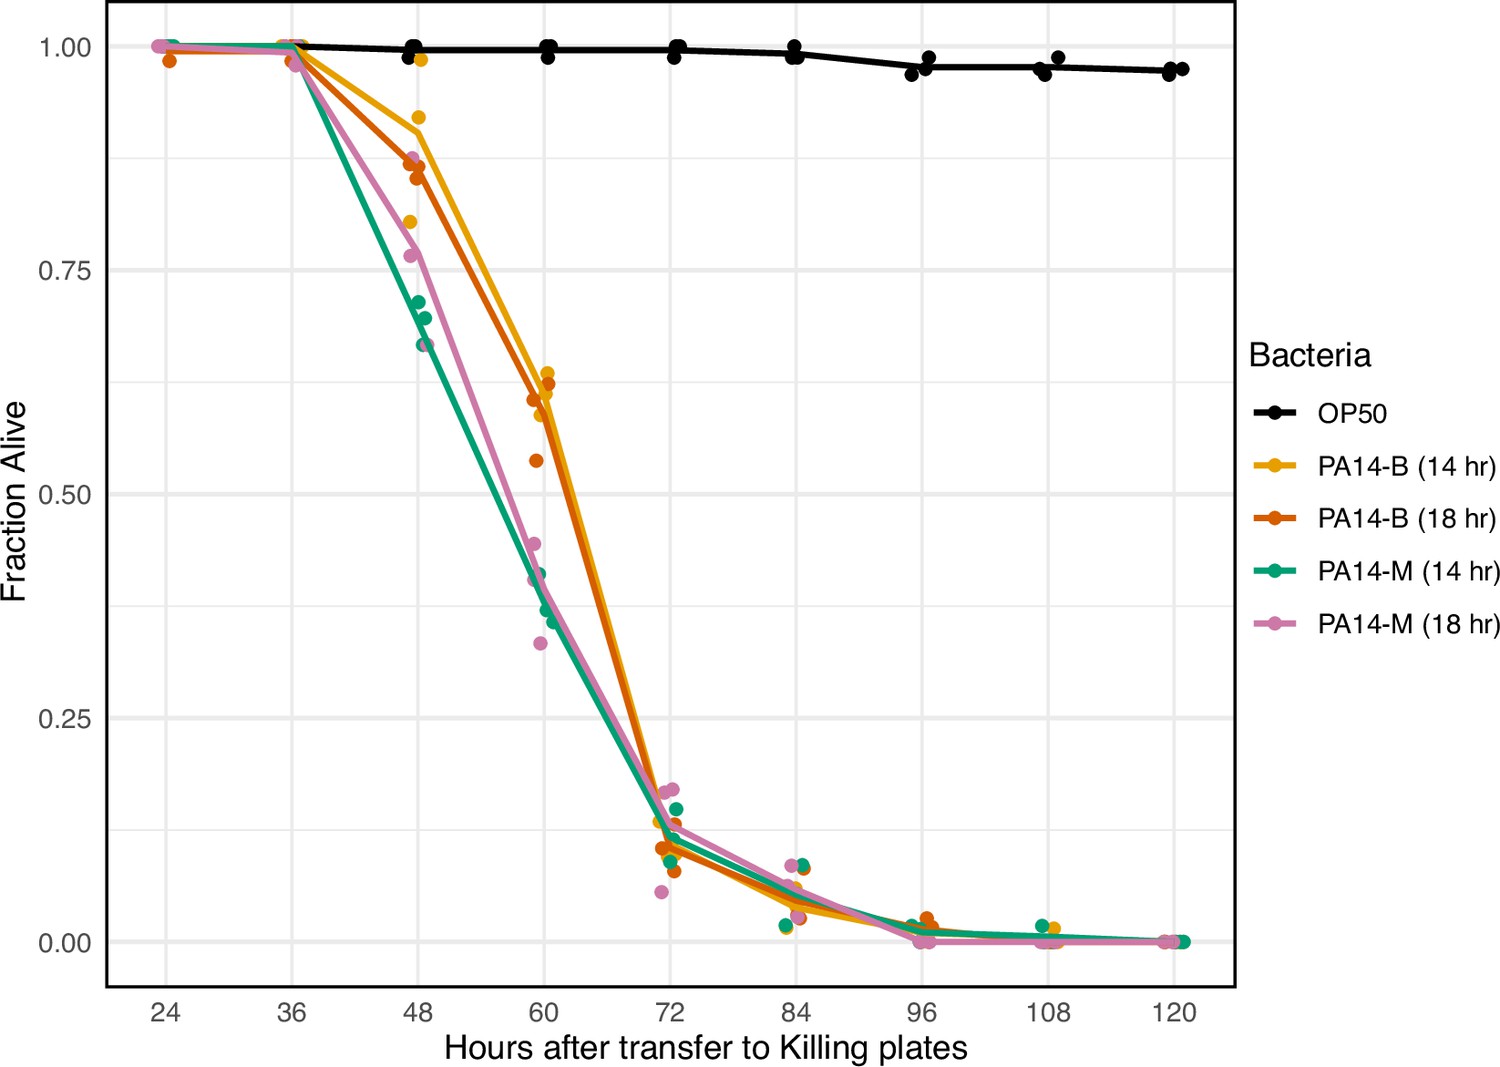
The pathogenicity of PA14 isolates.
Day 1 N2 adults were transferred to plates seeded with the indicated 14 hr or 18 hr bacterial cultures and then scored for viability at 12 hr intervals. PA14-B and PA14-M refer to the Balskus and Murphy lab PA14 isolates, respectively. Data points were jittered along the X-axis for display. n=38–80 per replicate, three replicates per condition. Data for this figure is presented in Figure 1—figure supplement 2—source data 1.
-
Figure 1—figure supplement 2—source data 1
This file contains data on PA14 pathogenesis.
- https://cdn.elifesciences.org/articles/100254/elife-100254-fig1-figsupp2-data1-v1.xlsx
Figure 1—figure supplement 3

Comparison of paralytic treatments.
Quartile box plots showing distribution of choice index values for each individual choice assay plate for the indicated paralytic treatment and training condition. This data is also presented in Figures 1 and 3 without grouping by paralytic treatment. The P0 generation of a single biological replicate (Exp 2, Figure 1, Table 2, and Figure 3—source data 1) was assayed on choice assay plates; half the choice plates were treated with azide and half were treated with cold-induced rigor. Purple dots indicate outlier data points that were included in all statistical tests. Panel A compares the control and training response and statistics for each paralytic. Panel B compares the paralytic response and statistics for each training condition. Statistical significance **** p<0.0001, ns >0.05. See Methods section for statistical methods.
Figure 2 with 2 supplements
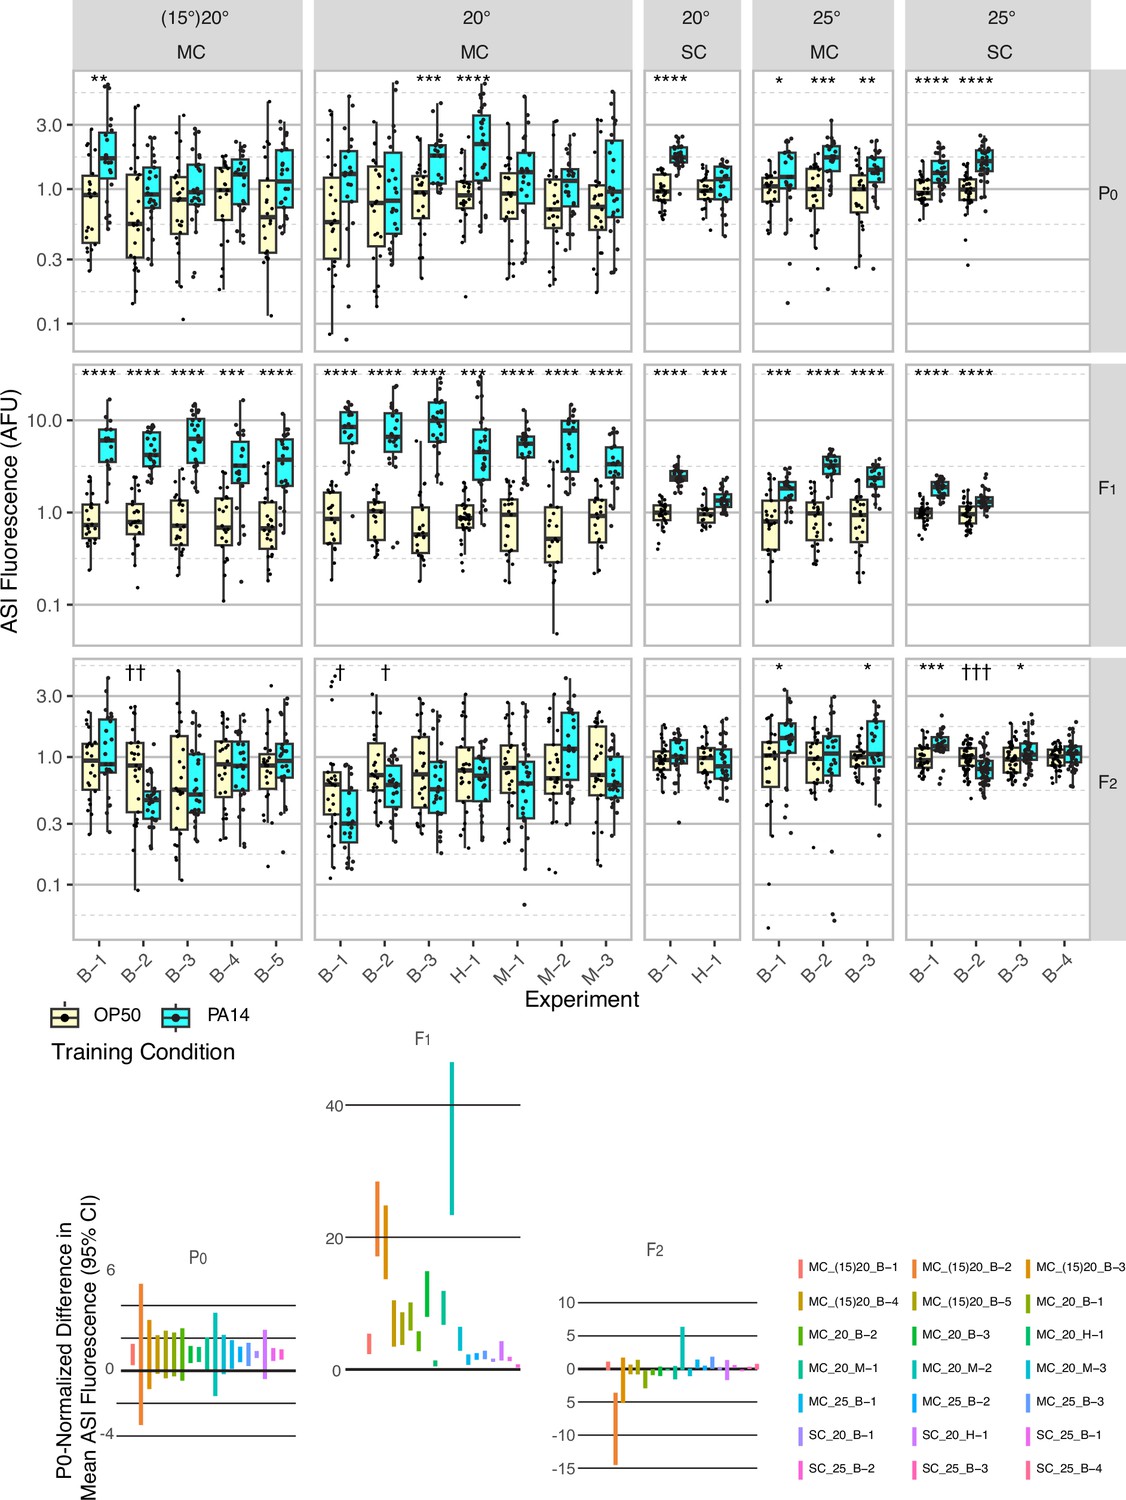
Effect of experimental design changes on multigenerational ASI daf-7p::gfp expression levels after P0 PA14 exposure.
Box plots of results for 21 independent experiments are normalized to the average OP50 value by generation within each experiment for summary presentation (see Table 1 and Figure 2—source data 1 for experimental conditions). This figure includes the experiments shown in Figure 1. FK181 contains an integrated multi-copy (MC) tandem array composed of the daf-7p::gfp reporter and the co-injection marker rol-6(su1006) (Murakami et al., 2001). QL296 is a single copy (SC) insert of daf-7p::gfp with unc-119(+) as the co-selection marker (Zhan et al., 2015). Worms were cultured at either 20 °C or 25 °C and exposed to one of three different PA14 isolates (B, Balskus; H, Hunter; M, Murphy labs).In some experiments, worms were grown at 15 °C for at least three generations prior to the P0 generation (indicated with parentheses, i.e. (15)20). The 95% confidence interval for the predicted absolute difference in means between conditions, normalized to the predicted P0 difference for each experiment (when applicable), is presented in the lower portion of the figure. Figure 2—figure supplement 1 shows the same data for individual neurons, rather than the mean of the two neurons. Statistical significance **** p<0.0001, ***<0.001, **<0.01, *<0.05. Non-significant labels (p>0.05) are omitted for clarity. † Indicate statistical significance with control higher than experiment. See Methods section for statistical methods. Data for this figure is presented in Figure 2—source data 1.
-
Figure 2—source data 1
This file contains daf-7p::gfp expression in ASI neurons data plotted in Figures 1 and 2, Figure 2—figure supplement 1, and Figure 5.
- https://cdn.elifesciences.org/articles/100254/elife-100254-fig2-data1-v1.xlsx
Figure 2—figure supplement 1
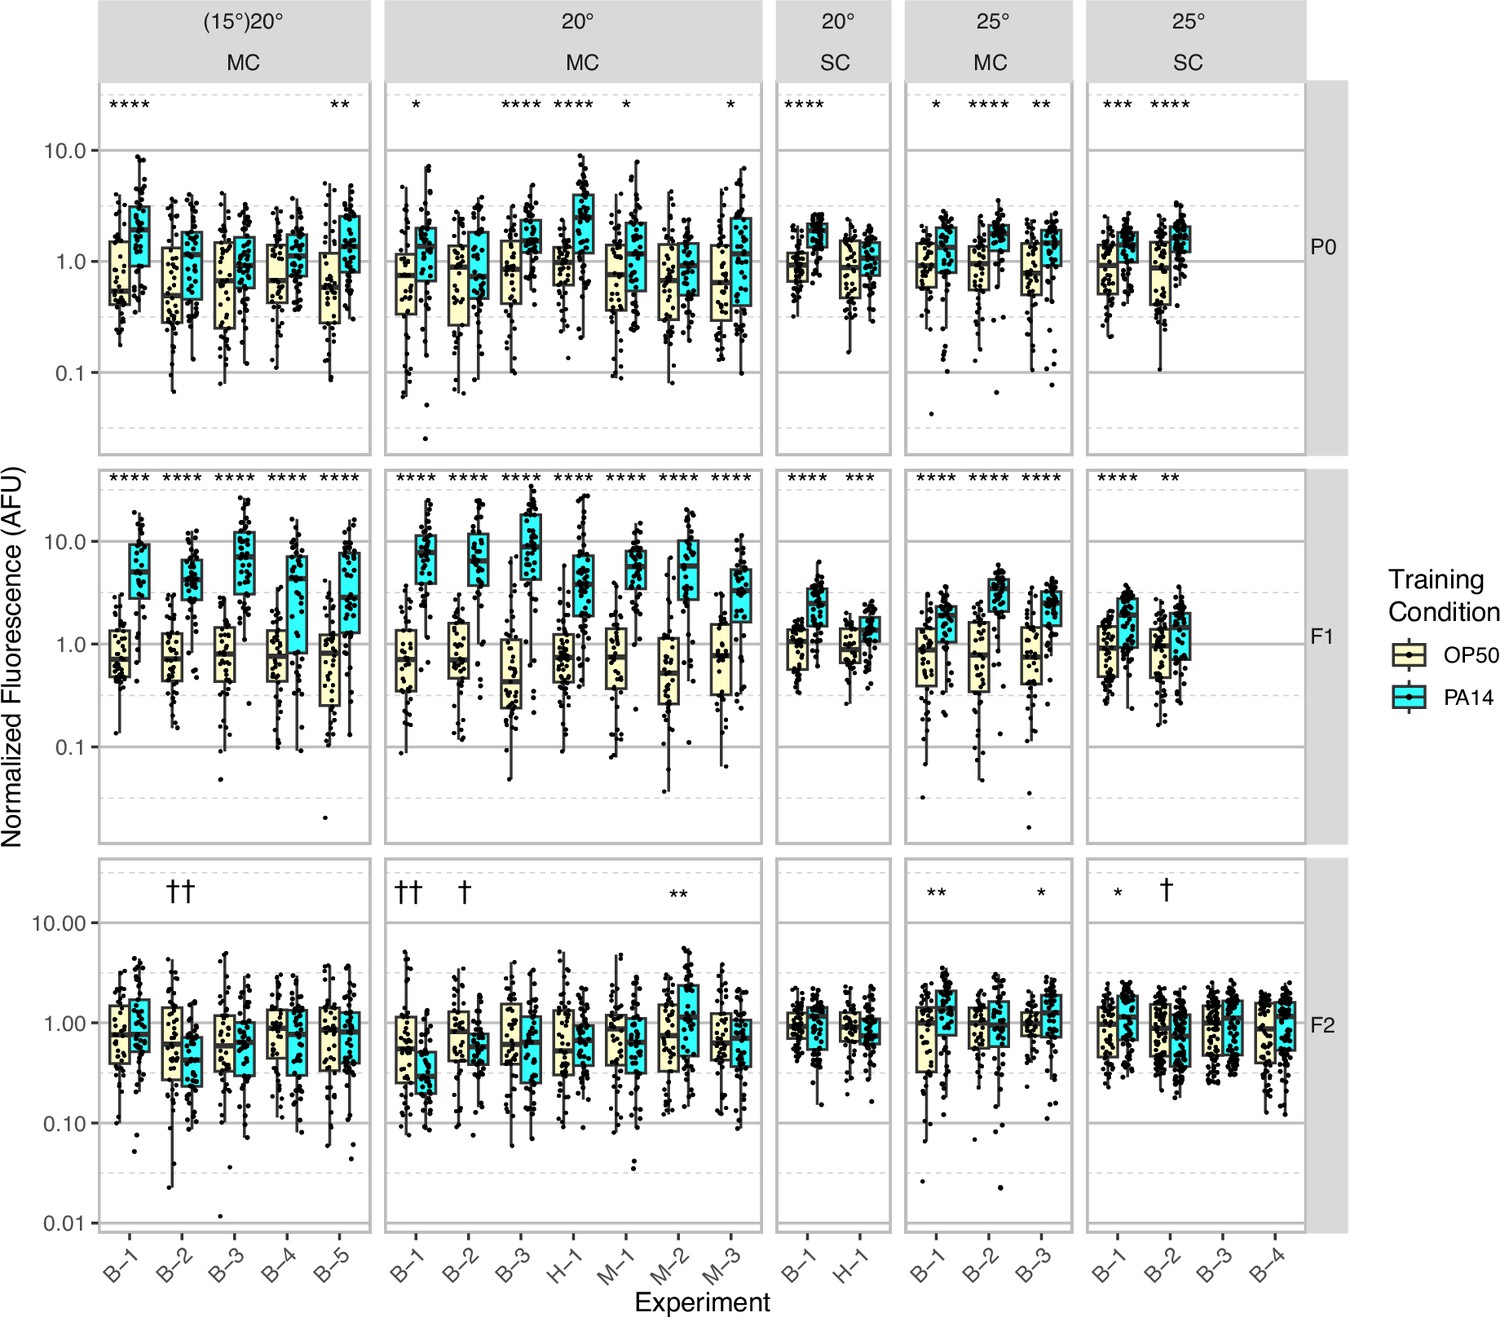
Box plot display of individual ASI daf-7p::gfp expression levels after P0 PA14 exposure.
Results from 21 independent experiments are normalized to the average OP50 value by generation within each experiment for summary presentation (experiments are named by experimental conditions, see Table 1). This figure includes the exact same data as shown in Figure 2 but plotted for all individual neurons rather than the average of the neuron pair in each animal. MC refers to FK181, which contains an integrated multicopy tandem array composed of the daf-7p::gfp reporter and the co-injection marker rol-6(su1006). SC refers to QL296, which is a single copy insert of daf-7p::gfp with unc-119(+) as the co-selection marker (Zhan et al., 2015). Worms were cultured at either 20 °C or 25 °C and exposed to one of three different PA14 isolates (B, Balskus; H, Hunter; M, Murphy labs). In some experiments worms were grown at 15 °C for at least three generations prior to the P0 generation (indicated with parentheses, i.e. (15)20). Statistical significance **** p<0.0001, ***<0.001, **<0.01, *<0.05. Non-significant labels (p>0.05) are omitted for clarity. † Indicate statistical significance with control higher than experimental. See Methods section for statistical methods.
Figure 2—figure supplement 2
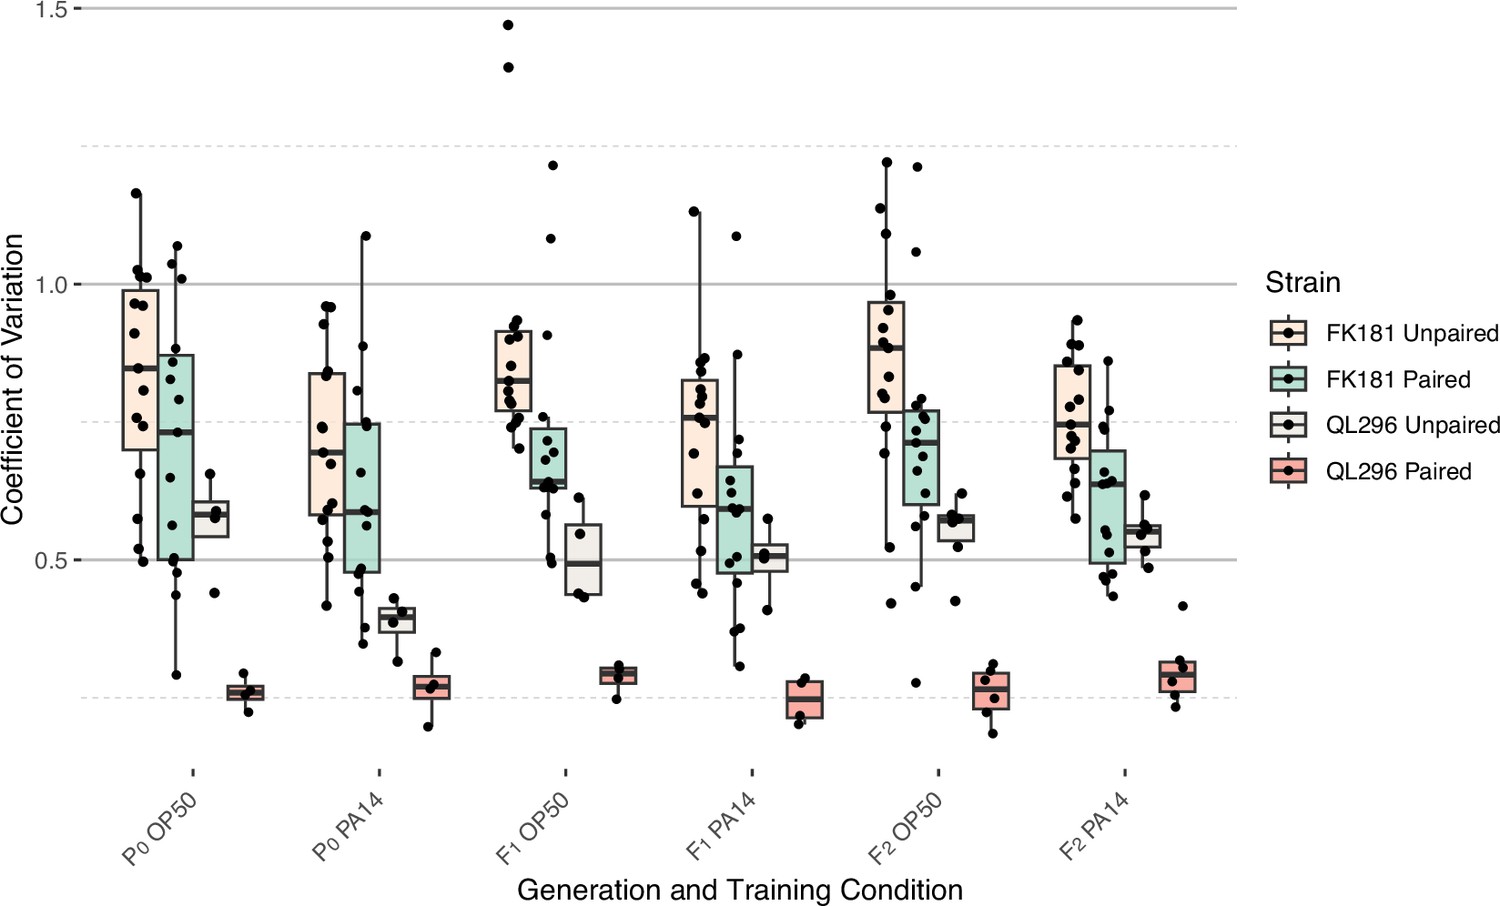
Coefficient of variation analysis of ASI daf-7p::gfp expression levels.
The coefficient of variation was calculated for all experiments shown in Figure 2 (average of both ASI neurons - Paired) and Figure 2—figure supplement 1 (individual neurons - Unpaired) for both FK181 (integrated multicopy array) and QL296 (integrated single copy insertion).
Figure 3 with 2 supplements
Effects of experimental design changes on multigenerational PA14 avoidance after PA14 exposure.
Growth and assay conditions for each experiment are described in Table 2 and Figure 3—source data 1. This figure includes the experiments shown in Figure 1. Choice index calculated as described in Figure 1. (A-I) The experimental and assay conditions are indicated in the panel titles; [Exp #] [growth temperature (20 °C or 25 °C)] [PA14 isolate (B, Balskus or M, Murphy)] [light/dark assay condition (L or D)] azide/cold paralytic (A or C). (J) Summary panel showing learning indexes (choice index for trained minus choice index for control) for all nine results (eight for F1 animals). See Figure 3—figure supplement 1 for Fisher’s exact test analysis of choice assay results. Purple dots in choice assay results indicate outlier data points that were included in all statistical tests. Statistical significance **** p<0.0001, ***<0.001,**<0.01, *<0.05, ns >0.05. See Methods section for statistical methods. Data for this figure is presented in Figure 3—source data 1.
-
Figure 3—source data 1
This file contains the choice assay data plotted in Figures 1 and 3, Figure 1—figure supplement 2, Figure 3—figure supplement 1, and Figure 5—figure supplement 2.
- https://cdn.elifesciences.org/articles/100254/elife-100254-fig3-data1-v1.xlsx
Figure 3—figure supplement 1
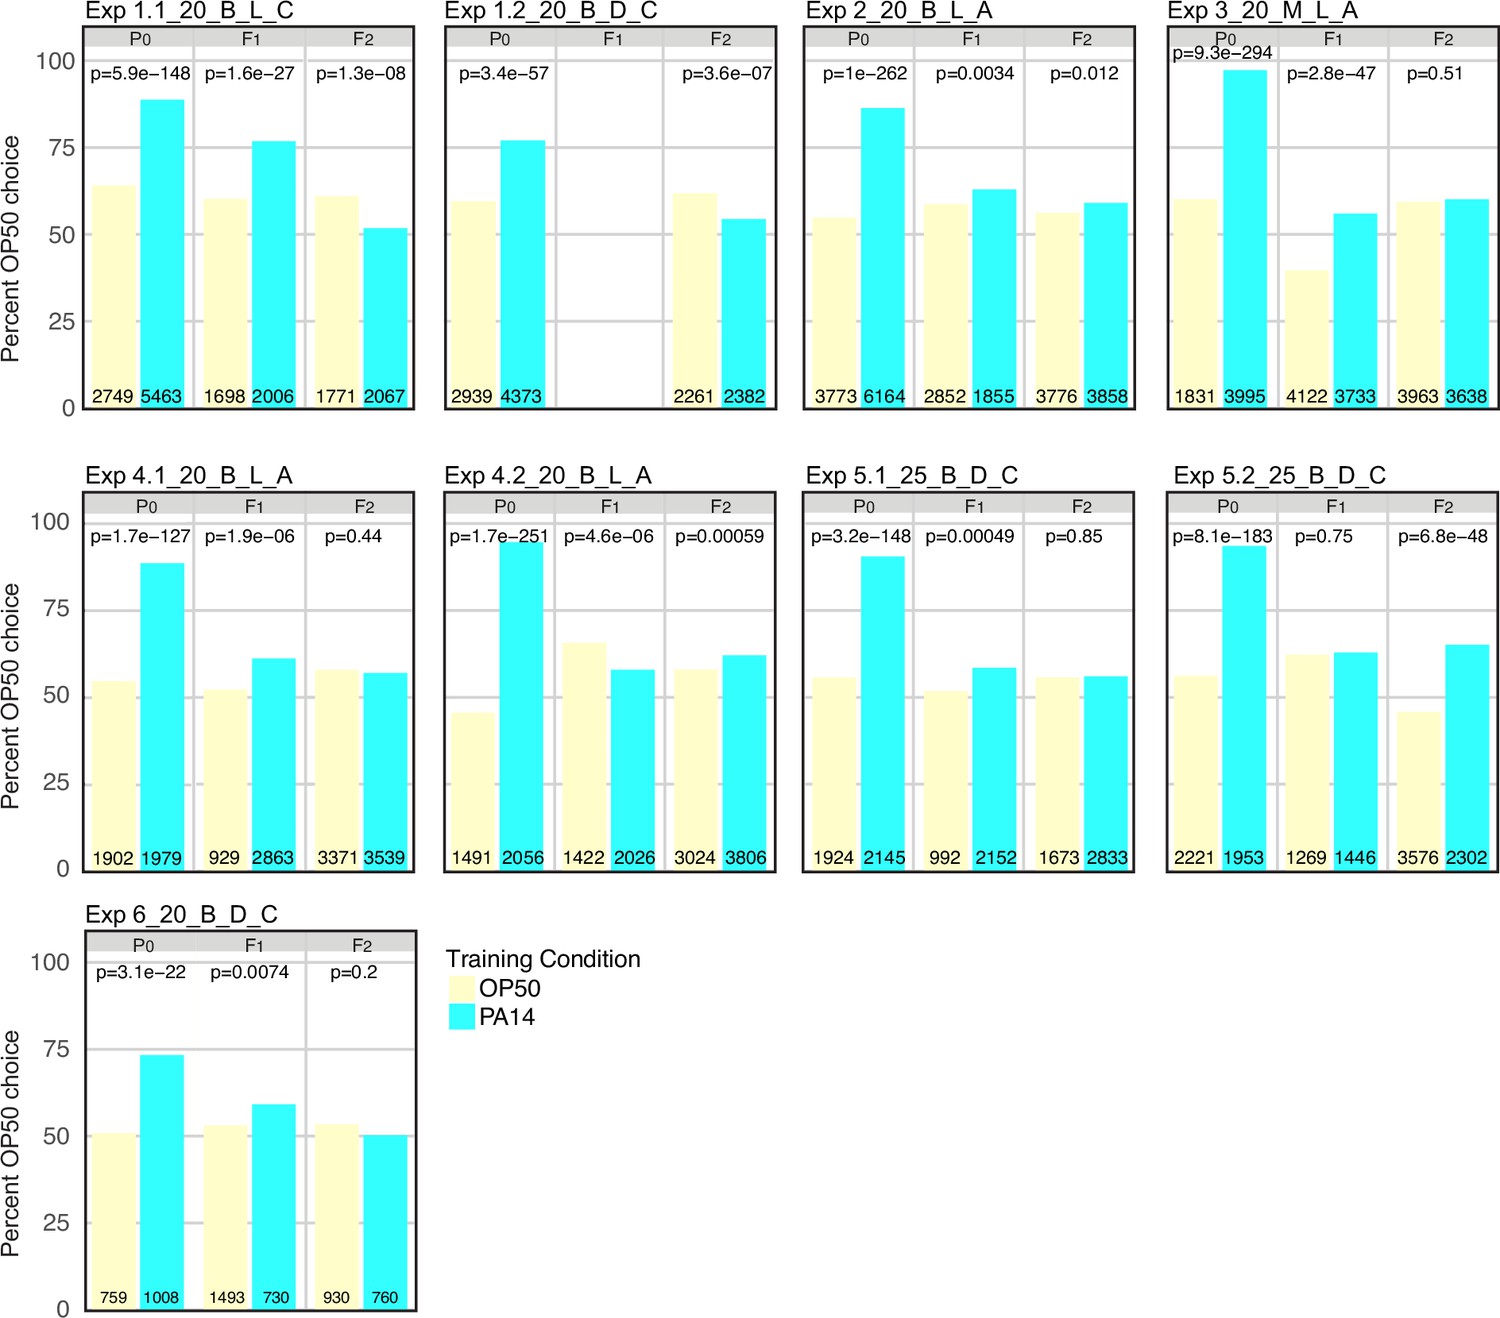
P0 PA14 exposure fails to reproducibly induce F2 PA14 avoidance behavior.
The same data as presented in Figure 3 choice index plots. The experimental and assay conditions are indicated in the panel titles; [Exp #] [growth temperature (20 °C or 25 °C)] PA14 isolate (B or M) [light/dark assay condition (L or D)] azide/cold paralytic (A or C). At each generation and for both PA14 training and OP50 control animals the total number of OP50 and PA14 choices were summed across all choice plates and analyzed using a 2X2 contingency table and Fisher’s exact test. Plotted is the percent OP50 choice for each condition at each generation (the PA14 choice is 100% minus the OP50 choice). The number of OP50 choice and PA14 choice animals scored for each experiment, generation, and training condition is indicated on each bar plot. The p-values represent the probability that the two observations came from identical, binomially distributed populations.
Figure 3—figure supplement 2

Sample size does not correlate with choice index scores.
The correlation coefficient (r) calculated from sample size vs choice index for each experiment (generation, training condition) shown in Figure 3 is plotted against the average number of worms in each experiment. Experiments with six or fewer choice plates were excluded. Data for this figure is presented in Figure 3—figure supplement 2—source data 1.
-
Figure 3—figure supplement 2—source data 1
This file presents data on the correlation coefficient between number of worms per choice plate and choice index across all experiments shown in Figure 3.
- https://cdn.elifesciences.org/articles/100254/elife-100254-fig3-figsupp2-data1-v1.xlsx
Figure 4 with 1 supplement
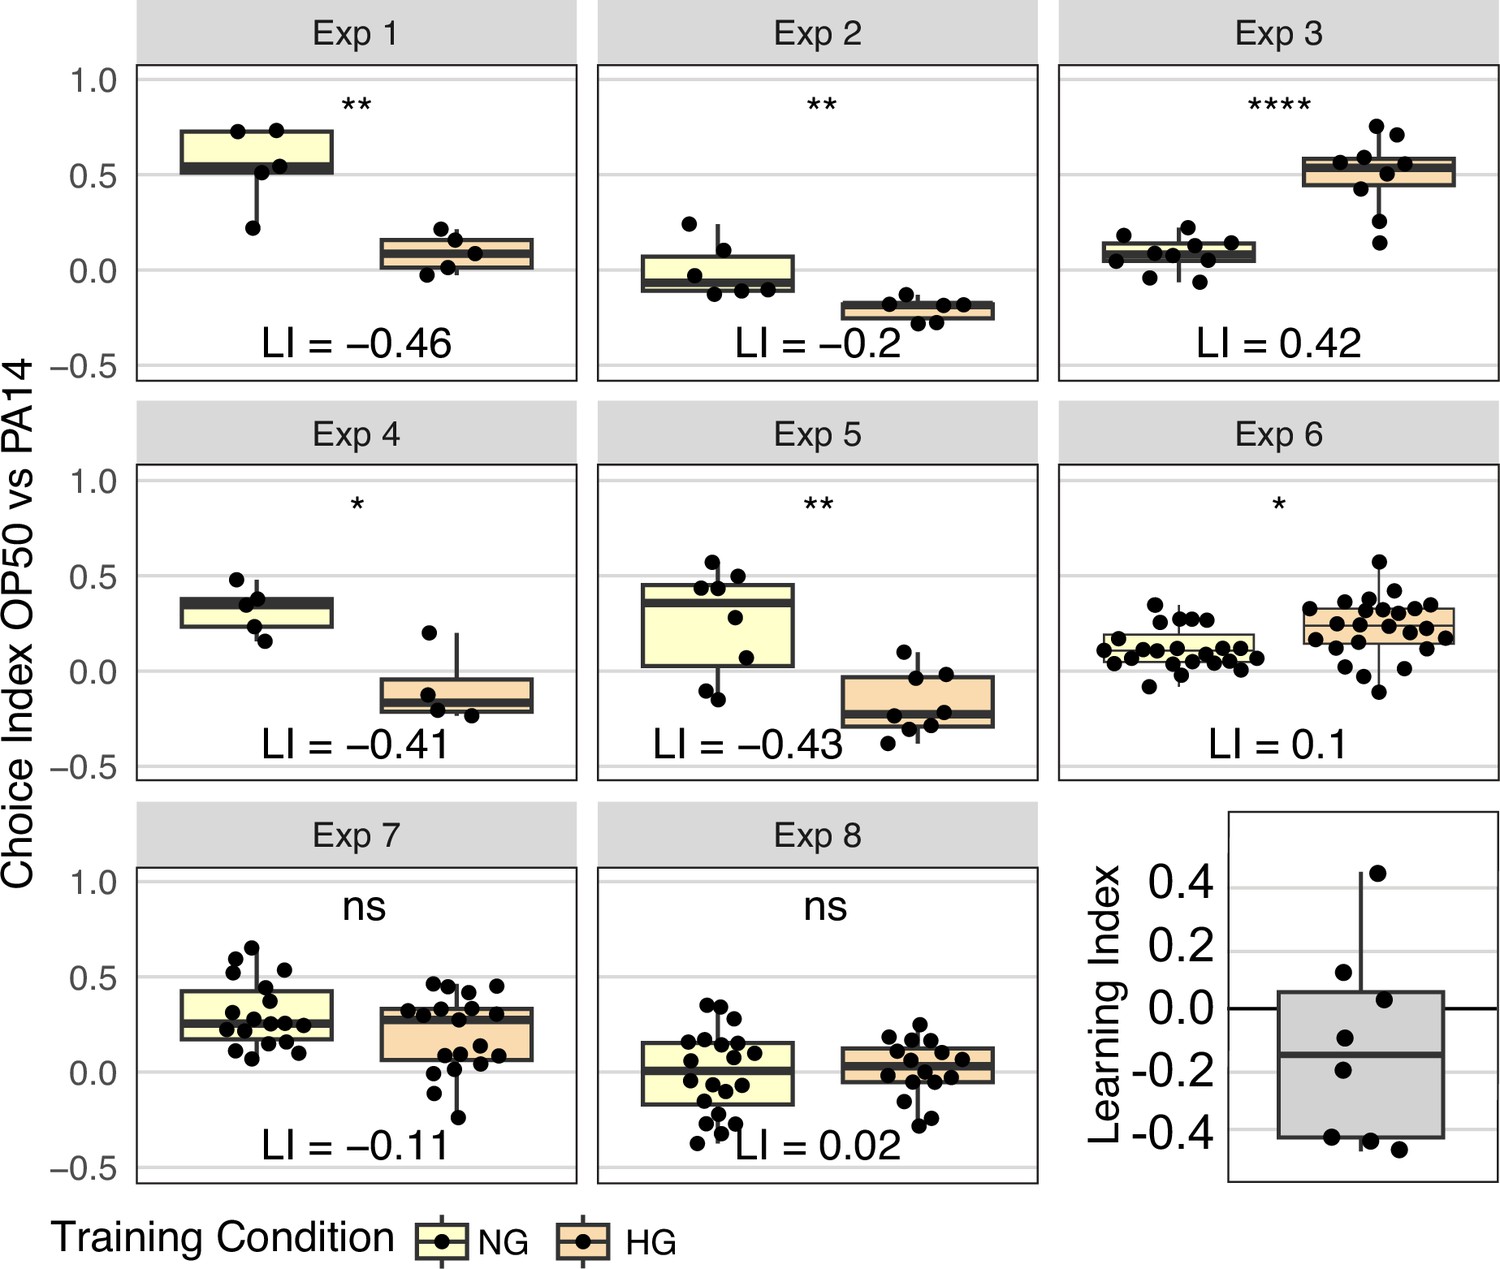
Effect of OP50 growth conditions on OP50 aversion.
N2 worms grown to adulthood on HG plates were ‘trained’ on either HG OP50 or NG OP50 plates for 24 hours and then assayed on OP50 vs PA14 choice plates. The choice index was calculated as described in Figure 1. The learning index, difference between mean HG choice index and mean NG choice index, for all eight experiments is plotted in the last panel. See Figure 4—figure supplement 1 for Fisher’s exact test analysis of choice assay results. Statistical significance **** p<0.0001, ***<0.001, **<0.01, *<0.05, ns >0.05. See Methods section for statistical methods. Data for this figure is presented in Figure 4—source data 1.
-
Figure 4—source data 1
This file contains data NG vs HG training condition and choice index on PA14 OP50 choice plates plotted in Figure 4, Figure 4—figure supplement 1.
- https://cdn.elifesciences.org/articles/100254/elife-100254-fig4-data1-v1.xlsx
Figure 4—figure supplement 1
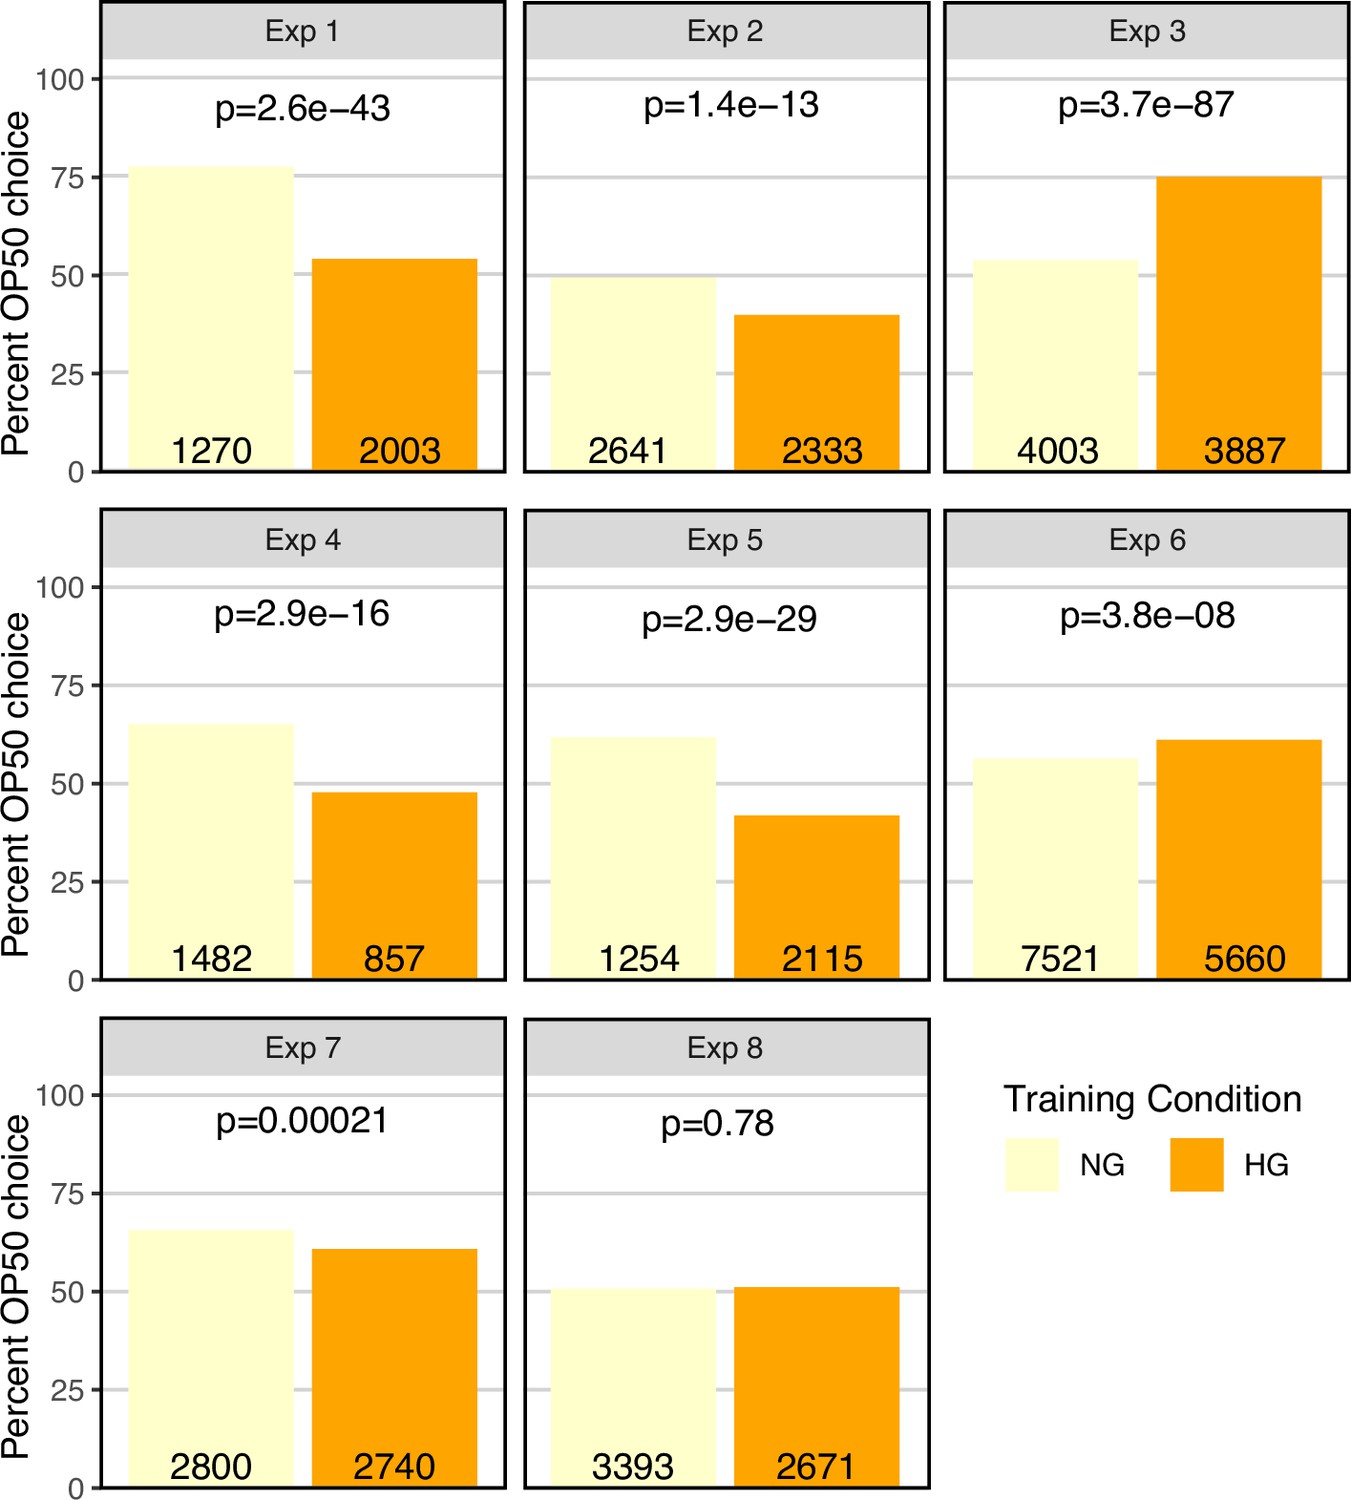
OP50 growth conditions, independent of PA14 exposure, can affect OP50 vs PA14 choice.
The same data as presented in Figure 4 choice index plots. N2 worms grown to adulthood on HG plates were “trained” on either HG OP50 or NG OP50 plates for 24 hours and then assayed on OP50 vs PA14 choice plates. For each of eight experiments the total number of OP50 and PA14 choices were summed across all choice plates and analyzed using a 2X2 contingency table and Fisher’s exact test. Plotted is the percent OP50 choice for each condition (the PA14 choice is 100% minus the OP50 choice). The number of OP50 choice and PA14 choice animals scored for each experiment and training condition is indicated on each bar plot. The p-values represent the probability that the two observations came from identical, binomially distributed populations.
Figure 5 with 2 supplements
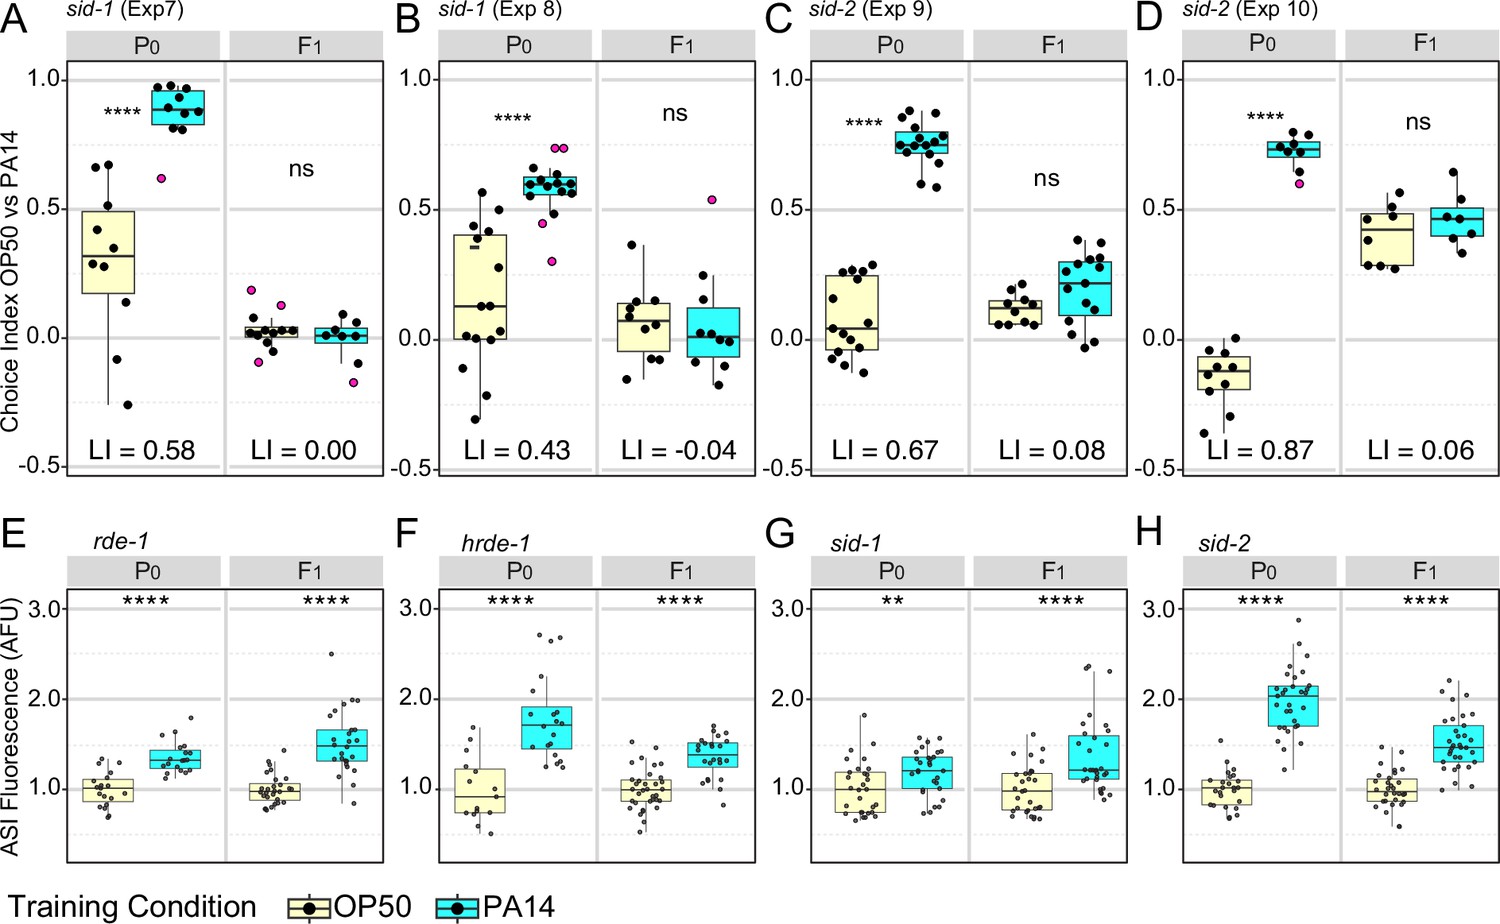
Effects of RNAi pathway mutants on intergenerational (F1) inheritance of avoidance behavior and ASI daf-7p::gfp expression levels.
(A–D) sid-1(qt9) and sid-2(qt42) choice assays. Growth and assay conditions for each experiment are described in Table 2. The choice index was calculated as described in Figure 1. See Figure 5—figure supplement 1 for Fisher’s exact test analysis of sid-1 and sid-2 choice assay results. N2 choice assay results performed in parallel with the sid-1 and sid-2 experiments are presented in Figure 5—figure supplement 2. (E–H) ASI expression experiments showing average ASI neuron daf-7p::gfp expression levels per worm for each of the four genotypes are shown. ASI daf-7p::gfp expression levels are normalized to the average OP50 value by generation within each experiment for ease of presentation. The experiments shown in panels E-H were performed with animals cultured and trained at 20 °C. Statistical significance **** p<0.0001, ***<0.001, **<0.01, *<0.05, ns >0.05. See Methods section for statistical methods. Data for this figure is presented in Figure 2—source data 1, Figure 5—source data 1.
-
Figure 5—source data 1
This file contains the data plotted in Figure 5, Figure 5—figure supplement 1, and Figure 5—figure supplement 2.
- https://cdn.elifesciences.org/articles/100254/elife-100254-fig5-data1-v1.xlsx
Figure 5—figure supplement 1
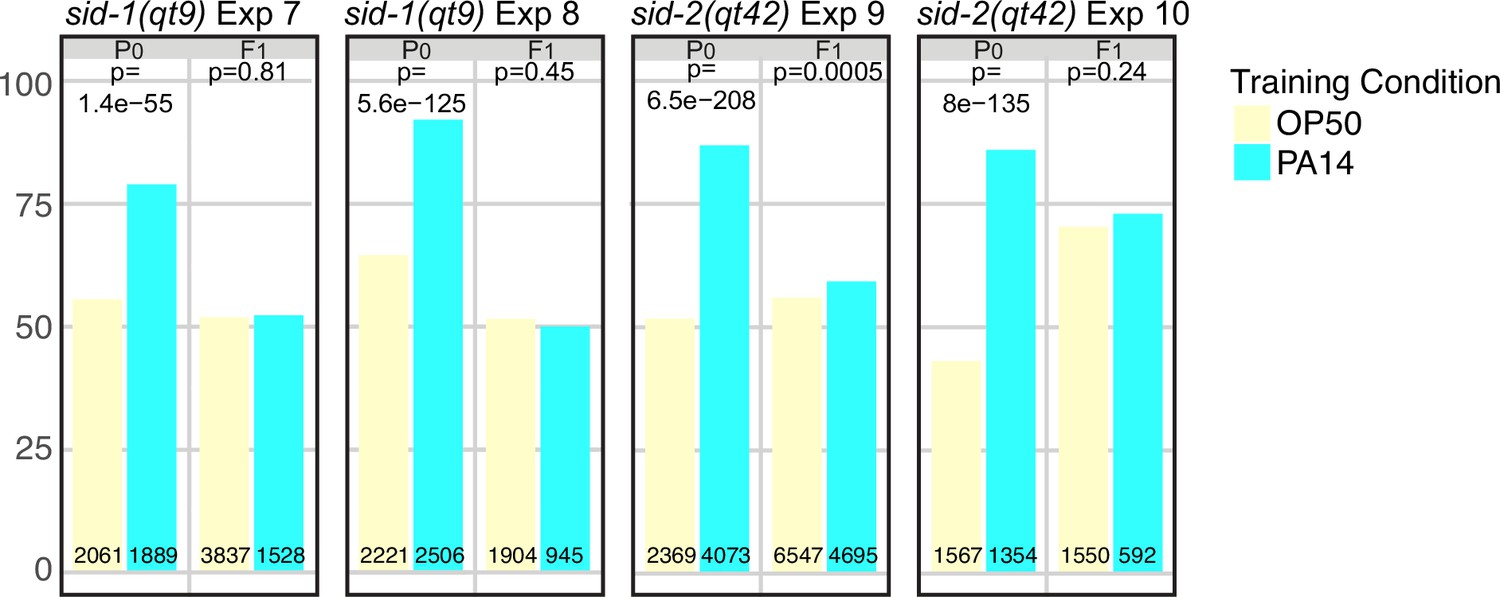
sid-1 and sid-2 are required for intergenerational (F1) inheritance of avoidance behavior.
The same data as presented in Figure 5 choice index plots. At each generation and for both PA14 training and OP50 control animals the total number of OP50 and PA14 choices were summed across all choice plates and analyzed using a 2X2 contingency table and Fisher’s exact test. Plotted is the percent OP50 choice for each condition at each generation (the PA14 choice is 100% minus the OP50 choice). The number of OP50 choice and PA14 choice animals scored for each experiment, generation, and training condition is indicated on each bar plot. The p-values represent the probability that the two observations came from identical, binomially distributed populations.
Figure 5—figure supplement 2
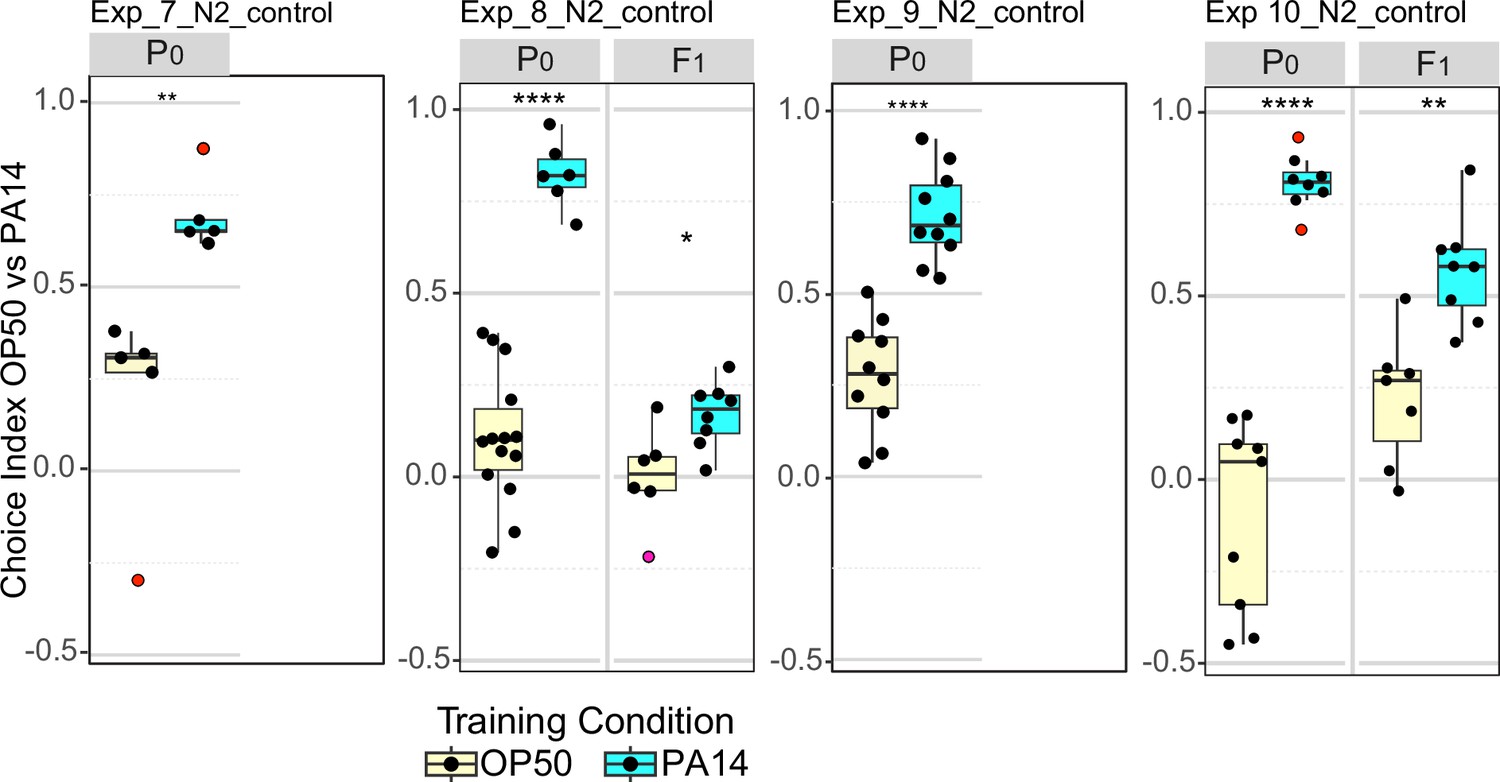
N2 P0 and F1 choice assay results performed in parallel to sid-1 and sid-2 experiments.
Choice assay results for N2 animals grown, trained, and assayed in parallel to experiments 7–10 (Figure 5). Experimental conditions are as described for experiments 7–10 (Table 2). Choice index calculated as described in Figure 1. Too few F1 animals were recovered in N2 controls for experiments 7 and 9 to perform the choice assays. Data for Exp_7_N2_control and Exp_9_N2_control are also shown in Figure 1—figure supplement 1. Data for Exp_8_N2_control is also shown in Figure 3, Exp 5.1. Statistical significance **** p<0.0001, ***<0.001, **<0.01, *<0.05, ns >0.05. See Methods section for statistical methods. Data for this figure is presented in Figure 1—figure supplement 1—source data 1, Figure 3—source data 1, Figure 5—source data 1.
Figure 6 with 1 supplement
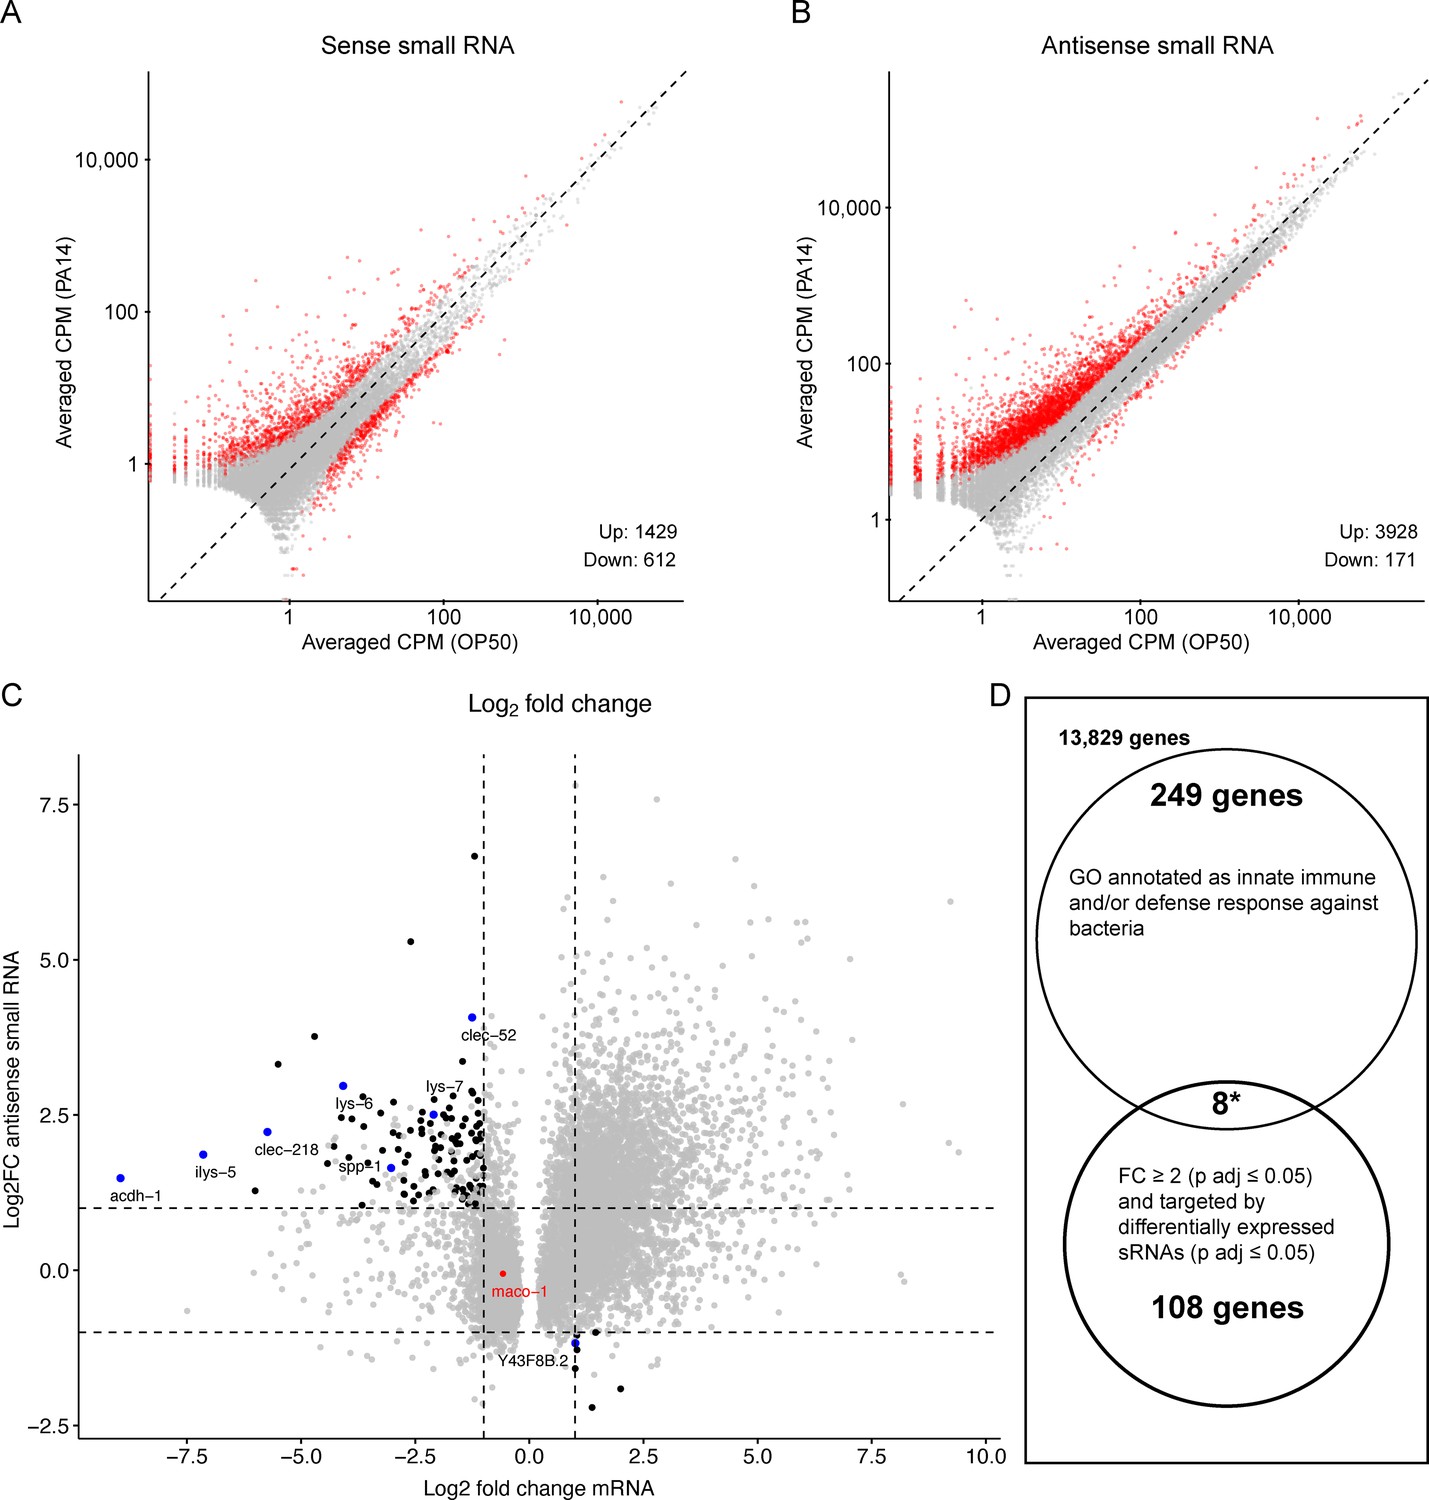
Re-analysis of small RNA and mRNA sequence data from PA14 exposed and control P0 animals.
RNA sequence data (PRJNA509938) was downloaded and re-analyzed as described in Methods. (A, B) Scatter plots comparing sense and antisense strand small RNAs (17–29 nucleotides) from worms grown on PA14 and OP50. Red dots represent ≥twofold change and Benjamini-Hochberg corrected p values (P adj. ≤0.05) and grey dots correspond to less than a twofold change or insignificant difference (P adj. >0.05). Volcano plots of the same data are shown in Figure 6—figure supplement 1. (C) Black dots represent genes associated with small RNAs that show a significant twofold or greater change in abundance (Y axis) and map to an mRNA that also shows a significant twofold or greater change in abundance (X axis). Blue dots correspond to the subset of target mRNAs associated by GO analysis (panel D) with anti-bacterial or innate immune responses. The red dot represents the maco-1 gene. (D) Gene Ontology analysis of differentially expressed mRNAs targeted by differentially expressed small RNAs. Eight of the 116 small RNA targeted differentially expressed mRNAs are also associated with antibacterial or innate immune responses, while 257 of all 14,194 detectably expressed genes share similar GO annotations representing a 3.8-fold (p<0.0001, hypergeometric distribution) enrichment over neutral expectations.
-
Figure 6—source data 1
This file contains re-analyzed differential gene expression results of RNA-seq data from PRJNA509938 (Moore et al., 2019).
This data is plotted in Figure 6, Figure 6—figure supplement 1.
- https://cdn.elifesciences.org/articles/100254/elife-100254-fig6-data1-v1.xlsx
Figure 6—figure supplement 1
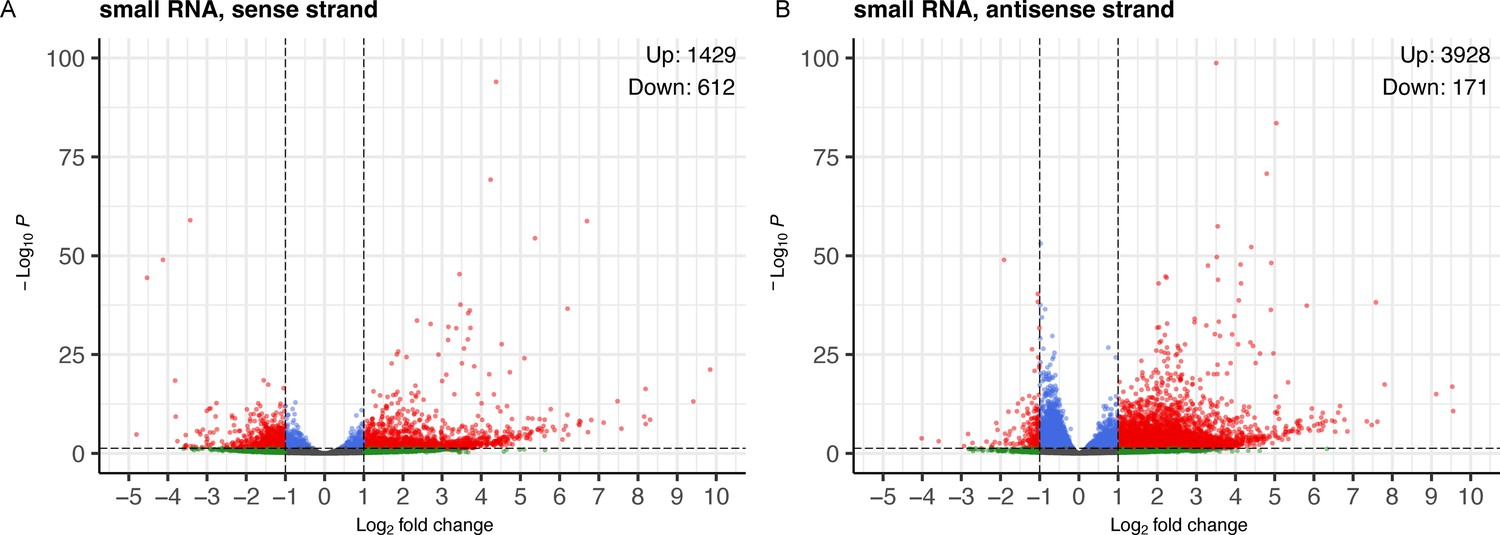
Volcano plot displays reanalyzed small RNA sequence data from PA14 exposed and control P0 animals.
RNA sequence data (PRJNA509938) was downloaded and re-analyzed as described in methods. A, B, PA14/OP50 Log(2) fold change for sense and anti-sense strand small RNAs (17–29 nucleotides), color coded for fold change and Benjamini-Hochberg corrected p values (P adj.). Small RNAs were mapped to genes for fold-change and p-value calculations. Black dots correspond to less than a twofold change and insignificant difference (P adj. >0.05). Blue dots correspond to significant differences (P adj. ≤0.05) but less than twofold change. Green dots correspond to greater than twofold change and insignificant difference (P adj. >0.05). Red dots represent small RNA clusters that show a twofold or greater significant difference (P adj. ≤0.05). Volcano plots were generated with the EnhancedVolcano R package (Blighe, 2023).
Tables
Table 1
Experimental conditions and results for daf-7p::gfp expression levels in ASI neurons of wild-type animals.
| Reporter* | Pre-growth temperature | P0-F2 growth temperature | PA14 isolate† | Numerical index | F1 elevated daf-7p::gfp | F2 elevated daf-7p::gfp |
|---|---|---|---|---|---|---|
| MC | 15 °C | 20 °C | B | 1, 2, 3, 4, 5 | Y | N |
| MC | 20 °C | 20 °C | B | 1, 2, 3 | Υ | Ν |
| MC | 20 °C | 20 °C | Η | 1 ‡ | Υ | Ν |
| MC | 20 °C | 20 °C | Μ | 1, 2, 3 | Υ | Ν |
| SC | 20 °C | 20 °C | B | 1 | Y | N |
| SC | 20 °C | 20 °C | H | 1 | Y | N |
| MC | 20 °C | 25 °C | B | 1, 3 | Y | Y |
| MC | 20 °C | 25 °C | B | 2 | Y | N |
| SC | 20 °C | 25 °C | B | 1, 3 | Y | Y |
| SC | 20 °C | 25 °C | B | 2, 4 | Y | N |
-
*
MC, multi-copy reporter in strain FK181; SC, single-copy reporter in strain QL296.
-
†
B, Balskus lab isolate; H, Hunter lab isolate; M, Murphy lab isolate.
-
‡
Prepared training plates were stored at 4°C for 48 hr prior to start of training.
Table 2
Experimental conditions and results for PA14 avoidance (Choice) assay.
| Experiment | Genotype | Growth temp | PA14 isolate* | Light (L) Dark (D) | Azide (A) Cold (C) | F1 PA14 avoidance | F2 PA14 avoidance | Notes |
|---|---|---|---|---|---|---|---|---|
| 1.1 | N2 | 20 °C | B | L | C | Y | N | † |
| 1.2 | N2 | 20 °C | B | D | C | NA | N | † |
| 2 | N2 | 20 °C | B | L | A | N | N | ‡ |
| 3 | N2 | 20 °C | M | L | A | Y | N | |
| 4.1 | N2 | 20 °C | B | L | A | N | N | § |
| 4.2 | N2 | 20 °C | B | L | A | N | N | § |
| 5.1 | N2 | 25 °C | B | D | C | Y | N | ¶ |
| 5.2 | N2 | 25 °C | B | D | C | N | Y | ¶ |
| 6 | N2 | 20 °C | B | D | C | N | N | |
| 7 | sid-1(qt9) | 20 °C | B | D | C | N | NA | |
| 8 | sid-1(qt9) | 25 °C | B | L | C | N | NA | |
| 9 | sid-2(qt42) | 20 °C | B | D | C | N | NA | |
| 10 | sid-2(qt42) | 25 °C | B | L | C | N | NA |
-
*
B, Balskus lab isolate; M, Murphy lab isolate.
-
†
A single biological replicate was split and separately assayed in the light and dark.
-
‡
For the P0 choice assay, half the choice plates were treated with azide and half with cold induced rigor.
-
§
A single biological replicate was split and adult P0 worms and their embryos in one sample were centrifuged prior to bleach treatment with vigorous mixing (Exp 4.2).
-
¶
Two independent biological replicates were trained and assayed in parallel.
Table 3
FK181 genetic instability.
| Rol Progeny | non-Rol Progeny | ||||
|---|---|---|---|---|---|
| FK181 line | Starve-chunk cycle with first observed non-Rol | GFP+ | GFP- | GFP+ | GFP- |
| 1 | 4* | ||||
| 2 | 4 | +++ | |||
| 3 | 7 | + | + | +++ | |
| 4 | 7 | +++ | |||
| 5 | 7 | +++ | |||
| 6 | 7 | + | (+)† | +++ | |
| 7 | 7 | + | + | ||
| 8 | 8 | 241 progeny | 22% non-Rol, 81% GFP- | |||
| 9 | 8 | 167 progeny | 26% non-Rol, 46% GFP- | |||
-
FK181 was grown to starvation (6 days, 20 °C) on a small NG plate and then chunked to a fresh small NG plate and grown to starvation. The first observed non-Rol hermaphrodite (day 3) was a picked to a fresh plate the Rol and GFP phenotypes of the progeny recorded.
-
*
Sterile.
-
†
weak GFP.
Table 4
Putative endo-siRNA targeted genes implicated in host-pathogen responses.
| Gene | Summary description of predicted and/or documented activities |
|---|---|
| Y43F8B.2 | Predicted to enable kinase regulator activity and protein kinase A binding activity. Involved in innate immune response. |
| ilys-5 | Predicted to enable lysozyme activity. Predicted to be involved in defense response to Gram-positive bacterium. |
| acdh-1 | Predicted to enable acyl-CoA dehydrogenase activity. Involved in defense response to Gram-negative bacterium and innate immune response. |
| clec-218 | Involved in defense response to Gram-positive bacterium. |
| lys-6 | Predicted to enable lysozyme activity. Predicted to be involved in innate immune response and signal transduction. |
| lys-7 | Involved in defense response to other organisms. |
| clec-52 | Predicted to enable signaling receptor activity. Involved in defense response to Gram-positive bacterium. |
| spp-1 | Enables pore-forming activity. Involved in defense response to other organism and pore formation in membrane of another organism. Part of pore complex. |
-
Summarized descriptions from WormBase (WS291).
Key resources table
| Reagent type (species) or resource | Designation | Source or reference | Identifiers | Additional information |
|---|---|---|---|---|
| Strain, strain background (Caenorhabditis elegans) | N2 | Brenner, 1974 | WT | Obtained from CGC reference 257 |
| Strain, strain background (Caenorhabditis elegans) | FK181 | Murakami et al., 2001 | ksIs2 [daf-7p::gfp +rol-6(su1006)] | Obtained from CGC |
| Strain, strain background (Caenorhabditis elegans) | QL296 | Zhan et al., 2015 | drcSi89 [daf-7p::GFP; unc-119(+)] | Obtained from Queelim Ch’ng |
| Strain, strain background (Caenorhabditis elegans) | HC445 | Winston et al., 2002 | sid-1(qt9) | |
| Strain, strain background (Caenorhabditis elegans) | HC306 | Winston et al., 2007 | sid-2(qt42) | |
| Strain, strain background (Caenorhabditis elegans) | HC1221 | This study | rde-1(ne219); drcSi89 | |
| Strain, strain background (Caenorhabditis elegans) | HC1222 | This study | hrde-1(tm1200); drcSi89 | |
| Strain, strain background (Caenorhabditis elegans) | HC1223 | This study | sid-1(qt158); drcSi89 | |
| Strain, strain background (Caenorhabditis elegans) | HC1218 | This study | sid-2(qt42); drcSi89 | |
| Strain, strain background (Escherichia coli) | OP50 (H) OP50 (M) | Brenner, 1974 | OP50 (H) obtained from CGC OP50 (M) obtained from Coleen Murphy | |
| Strain, strain background (Pseudomonas aeruginosa) | PA14 (H) PA14 (B) PA14 (M) | PA14 (H) originated from Ausubel lab. PA14 (B) obtained from Balskus lab. PA14 (M) obtained from Coleen Murphy | ||
| Chemical compound, drug | Agar | Difco, BD | Cat # 214010 | |
| Chemical compound, drug | Bacto peptone | Gibco, Thermo Fisher Scientific | Cat # 211677 | |
| Chemical compound, drug | 5% Sodium hypochlorite (NaClO) | J.T. Baker, | Cat # 9416–01 | Stored in the dark at 4 °C (less than 3 months old; replace earlier if the resulting embryo prep displays low viability). |
| Software, algorithm | FIJI (1.53i-1.54f) | Schindelin et al., 2012 | ||
| Software, algorithm | R (4.3.1–4.3.2) | R Development Core Team, 2023 | ||
| Software, algorithm | RStudio (2023.09.01) | Posit Team, 2023 | ||
| Software, algorithm | Ggplot2 (3.4.4, 3.5.1) | Wickham, 2016 | ||
| Software, algorithm | Dplyr (1.1.2, 1.1.4) | Wickham et al., 2023 | ||
| Software, algorithm | DESeq2 (1.42.1) | Love et al., 2014 | ||
| Software, algorithm | EnhancedVolcano (1.20.0) | Blighe, 2023 | ||
| Software, algorithm | Scales (1.3.0) | Wickham et al., 2023 | ||
| Software, algorithm | Ggpubr (0.6.0) | Kassambra, 2023 | ||
| Software, algorithm | Grid (4.3.2) | R Development Core Team, 2023 |
Additional files
-
Supplementary file 1
PA14 training and choice assay protocol.
This is Craig Hunter’s distillation and clarification of protocols to train and assess learned and inherited PA14 avoidance in N2 animals through the F2 generation. Green highlights indicate known methodological difference from the Star Protocol (Moore et al., 2021b).
- https://cdn.elifesciences.org/articles/100254/elife-100254-supp1-v1.pdf
-
MDAR checklist
- https://cdn.elifesciences.org/articles/100254/elife-100254-mdarchecklist1-v1.docx
Download links
A two-part list of links to download the article, or parts of the article, in various formats.
Downloads (link to download the article as PDF)
Open citations (links to open the citations from this article in various online reference manager services)
Cite this article (links to download the citations from this article in formats compatible with various reference manager tools)
Reported transgenerational responses to Pseudomonas aeruginosa in Caenorhabditis elegans are not robust
eLife 13:RP100254.
https://doi.org/10.7554/eLife.100254.3


