Location- and feature-based selection histories make independent, qualitatively distinct contributions to urgent visuomotor performance
- Department of Psychology, Wake Forest University, United States
- Department of Translational Neuroscience, Wake Forest University School of Medicine, United States
Figures
Figure 1 with 1 supplement
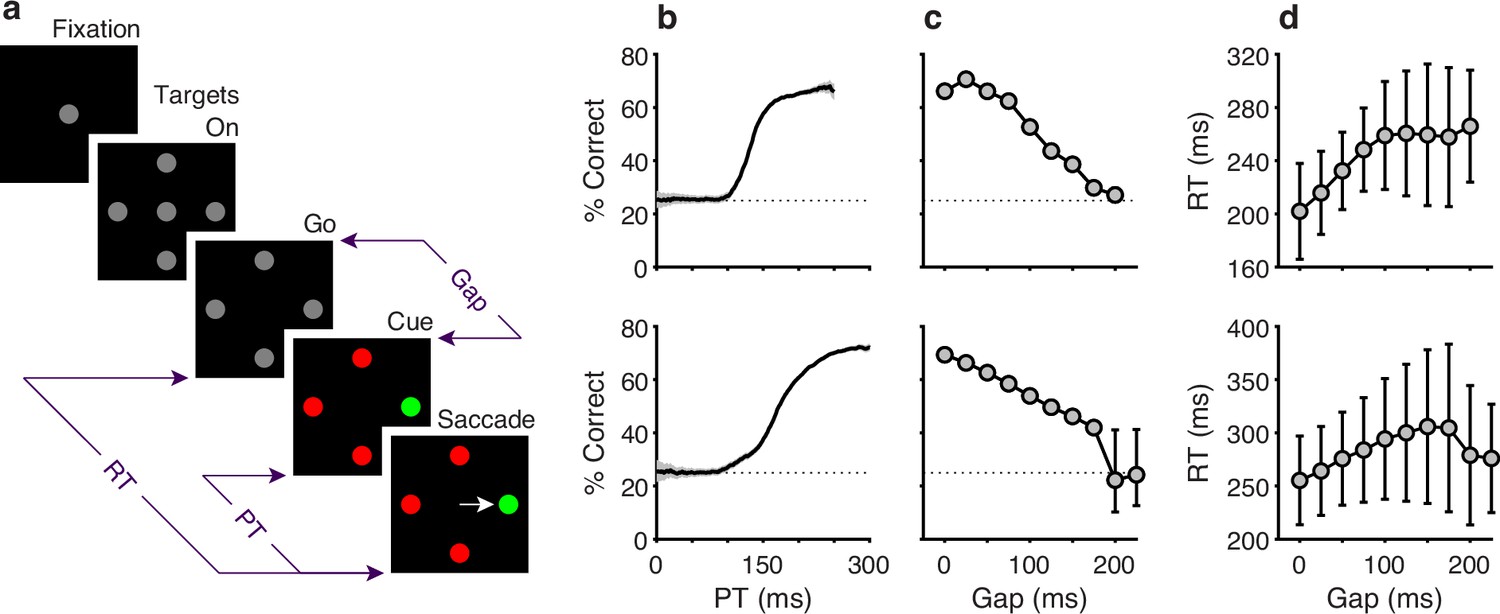
Behavioral task and psychophysical performance from two monkeys.
(a) The compelled oddball (CO) task. Trials begin when the subject fixates on the central gray spot (Fixation). Four gray placeholders then appear (Targets On) separated by 90° surrounding the fixation spot (at variable eccentricities and orientations across days). Urgency is incorporated by next extinguishing the fixation spot (Go), which instructs the subject to respond. After a variable time delay (Gap, 0–225 ms), the target and distracter identities are revealed (Cue). A correct choice requires a saccade to the stimulus with a unique color, the oddball stimulus, within 450 ms of the go signal. The reaction time (RT) is measured from the go signal to saccade onset. The processing time (PT) interval is the maximum amount of time during which the cue can inform the choice. (b) Tachometric curves showing the percentage of correct responses as a function of PT for monkey C (top; 26,038 trials) and monkey N (bottom; 45,173 trials). Gray shades represent 95% confidence intervals (CIs). Chance performance (25%) is indicated by dotted lines. PT bin size is 50 ms. (c) Mean percentage of correct choices as a function of gap for monkey C (top) and monkey N (bottom). Error bars indicate 95% CIs. (d) Mean RT as a function of gap for monkey C (top) and monkey N (bottom). Error bars indicate ±1 standard deviation.
Figure 1—figure supplement 1

Variability in performance across animals and rule sets.
(a, b) Task performance for monkey C (a) and monkey N (b) in the current study; during the compelled oddball (CO) task, target colors and locations were randomly sampled across trials. Tachometric curves show performance on the current trial conditioned on the histories of preceding trials having the same target color (S, blue spectrum; 1S–4S sequences; dark to light) or a different target color (D, red spectrum; 1D–4D sequences; dark to light). (c) Task performance for monkey I from a previous study (Scerra et al., 2019). This subject ran a version of the CO task in which target locations were randomly sampled, but target color remained constant for each block of (10–200) trials. The red curve represents average performance from the first 5 trials following a color switch. The blue curve denotes average performance on a block of trials but excluding the first 5 trials after a color switch. (d) Task performance for monkey R from a previous study (Scerra et al., 2019). This subject ran a version of the CO task in which target locations were randomly sampled, but target color did not change. Bin width is 50 ms for all curves. The gray trace in each panel shows the average tachometric curve obtained from all the trials considered.
Figure 2 with 2 supplements

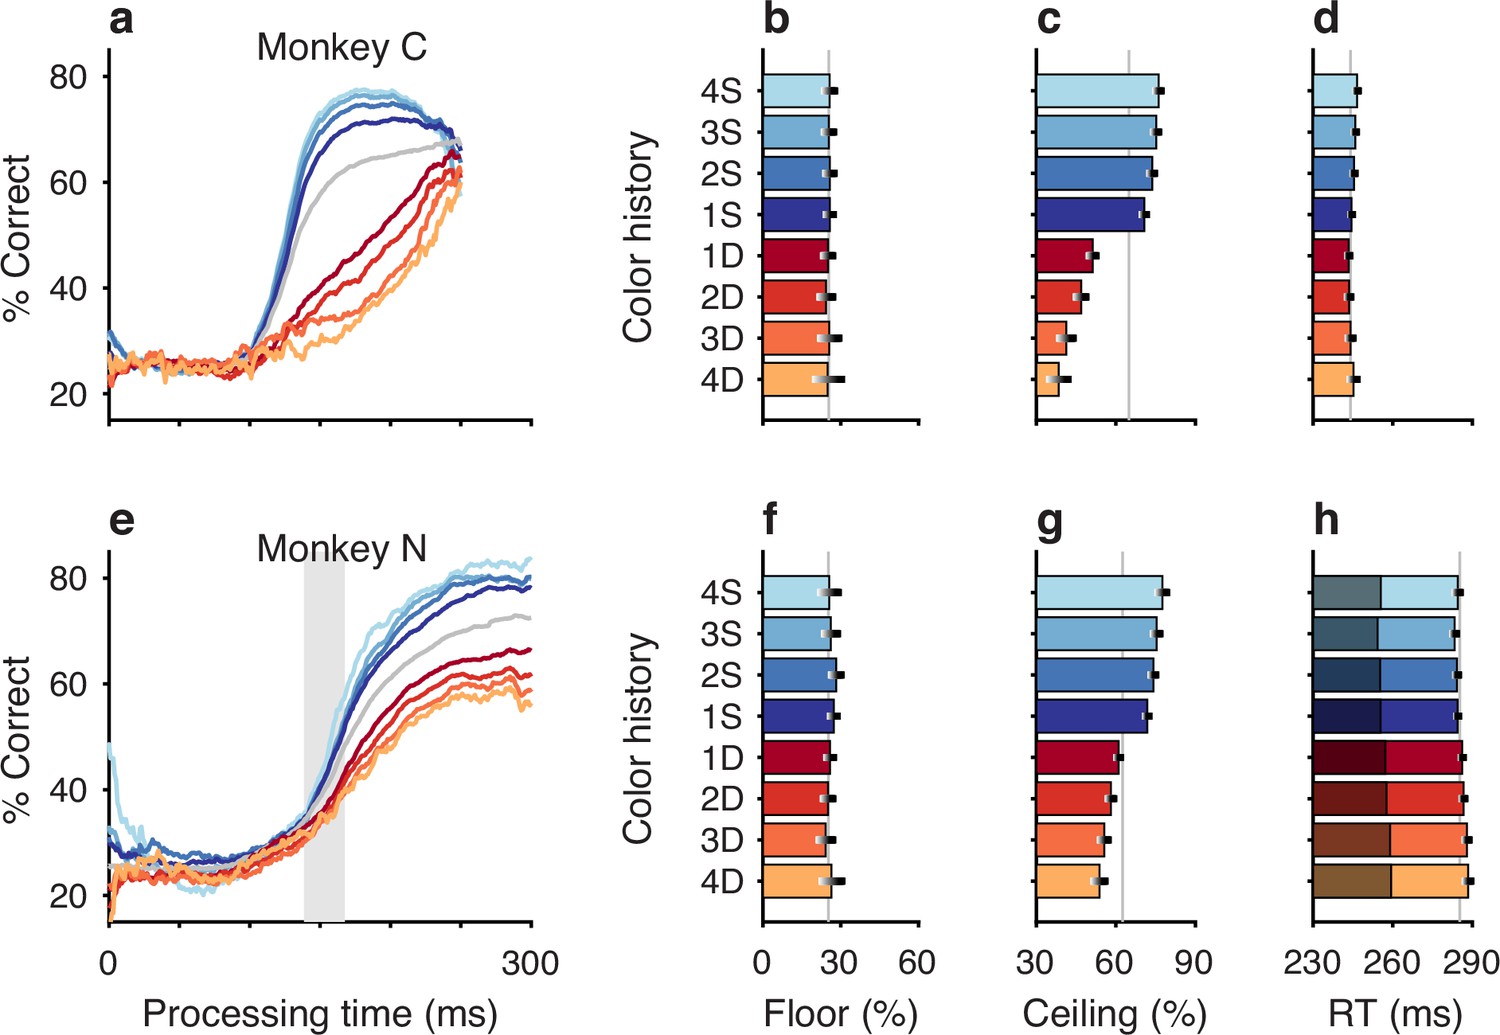
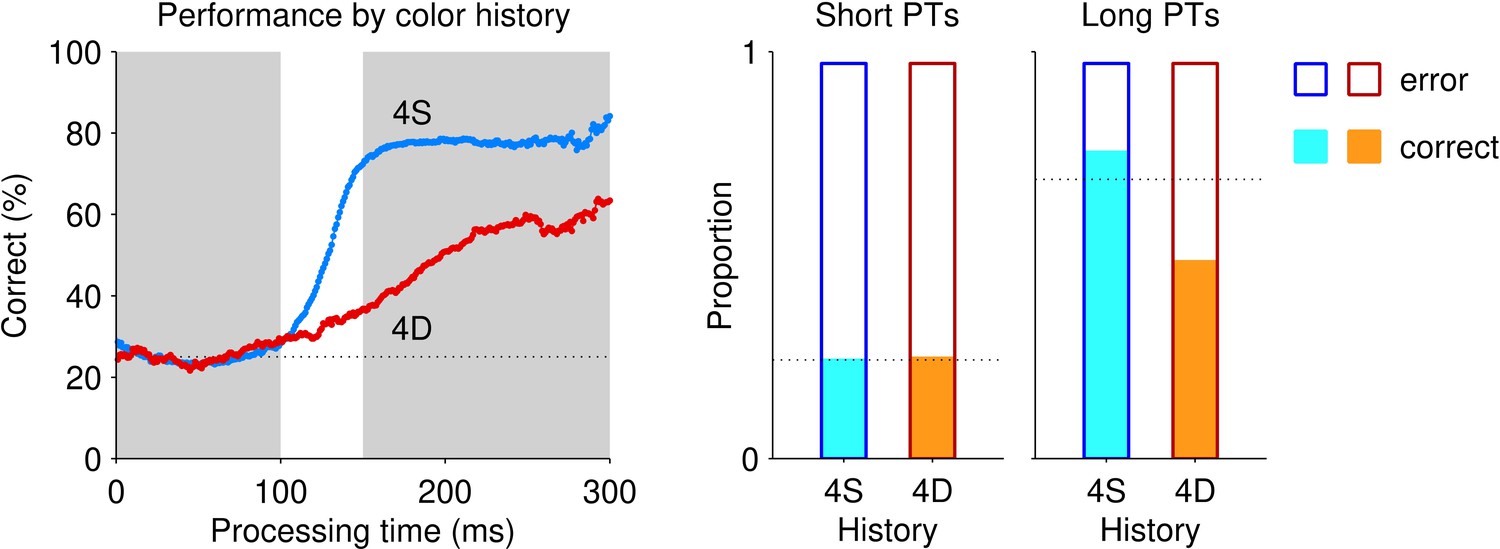
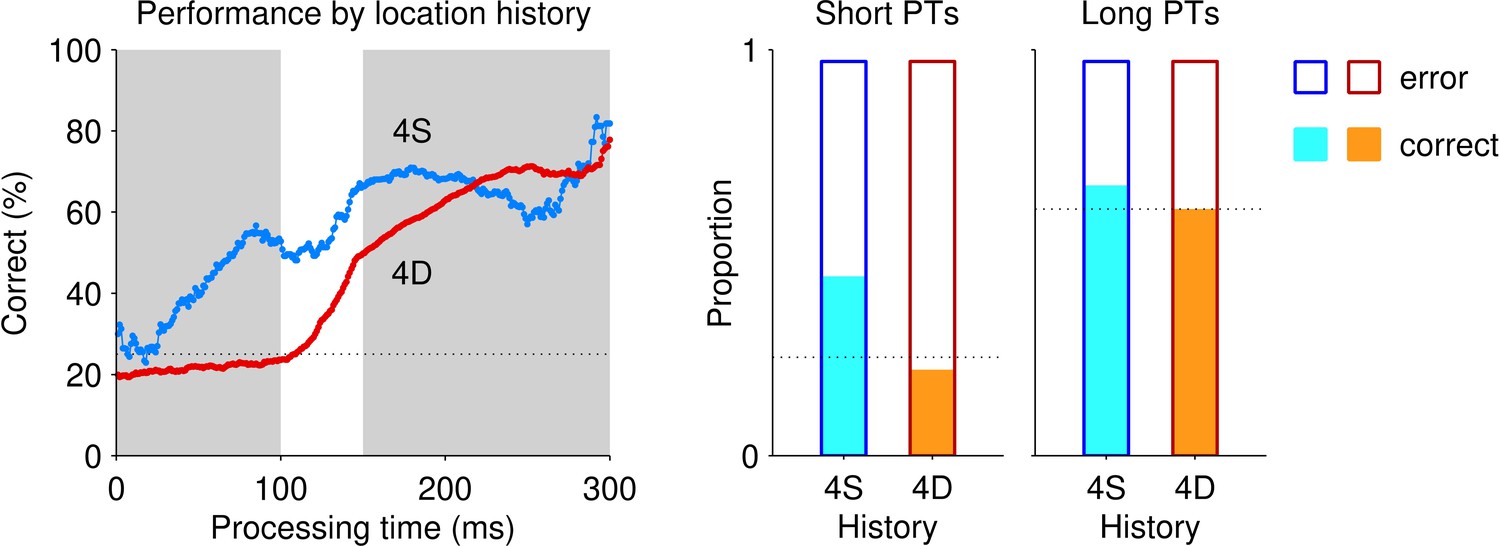
Repetitions and switches of target color and target location cause distinct modulations of performance in the compelled oddball (CO) task.
Each panel shows results for performance on the current trial conditioned on the history of preceding trials when current and past trials are the same (S, blue spectrum; color or location repeats) or different (D, red spectrum; color or location switches). Both S and D sequences go back 1–4 trials into the past. (a) Tachometric curves conditioned on target color history. Performance is shown as a function of processing time (PT) for eight different history sequences. Average performance is shown in gray. Bin width is 50 ms for all curves. For clarity, error bars are omitted. (b) Choice accuracy (x axis, percent correct) in short-PT trials (PT <100 ms, floor) conditioned on color history (y axis). Error bars represent 95% confidence intervals (CIs) across trials. Gray vertical line denotes value for the average tachometric curve. (c) Choice accuracy in long-PT trials (PT >150 ms, ceiling) conditioned on color history. Same format as in b. (d) Average reaction time (RT) (x axis, in ms) conditioned on color history (y axis). Error bars show ±1 standard error of the mean (SEM). The gray vertical line denotes average RT across all trials. (e) Tachometric curves conditioned on target location history. (f) Choice accuracy in short-PT trials (PT <100 ms, floor) conditioned on location history. (g) Choice accuracy in long-PT trials (PT >150 ms, ceiling) conditioned on location history. (h) Average RT conditioned on location history.
Figure 2—figure supplement 1
Target color repetition affects perceptual accuracy in a consistent manner across subjects.
(a–d) Task performance for monkey C. (e–h) Task performance for monkey N. (a, e) Individual subject tachometric curves denoting performance on the current trial conditioned on histories of preceding trials having the same target color (S, blue spectrum; 1–4 preceding trials) or different target color (D, red spectrum; 1–4 preceding trials). Average performance is shown in gray. The vertical gray shade represents the 29 ms shift used to align the data from monkey N with those from monkey C; it represents the centerpoints of the average tachometric curve of monkey N before (right edge of the shade) and after the shift (left edge of the shade). (b, f) Choice accuracies in short-processing time (PT) trials (PT <100 ms, floor). Error bars represent 95% confidence intervals (CIs). Gray vertical lines denote values for the average tachometric curves. (c, g) Choice accuracies in long-PT trials (PT >150 ms, ceiling). Error bars represent 95% CIs. Gray vertical lines denote values for the average tachometric curves. (d, h) Average reaction time (RT) ± 1 standard error of the mean (SEM) for each history condition. The gray vertical lines denote the average RTs across all trials included in the analysis. Dark bars in h depict the aligned RT of monkey N shifted by 29 ms.
Figure 2—figure supplement 2
Target color repetition affects decision accuracy in a consistent manner across colors.
(a) Tachometric curves denoting performance on green-target trials (see target array inset) conditioned on histories of preceding trials having the same target color (blue spectrum; 1–4 preceding green trials) or a different target color (red spectrum; 1–4 preceding red trials). (b) Choice accuracy in short-processing time (PT) trials (PT <100 ms, floor) conditioned on color history. Error bars represent 95% confidence intervals (CIs) across trials. Gray vertical line denotes value for the average tachometric curve. (c) Choice accuracy in long-PT trials (PT >150 ms, ceiling) conditioned on color history. Error bars represent 95% CIs across trials. Gray vertical line denotes value for the average tachometric curve. (d) Average reaction time (RT) ± 1 standard error of the mean (SEM) conditioned on color history. Gray vertical line denotes average RT across all trials included in the analysis. (e–h) As in a–d but for red targets among green distracters (see target array inset).
Figure 3
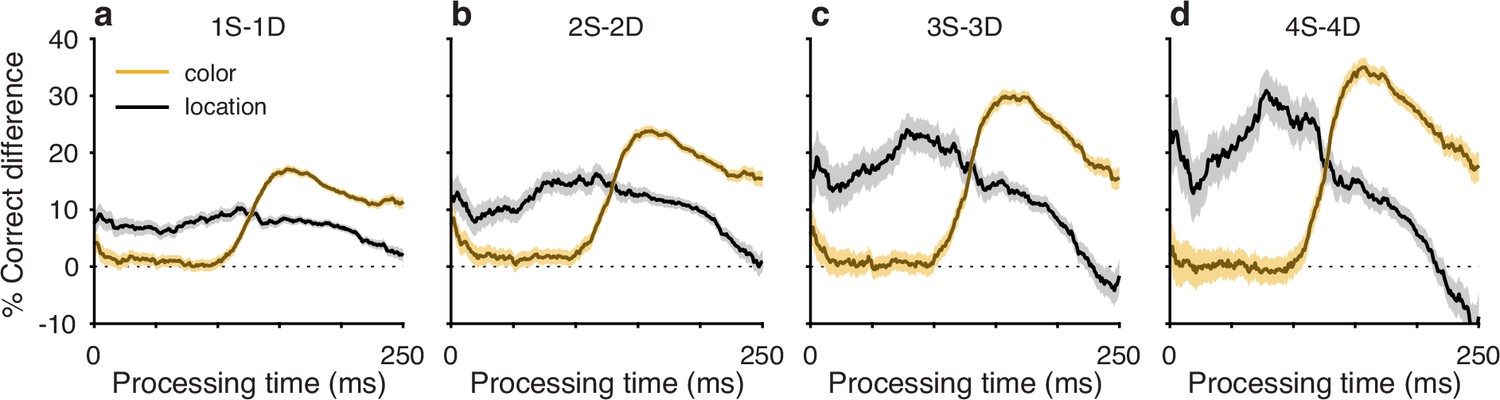
History effects due to target color and target location have distinct temporal manifestations within the time course of a trial.
Each curve plots the difference between two tachometric curves, one conditioned on same (S) trials and another conditioned on different (D) trials. Each panel shows two curves, one for color history (gold traces) and another for location history (black traces), with shaded error bands indicating ± 1 SE across trials. Dotted lines at zero mark no difference in performance given S and D histories. (a) Difference curves for histories going back 1 trial (1S – 1D). (b) Difference curves for histories going back 2 trials (2S – 2D). (c) Difference curves for histories going back 3 trials (3S – 3D). (d) Difference curves for histories going back 4 trials (4S – 4D). Note that the location bias is strongest at short processing times (PTs) and then declines, whereas the color bias rises sharply after ∼100 ms of PT.
Figure 4
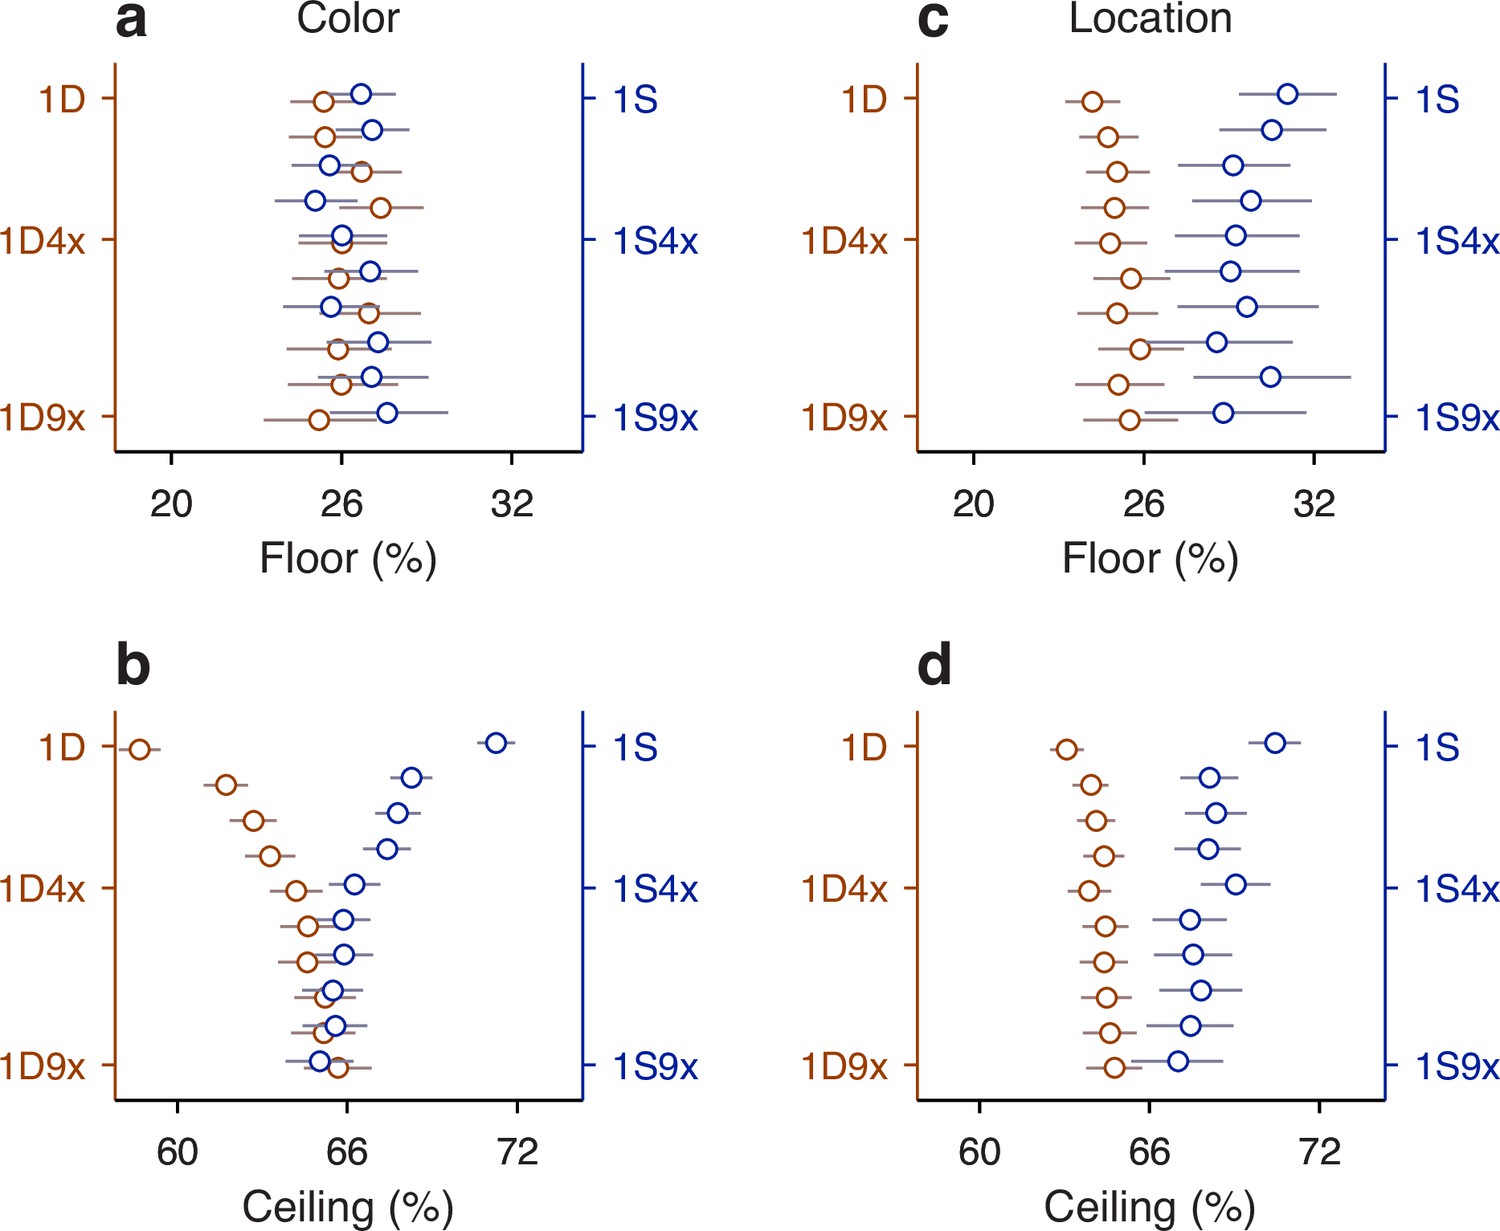
The timescale of history effects induced by a single repeat or a single switch varies across history types.
(a) Task performance during uninformed choices (floor, percent correct) following a single-color repetition (1S; blue axis) or color switch (1D; brown axis) that occurred 1–10 trials prior to the trial being evaluated. The notation Nx indicates N intervening trials of any type between the first event and the repeat or switch. (b) As in a, but for performance during informed choices (ceiling). (c) Task performance during uninformed choices (floor, percent correct) following a target location repetition (1S, blue axis) or target location switch (1D, red axis) that occurred 1–10 trials prior to the trial being evaluated. (d) As in c, but for performance during informed choices (ceiling). In all plots, error bars represent 95% confidence intervals (CIs).
Figure 5

Perceptual accuracy is strongly modulated by the joint history of target color and trial outcome.
(a–d) Task performance in color repeats. Data are conditioned on the histories of preceding trials having the same target color (S) and resulting in either correct (C, green spectrum; 1–4 preceding correct trials) or error outcomes (E, purple spectrum; 1–4 preceding error trials). (e–h) Task performance in color switches. Data are conditioned on the histories of preceding trials having a different (D) target color and resulting in either correct (C, green spectrum; 1–4 preceding correct trials) or error outcomes (E, purple spectrum; 1–4 preceding error trials). Formatting for the tachometric curves (a, e), floor accuracies (b, f), ceiling accuracies (c, g), and mean reaction times (RTs) (d, h) is the same as in Figure 2. The gray shaded areas in a and e indicate ranges of history effects obtained without taking outcome history into account, for color repeats (from 1S–4S in Figure 2a, blue curves) and color switches (from 1D–4D in Figure 2a, red curves), respectively.
Figure 6

Motor bias is strongly modulated by the joint history of target location and trial outcome.
The format of this figure is exactly the same as that of Figure 5, except that it considers the joint history of target location and trial outcome (rather than target color and trial outcome). The gray shaded areas in a and e indicate ranges of history effects obtained without taking outcome history into account, for location repeats (from 1S–4S in Figure 2e, blue curves) and location switches (from 1D–4D in Figure 2e, red curves), respectively.
Figure 7
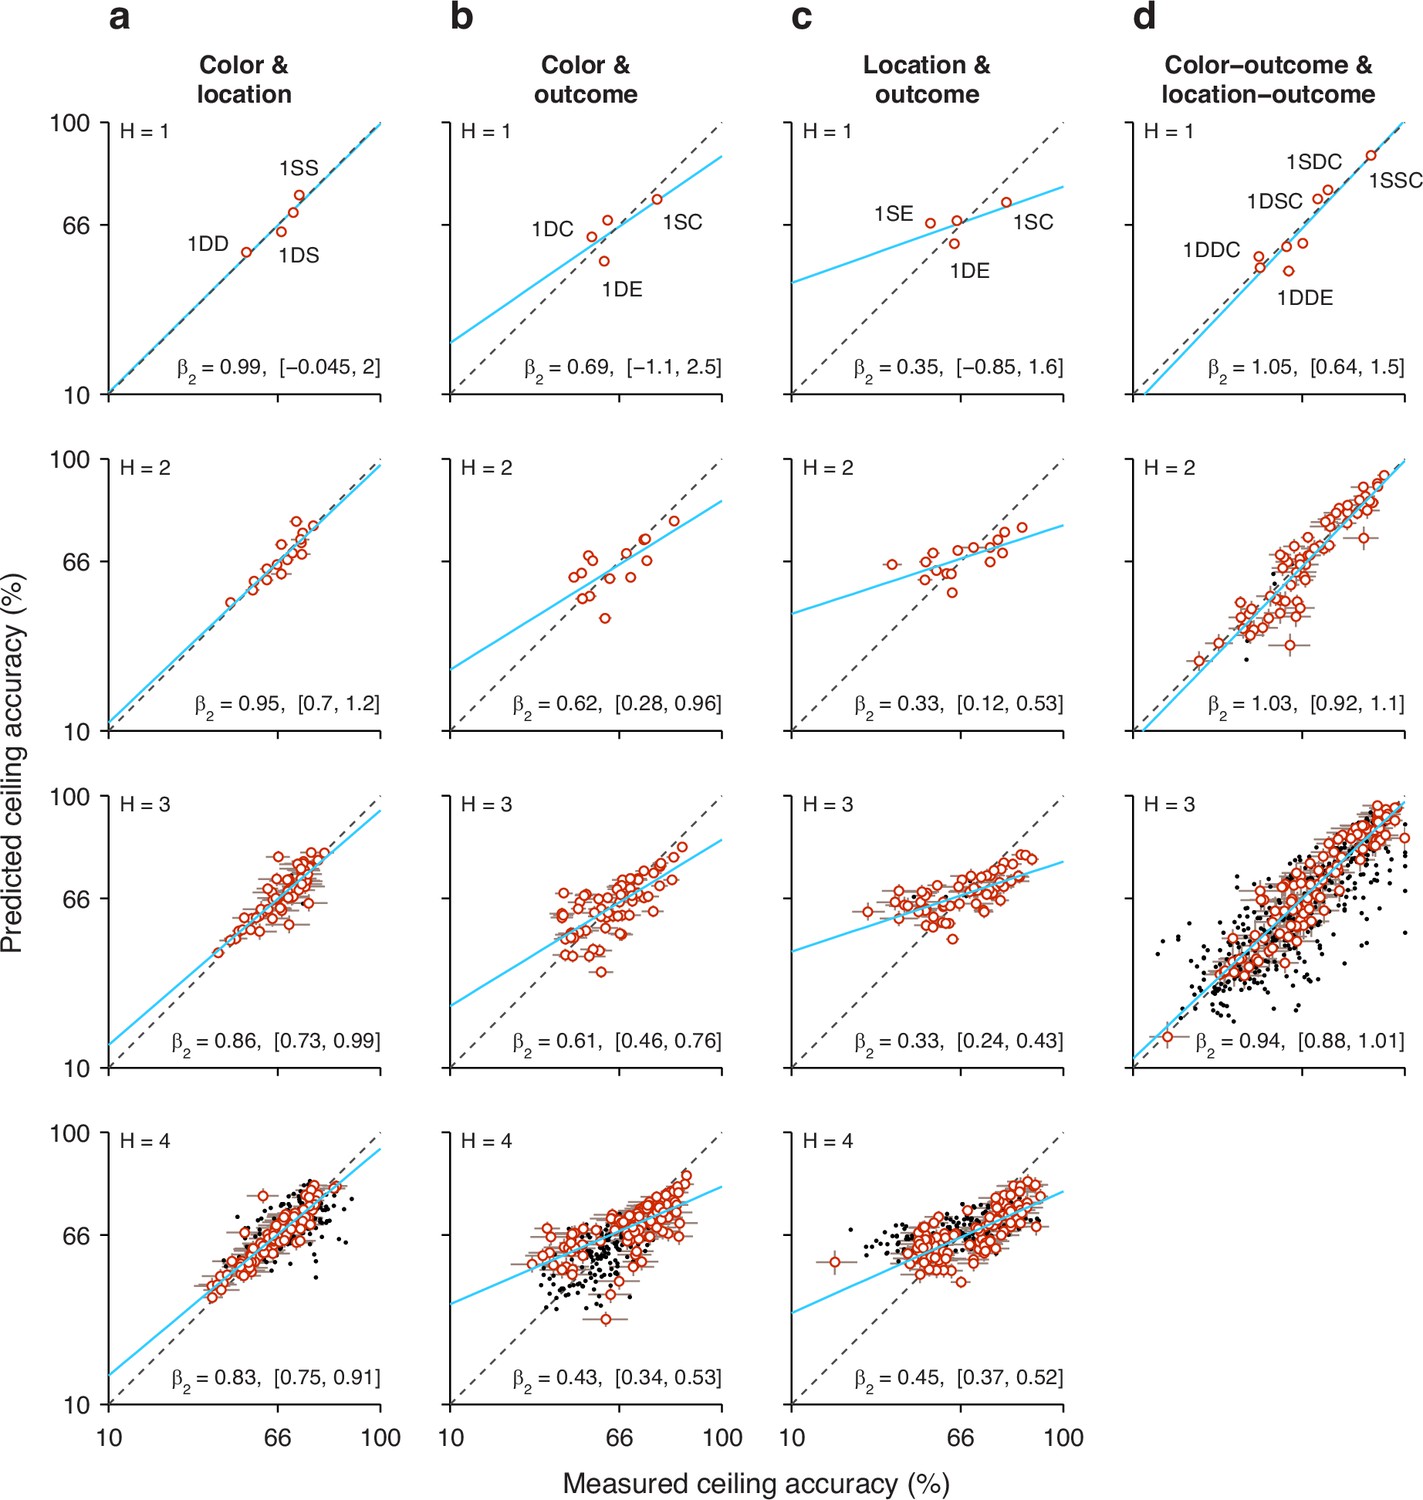
Tests of interaction between individual histories.
Each panel plots the predicted task performance at long processing times (PTs) (ceiling accuracy) based upon independent contributions from two history effects (y axis), contrasted with the actual, measured task performance (x axis). Rows correspond to comparisons based on histories going 1, 2, 3, or 4 trials back (H, from top to bottom). Each point represents one specific history sequence. Labels in top panels identify a few combined history sequences in each case. Error bars represent 95% confidence intervals (CIs). Red and black identify individual points with CI spans smaller (red) or larger (black) than 15 percentage points, which divides the data into high- and low-reliability points. Regression lines based on the red points are plotted in blue, with the slope (β2) and its 95% CI indicated in each case. Dotted diagonal lines indicate equality. Note that the overall probability of success across all trials is 66% correct. (a) Interaction between target color and target location histories. (b) Interaction between target color and outcome histories. (c) Interaction between target location and outcome histories. (d) Interaction between target color and target location histories, each combined with outcome. Note that the joint effect of color and location histories is highly predictable based on their individual effects on performance.
Figure 8
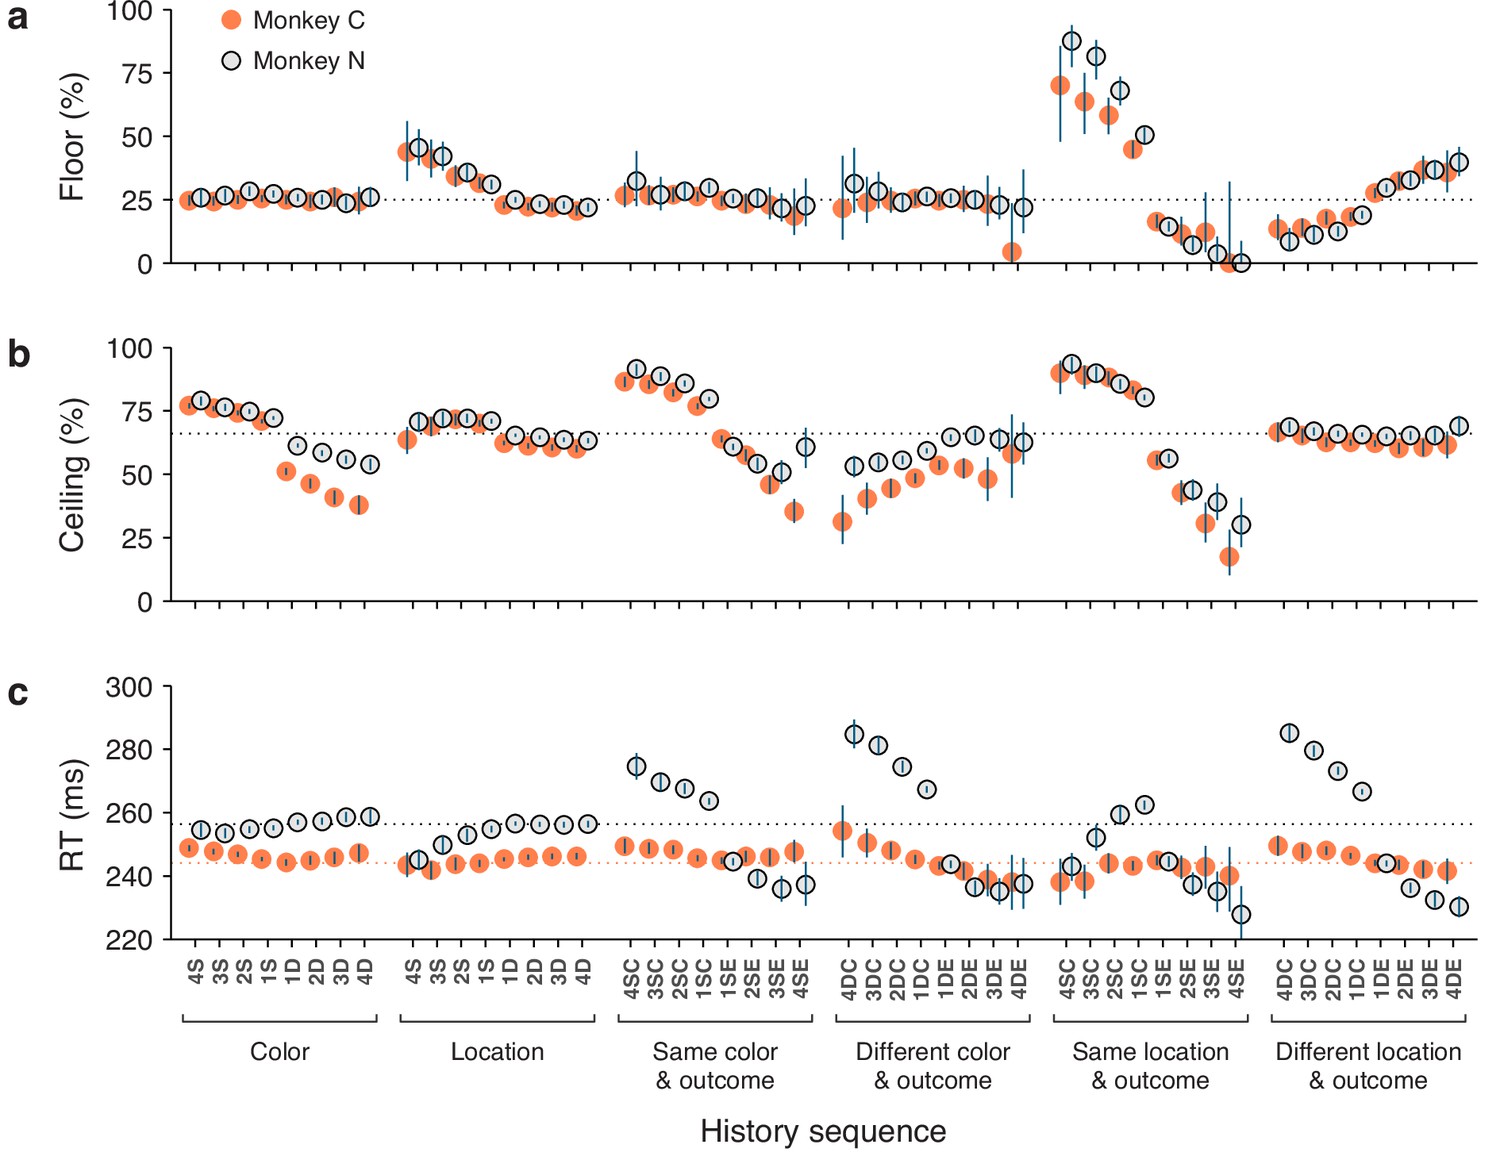
Consistency of history effects across individual subjects.
The data in this figure are analogous to the bar plots shown in Figures 2, 5, and 6, but for each of the two monkeys. In each panel, the x axis indicates specific history sequences (see labels in c). On the y axes, orange filled circles are results from monkey C and open circles are from monkey N. For clarity, the two sets of data points are slightly offset from each other along the x axis. Blue error bars indicate 95% confidence intervals (CIs) across trials. (a) Choice accuracy (percent correct) in short-processing time (PT) trials (PT <100 ms, floor) conditioned on each history sequence. The dotted line marks chance performance (25% correct). (b) Choice accuracy (percent correct) in long-PT trials (PT >150 ms, ceiling) conditioned on each history sequence. The dotted line marks average performance for informed choices (66% correct). (c) Mean reaction time (RT) conditioned on each history sequence. Data points include all trials in each condition (correct and incorrect, all PTs). The dotted lines mark the overall mean RTs for the two monkeys (with the RTs of monkey N shifted by 29 ms; Methods).
Author response image 1
Author response image 2
Additional files
Download links
A two-part list of links to download the article, or parts of the article, in various formats.
Downloads (link to download the article as PDF)
Open citations (links to open the citations from this article in various online reference manager services)
Cite this article (links to download the citations from this article in formats compatible with various reference manager tools)
Location- and feature-based selection histories make independent, qualitatively distinct contributions to urgent visuomotor performance
eLife 13:RP100280.
https://doi.org/10.7554/eLife.100280.3


