Direct and indirect salt effects on homotypic phase separation
- Department of Chemistry, University of Illinois Chicago, United States
- Department of Physics, University of Illinois Chicago, United States
Figures
Figure 1 with 1 supplement
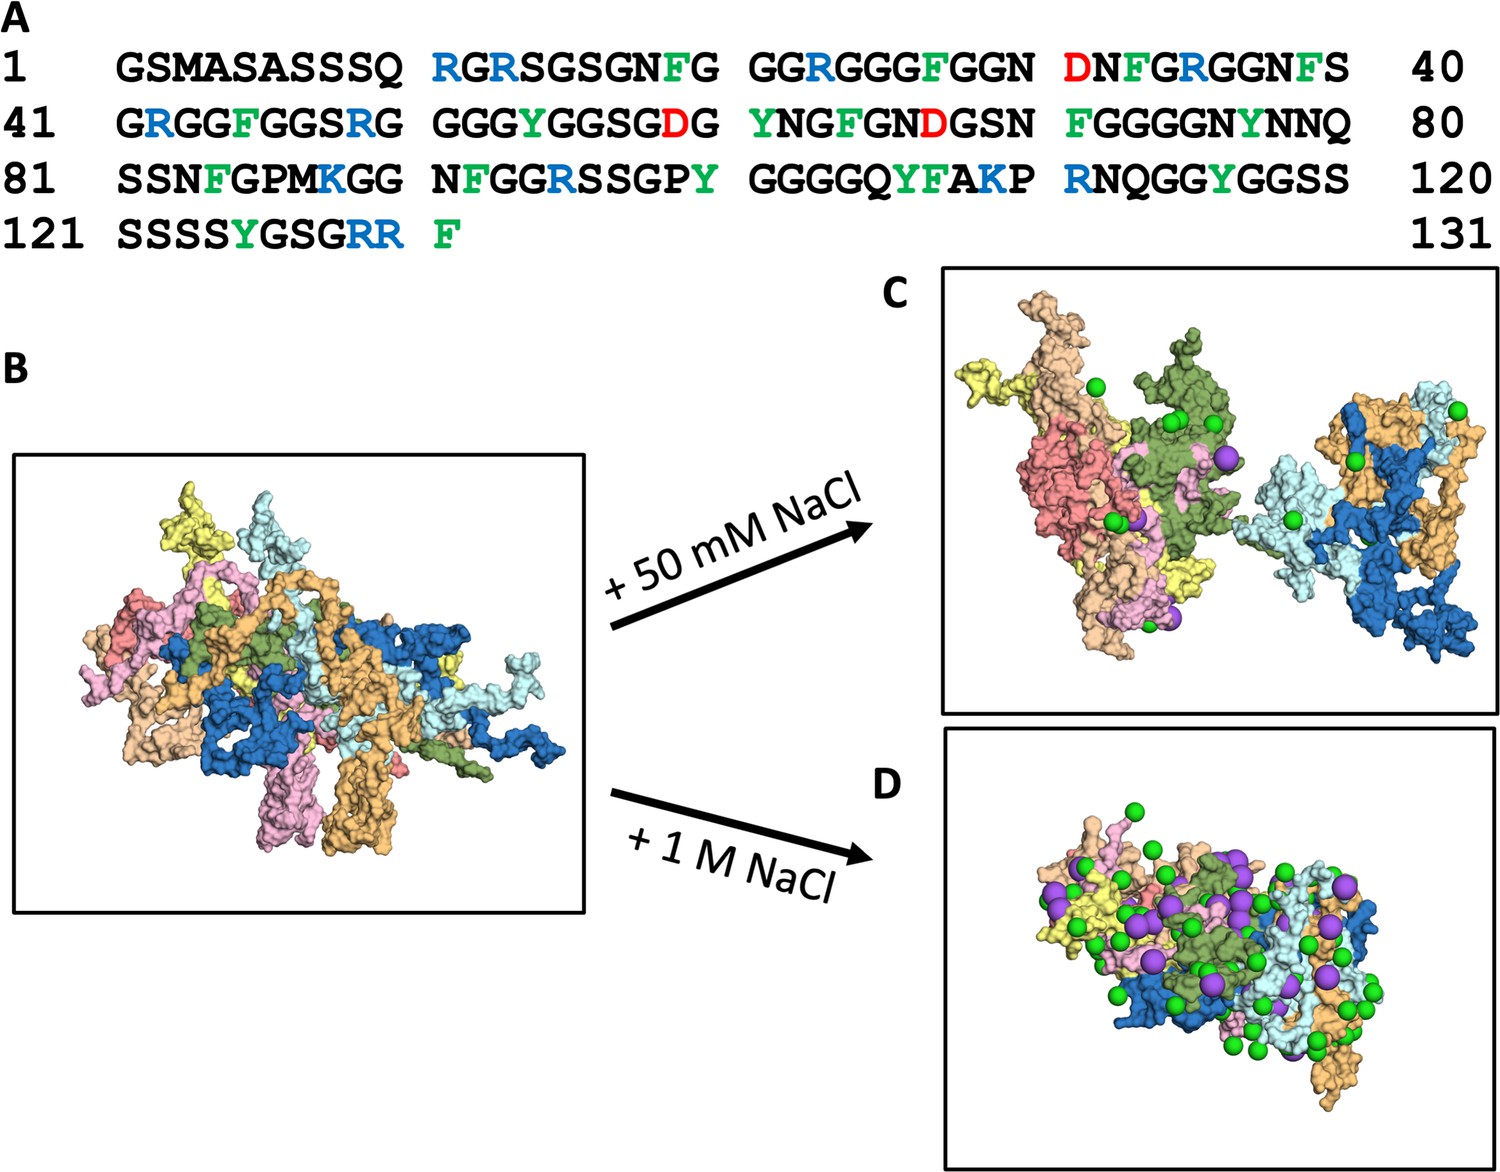
Amino-acid sequence of A1-LCD and molecular dynamics simulations of its condensation.
(A) Amino-acid sequence. (B) First frame and (C, D) a frame at 1000 ns from 1.5-μs simulations of the 8-chain systems at low and high salt. In all figures, Cl– or Na+ ions are represented by green and magenta spheres, respectively.
Figure 1—figure supplement 1
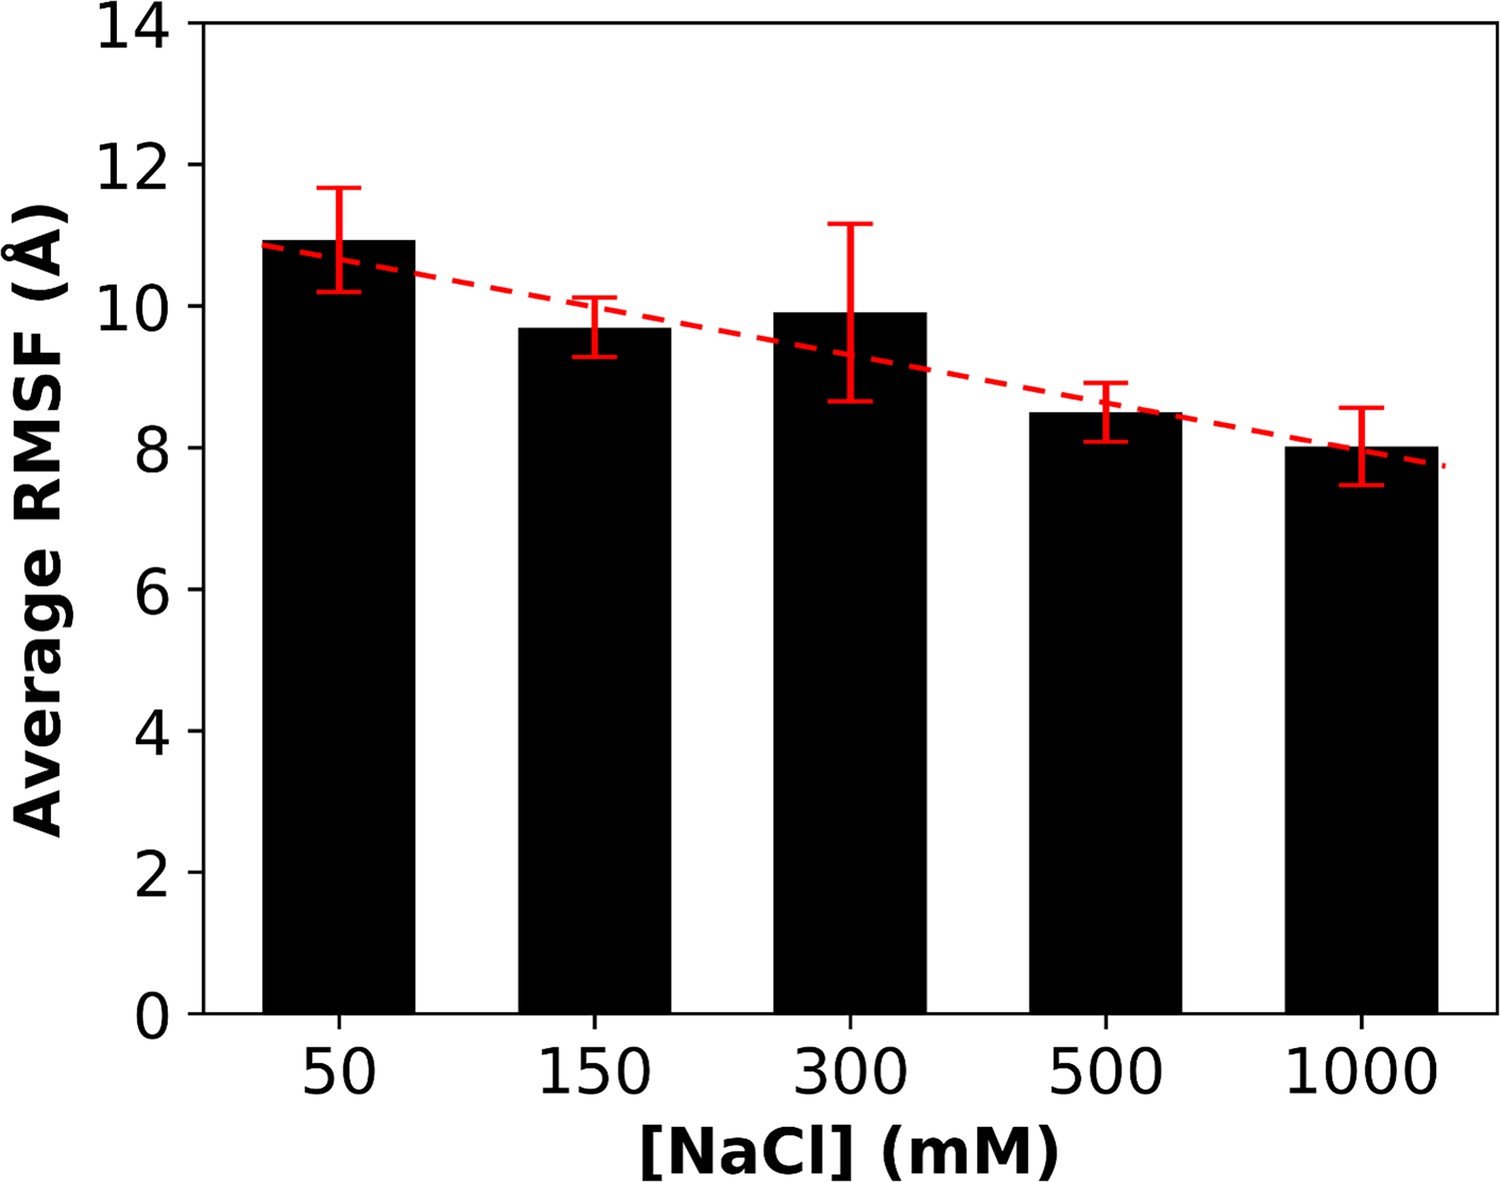
Salt dependence of the average root-mean-square-fluctuation (RMSF) among the eight chains.
Error bars represent standard deviations among four replicate simulations.
-
Figure 1—figure supplement 1—source data 1
Source data for Figure 1—figure supplement 1.
- https://cdn.elifesciences.org/articles/100282/elife-100282-fig1-figsupp1-data1-v1.xlsx
Figure 2
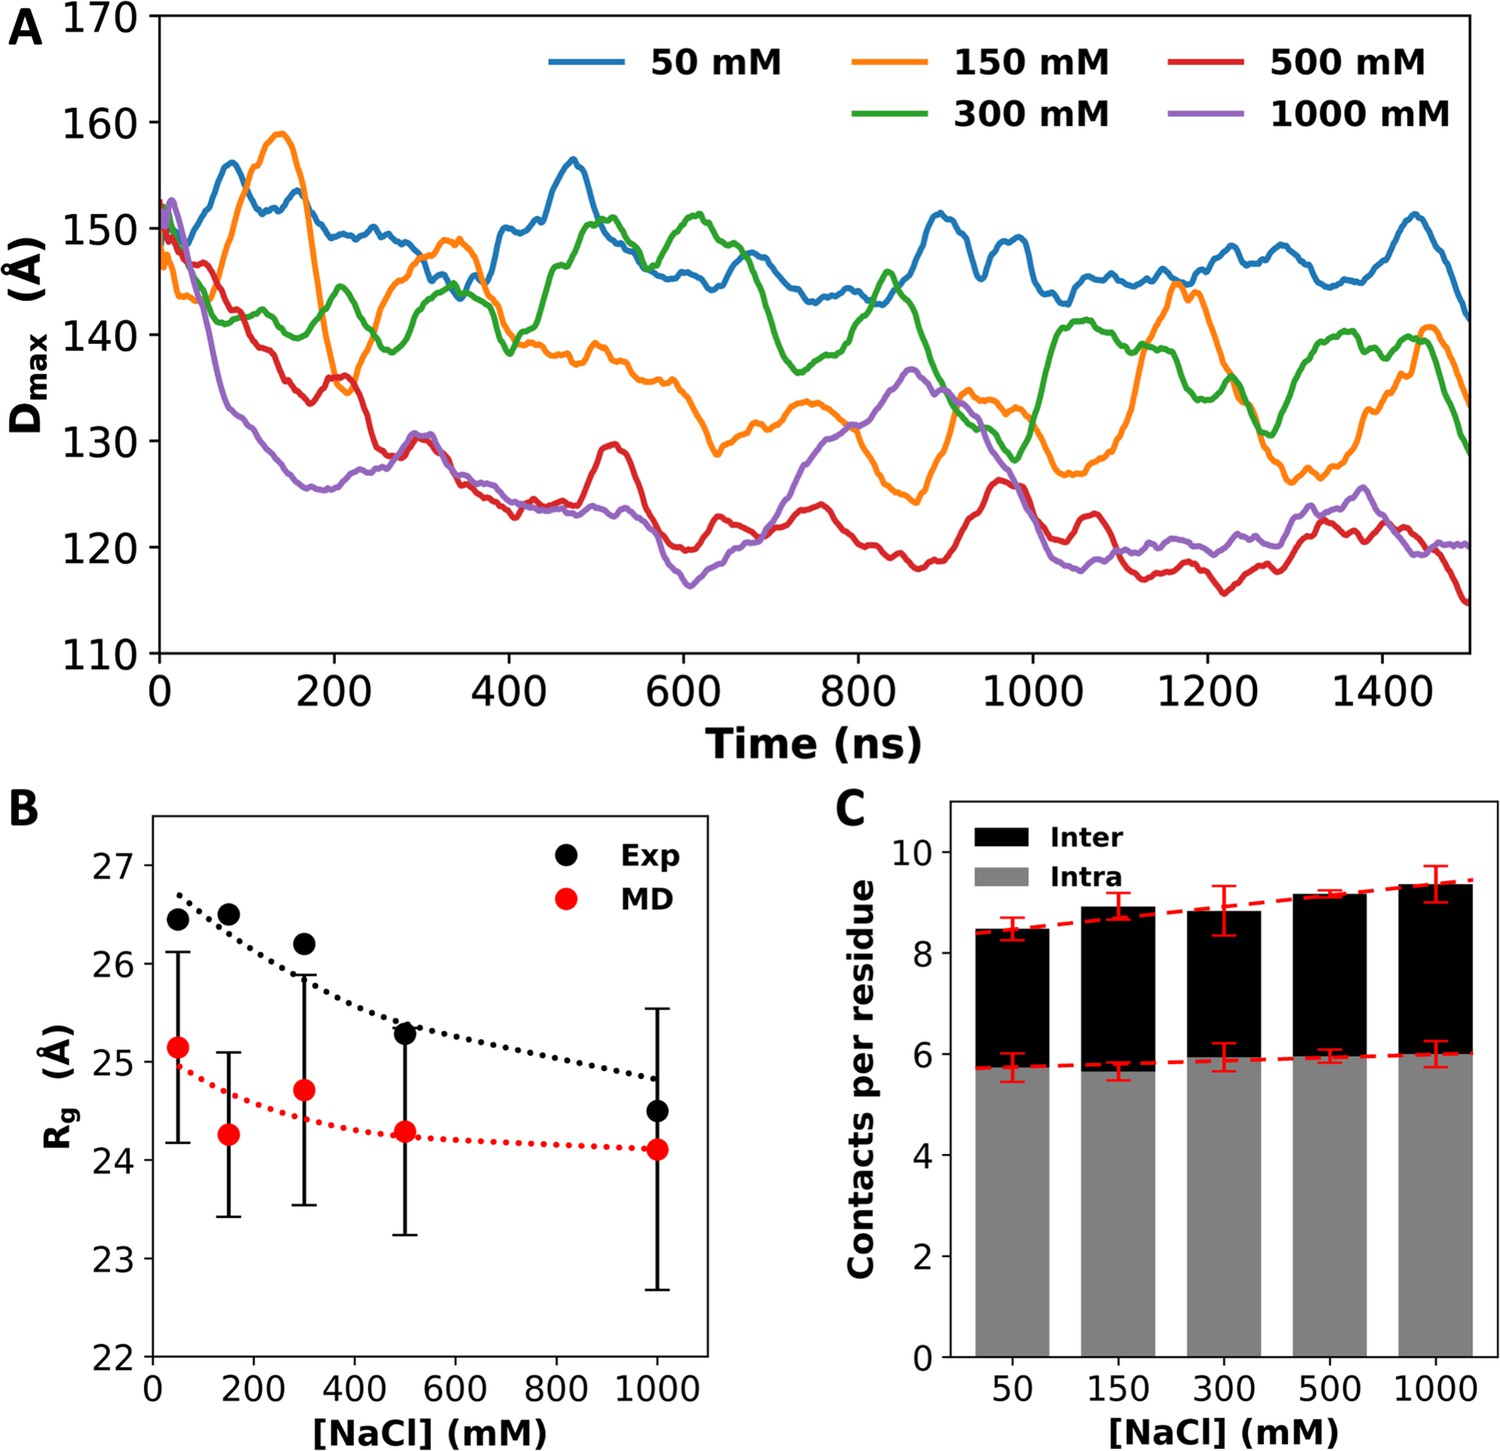
Salt effects on A1-LCD condensation and inter-chain interactions.
(A) Dmax values, averaged over four replicates, as a function of simulation time. (B) Radii of gyration (Rg) from small-angle X-ray scattering (Martin et al., 2021) and from molecular dynamics (MD) simulations. Dotted curves are drawn to guide the eye. (C) Average number of inter- or intrachain contacts per residue at each salt concentration. Dashed lines are drawn to show trends. Error bars represent standard deviations among four replicate simulations.
-
Figure 2—source data 1
Source data for Figure 2.
- https://cdn.elifesciences.org/articles/100282/elife-100282-fig2-data1-v1.xlsx
Figure 3 with 2 supplements
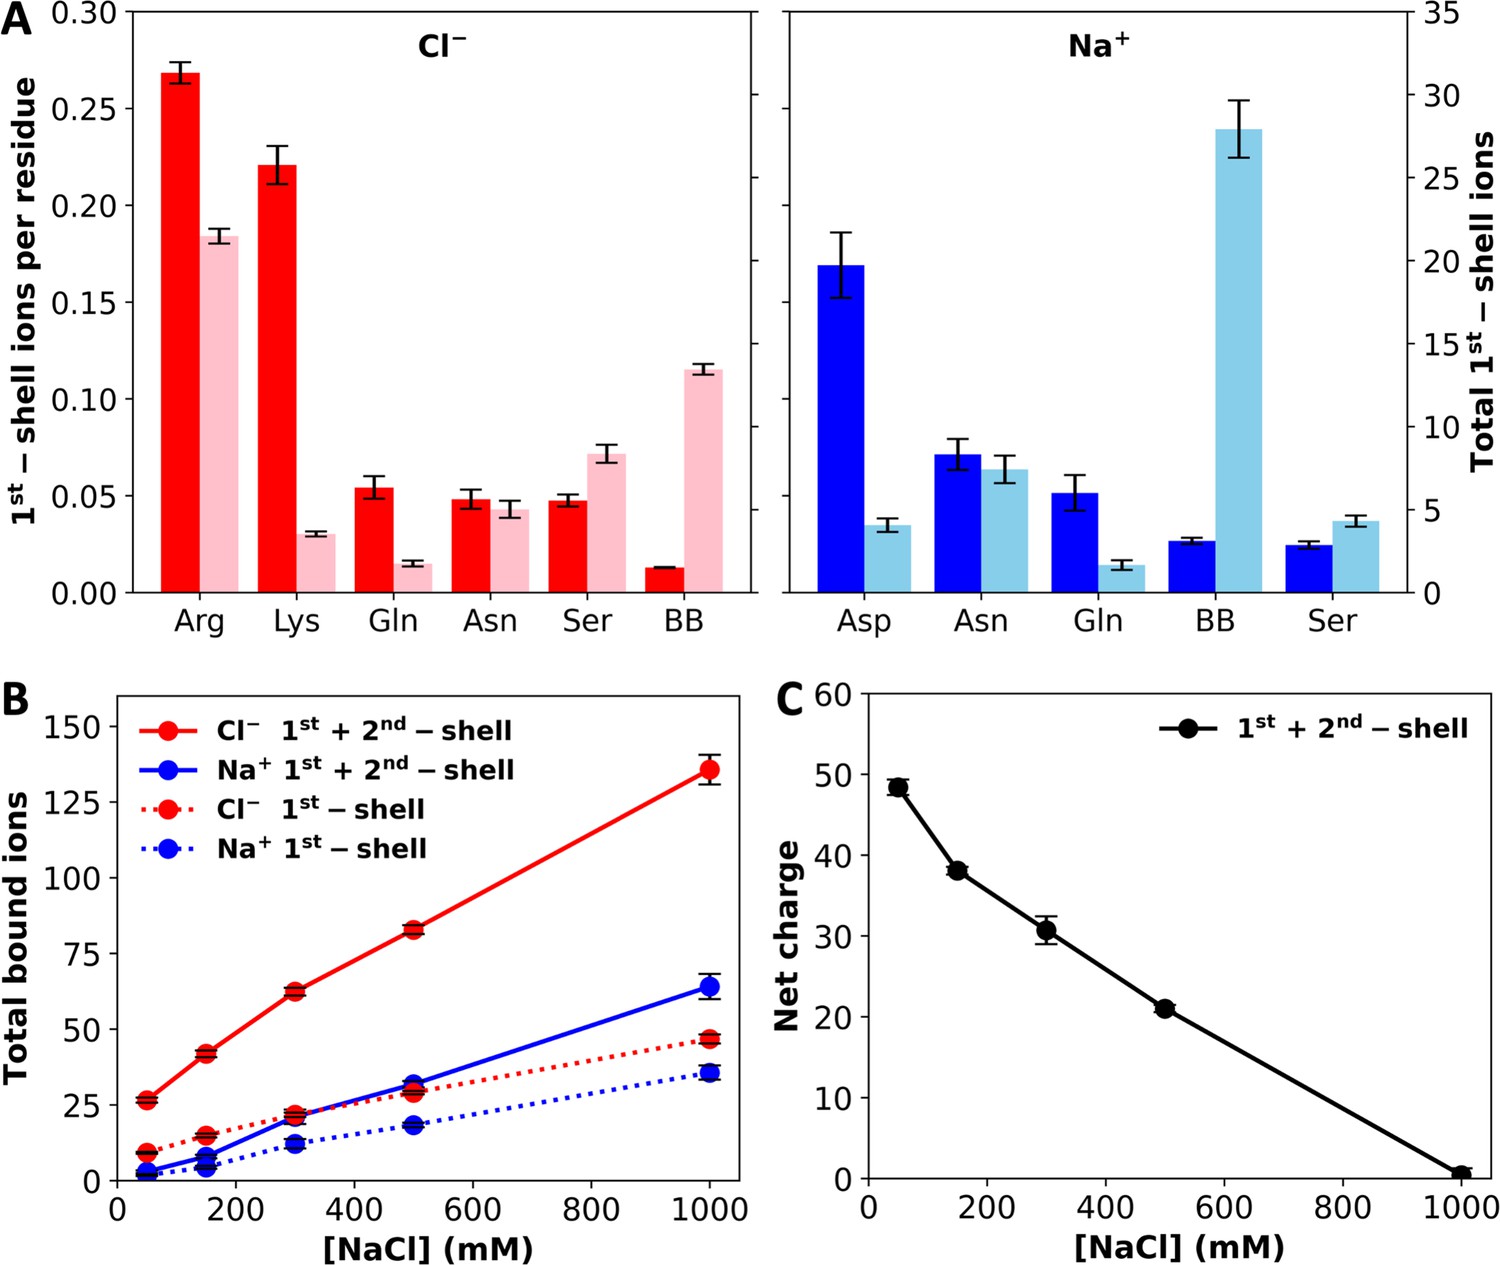
Levels of ion binding at different NaCl concentrations.
(A) Number of 1st-shell ions, with (darker colors; tick marks on the left vertical axis) and without (lighter colors; tick marks on the right vertical axis) normalization by the number of residues of a given amino-acid type, at 1000 mM NaCl. (B) Total number of 1st-shell only or 1st- and 2nd-shell ions. (C) Net charge of the system with 1st- and 2nd-shell ions included. Error bars represent standard deviations among four replicate simulations.
-
Figure 3—source data 1
Source data for Figure 3.
- https://cdn.elifesciences.org/articles/100282/elife-100282-fig3-data1-v1.xlsx
Figure 3—figure supplement 1
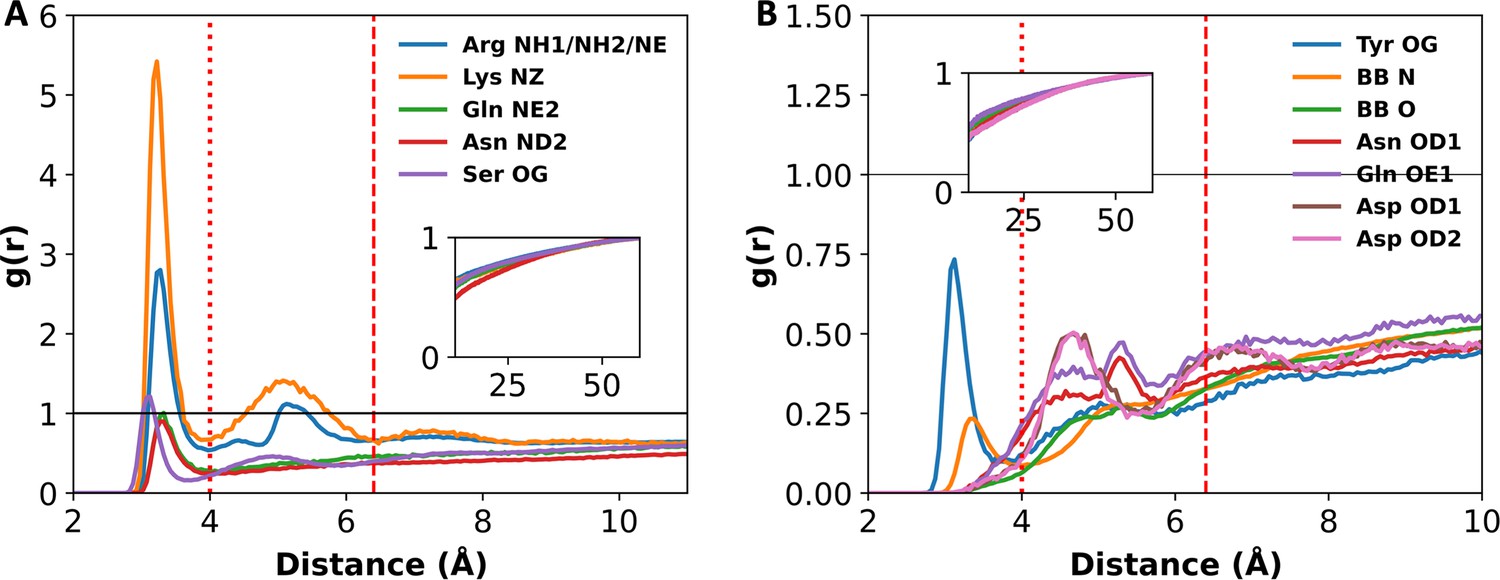
Radial distributions functions of Cl– around sidechain and backbone N and O atoms.
(A) Groups having radial distribution function (RDF) values > or close to 1. (B) Other groups. Two vertical lines indicate cutoff distances for 1st- and 2nd-shell coordination. Insets show the approach of RDFs to 1.
-
Figure 3—figure supplement 1—source data 1
Source data for Figure 3—figure supplement 1.
- https://cdn.elifesciences.org/articles/100282/elife-100282-fig3-figsupp1-data1-v1.xlsx
Figure 3—figure supplement 2
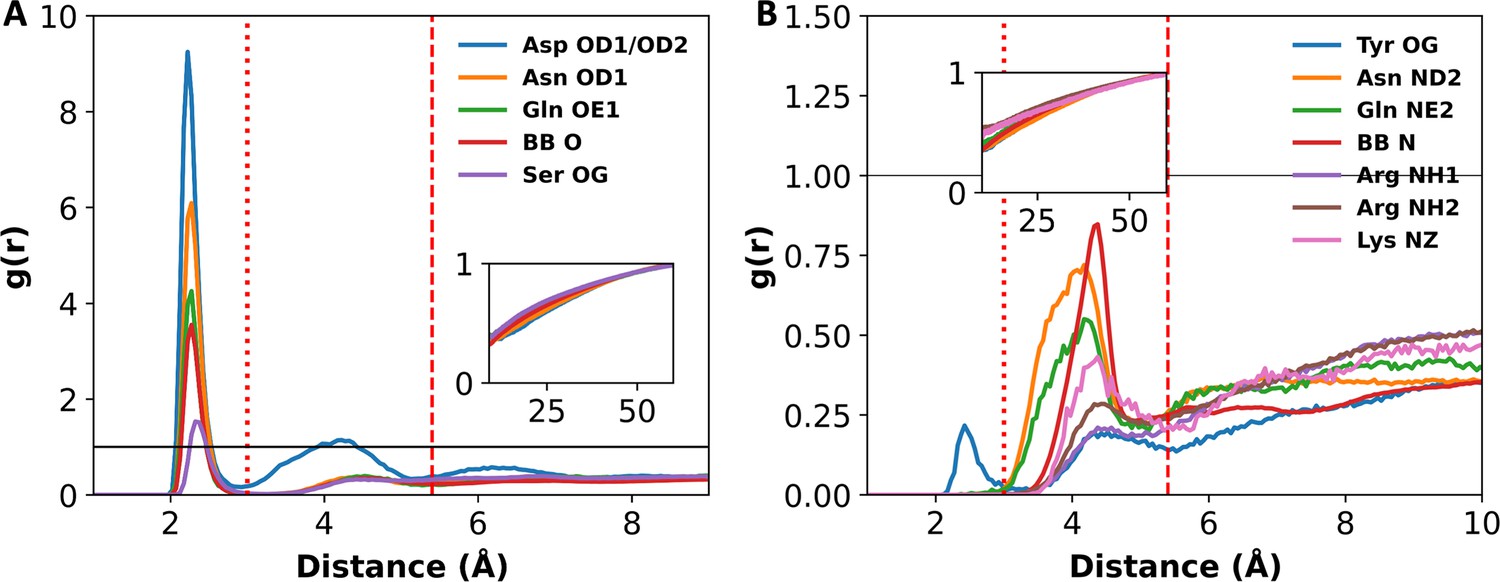
Radial distributions functions of Na+ around sidechain and backbone O and N atoms.
(A) Groups having radial distribution function (RDF) values >1. (B) Other groups. Two vertical lines indicate cutoff distances for 1st- and 2nd-shell coordination. Insets show the approach of RDFs to 1.
-
Figure 3—figure supplement 2—source data 1
Source data for Figure 3—figure supplement 2.
- https://cdn.elifesciences.org/articles/100282/elife-100282-fig3-figsupp2-data1-v1.xlsx
Figure 4
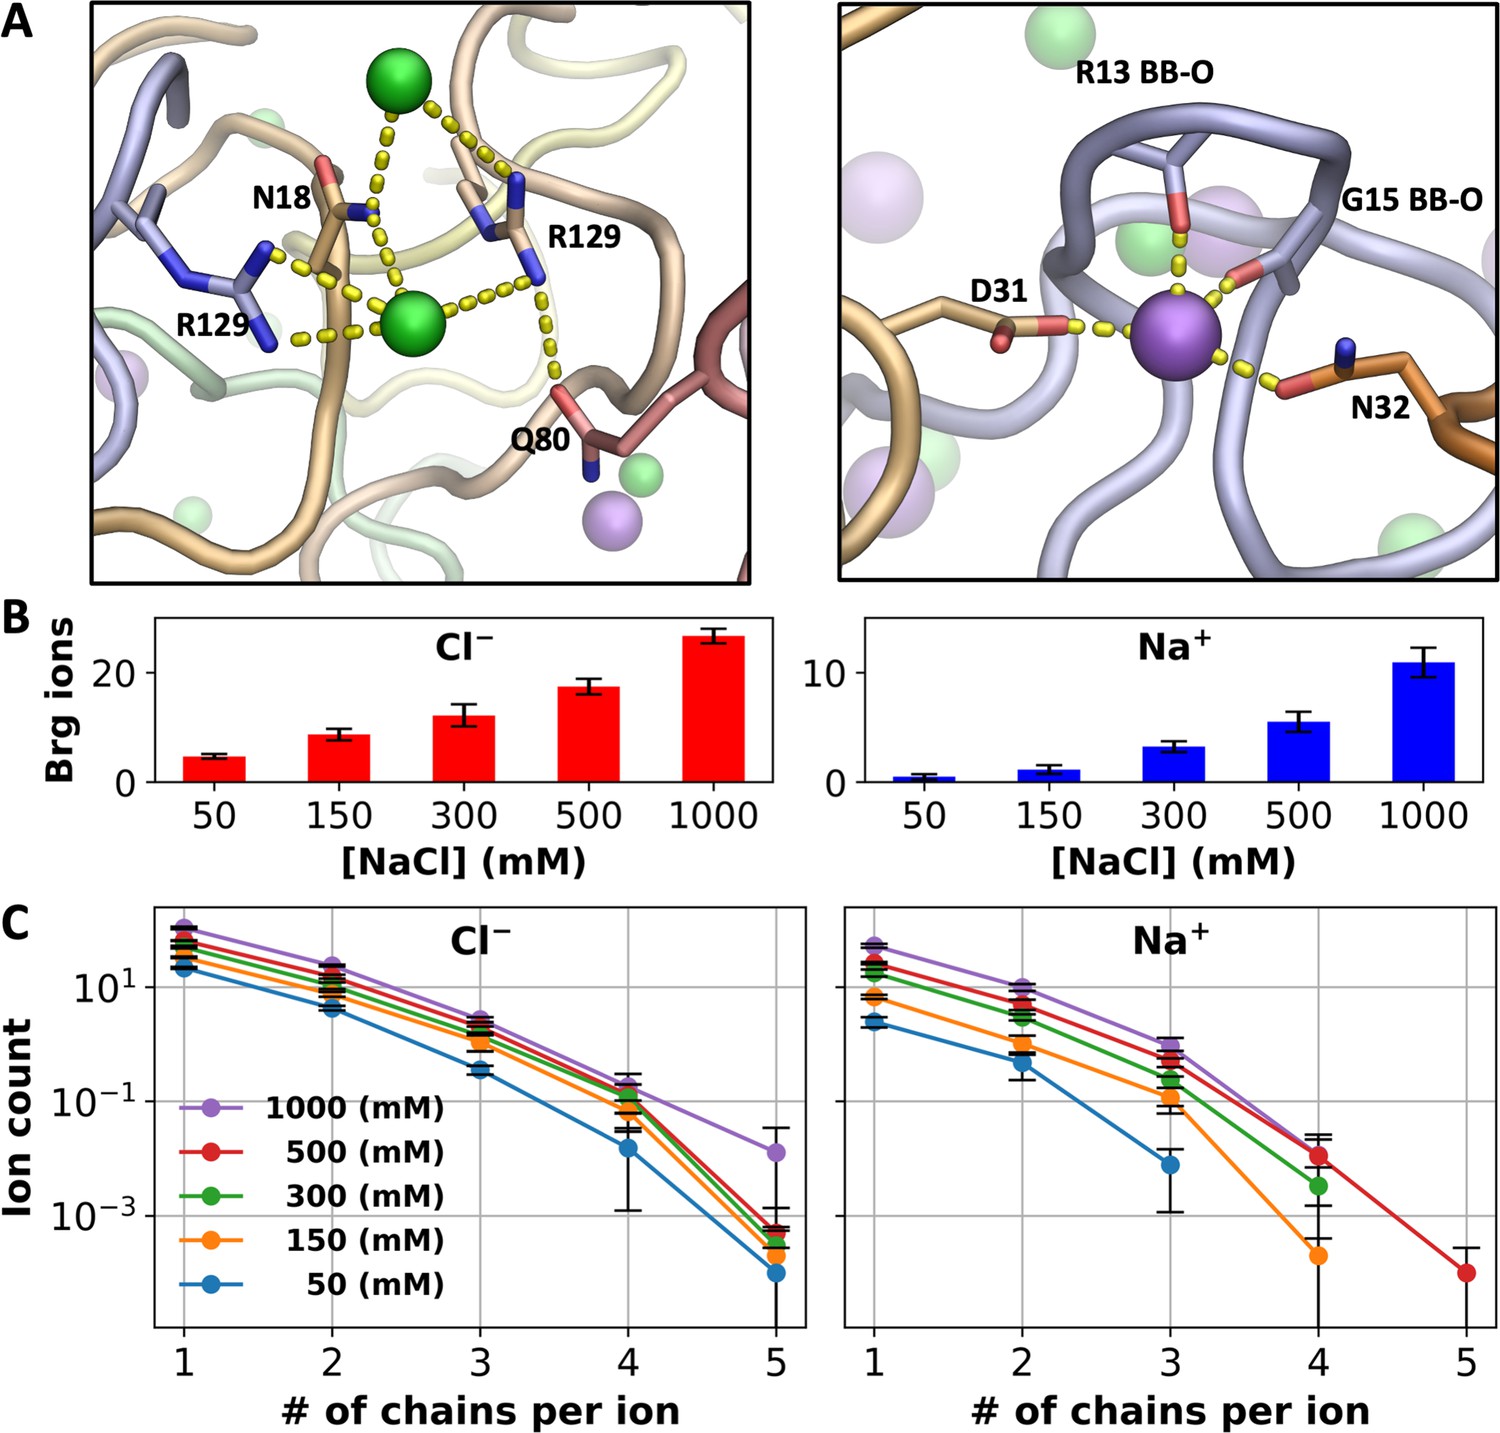
Bridging ions.
(A) Examples of chain bridging by Cl– and Na+; Cl− ions are coordinated by Arg and other sidechains whereas Na+ ions are coordinated by both backbone carbonyls (including from Gly) and sidechain oxygens. (B) Average number of Cl– or Na+ ions engaged in bridging between A1-LCD chains. (C) Average number of ions bound in 1st- and 2nd-shell sites lined by a given number of A1-LCD chains. Error bars represent standard deviations among four replicate simulations.
-
Figure 4—source data 1
Source data for Figure 4.
- https://cdn.elifesciences.org/articles/100282/elife-100282-fig4-data1-v1.xlsx
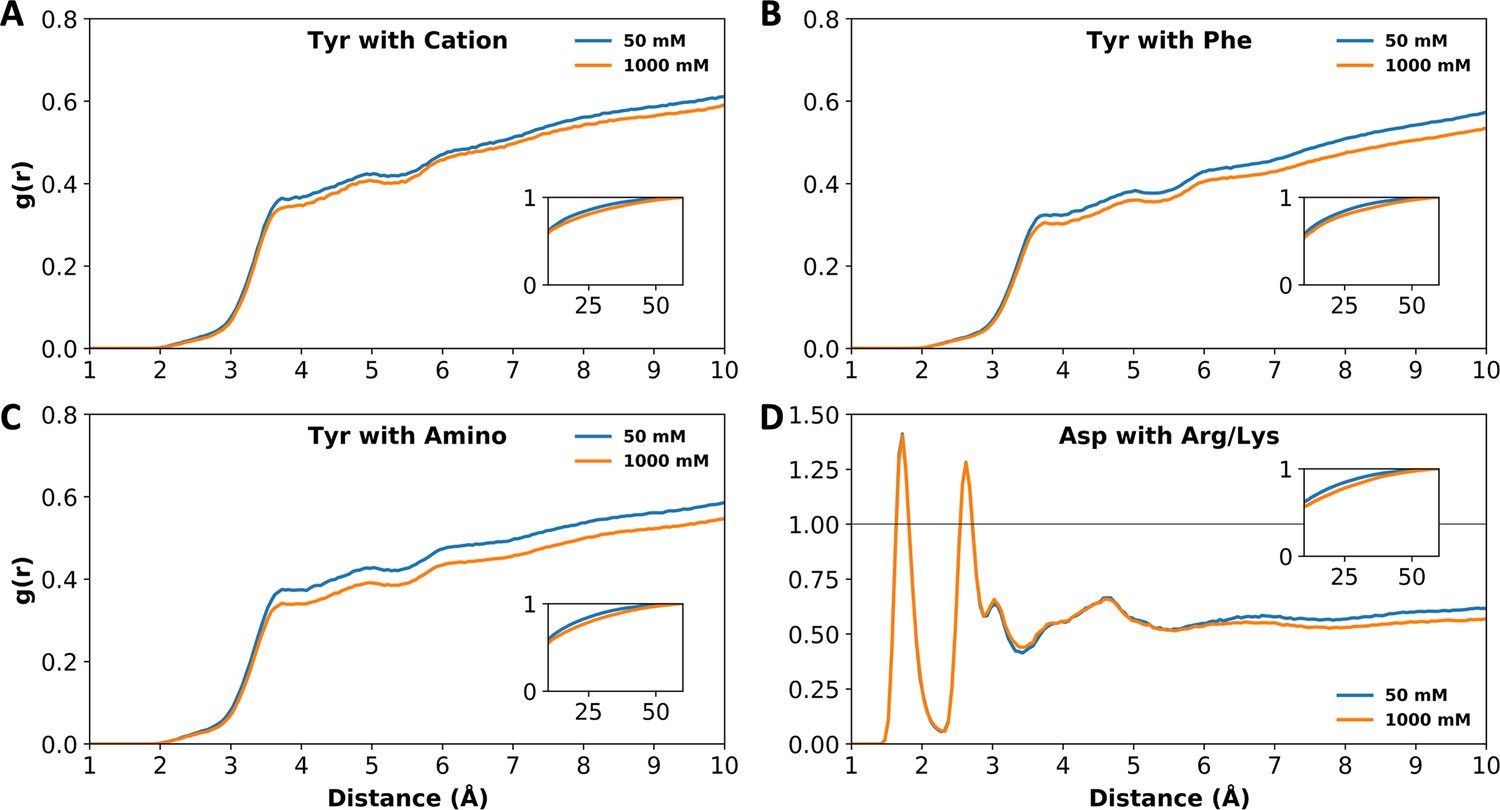
Figure 5 with 1 supplement
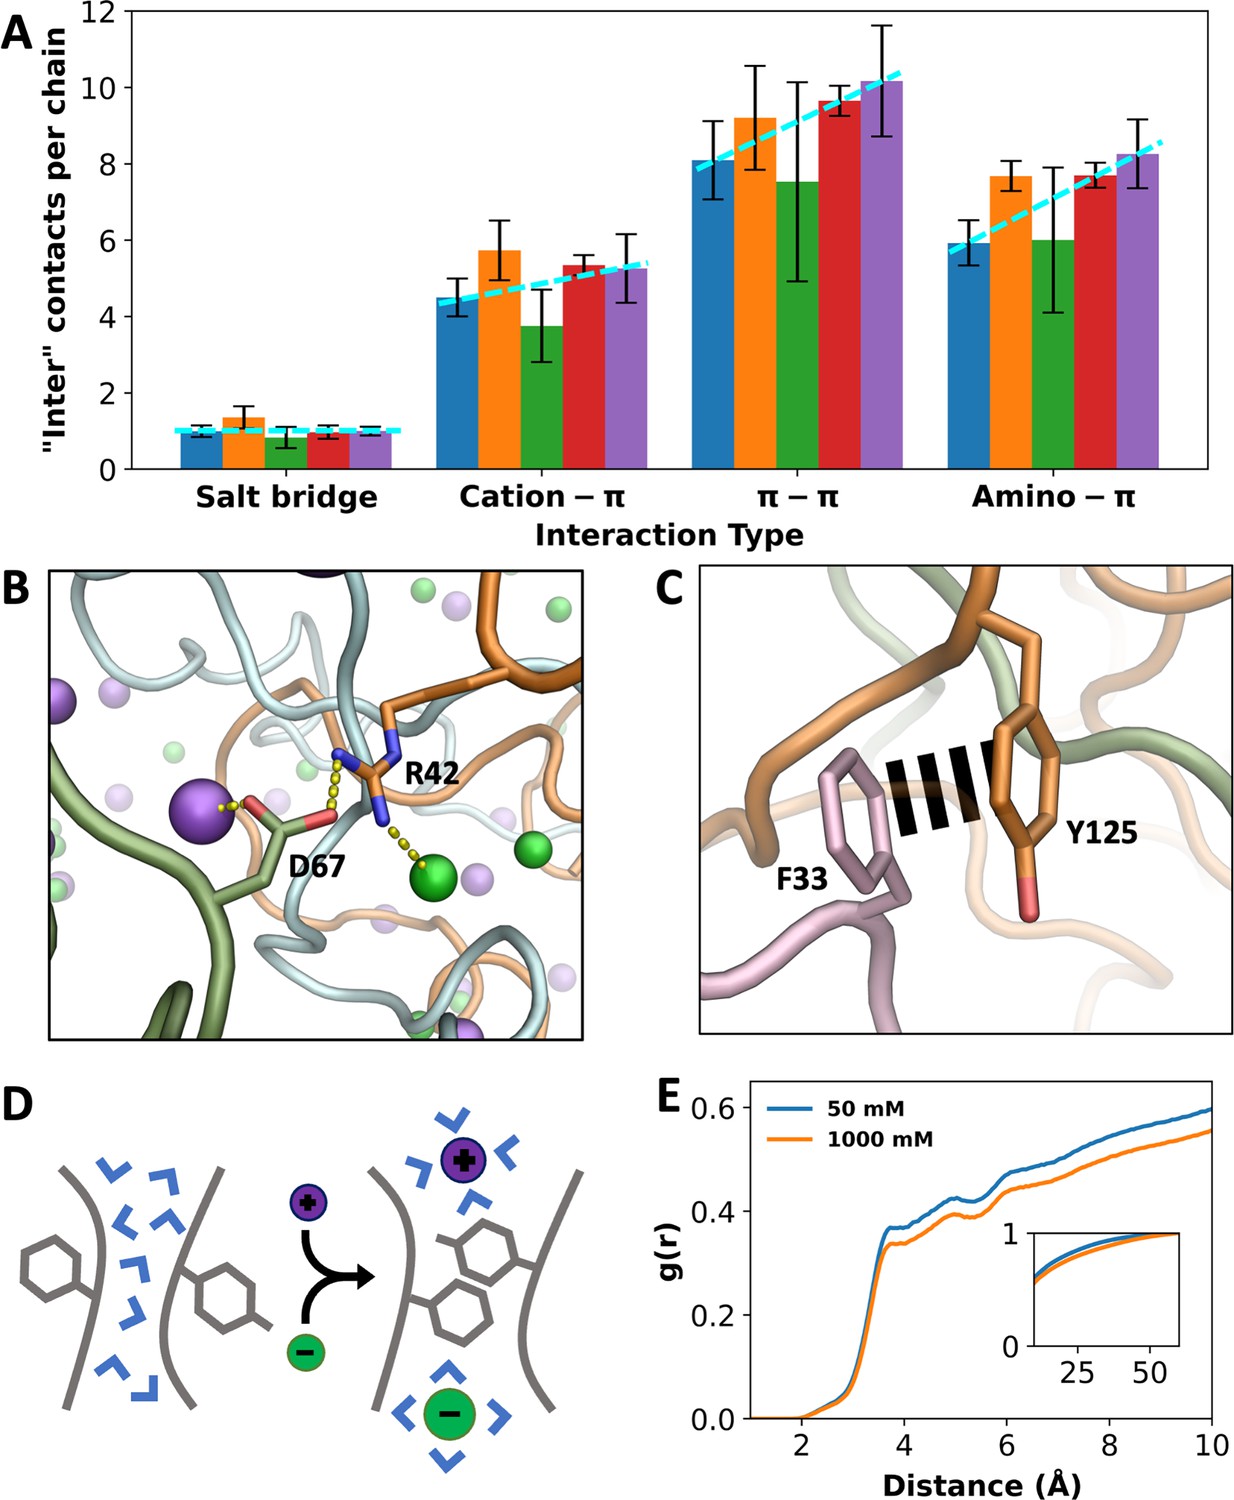
Indirect effects of ions on different types of interactions.
(A) Number of inter-chain contacts per chain for each interaction type. Bars from left to right correspond to increasing salt concentrations (50, 150, 300, 500, and 1000 mM). Dashed lines are drawn to show trends. Error bars represent standard deviations among four replicate simulations. (B) An inter-chain salt bridge, with ion coordination by the partner sidechains. (C) An inter-chain π–π interaction, free of ion coordination. (D) Schematic showing a π–π interaction facilitated by high salt, via drawing water away from the interaction partners. (E) Radial distribution functions of water around Tyr residues that interact with Phe, Arg, Lys, Gln, and Asn. Lower values at high salt demonstrate water withdrawal. Inset shows radial distribution functions approaching 1.
-
Figure 5—source data 1
Source data for Figure 5.
- https://cdn.elifesciences.org/articles/100282/elife-100282-fig5-data1-v1.xlsx
Figure 5—figure supplement 1
Radial distribution functions (RDFs) of water around sidechains that form interactions with other sidechains.
(A–C) RDFs centered on the Tyr 6-carbon ring that forms cation–π, π–π, and amino–π interactions. (D) RDFs centered on Asp oxygens that form salt bridges. Insets show the approach of RDFs to 1.
-
Figure 5—figure supplement 1—source data 1
Source data for Figure 5—figure supplement 1.
- https://cdn.elifesciences.org/articles/100282/elife-100282-fig5-figsupp1-data1-v1.xlsx
Figure 6
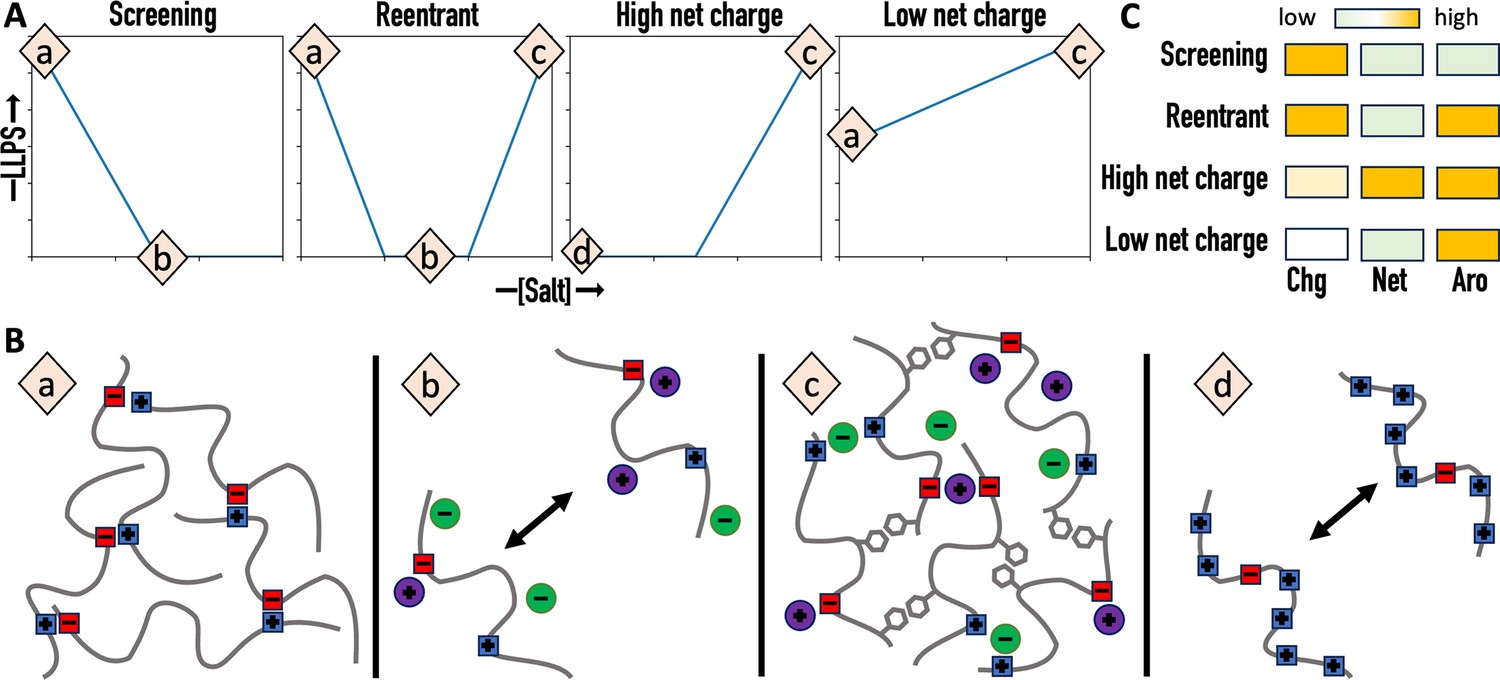
Four classes of salt dependence and their prediction from amino-acid composition.
(A) Salt dependences of liquid–liquid phase separation (LLPS). (B) Charge–charge and π-type interactions and their regulation by salt. (a) Significant charge–charge attraction. (b) Screening of charge-charge attraction by salt. (c) Strengthening of π-type interactions by high salt. (d) Repulsion due to high net charge. (C) Distinctions of the four classes of salt dependence by three determinants: charged content (Chg), net charge (Net), and aromatic content (Aro).
Tables
Table 1
Correlation between class of salt dependence and amino-acid composition.
| Protein | Length | Charges (+/−/net)* | Aromatic† | Salt (mM) | Ref |
|---|---|---|---|---|---|
| Screening | |||||
| FIB-1 | 352 | 55‡/34/21 | 24 | NaCl 50–250 | Berry et al., 2015 |
| PolyQ | 729 | 38/34/4 | 35 | NaCl 0–150 | Zhang et al., 2015 |
| Ddx4 | 236 | 32/36/–4 | 22 | NaCl 100–500 | Brady et al., 2017 |
| HP1α | 206 | 33/41/–8 | 14 | NaCl 25–150 | Strom et al., 2017 |
| LAF-1 | 708 | 86/88/–2 | 55 | NaCl 125–400 | Wei et al., 2017 |
| LAF-1 RGG | 191 | 28/22/6 | 14 | NaCl 125–300 | Wei et al., 2017 |
| Oleo30G | 139 | 15/12/3 | 7 | NaCl 35–280 | Reed and Hammer, 2018 |
| FMRP-LCD | 188 | 37/28¶/9 | 6 | NaCl 0–150 | Tsang et al., 2019 |
| hnRNPA1 | 314 | 42/34/8 | 33 | NaCl 50–300 | Martin et al., 2021 |
| pY-Caprin1§ | 103 | 16/17/–1 | 4 | NaCl 100–500 | Lin et al., 2024 |
| Reentrant | |||||
| FUS | 526 | 51/37/14 | 52 | KCl 50–2700 | Krainer et al., 2021 |
| TDP-43 | 414 | 40/44/–4 | 36 | KCl 50–2700 | Krainer et al., 2021 |
| Brd4 | 1362 | 175/150/25 | 48 | KCl 50–2150 | Krainer et al., 2021 |
| Sox2 | 317 | 34/21/13 | 19 | KCl 50–2150 | Krainer et al., 2021 |
| A11 | 505 | 51/50/1 | 41 | NaCl 22.5–500 | Krainer et al., 2021 |
| High net change | |||||
| A1-LCD | 131 | 12/3/9 | 18 | NaCl 50–300 | Martin et al., 2021 |
| Lysozyme¶ | 129 | 17/9/8 | 12 | NaCl 514–1198 | Muschol and Rosenberger, 1997 |
| RMFP-1 | 121 | 24/0/24 | 24 | NaCl 100–500 | Kim et al., 2017 |
| UBQLN2 | 624 | 31/40/–9 | 22 | NaCl 100–300 | Dao et al., 2018 |
| UBQLN2 (450-624) | 175 | 4/8/–4 | 5 | NaCl 50–200 | Dao et al., 2018 |
| TDP43-LCD (pH 4) | 148 | 14**/3/11 | 12 | NaCl 0–300 | Babinchak et al., 2019 |
| HBP-2 (pH 5.5) | 193 | 30**/13/17 | 20 | NaCl 50–500 | Le Ferrand et al., 2019 |
| Caprin1 | 103 | 16/3/13 | 11 | NaCl 0–2000 | Wong et al., 2020 |
| Prp-LCD | 122 | 11/1/10 | 11 | NaCl 150–750 | Agarwal et al., 2021 |
| RLP38 | 120 | 12/8/4 | 8 | NaCl 0–2000 | Otis and Sharpe, 2022 |
| Low net charge | |||||
| FUS-LCD | 136 | 0/2/–2 | 20 | NaCl 0–250 | Burke et al., 2015 |
| TDP43-LCD (pH 7) | 148 | 8/3 / 5 | 12 | NaCl 0–300 | Babinchak et al., 2019 |
-
*
Charges are listed as the number of positively (R and K, including H when specifically indicated) or negatively (D and E) charged residues or net charge.
-
†
Aromatic residues are W, Y, and F.
-
‡
Single-domain folded protein.
-
§
Phosphorylated Y was assigned a charge of −2 and assumed to be no longer an aromatic residue.
-
¶
High contents of charged residues, net charges, and aromatic residues are indicated by bold letters, with thresholds at 20%, 6%, and 8%, respectively, when measured as percentages of the sequence length.
-
**
H is treated as positively charged at the low pH condition.
Additional files
Download links
A two-part list of links to download the article, or parts of the article, in various formats.
Downloads (link to download the article as PDF)
Open citations (links to open the citations from this article in various online reference manager services)
Cite this article (links to download the citations from this article in formats compatible with various reference manager tools)
Direct and indirect salt effects on homotypic phase separation
eLife 13:RP100282.
https://doi.org/10.7554/eLife.100282.3


