Different roles of D1/D2 medium spiny neurons in the nucleus accumbens in pair bond formation of male mandarin voles
- Institute of Brain and Behavioural Sciences, College of Life Sciences, Shaanxi Normal University, China
- Department of Psychiatry and Behavioral Sciences, Silvio O. Conte Center for Oxytocin and Social Cognition, Center for Translational Social Neuroscience, Emory National Primate Research Center, Emory University, United States
- Center for Social Neural Networks, University of Tsukuba, Japan
- Research Center for Prevention and Treatment of Respiratory Disease, School of Clinical Medicine, Xi'an Medical University, China
Figures
Figure 1 with 9 supplements
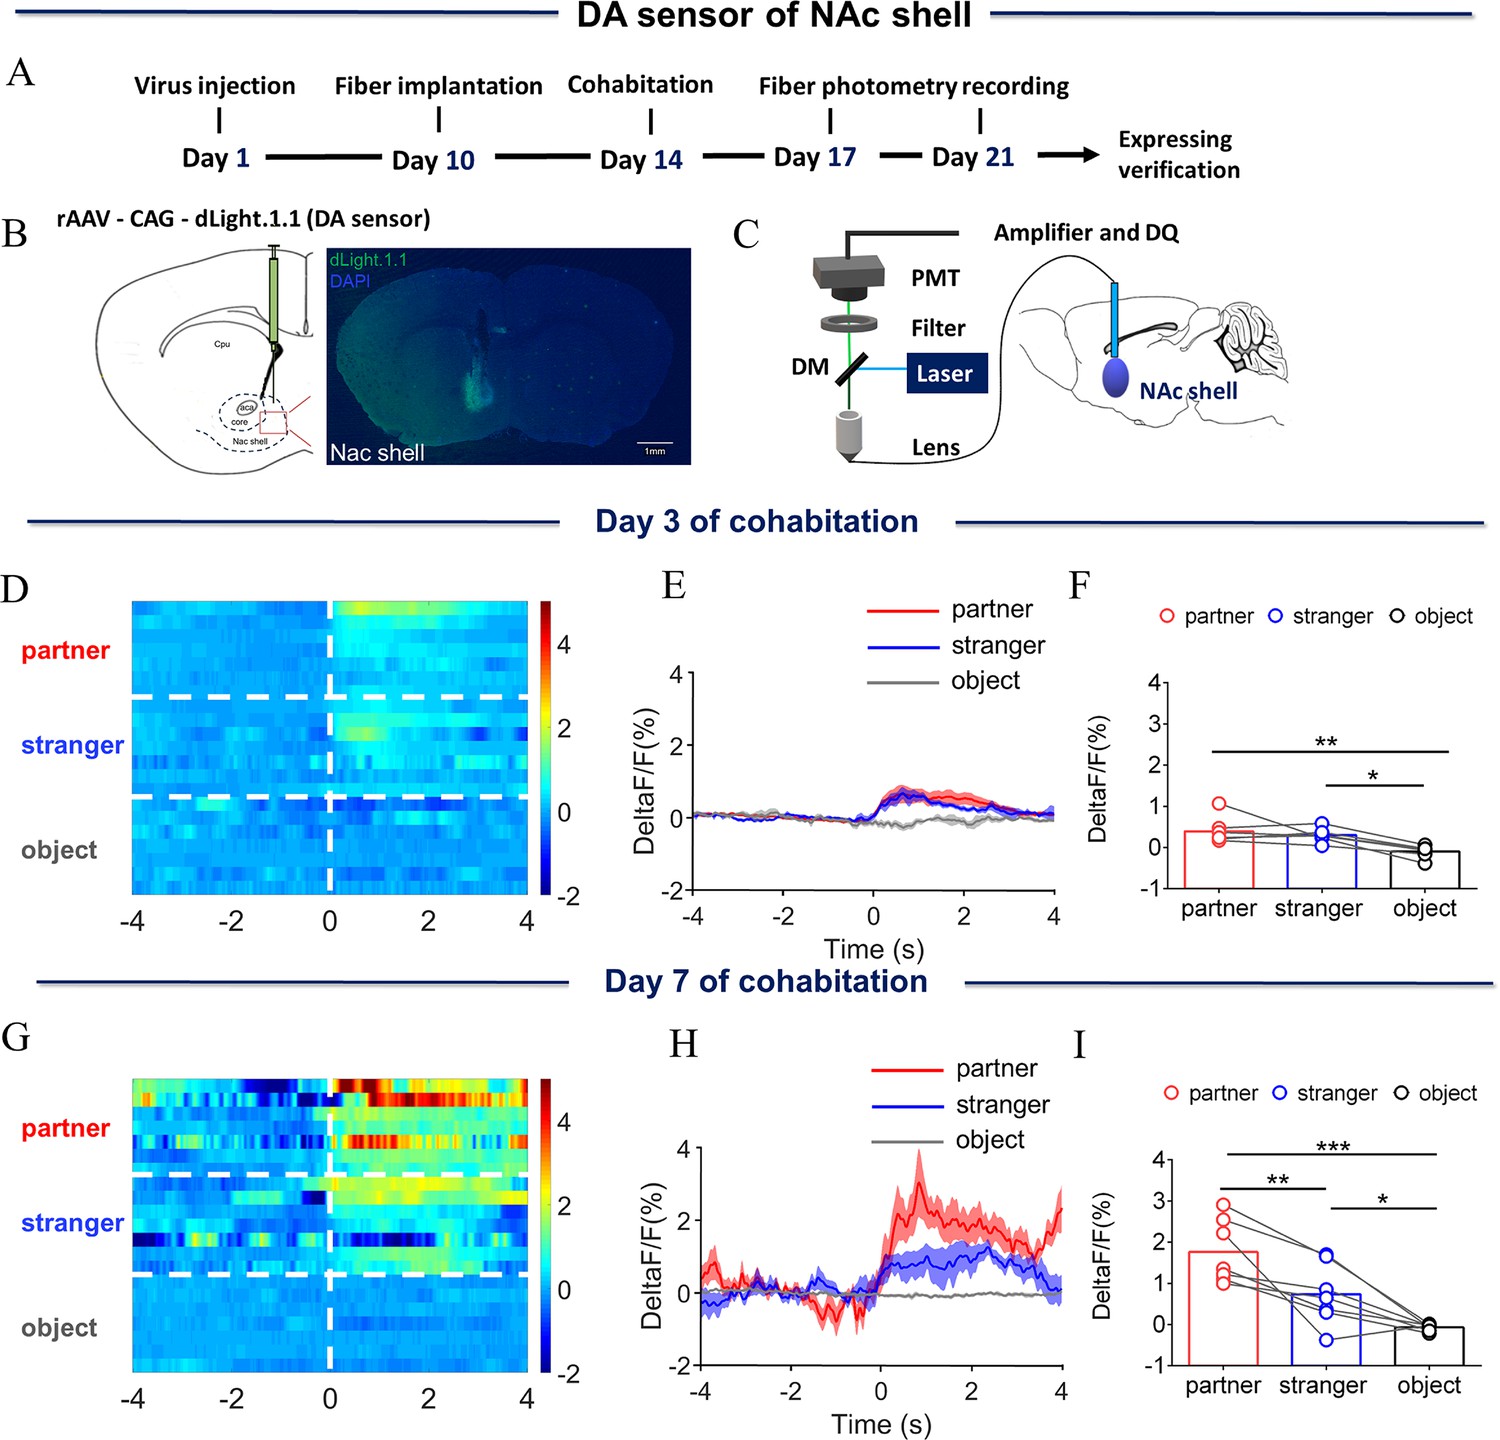
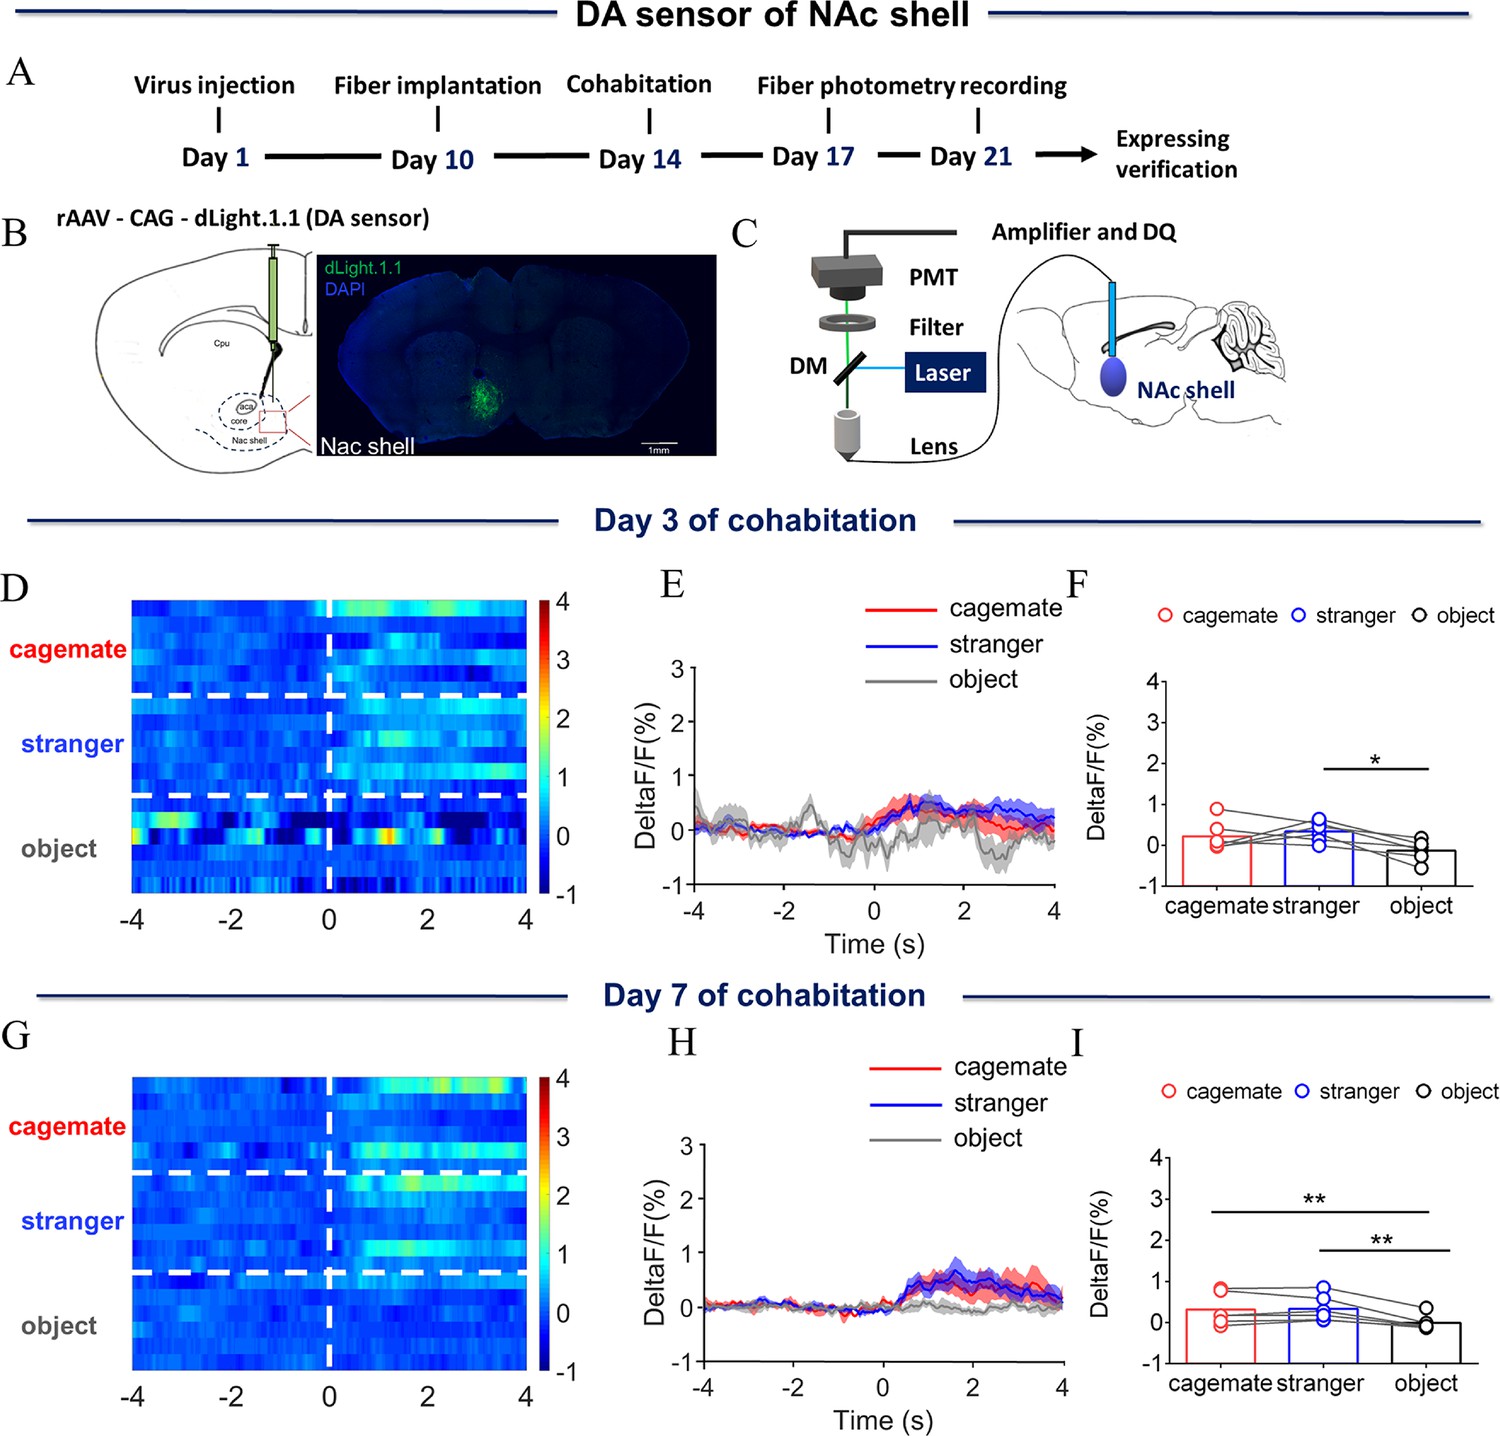
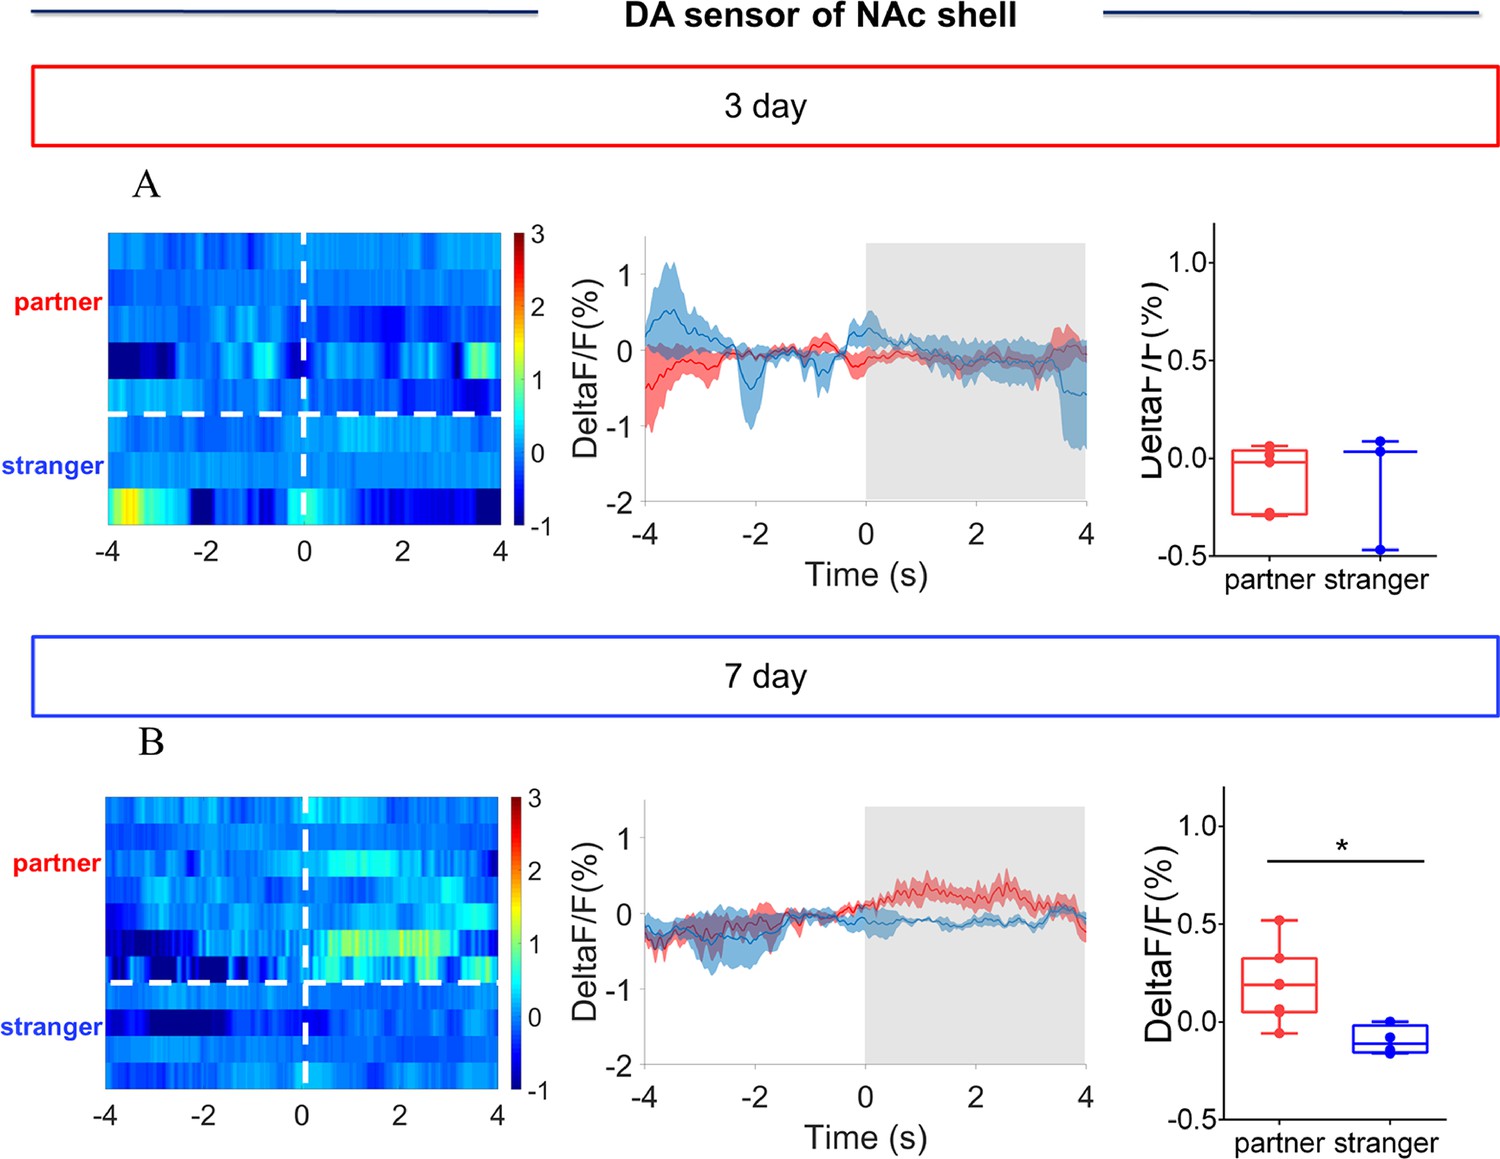
Dynamics of extracellular dopamine (DA) concentration within the nucleus accumbens (NAc) shell upon sniffing their partner or an unknown female.
(A) Timeline of experiments. (B) Schematic diagrams depicting virus injection and recording sites and histology showing the expression of DA sensor within the NAc shell. Scale bar: 1 mm. (C) Schematic of the procedure used to record extracellular DA concentration in the NAc shell using fiber photometry. (D) Heat map illustrating the extracellular DA concentrations (ΔF/F, %) of the NAc shell when sniffing their partner, an unknown female, and an unrelated object. (E) Mean fluorescence signal changes of DA sensor during sniffing their partner (red line), an unknown female (blue line), or an object (gray line) after 3 days of cohabitation. The shaded areas along the differently colored lines represent the margin of error. (F) Quantification (One-Way Repeated Measures ANOVA) of changes in DA signals during sniffing of their partner, an unknown female, and an object after 3 days of cohabitation. (G) Heat map illustrating the extracellular DA concentration (ΔF/F, %) of the NAc shell when sniffing their partner, an unknown female, and an object. (H) Mean fluorescence signal changes of the DA sensor when sniffing their partner (red line), an unknown female (blue line), or an object (gray line) after 7 days of cohabitation. (I) Quantification (One-Way Repeated Measures ANOVA) of changes in extracellular DA concentration when sniffing their partner, an unknown female, and an object after 7 days of cohabitation. Error bars = SEM * represents p<0.05, ** represents p<0.01, and *** represents p<0.001. See Figure 1—source data 1 for detailed statistics.
-
Figure 1—source data 1
Raw data and statistical results of changes in DA signals during sniffing their partner, an unknown female, and an object after cohabitation.
- https://cdn.elifesciences.org/articles/100292/elife-100292-fig1-data1-v1.xlsx
Figure 1—figure supplement 1
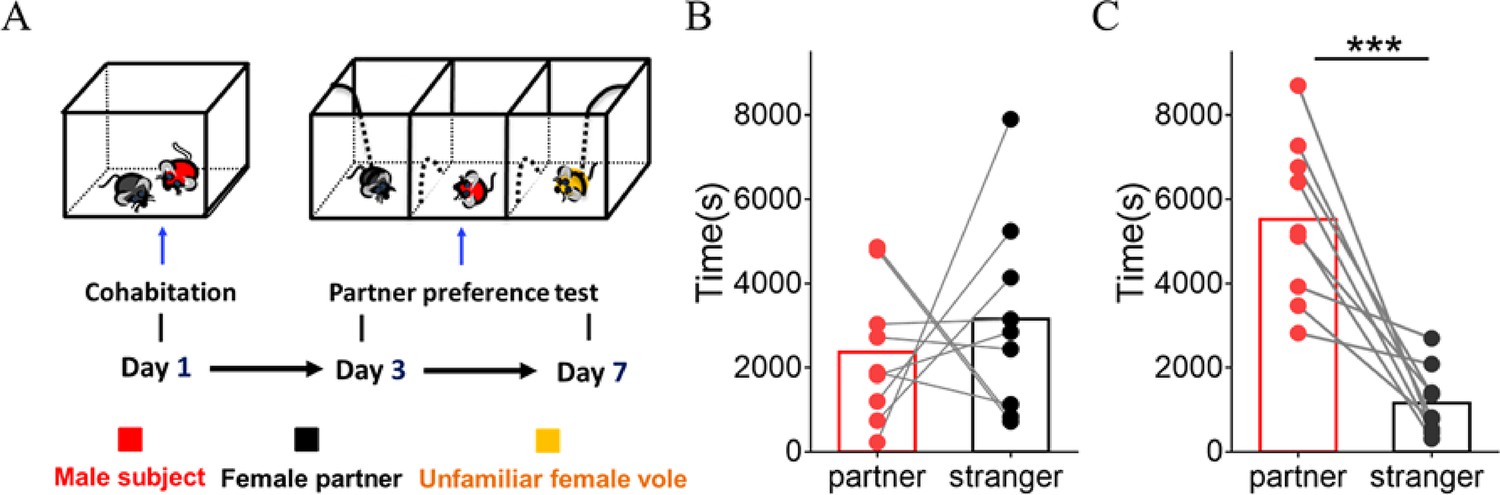
Mandarin voles showed significant preference to partners in the partner preference test after cohabitation.
(A) Timeline of experiments. (B) Quantification of side-by-side time in the partner preference test after cohabitation for 3 days (n=9 voles, Paired t test: t (8)=0.623, p=0.551). (C) Quantification of side-by-side time in the partner preference test after 7 days of cohabitation (n=9 voles, Paired t test: t (8)=5.294, p=0.0007). Error bars = SEM. *** represent p<0.001. See Figure 1—figure supplement 1—source data 1 for detailed statistics.
-
Figure 1—figure supplement 1—source data 1
Raw data and statistical results of side-by-side time in the partner preference test after cohabitation for 3 days and 7 days.
- https://cdn.elifesciences.org/articles/100292/elife-100292-fig1-figsupp1-data1-v1.xlsx
Figure 1—figure supplement 2
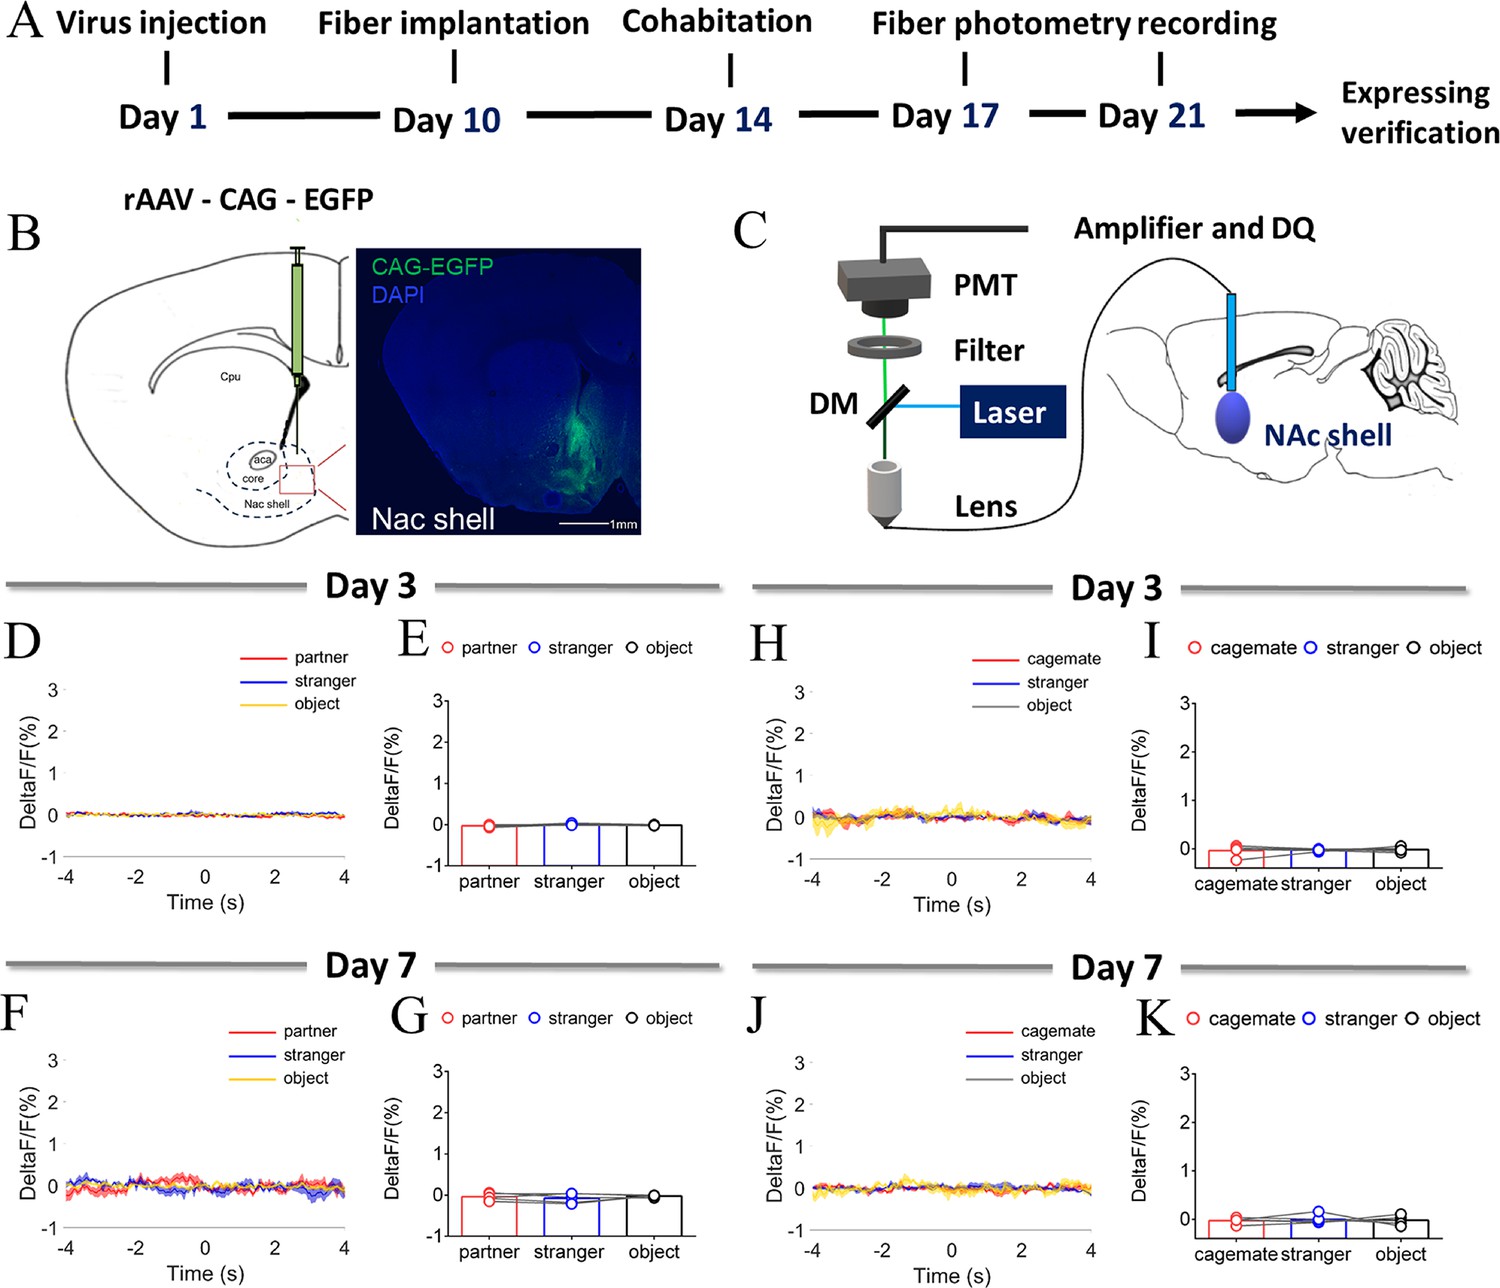
NAc shell EGFP fluorescence signals (with injection of control virus) upon sniffing partner or an unknown female after cohabitation.
(A) Timeline of experiments. (B) Schematic diagrams depicting histology showing the expression of EGFP within the NAc shell. Scale bar: 1 mm. (C) The schematic of the fiber photometry. (D, F) Mean fluorescence signal changes of EGFP fluorescence signals during sniffing partner (red line), an unknown female (blue line), or an object (yellow line) after cohabitation for 3 days (D) and 7 days (F). (E, G) Quantification (Repeated One-way ANOVA) of changes in EGFP fluorescence signals during sniffing partner, an unknown female, or an object after cohabitation for 3 days (E) (n=5 voles) and 7 days (G) (n=5 voles). (H, J) Mean fluorescence signal changes of EGFP fluorescence signals during sniffing cagemate (red line), an unknown male (blue line), or an object (yellow line) after cohabitation for 3 days (H) and 7 days (J). (I, K) Quantification (Repeated One-way ANOVA) of changes in EGFP fluorescence signals during sniffing cagemate, an unknown male, or an object after cohabitation for 3 days (I) (n=5 voles) and 7 days (K) (n=5 voles). All error bars = SEM. See Figure 1—figure supplement 2—source data 1 for detailed statistics.
-
Figure 1—figure supplement 2—source data 1
Raw data and statistical results of changes in EGFP fluorescence signals during sniffing after cohabitation.
- https://cdn.elifesciences.org/articles/100292/elife-100292-fig1-figsupp2-data1-v1.xlsx
Figure 1—figure supplement 3
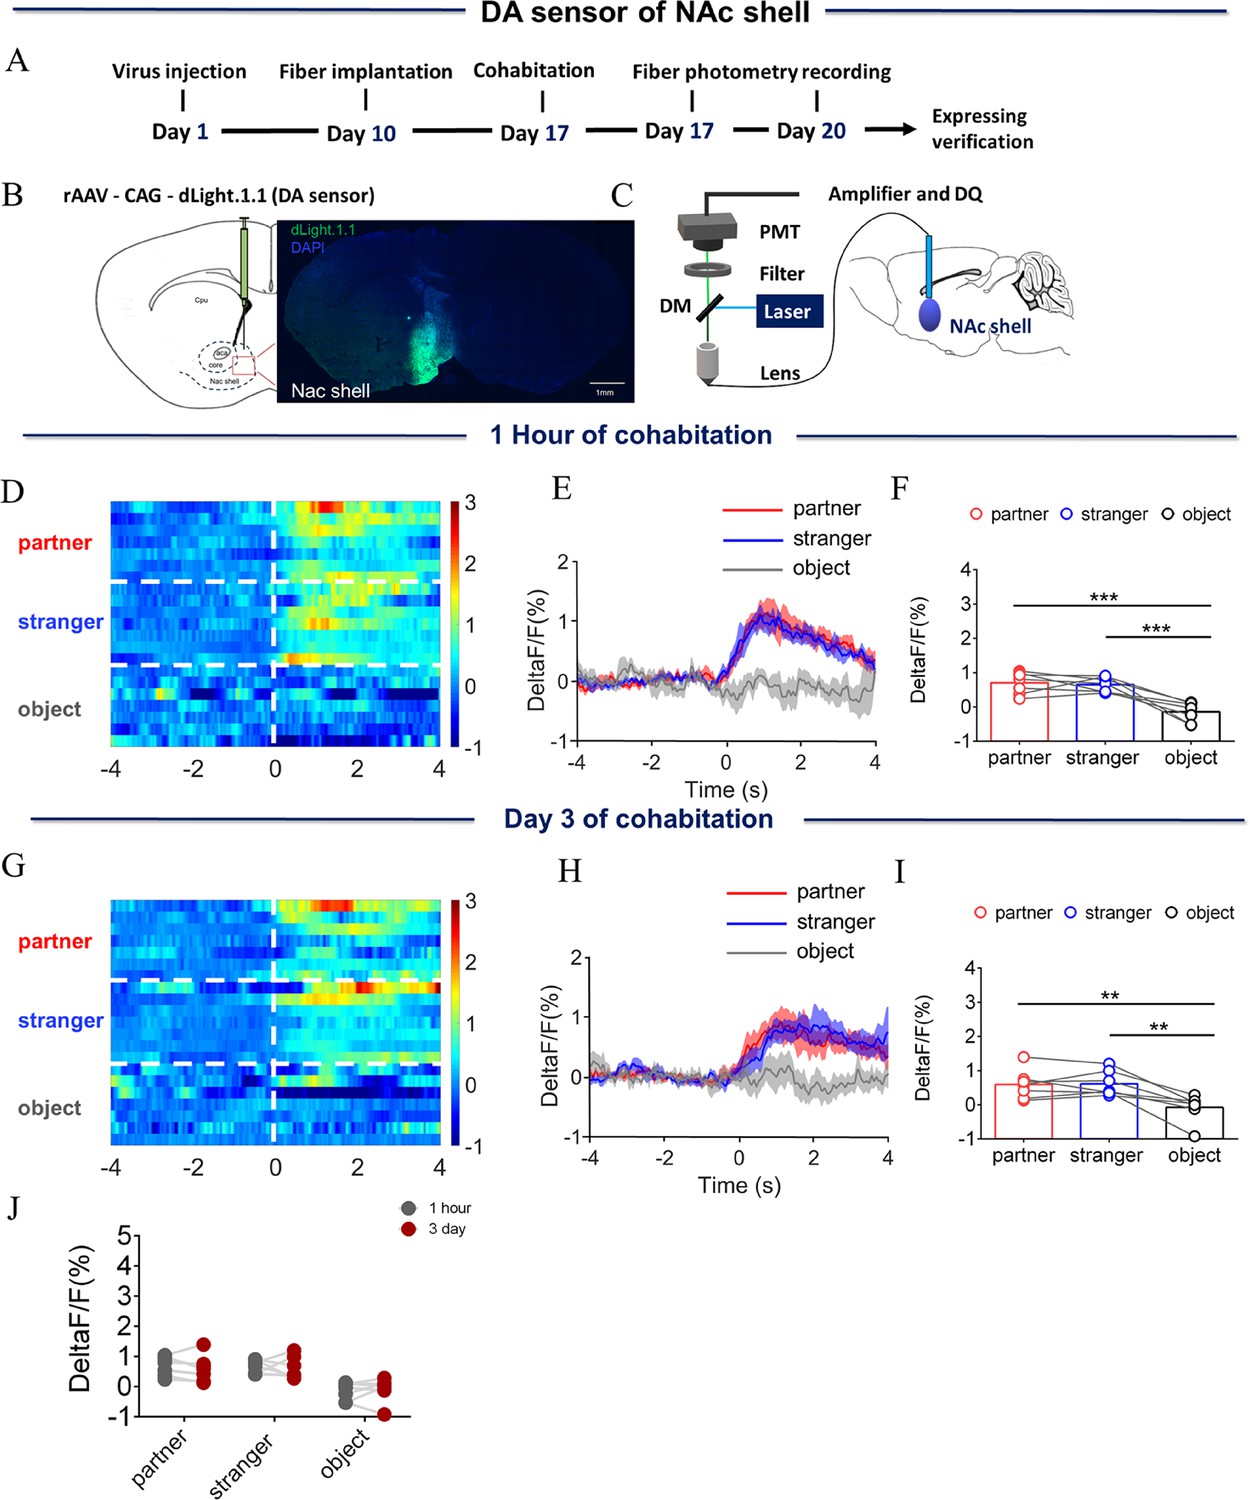
Dynamics of extracellular dopamine (DA) concentration within the nucleus accumbens (NAc) shell upon sniffing their partner or an unknown female after 1 hr or 3 days of cohabitation.
(A) Timeline of experiments. (B) Schematic diagrams depicting virus injection and recording sites and histology showing the expression of DA sensor within the NAc shell. Scale bar: 1 mm. (C) Schematic of the procedure used to record extracellular DA concentration in the NAc shell using fiber photometry. (D) Heat map illustrating the extracellular DA concentrations (ΔF/F, %) of the NAc shell when sniffing their partner, an unknown female, and an unrelated object. (E) Mean fluorescence signal changes of DA sensor during sniffing their partner (red line), an unknown female (blue line), or an object (gray line) after 1 hr of cohabitation. The shaded area along the differently colored lines represents the margin of error. (F) Quantification (Repeated One-way ANOVA) of changes in DA signals during sniffing of their partner, an unknown female, and an object after 1 hr of cohabitation. (G) Heat map illustrating the extracellular DA concentration (ΔF/F, %) of the NAc shell when sniffing their partner, an unknown female, and an object. (H) Mean fluorescence signal changes of the DA sensor when sniffing their partner (red line), an unknown female (blue line), or an object (gray line) after 3 days of cohabitation. (I) Quantification (Repeated One-way ANOVA) of changes in extracellular DA concentration when sniffing their partner, an unknown female, and an object after 3 days of cohabitation. (J) Quantification (Two-Way Repeated Measures ANOVA) of changes in sniffing their partner, an unknown female, and an object after cohabitation for 1 hr and 3 days (n=7 voles). Error bars = SEM. * represents p<0.05, ** represents p<0.01, and *** represents p<0.001. See Figure 1—figure supplement 3—source data 1 for detailed statistics.
-
Figure 1—figure supplement 3—source data 1
Raw data and statistical results of changes in DA signals during sniffing of their partner, an unknown female, and an object after cohabitation.
- https://cdn.elifesciences.org/articles/100292/elife-100292-fig1-figsupp3-data1-v1.xlsx
Figure 1—figure supplement 4
Dynamics of extracellular DA concentration within the NAc shell upon sniffing their cagemate or an unknown male.
(A) Timeline of experiments. (B) Schematic diagrams depicting virus injection and recording sites and histology showing the expression of DA sensor within the NAc shell. Scale bar: 1 mm. (C) Schematic of the procedure used to record extracellular DA concentration in the NAc shell using fiber photometry. (D) Heat map illustrating the extracellular DA concentrations (ΔF/F, %) of the NAc shell when sniffing their cagemate, an unknown male, or an object. (E) Mean fluorescence signal changes of DA sensor during sniffing their cagemate (red line), an unknown male (blue line), or an object (gray line) after 3 days of cohabitation. The shaded area along the differently colored lines represents the margin of error. (F) Quantification (repeated one-way ANOVA) of changes in DA signals during sniffing of their cagemate, an unknown male, or an object after 3 days of cohabitation. (G) Heat map illustrating the extracellular DA concentration (ΔF/F, %) of the NAc shell when sniffing their cagemate, an unknown male, or an object. (H) Mean fluorescence signal changes of the DA sensor when sniffing their cagemate (red line), an unknown male (blue line), or an object (gray line) after 7 days of cohabitation. (I) Quantification (repeated one-way ANOVA) of changes in extracellular DA concentration when sniffing their cagemate, an unknown male, or an object after 7 days of cohabitation. Error bars = SEM. * represents p<0.05, ** represents p<0.01. See Figure 1—figure supplement 4—source data 1 for detailed statistics.
-
Figure 1—figure supplement 4—source data 1
Raw data and statistical results of changes in DA signals during sniffing of their cagemate, an unknown male, and an object after cohabitation.
- https://cdn.elifesciences.org/articles/100292/elife-100292-fig1-figsupp4-data1-v1.xlsx
Figure 1—figure supplement 5
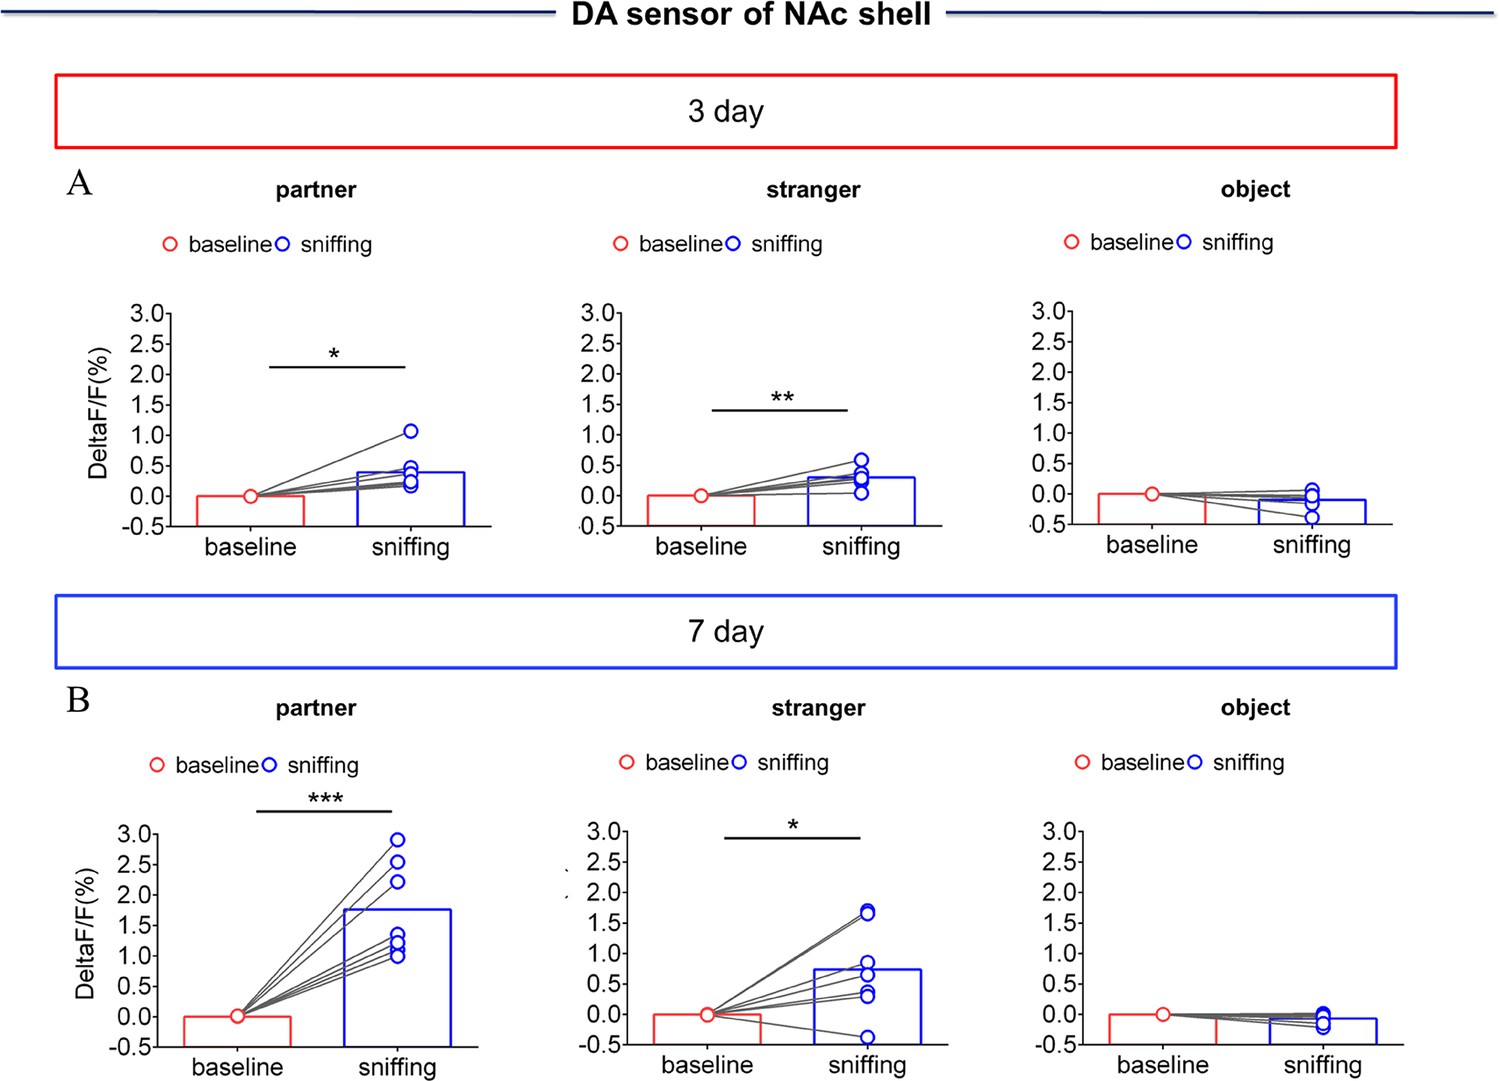
NAc shell Dynamics of extracellular DA concentration when sniffing their partner or an unknown female after cohabitation.
(A) Quantification (Paired t test) of change during sniffing partner (left), female stranger (middle), or object (right) after cohabitation for 3 days (n=7 voles). (B) Quantification (Paired t test) of changes during sniffing partner (left), an unknown female (middle), or an object (right) after cohabitation for 7 days (n=7 voles). Error bars = SEM * represents p<0.05, ** represents p<0.01. See Figure 1—figure supplement 5—source data 1 for detailed statistics.
-
Figure 1—figure supplement 5—source data 1
Raw data and statistical results of changes in DA signals during sniffing their partner, an unknown female, and an object after cohabitation.
- https://cdn.elifesciences.org/articles/100292/elife-100292-fig1-figsupp5-data1-v1.xlsx
Figure 1—figure supplement 6
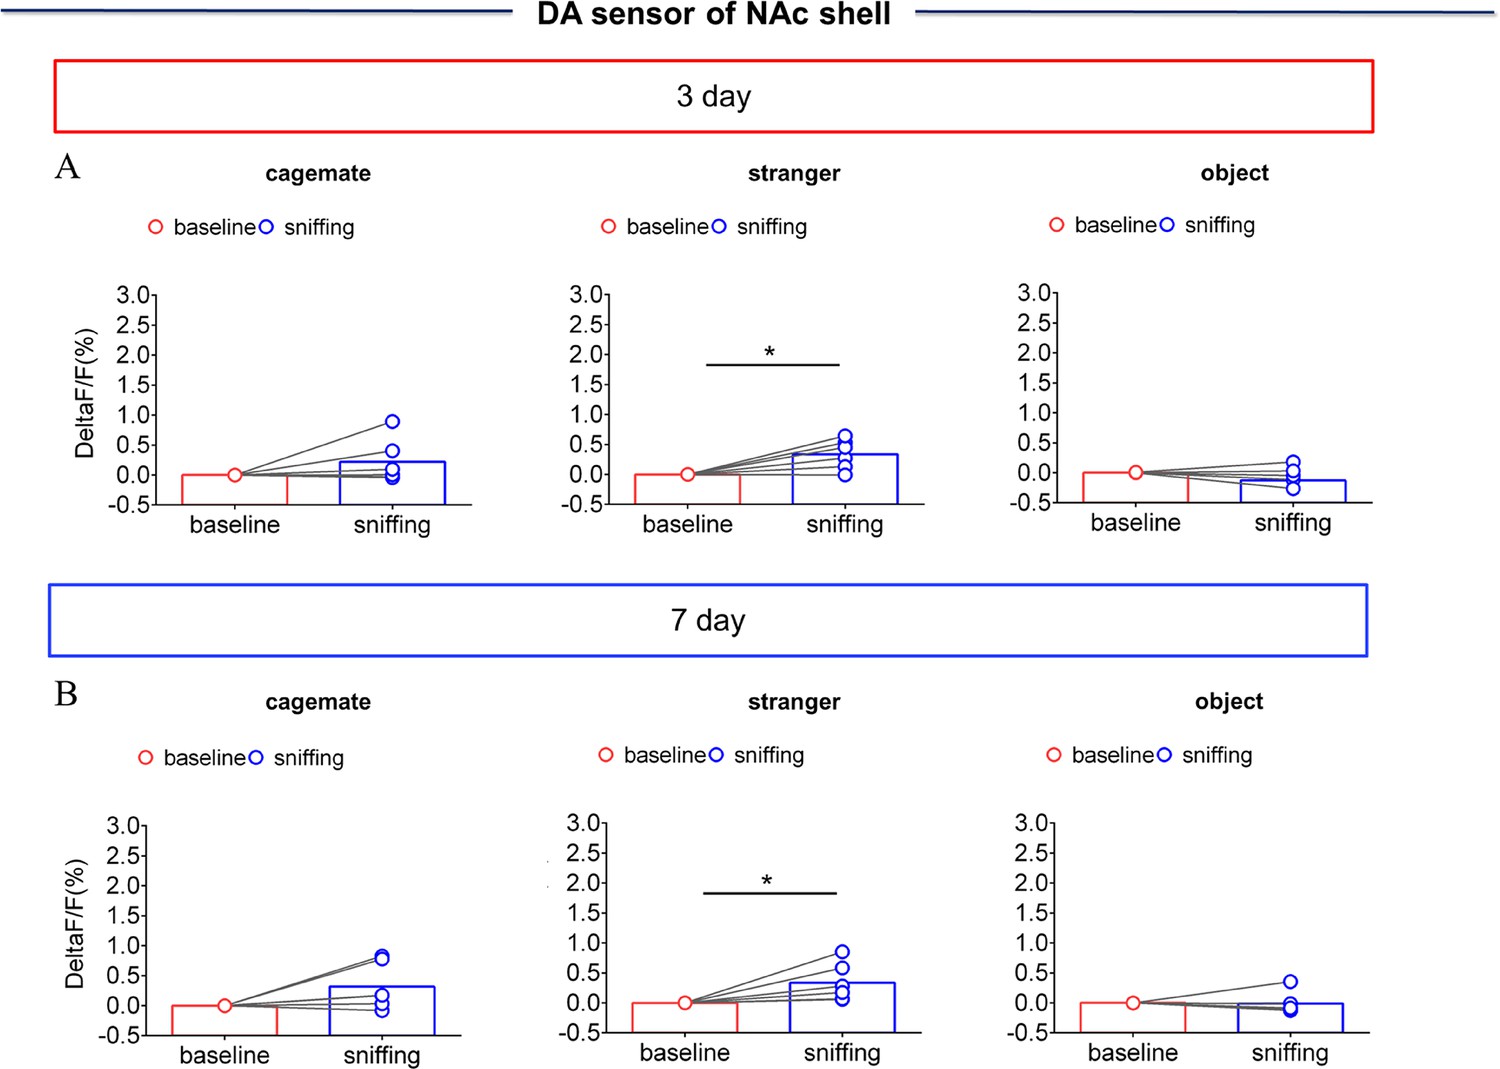
NAc shell Dynamics of extracellular DA concentration when sniffing their cagemate or an unknown male after cohabitation.
(A) Quantification (Paired t test) of changes during sniffing cagemate (left), an unknown male (middle), or an object (right) after cohabitation for 3 days (n=6 voles). (B) Quantification (Paired t test) of changes during sniffing cagemate (left), an unknown male (middle), or an object (right) after cohabitation for 7 days (n=6 voles). Error bars = SEM. * represent p<0.05. See Figure 1—figure supplement 6—source data 1 for detailed statistics.
-
Figure 1—figure supplement 6—source data 1
Raw data and statistical results of changes in DA signals during sniffing of their cagemate, an unknown male, and an object after cohabitation.
- https://cdn.elifesciences.org/articles/100292/elife-100292-fig1-figsupp6-data1-v1.xlsx
Figure 1—figure supplement 7
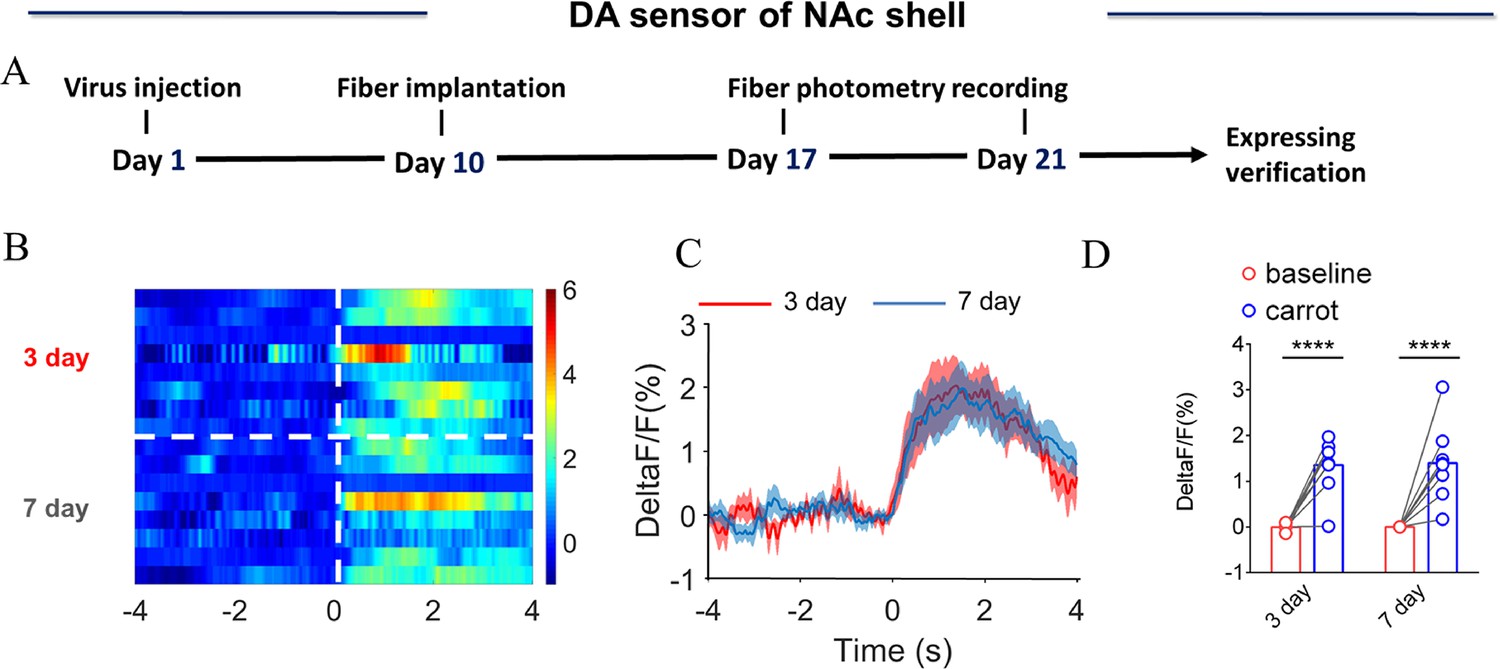
NAc shell dynamics of extracellular DA concentration upon eating carrot.
(A) Timeline of experiments. (B) Heat map illustrating the extracellular DA concentration (ΔF/F, %) of NAc shell upon eating carrot after cohabitation for 3 days and 7 days. (C) Mean fluorescence signal changes of DA sensor upon eating carrot after cohabitation for 3 (red line) and 7 days (blue line). The shaded area along the different colored lines represents error margins. (D) Quantification (Two-Way Repeated Measures ANOVA) of changes in DA signals upon eating carrot after cohabitation for 3 and 7 days. All error bars = SEM. * represent p<0.05, ** represent p<0.01, *** represent p<0.001. See Figure 1—figure supplement 7—source data 1 for detailed statistics.
-
Figure 1—figure supplement 7—source data 1
Raw data and statistical results of changes in DA signals upon eating carrot.
- https://cdn.elifesciences.org/articles/100292/elife-100292-fig1-figsupp7-data1-v1.xlsx
Figure 1—figure supplement 8
NAc shell Dynamics of extracellular DA release during side-by-side contact after cohabitation.
(A) Mean fluorescence signals changes (middle) and quantification (unpaired t test) (right) of DA sensor during side-by-side contact with partner (n=5 voles) or an unknown female (n=3 voles) after 3 days of cohabitation. Left: Heat map illustrating the extracellular DA concentration (ΔF/F, %) of NAc shell during side-by-side contact after cohabitation for 3 days. (B) Mean fluorescence signal changes (middle) and quantification (unpaired t test) (right) of DA sensor during side-by-side contact with partner (n=7 voles) or an unknown female (n=4 voles) after 7 days of cohabitation. Left: Heat map illustrating the extracellular DA concentration (ΔF/F, %) of NAc shell during side-by-side contact after cohabitation for 7 days. Not all animals engaged in side-by-side contact. The number of data points was different from the number of subjects because some animals did not show side-by-side contact, thus we could not detect the changes in fluorescence signals upon the occurrence of this behavior. All error bars = SEM. * represent p<0.05. See Figure 1—figure supplement 8—source data 1 for detailed statistics.
-
Figure 1—figure supplement 8—source data 1
Raw data and statistical results of changes in DA signals during side-by-side contact after cohabitation.
- https://cdn.elifesciences.org/articles/100292/elife-100292-fig1-figsupp8-data1-v1.xlsx
Figure 1—figure supplement 9
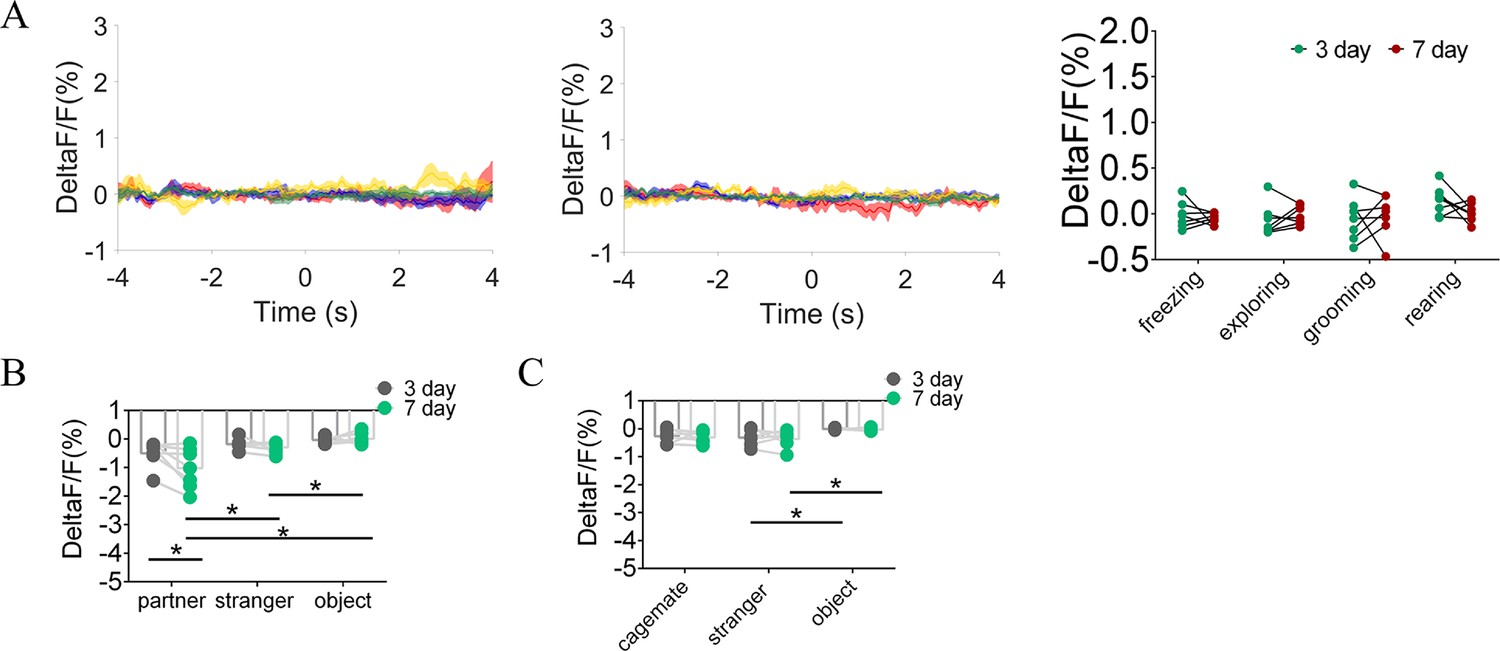
Quantification of fluorescence change during non-social behavioral bout and sniffing voles after cohabitation.
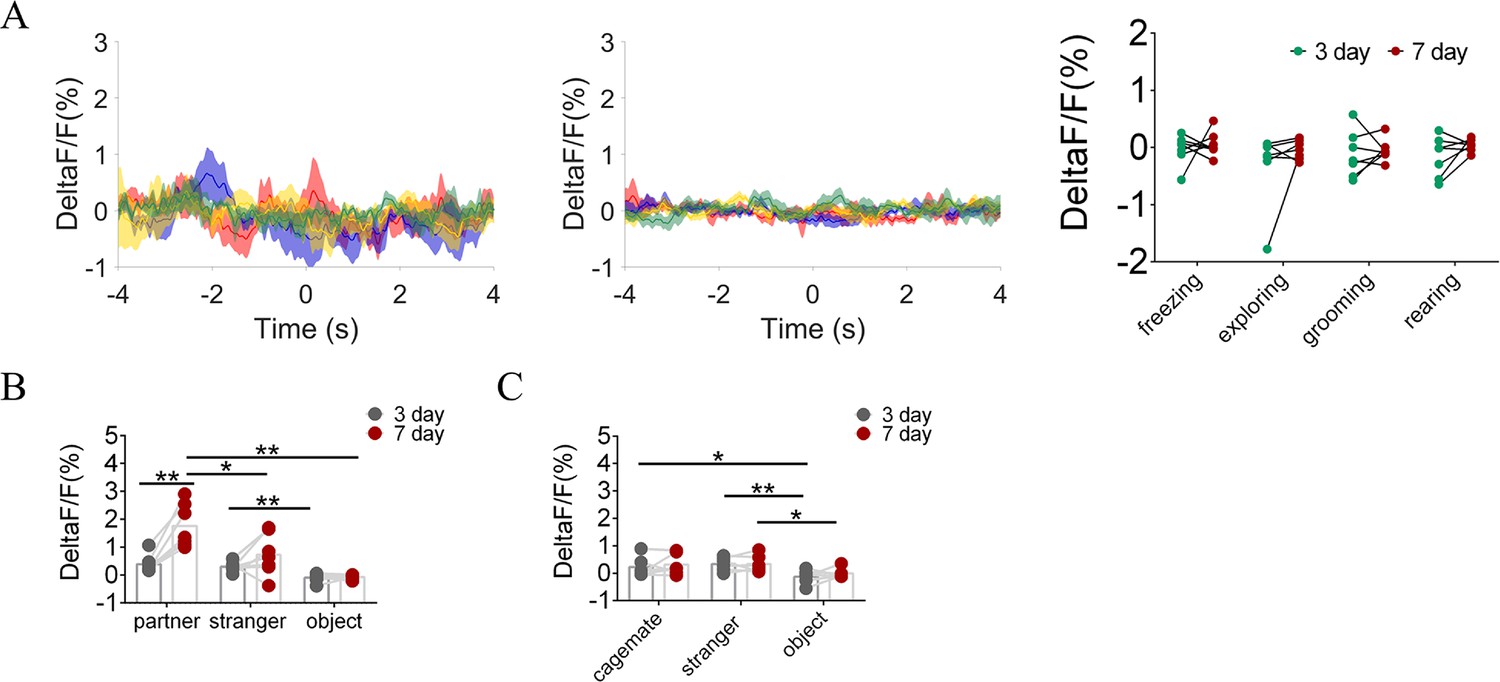
(A) DA sensor: Mean fluorescence signal changes of DA concentration during freezing (red line), exploring (blue line), grooming (yellow line), and rearing (green line) after 3 days (left) and 7 days (middle) of cohabitation. Right: Quantification (Two-Way Repeated Measures ANOVA) of changes during non-social behavioral bout after cohabitation with partner for 3 and 7 days (n=7 voles). (B) Quantification (Two-Way Repeated Measures ANOVA) of changes during sniffing partner, an unknown female, or an object after cohabitation for 3 and 7 days (n=7 voles). (C) Quantification (Two-Way Repeated Measures ANOVA) of changes during sniffing cagemate, male stranger, or object after cohabitation for 3 and 7 days (n=6 voles). Error bars = SEM. * represent p<0.05, ** represent p<0.01. See Figure 1—figure supplement 9—source data 1 for detailed statistics.
-
Figure 1—figure supplement 9—source data 1
Raw data and statistical results of changes in DA signals during non-social behavioral bouts and sniffing voles after cohabitation.
- https://cdn.elifesciences.org/articles/100292/elife-100292-fig1-figsupp9-data1-v1.xlsx
Figure 2 with 8 supplements
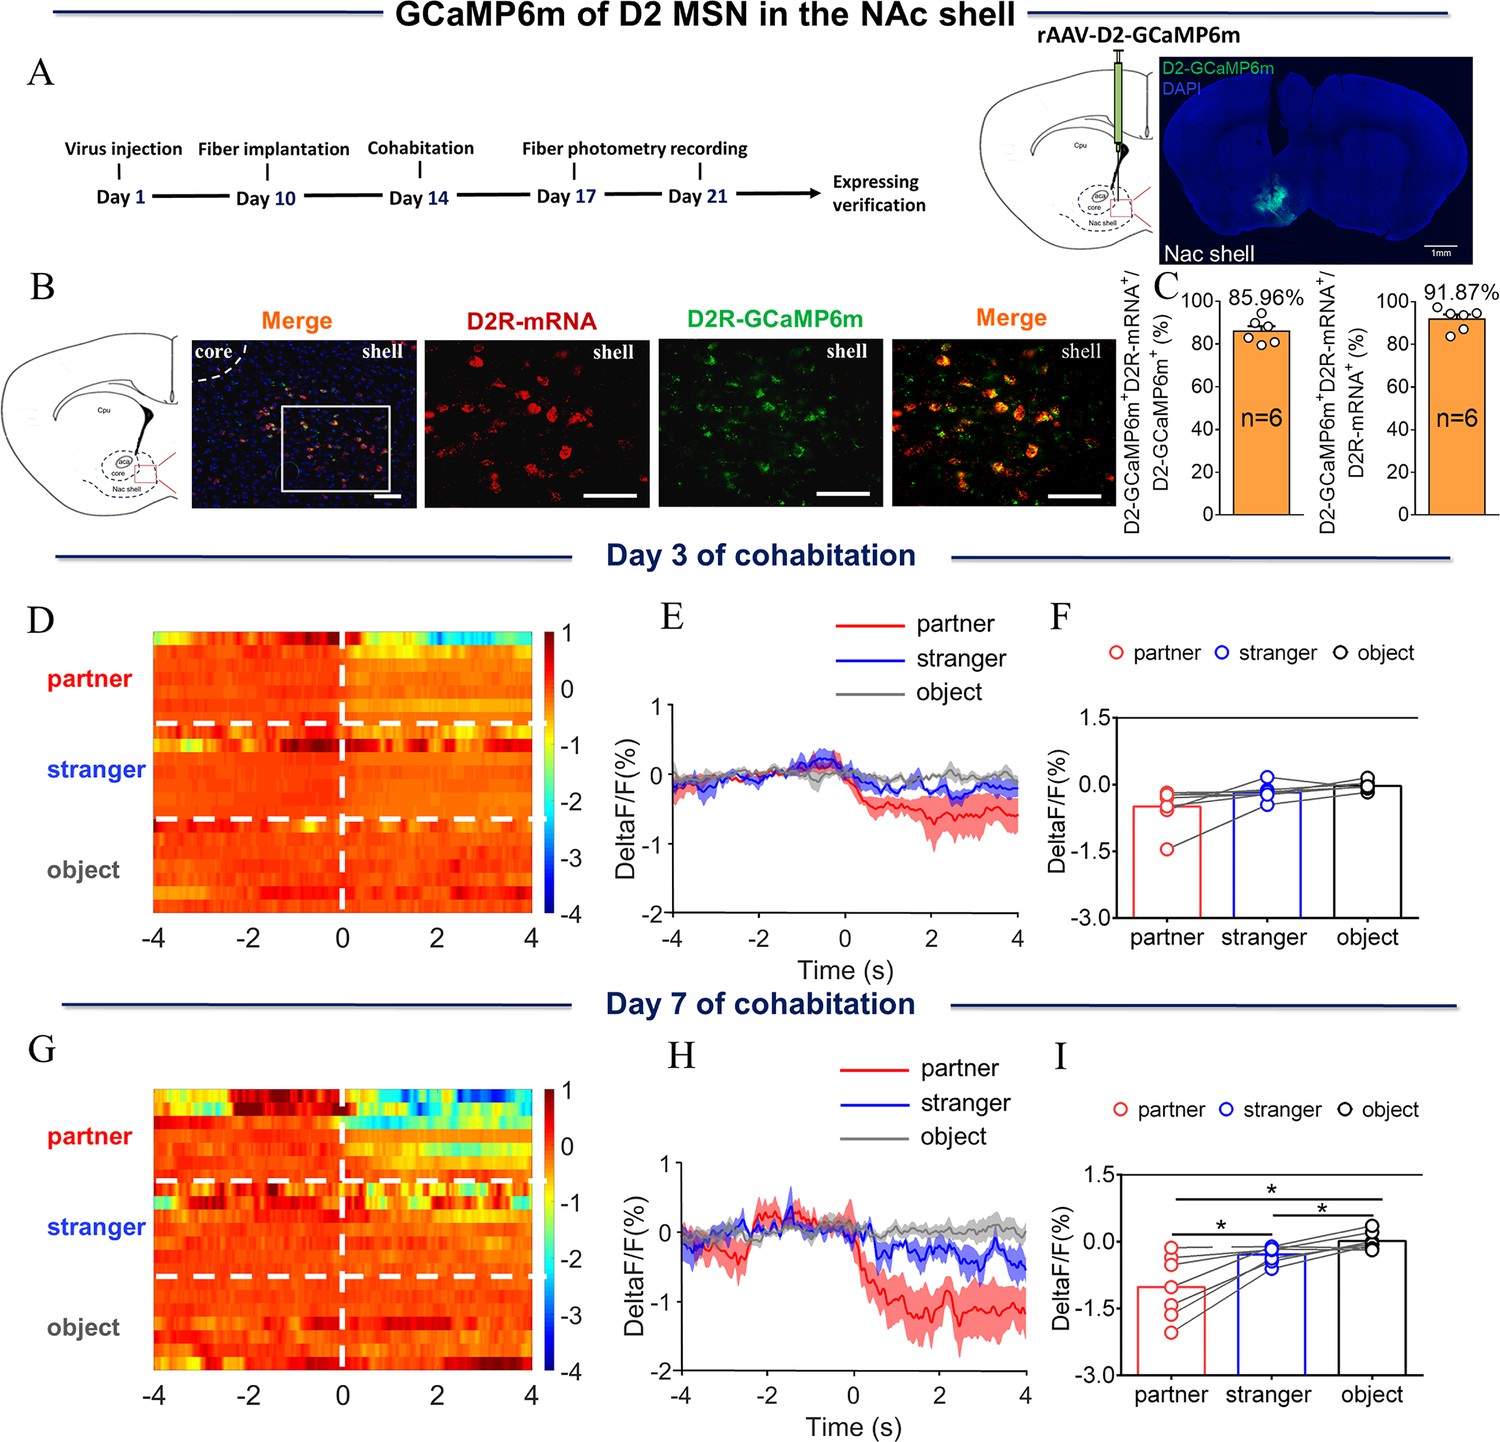
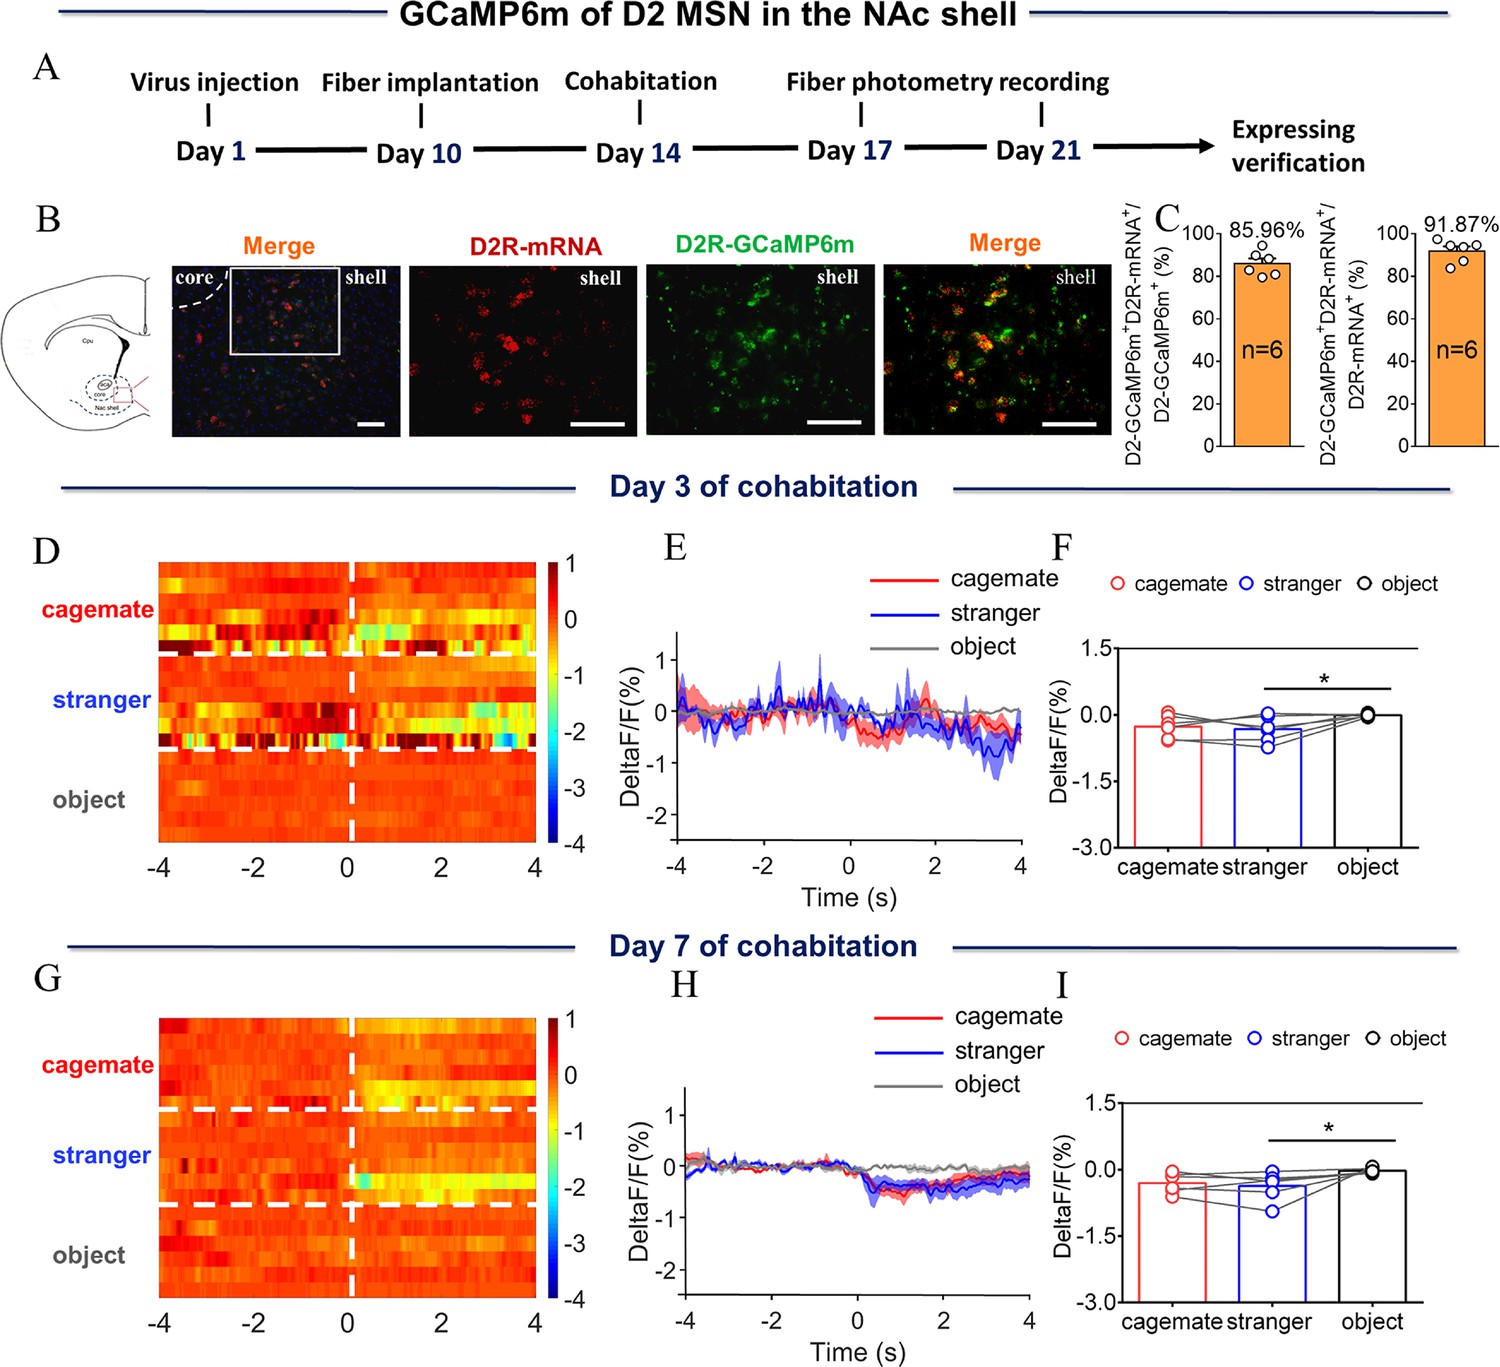
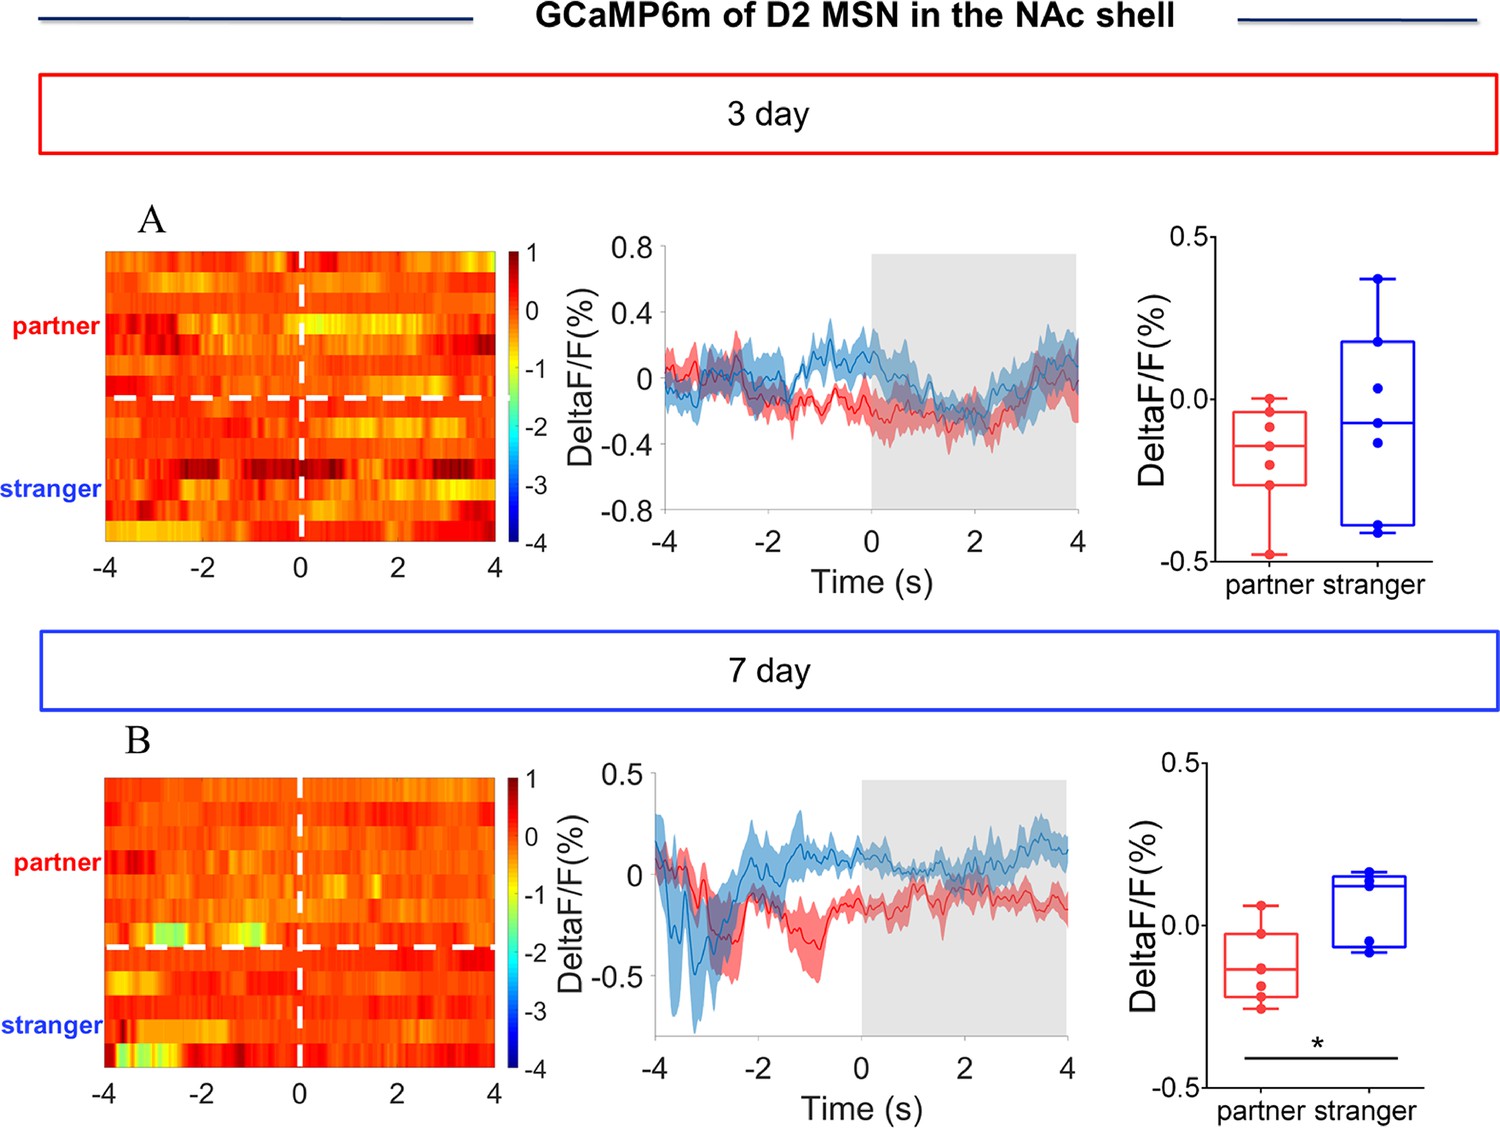
NAc shell D2 medium spinous neurons (MSNs) showing decreased activity upon sniffing their partner or an unknown female after cohabitation.
(A) Left: Timeline of experiments; right: Schematic diagrams depicting virus injection and recording sites as well as histology showing the expression of D2-GCaMP6m within the NAc shell. Scale bar: 1 mm. (B) Overlaps of D2-GCaMP6m (green), D2R-mRNA (red), and DAPI (blue) in the NAc shell. Scale bar: 100 μm. (C) Statistical chart showing that D2-GCaMP6m was relatively restricted to D2R-mRNA positive neurons (n=6 voles). (D) Heat map illustrating the calcium response (ΔF/F, %) of the NAc shell when sniffing a partner, an unknown female, or an object after cohabitation for 3 days. (E, H) Mean fluorescence signal changes of the calcium response during sniffing their partner (red line), an unknown female (blue line), or an object (gray line) after cohabitation for 3 days (E) and 7 days (H). The shaded areas along the different colors of lines show the margins of error. (F, I) Quantification (One-Way Repeated Measures ANOVA) of changes in calcium signals when sniffing their partner, an unknown female, or an object after cohabitation for 3 days (F) (n=7 voles) and 7 days (I) (n=7 voles). (G) Heat map illustrating calcium signals (ΔF/F, %) of the NAc shell when sniffing their partner, an unknown female, or an object after cohabitation for 7 days. All error bars = SEM. * represents p<0.05. See Figure 2—source data 1 for detailed statistics.
-
Figure 2—source data 1
Raw data and statistical results of changes in calcium signals during sniffing of their partner, an unknown female, and an object after cohabitation.
- https://cdn.elifesciences.org/articles/100292/elife-100292-fig2-data1-v1.xlsx
Figure 2—figure supplement 1
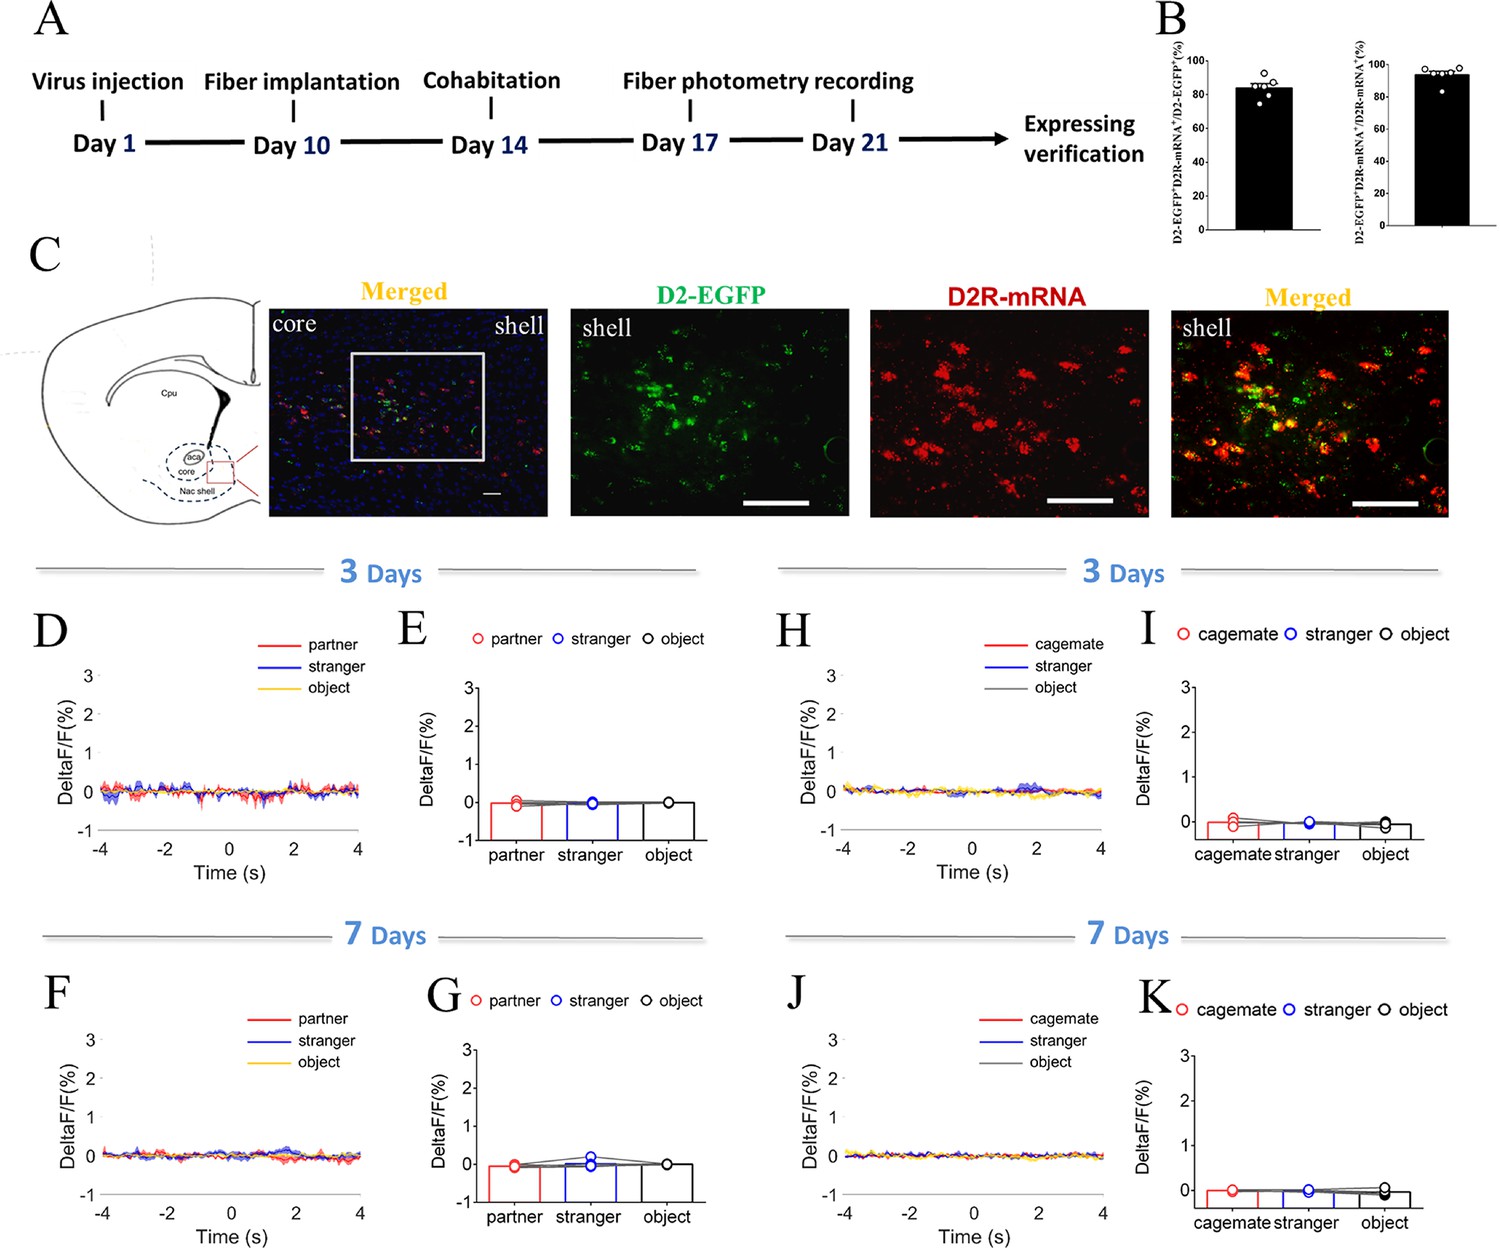
NAc shell D2 EGFP MSNs fluorescence signals after cohabitation.
(A) Timeline of experiments. (B) Statistical chart showed that EGFP was relatively restricted to D2R-mRNA positive neurons (n=6 voles). (C) Overlap of EGFP (green), D2R-mRNA (red), and DAPI (blue) in the NAc shell. Scale bar: 100 μm. (D, F) Mean fluorescence signal changes of calcium response during sniffing partner (red line), an unknown female (blue line), or an object (yellow line) after cohabitation for 3 days (D) and 7 days (F). (E, G) Quantification (Repeated One-way ANOVA) of changes in calcium signals during sniffing partner, an unknown female, or an object after cohabitation for 3 days (E) (n=5 voles) and 7 days (G) (n=5 voles). (H, J) Mean fluorescence signal changes of calcium response during sniffing cagemate (red line), an unknown male (blue line), or an object (yellow line) after cohabitation for 3 days (H) and 7 days (J). (I, K) Quantification (Repeated One-way ANOVA) of changes in calcium signals during sniffing cagemate, an unknown male, or an object after cohabitation for 3 days (I) (n=5 voles) and 7 days (K) (n=5 voles). All error bars = SEM. See Figure 2—figure supplement 1—source data 1 for detailed statistics.
-
Figure 2—figure supplement 1—source data 1
Raw data and statistical results of changes in D2-EGFP fluorescence signals during sniffing after cohabitation.
- https://cdn.elifesciences.org/articles/100292/elife-100292-fig2-figsupp1-data1-v1.xlsx
Figure 2—figure supplement 2
NAc shell D2 MSNs showing decreased activity upon sniffing their cagemate or an unknown male after cohabitation.
(A) Timeline of experiments. (B) Overlap of D2-GCaMP6m (green), D2R-mRNA (red), and DAPI (blue) in the NAc shell. Scale bar: 100 μm. (C) Statistical chart showed that D2-GCaMP6m was relatively restricted to D2R-mRNA positive neurons (n=6 voles). (D) Heat map illustrating the calcium signals (ΔF/F, %) of NAc shell during sniffing cagemate, an unknown male, or an object. (E) Mean fluorescence signal changes of D2 MSNs during sniffing cagemate (red line), an unknown male (blue line), or an object (gray line) after 3 days of cohabitation. (F) Quantification (Repeated One-way ANOVA) of changes in fluorescence signals during sniffing cagemate, an unknown male, or an object after 3 days of cohabitation (n=6 voles). (G) Heat map illustrating the calcium signals (ΔF/F, %) of NAc shell during sniffing cagemate, an unknown male, or an object. (H) Mean fluorescence signal changes of D2 MSNs during sniffing cagemate (red line), an unknown male (blue line), or an object (gray line) after 7 days of cohabitation. (I) Quantification (Repeated One-way ANOVA) of changes in fluorescence signals during sniffing cagemate, an unknown male, or an object after 7 days of cohabitation (n=6 voles). All error bars = SEM. * represents p<0.05. See 1Figure 2—figure supplement 2—source data 1 for detailed statistics.
-
Figure 2—figure supplement 2—source data 1
Raw data and statistical results of changes in fluorescence signals during sniffing of their cagemate, an unknown male, and an object after cohabitation.
- https://cdn.elifesciences.org/articles/100292/elife-100292-fig2-figsupp2-data1-v1.xlsx
Figure 2—figure supplement 3
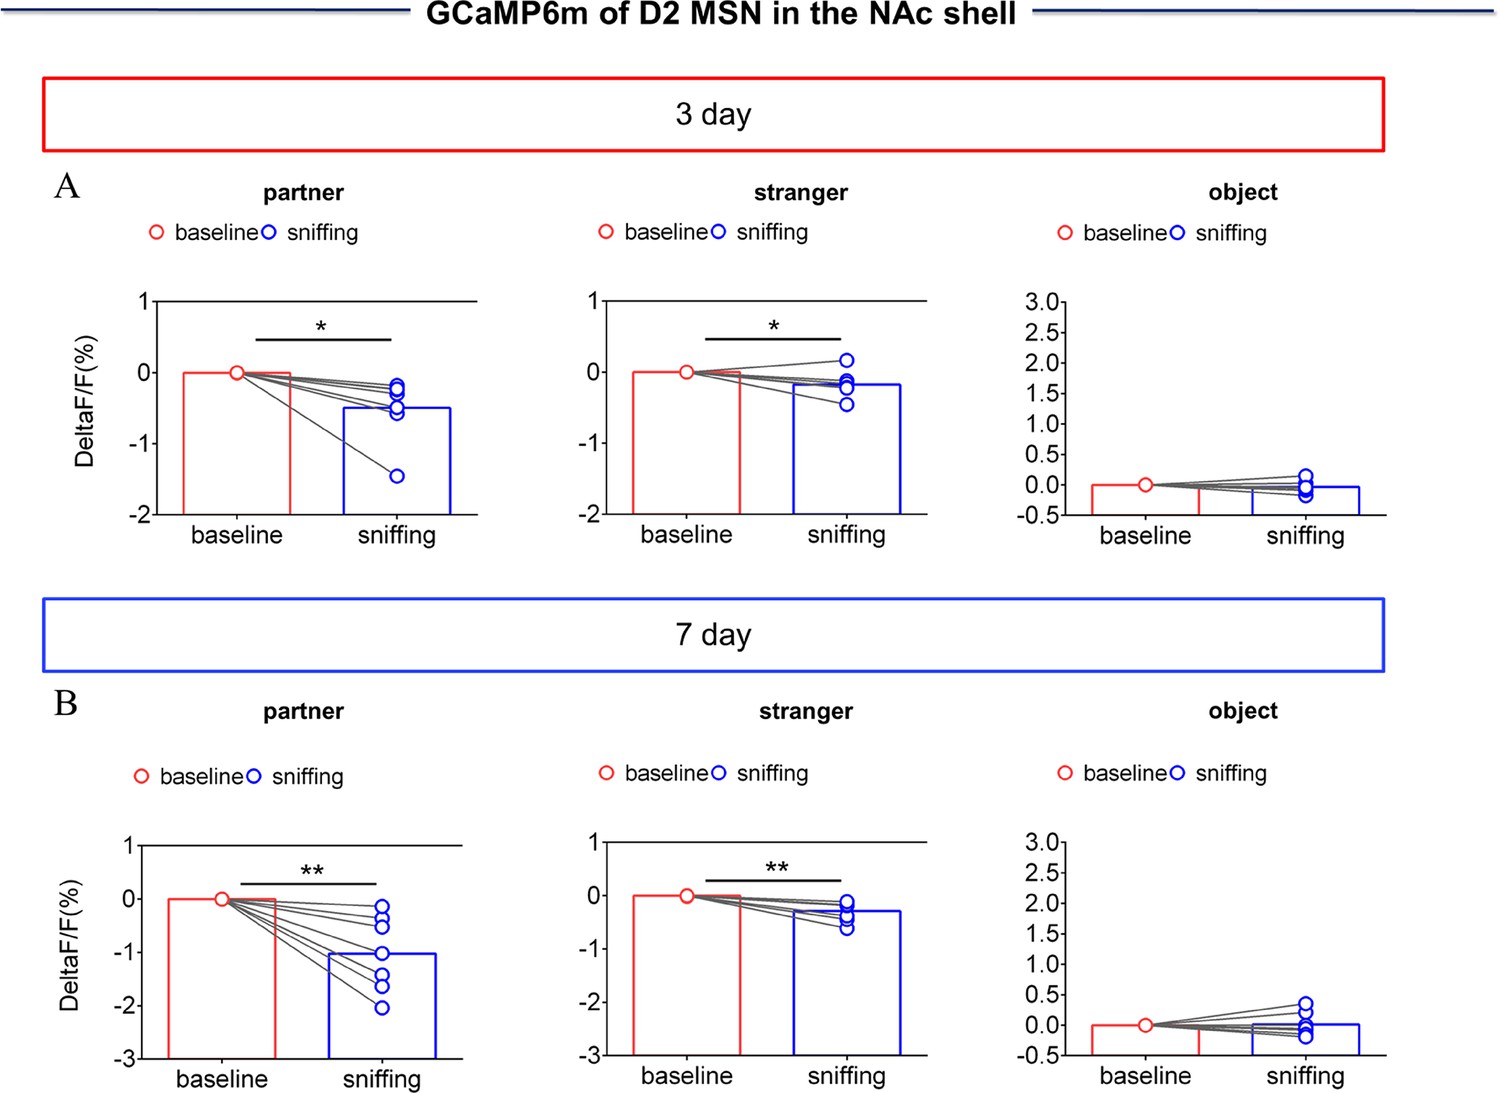
NAc shell Dynamics of D2 MSNs when sniffing their partner or an unknown female after cohabitation.
(A) Quantification (Paired t test) of changes in calcium signals during sniffing partner (left), an unknown female (middle), or an object (right) after cohabitation for 3 days (n=7 voles). (B) Quantification (Paired t test) of changes in calcium signals during sniffing partner (left), an unknown female (middle), or an object (right) after cohabitation for 7 days (n=7 voles). Error bars = SEM * represents p<0.05, ** represents p<0.01. See Figure 2—figure supplement 3—source data 1 for detailed statistics.
-
Figure 2—figure supplement 3—source data 1
Raw data and statistical results of changes in calcium signals during sniffing their partner, an unknown female, and an object after cohabitation.
- https://cdn.elifesciences.org/articles/100292/elife-100292-fig2-figsupp3-data1-v1.xlsx
Figure 2—figure supplement 4
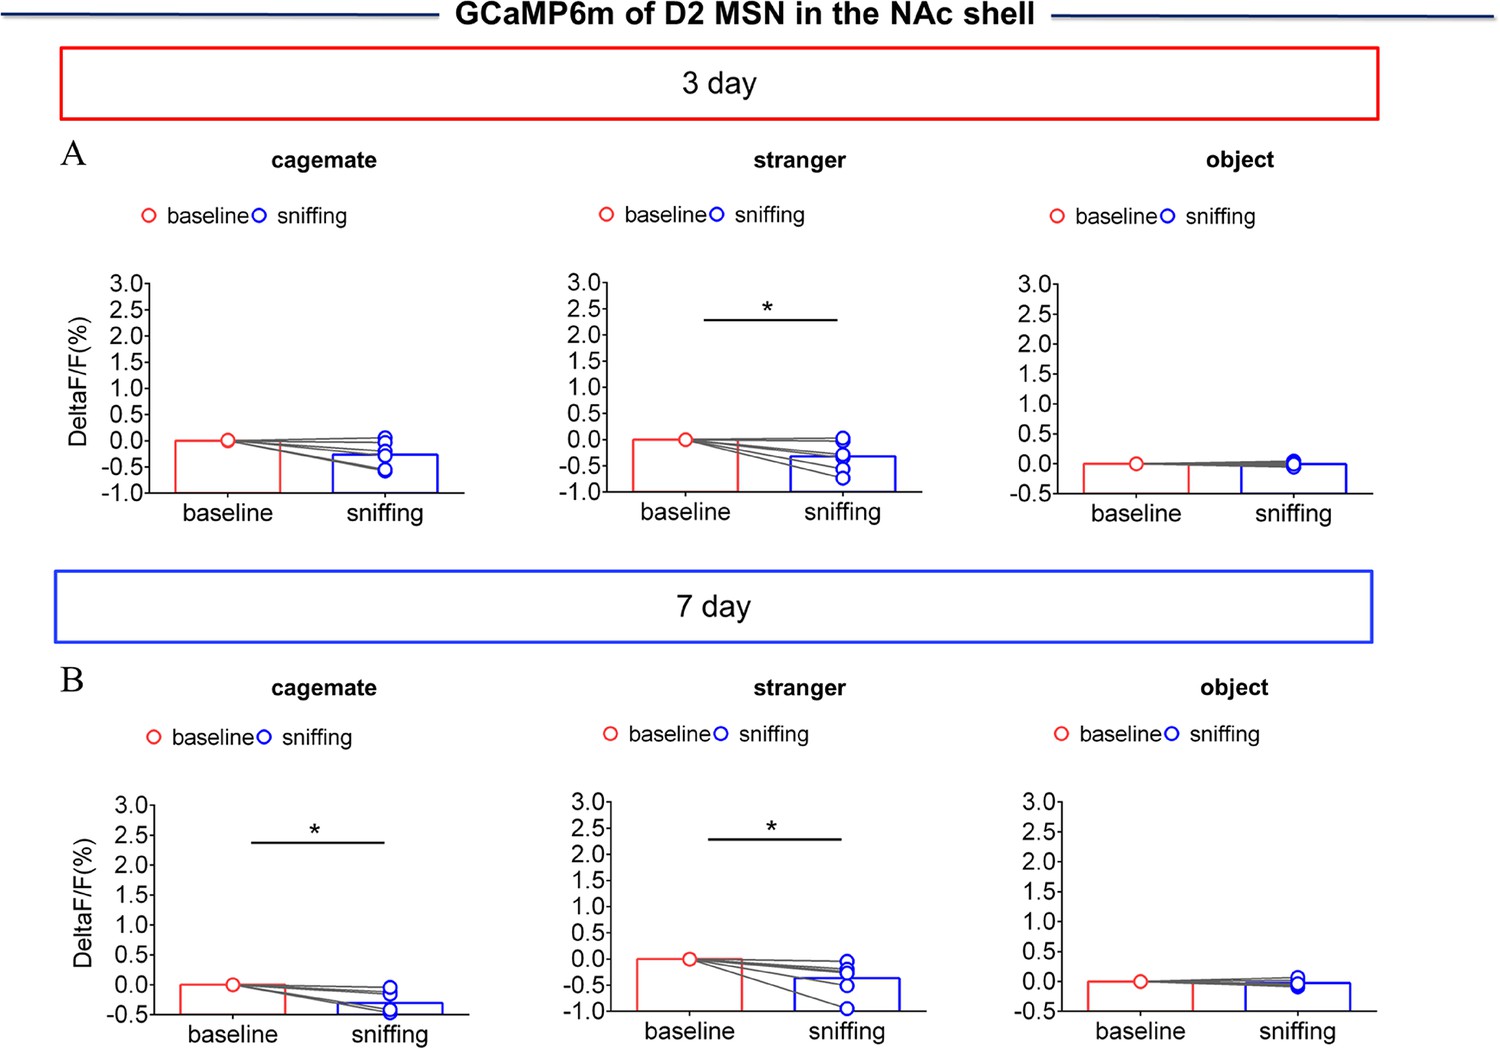
NAc shell Dynamics of D2 MSNs when sniffing their cagemate or an unknown male after cohabitation.
(A) Quantification (Paired t test) of changes in calcium signals during sniffing cagemate (left), an unknown male (middle), or an object (right) after cohabitation for 3 days (n=6 voles). (B) Quantification (Paired t test) of changes in calcium signals during sniffing cagemate (left), an unknown male (middle), or an object (right) after cohabitation for 7 days (n=6 voles). Error bars = SEM. * represent p<0.05. See Figure 2—figure supplement 4—source data 1 for detailed statistics.
-
Figure 2—figure supplement 4—source data 1
Raw data and statistical results of changes in calcium signals during sniffing their cagemate, an unknown male, and an object after cohabitation.
- https://cdn.elifesciences.org/articles/100292/elife-100292-fig2-figsupp4-data1-v1.xlsx
Figure 2—figure supplement 5
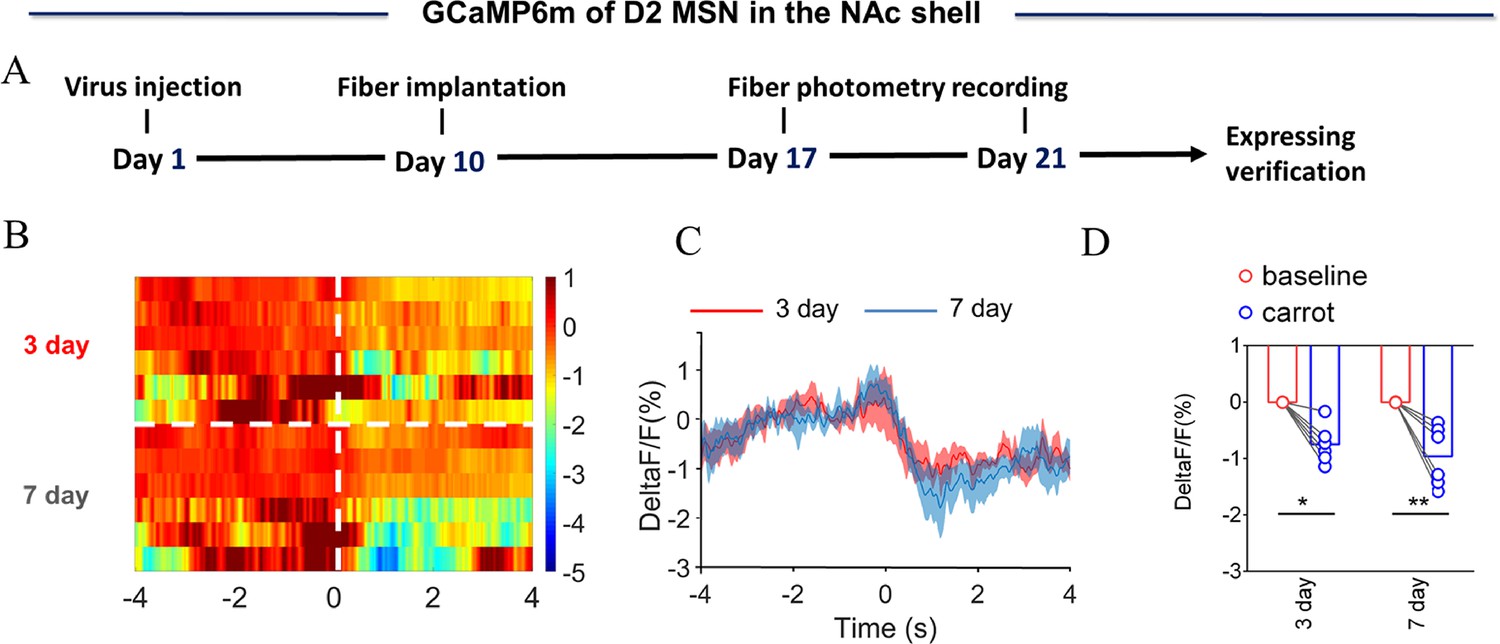
NAc shell Dynamics of D2 MSNs upon eating carrot.
(A) Timeline of experiments. (B) Heat map illustrating the extracellular D2 MSNs (ΔF/F, %) of NAc shell upon eating carrot after cohabitation for 3 and 7 days. (C) Mean fluorescence signal changes of D2 MSNs upon eating carrot after cohabitation for 3 (red line) and 7 days (blue line). The shaded area along the different colored lines represents error margins. (D) Quantification (Two-Way Repeated Measures ANOVA) of changes in D2 MSNs signals upon eating carrot after cohabitation for 3 and 7 days. All error bars = SEM. * represent p<0.05, ** represent p<0.01, *** represent p<0.001. See Figure 2—figure supplement 5—source data 1 for detailed statistics.
-
Figure 2—figure supplement 5—source data 1
Raw data and statistical results of changes in calcium signals upon eating carrot.
- https://cdn.elifesciences.org/articles/100292/elife-100292-fig2-figsupp5-data1-v1.xlsx
Figure 2—figure supplement 6
NAc shell Dynamics of D2 MSNs during side-by-side contact after cohabitation.
(A) Mean fluorescence signal changes (middle) and quantification (paired t test) (right) of D2 MSNs during side-by-side contact with partner (n=7 voles) or an unknown female (n=7 voles) after 3 days of cohabitation. Left: Heat map illustrating the fluorescence signals of NAc shell D2 MSNs during side-by-side contact after cohabitation for 3 days. (B) Mean fluorescence signal changes (middle) and quantification (unpaired t test) (right) of D2 MSNs during side-by-side contact with partner (n=7 voles) or an unknown female (n=5 voles) after 7 days of cohabitation. Left: Heat map illustrating the fluorescence signals of NAc shell D2 MSNs during side-by-side contact after cohabitation for 7 days. Not all animals engaged in side-by-side contact. The number of data points was different from the number of subjects because some animals did not show side-by-side contact, thus we could not detect the changes in fluorescence signals upon the occurrence of this behavior. All error bars = SEM. * represent p<0.05. See Figure 2—figure supplement 6—source data 1 for detailed statistics.
-
Figure 2—figure supplement 6—source data 1
Raw data and statistical results of changes in calcium signals during side-by-side contact after cohabitation.
- https://cdn.elifesciences.org/articles/100292/elife-100292-fig2-figsupp6-data1-v1.xlsx
Figure 2—figure supplement 7
Quantification of fluorescence change during non-social behavioral bout and sniffing voles after cohabitation.
(A) Mean fluorescence signal changes of D2-MSNs during freezing (red line), exploring (blue line), grooming (yellow line), and rearing (green line) after 3 days (left) and 7 days (middle) of cohabitation. Right: Quantification (Two-Way Repeated Measures ANOVA) of changes during non-social behavioral bout after cohabitation with partner for 3 and 7 days (n=7 voles). (B) Quantification (Two-Way Repeated Measures ANOVA) of changes during sniffing partner, an unknown female, or an object after cohabitation for 3 and 7 days (n=7 voles). (C) Quantification (Two-Way Repeated Measures ANOVA) of changes during sniffing cagemate, male stranger, or object after cohabitation for 3 and 7 days (n=6 voles). Error bars = SEM. * represent p<0.05, ** represent p<0.01. See Figure 2—figure supplement 7—source data 1 for detailed statistics.
-
Figure 2—figure supplement 7—source data 1
Raw data and statistical results of changes in calcium signals during non-social behavioral bouts and sniffing voles after cohabitation.
- https://cdn.elifesciences.org/articles/100292/elife-100292-fig2-figsupp7-data1-v1.xlsx
Figure 2—figure supplement 8
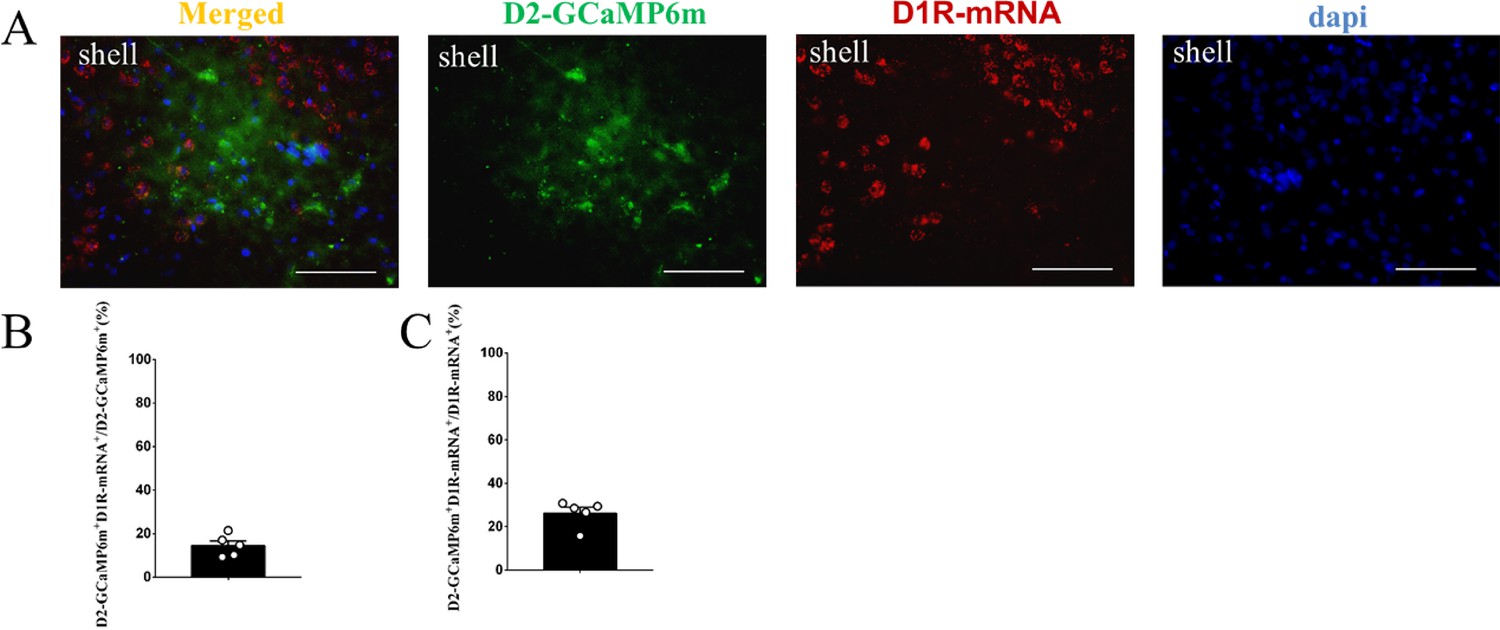
The supplement FISH image of the D2-GCaMP6m MSNs in the NAc shell.
(A) Overlap of D2-GCaMP6m (green), D1R-mRNA (red), and DAPI (blue) in the NAc shell. Scale bar: 100 μm. (B–C) Statistical chart showed that D2-GCaMP6m was relatively restricted to D1R-mRNA positive neurons (n=5 voles).
-
Figure 2—figure supplement 8—source data 1
Counts of D2-GCaMP6m (green) positive neurons, D1R-mRNA (red) positive neurons, and co-expressed neurons.
- https://cdn.elifesciences.org/articles/100292/elife-100292-fig2-figsupp8-data1-v1.xlsx
Figure 3 with 8 supplements
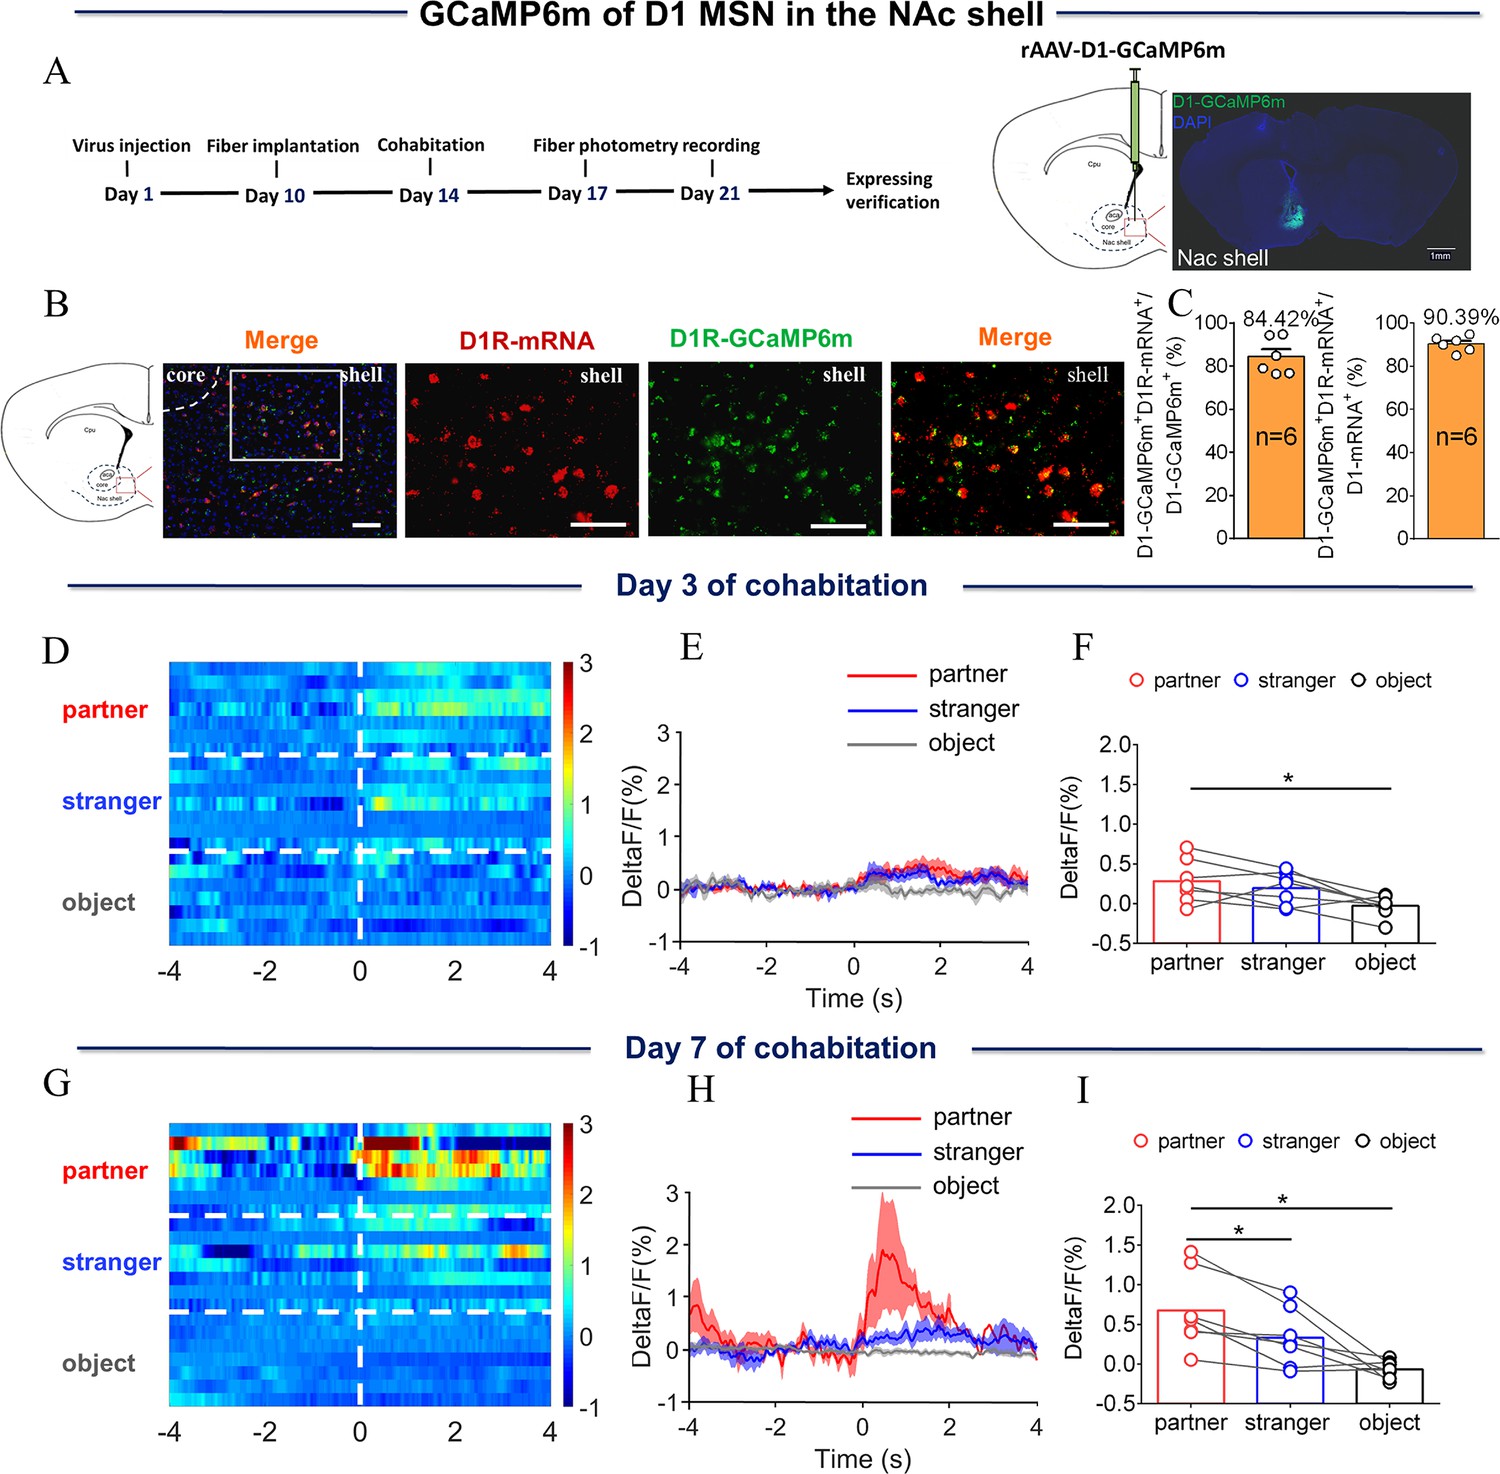
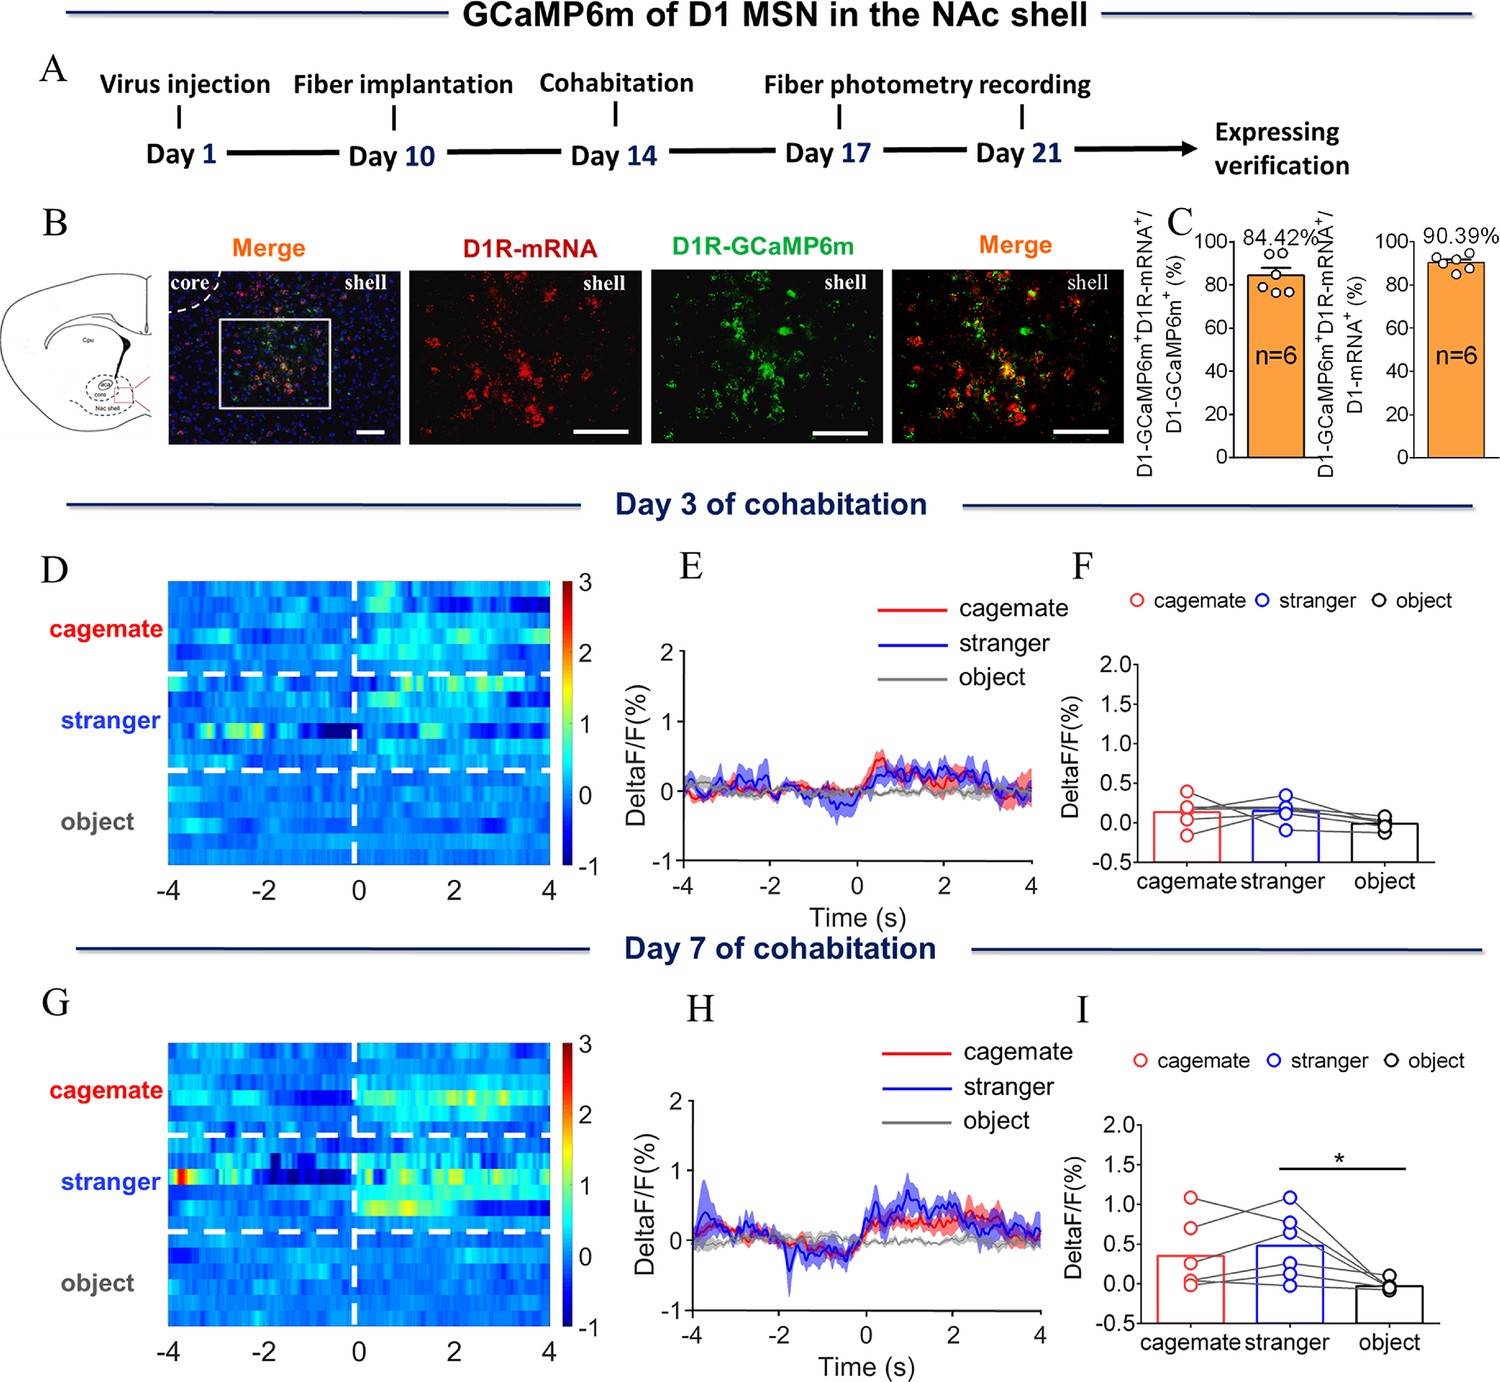
NAc shell D1 MSNs showing increased activity when sniffing their partner or an unknown female after cohabitation.
(A) Left: Timeline of experiments; right: Schematic diagrams depicting the virus injection and recording sites as well as histology showing the expression of D1-GCaMP6m within the NAc shell. Scale bar: 1 mm. (B) Overlap of D1-GCaMP6m (green), D1R-mRNA (red), and DAPI (blue) in the NAc shell. Scale bar: 100 μm. (C) Statistical chart showing that D1-GCaMP6m was relatively restricted to D1R-mRNA positive neurons (n=6 voles). (D) Heat map illustrating the calcium signals (ΔF/F, %) of the NAc shell when sniffing their partner, an unknown female, or an object after cohabitation for 3 days. (E, H) Mean fluorescence changes of calcium signals when sniffing their partner (red line), an unknown female (blue line), or an object (gray line) after cohabitation for 3 days (E) and 7 days (H). The shaded area along the different colored lines represents error margins. (F, I) Quantification (One-Way Repeated Measures ANOVA) of changes in calcium signals when sniffing their partner, an unknown female, or an object after cohabitation for 3 days (F) (n=7 voles) and 7 days (I) (n=7 voles). (G) Heat map illustrating the calcium signals (ΔF/F, %) of NAc shell when sniffing their partner, an unknown female, or an object after cohabitation for 7 days. All error bars = SEM. * represents p<0.05. See Figure 3—source data 1 for detailed statistics.
-
Figure 3—source data 1
Raw data and statistical results of changes in calcium signals during sniffing their partner, an unknown female, and an object after cohabitation.
- https://cdn.elifesciences.org/articles/100292/elife-100292-fig3-data1-v1.xlsx
Figure 3—figure supplement 1
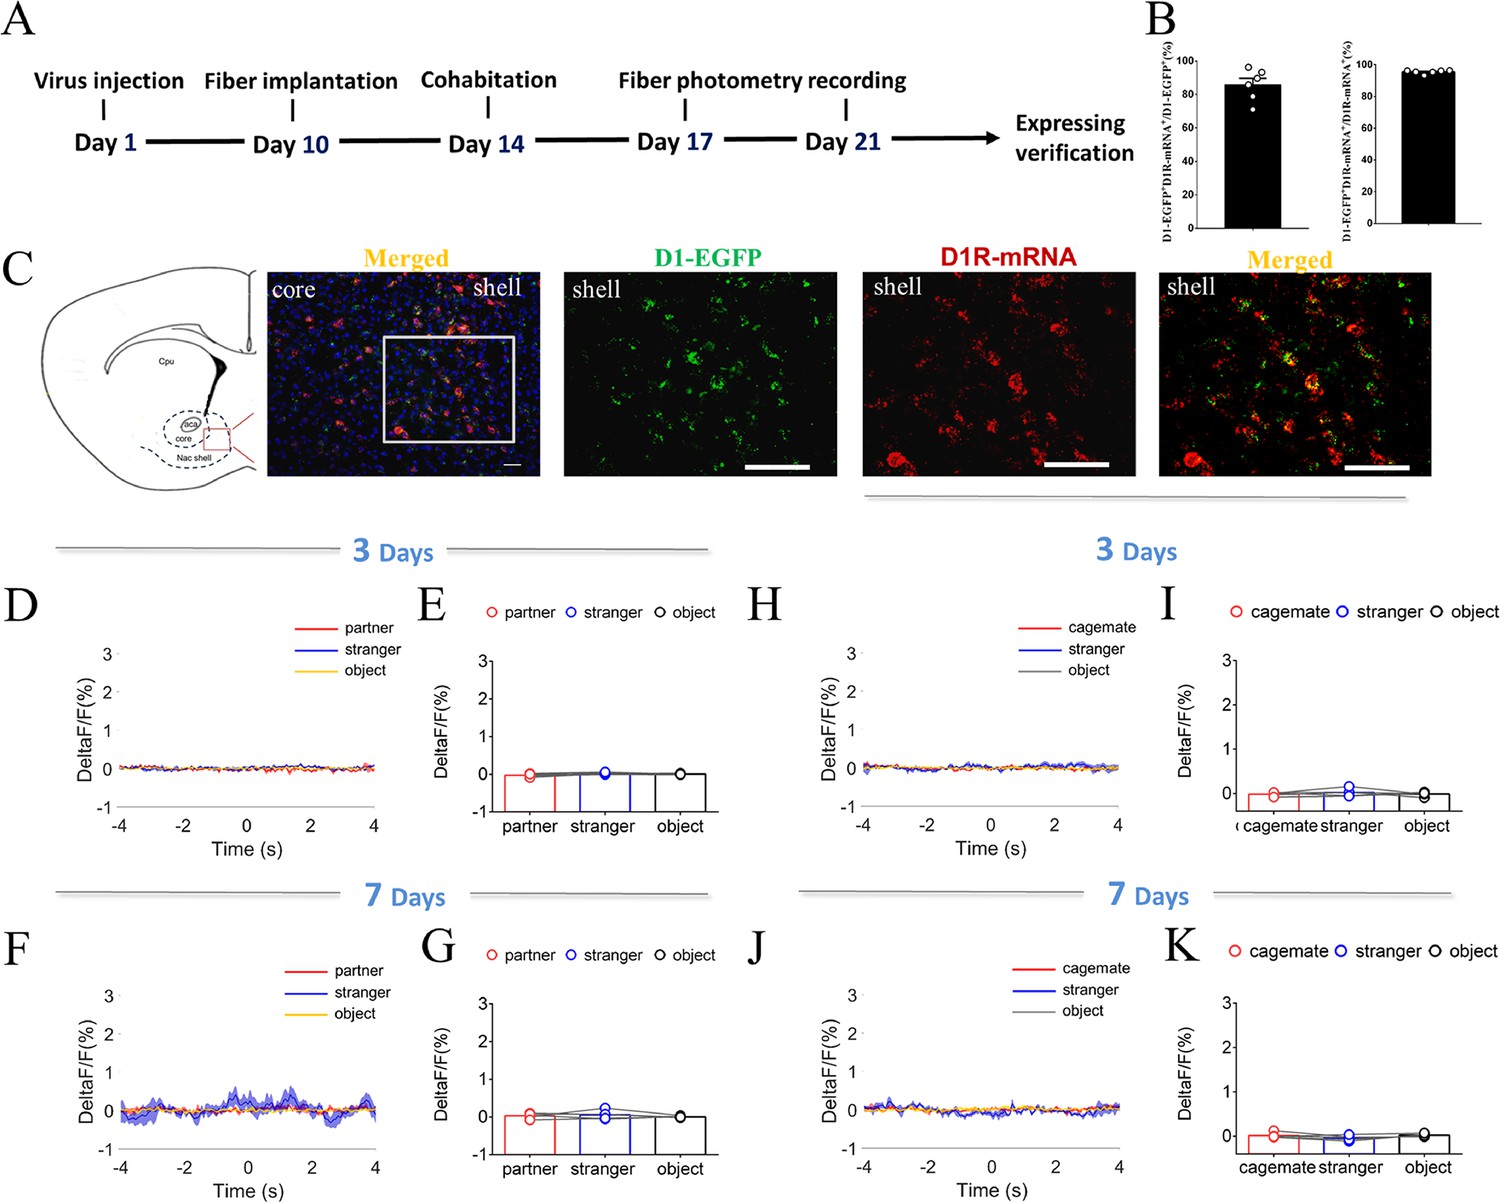
NAc shell D1 EGFP MSNs fluorescence signal with injection of control virus after cohabitation.
(A) Timeline of experiments. (B) Statistical chart showed that EGFP was relatively restricted to D1R-mRNA positive neurons (n=6 voles). (C) Overlap of EGFP (green), D1R-mRNA (red), and DAPI (blue) in the NAc shell. Scale bar: 100 μm. (D, F) Mean fluorescence signal changes of calcium response during sniffing partner (red line), an unknown female (blue line) or an object (yellow line) after cohabitation for 3 days (D) and 7 days (F). (E, G) Quantification (Repeated One-way ANOVA) of changes in calcium signals during sniffing partner, an unknown female or an object after cohabitation for 3 days (E) (n=5 voles) and 7 days (G) (n=5 voles). (H, J) Mean fluorescence signal changes of calcium response during sniffing cagemate (red line), an unknown male (blue line), or an object (yellow line) after cohabitation for 3 days (H) and 7 days (J). (I, K) Quantification (Repeated One-way ANOVA) of changes in calcium signals during sniffing cagemate, an unknown male, or an object after cohabitation for 3 days (I) (n=5 voles) and 7 days (K) (n=5 voles). All error bars = SEM. See Figure 3—figure supplement 1—source data 1 for detailed statistics.
-
Figure 3—figure supplement 1—source data 1
Raw data and statistical results of changes in D1-EGFP fluorescence signals during sniffing after cohabitation.
- https://cdn.elifesciences.org/articles/100292/elife-100292-fig3-figsupp1-data1-v1.xlsx
Figure 3—figure supplement 2
NAc shell D1 MSNs showing increased activity when sniffing their cagemate or an unknown male after cohabitation.
(A) Timeline of experiments. (B) Overlap of D1-GCaMP6m (green), D1R-mRNA (red), and DAPI (blue) in the NAc shell. Scale bar: 100 μm. (C) Statistical chart showed that D1-GCaMP6m was relatively restricted to D1R-mRNA positive neurons (n=6 voles). (D) Heat map illustrating the calcium signals (ΔF/F, %) of NAc shell during sniffing cagemate, an unknown male, or an object. (E) Mean fluorescence signal changes of D1 MSNs during sniffing cagemate (red line), an unknown male (blue line), or an object (gray line) after 3 days of cohabitation. (F) Quantification (Repeated One-way ANOVA) of changes in fluorescence signal during sniffing cagemate, an unknown male, or an object after 3 days of cohabitation (n=6 voles). (G) Heat map illustrating the calcium signals (ΔF/F, %) of NAc shell during sniffing cagemate, an unknown male, or an object. (H) Mean fluorescence signal changes of D1 MSNs during sniffing cagemate (red line), an unknown male (blue line), or an object (gray line) after 7 days of cohabitation. (I) Quantification (Repeated One-way ANOVA) of change in fluorescence signal during sniffing cagemate, an unknown male, or an object after 7 days of cohabitation (n=6 voles). All error bars = SEM. See Figure 3—figure supplement 2—source data 1 for detailed statistics.
-
Figure 3—figure supplement 2—source data 1
Raw data and statistical results of changes in fluorescence signals during sniffing their cagemate, an unknown male, and an object after cohabitation.
- https://cdn.elifesciences.org/articles/100292/elife-100292-fig3-figsupp2-data1-v1.xlsx
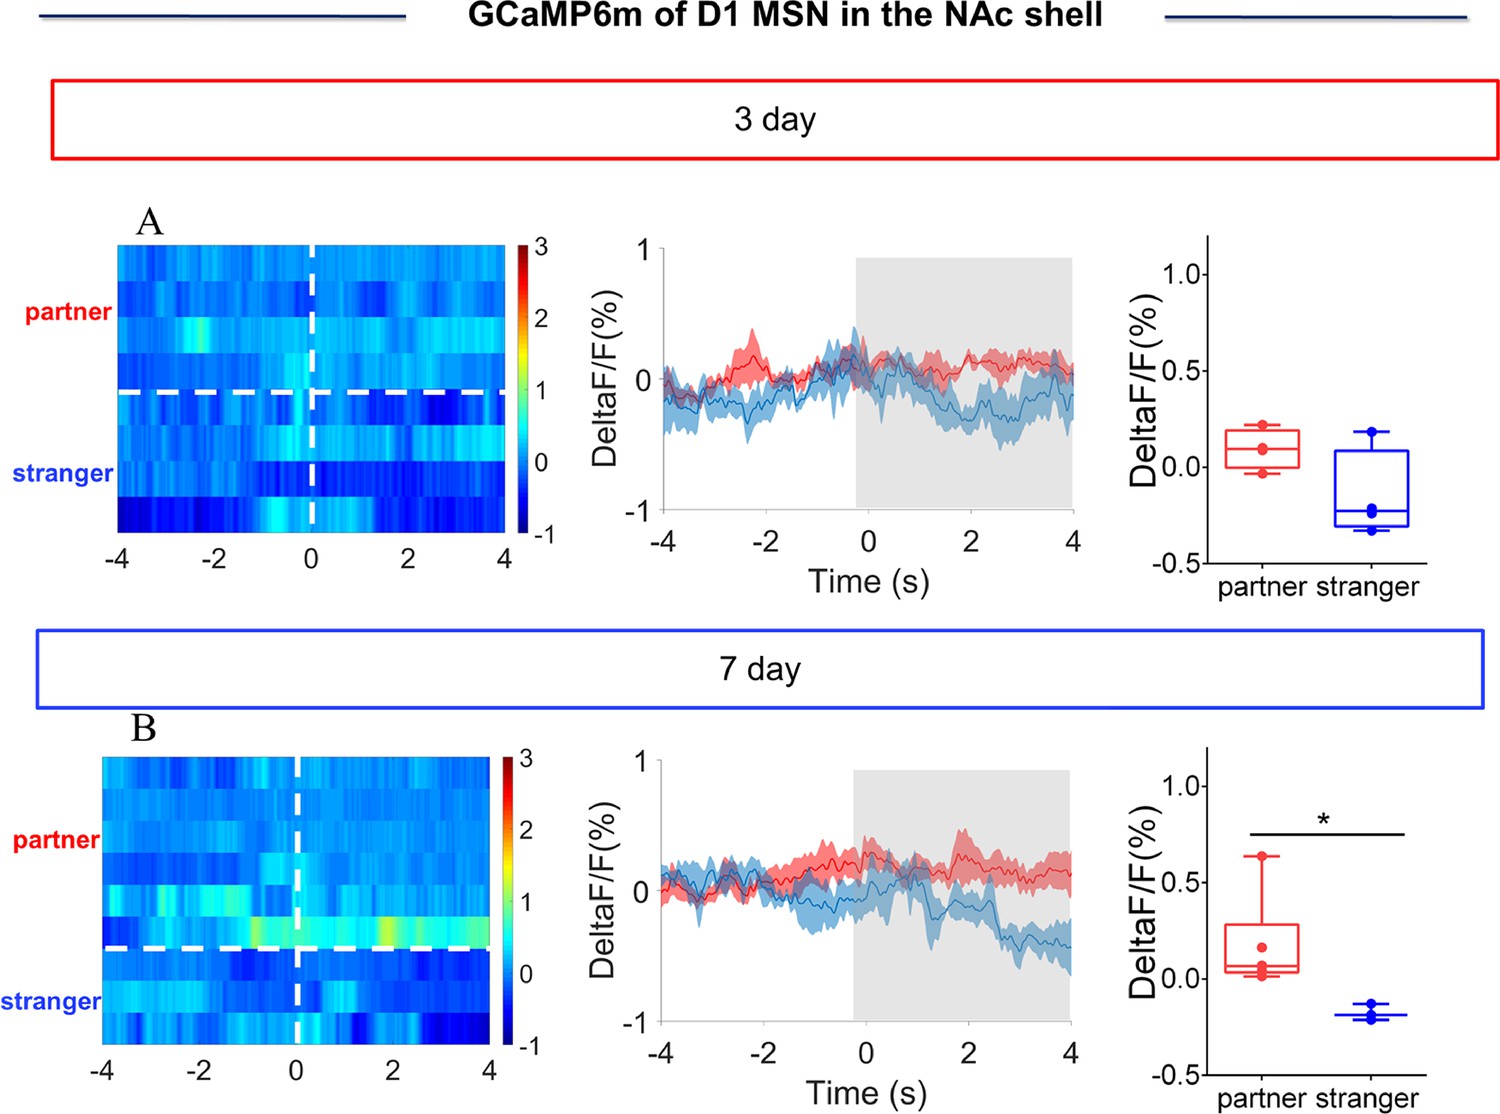
Figure 3—figure supplement 3
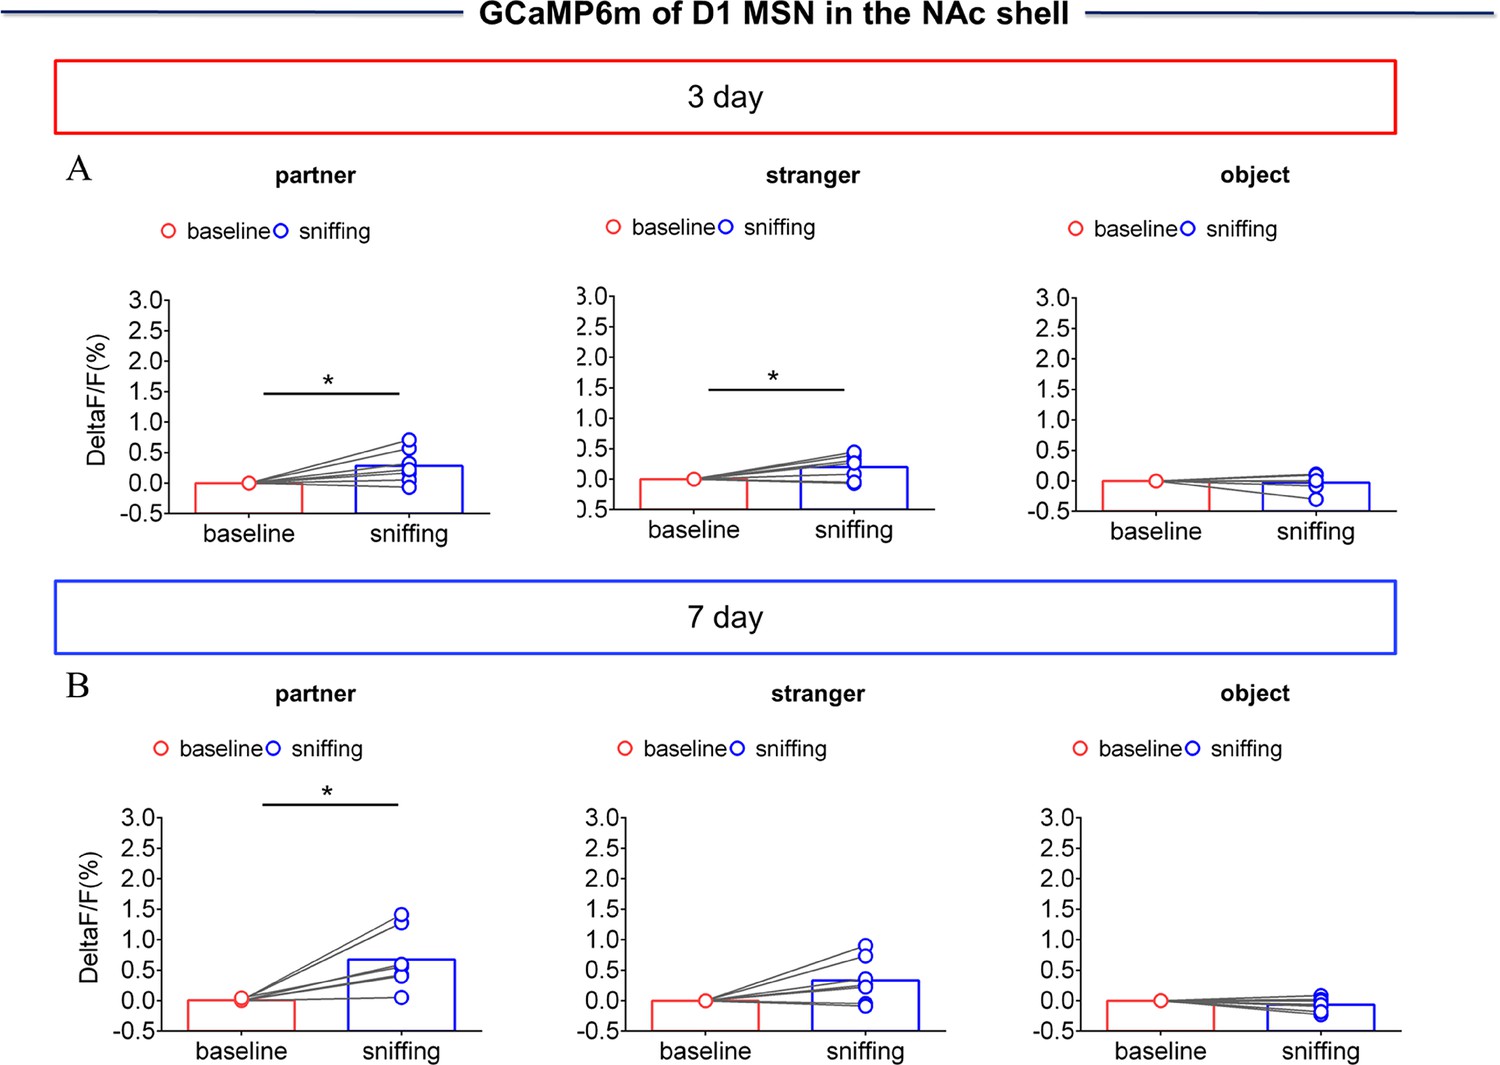
NAc shell Dynamics of D1 MSNs when sniffing their partner or an unknown female after cohabitation.
(A) Quantification (Paired t test) of changes in calcium signals during sniffing partner (left), an unknown female (middle), or an object (right) after cohabitation for 3 days (n=7 voles). (B) Quantification (Paired t test) of changes in calcium signals during sniffing partner (left), an unknown female (middle) or an object (right) after cohabitation for 7 days (n=7 voles). Error bars = SEM * represents p<0.05, ** represents p<0.01. See Figure 3—figure supplement 3—source data 1 for detailed statistics.
-
Figure 3—figure supplement 3—source data 1
Raw data and statistical results of changes in calcium signals during sniffing of their partner, an unknown female, and an object after cohabitation.
- https://cdn.elifesciences.org/articles/100292/elife-100292-fig3-figsupp3-data1-v1.xlsx
Figure 3—figure supplement 4
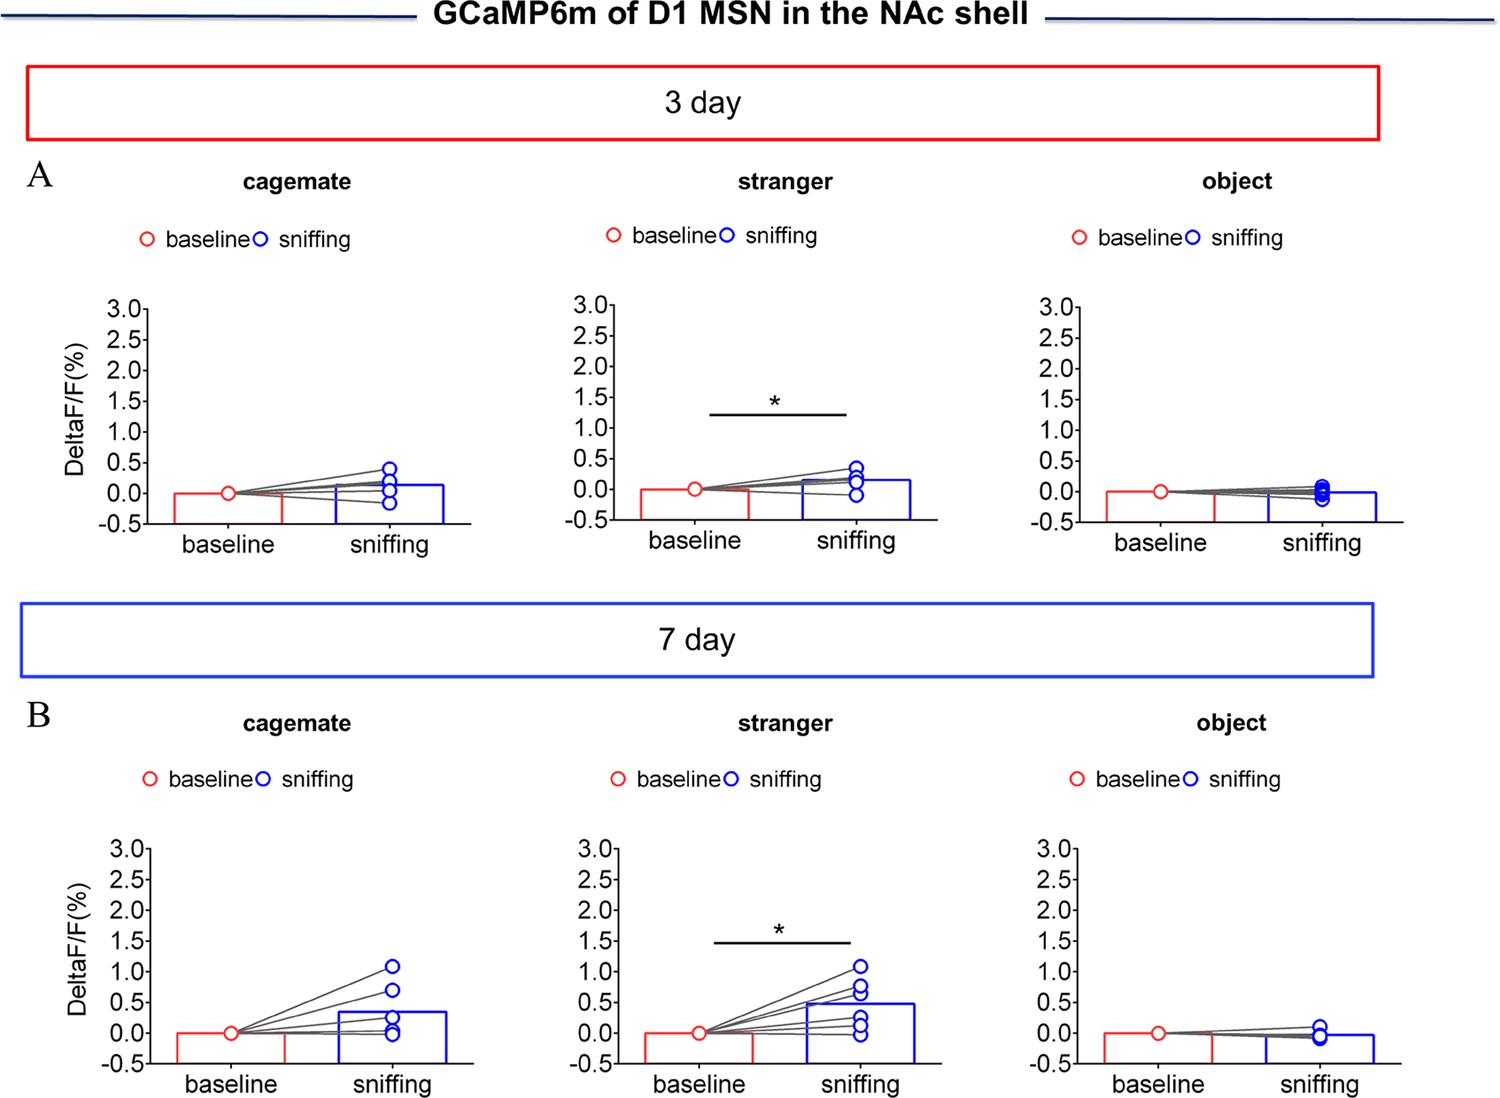
NAc shell Dynamics of D1 MSNs when sniffing their cagemate or an unknown male after cohabitation.
(A) Quantification (Paired t test) of change in calcium signals during sniffing cagemate (left), an unknown male (middle), or an object (right) after cohabitation for 3 days (n=6 voles). (B) Quantification (Paired t test) of changes in calcium signals during sniffing cagemate (left), an unknown male (middle), or an object (right) after cohabitation for 7 days (n=6 voles). Error bars = SEM. * represent p<0.05. See Figure 3—figure supplement 4—source data 1 for detailed statistics.
-
Figure 3—figure supplement 4—source data 1
Raw data and statistical results of changes in calcium signals during sniffing of their cagemate, an unknown male, and an object after cohabitation.
- https://cdn.elifesciences.org/articles/100292/elife-100292-fig3-figsupp4-data1-v1.xlsx
Figure 3—figure supplement 5
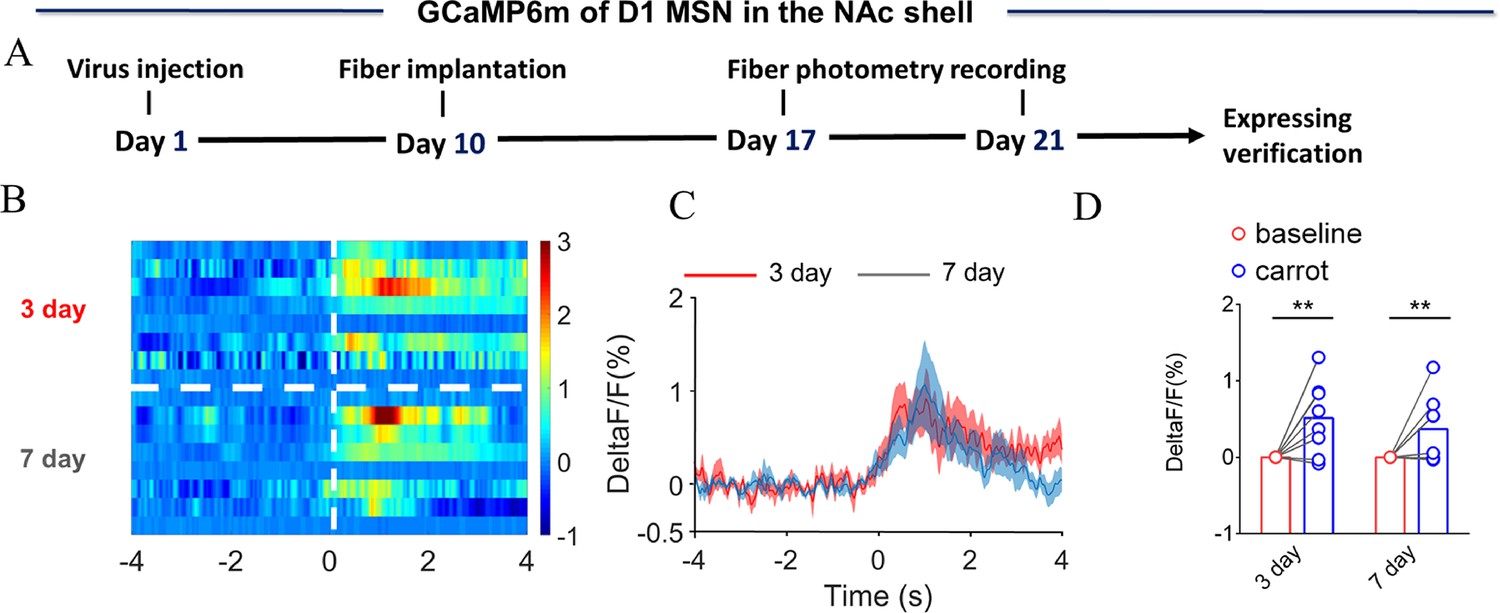
NAc shell Dynamics of D1 MSNs upon eating carrot.
(A) Timeline of experiments. (B) Heat map illustrating the extracellular D1 MSNs (ΔF/F, %) of NAc shell upon eating carrot after cohabitation for 3 and 7 days. (C) Mean fluorescence signal changes of D1 MSNs upon eating carrot after cohabitation for 3 (red line) and 7 days (blue line). The shaded area along the different colored lines represents error margins. (D) Quantification (Two-Way Repeated Measures ANOVA) of changes in D1 MSNs upon eating carrot after cohabitation for 3 and 7 days. All error bars = SEM. * represent p<0.05, ** represent p<0.01, *** represent p<0.001. See Figure 3—figure supplement 5—source data 1 for detailed statistics.
-
Figure 3—figure supplement 5—source data 1
Raw data and statistical results of changes in calcium signals upon eating carrot.
- https://cdn.elifesciences.org/articles/100292/elife-100292-fig3-figsupp5-data1-v1.xlsx
Figure 3—figure supplement 6
NAc shell Dynamics of D1 MSNs during side-by-side contact after cohabitation.
(A) Mean fluorescence signal changes (middle) and quantification (unpaired t test) (right) of D1 MSNs during side-by-side contact with partner (n=4 voles) or an unknown female (n=4 voles) after 3 days of cohabitation. Left: Heat map illustrating the fluorescence signals of NAc shell D1 MSNs during side-by-side contact after cohabitation for 3 days. (B) Mean fluorescence signal changes (middle) and quantification (unpaired t test) (right) of D1 MSNs during side-by-side contact with partner (n=6 voles) or an unknown female (n=3 voles) after 7 days of cohabitation. Left: Heat map illustrating the fluorescence signals of NAc shell D1 MSNs during side-by-side contact after cohabitation for 7 days. Not all animals engaged in side-by-side contact. The number of data points was different from the number of subjects because some animals did not show side-by-side contact, thus we could not detect the changes in fluorescence signals upon the occurrence of this behavior. All error bars = SEM. * represent p<0.05. See Figure 3—figure supplement 6—source data 1 for detailed statistics.
-
Figure 3—figure supplement 6—source data 1
Raw data and statistical results of changes in calcium signals during side-by-side contact after cohabitation.
- https://cdn.elifesciences.org/articles/100292/elife-100292-fig3-figsupp6-data1-v1.xlsx
Figure 3—figure supplement 7
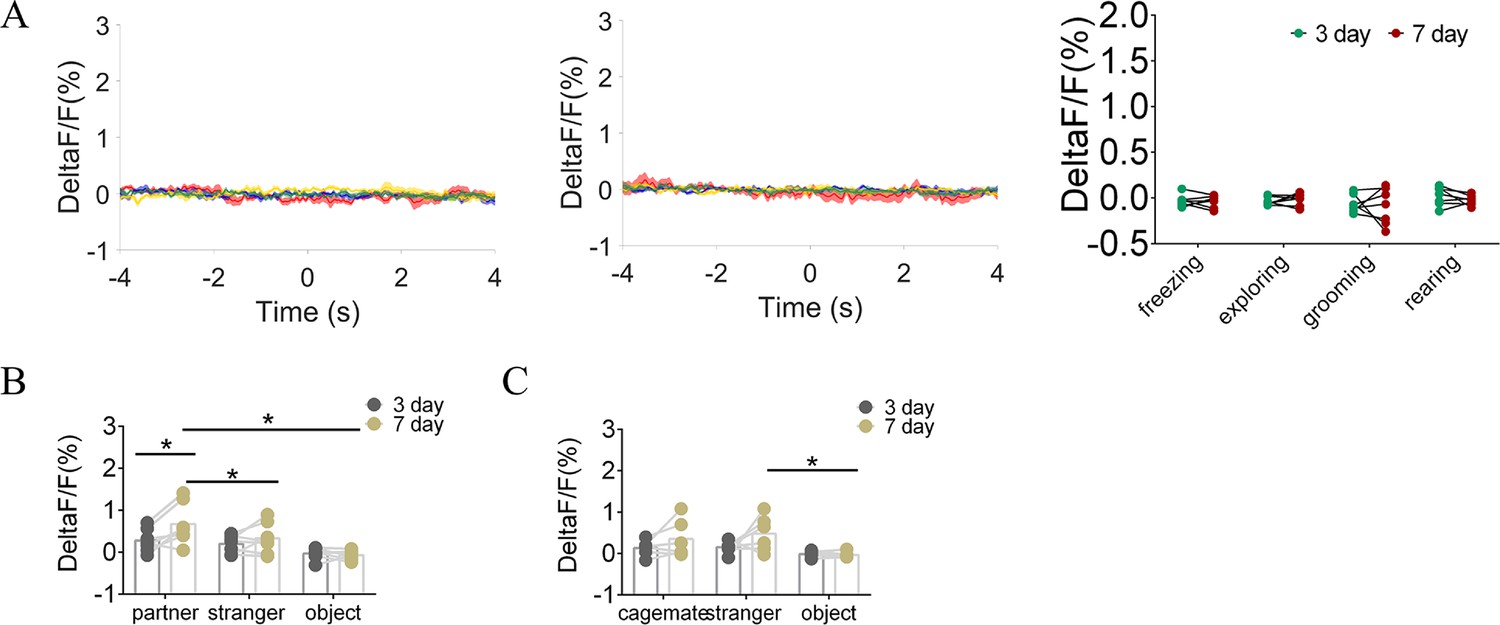
Quantification of fluorescence change during non-social behavioral bout and sniffing voles after cohabitation.
(A) Mean fluorescence signal changes of D1-MSNs during freezing (red line), exploring (blue line), grooming (yellow line), and rearing (green line) after 3 days (left) and 7 days (middle) of cohabitation. Right: Quantification (Two-Way Repeated Measures ANOVA) of changes during non-social behavioral bout after cohabitation with a partner for 3 and 7 days (n=7 voles). (B) Quantification (Two-Way Repeated Measures ANOVA) of changes during sniffing partner, an unknown female, or an object after cohabitation for 3 and 7 days (n=7 voles). (C) Quantification (Two-Way Repeated Measures ANOVA) of changes during sniffing a cagemate, a male stranger, or an object after cohabitation for 3 and 7 days (n=6 voles). Error bars = SEM. * represent p<0.05, ** represent p<0.01. See Figure 3—figure supplement 7—source data 1 for detailed statistics.
-
Figure 3—figure supplement 7—source data 1
Raw data and statistical results of changes in calcium signals during non-social behavioral bouts and sniffing voles after cohabitation.
- https://cdn.elifesciences.org/articles/100292/elife-100292-fig3-figsupp7-data1-v1.xlsx
Figure 3—figure supplement 8
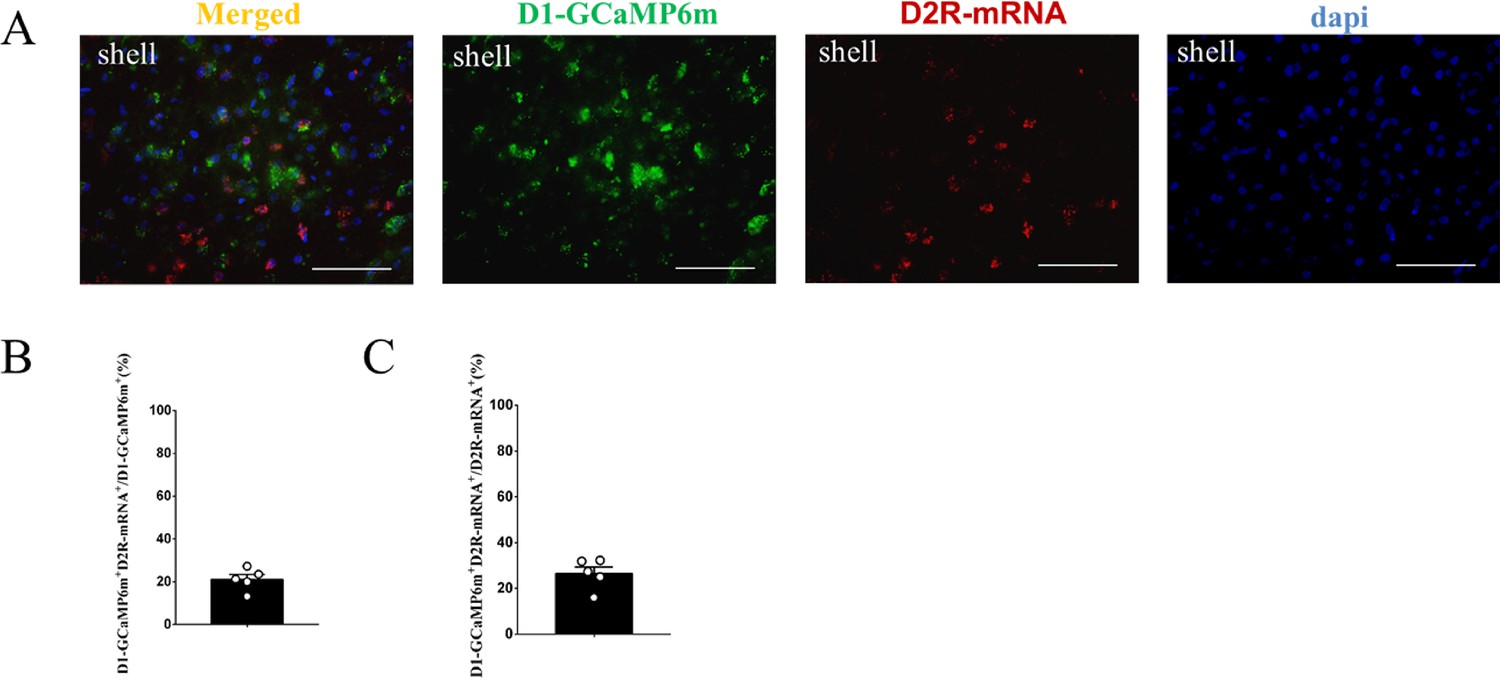
The supplement FISH image of the D1-GCaMP6m MSNs in the NAc shell.
(A) Overlap of D1-GCaMP6m (green), D2R-mRNA (red), and DAPI (blue) in the NAc shell. Scale bar: 100 μm. (B–C) Statistical chart showed that D1-GCaMP6m was relatively restricted to D2R-mRNA-positive neurons (n=5 voles).
-
Figure 3—figure supplement 8—source data 1
Counts of D1-GCaMP6m (green) positive neurons, D2R-mRNA (red) positive neurons, and co-expressed cells.
- https://cdn.elifesciences.org/articles/100292/elife-100292-fig3-figsupp8-data1-v1.xlsx
Figure 4
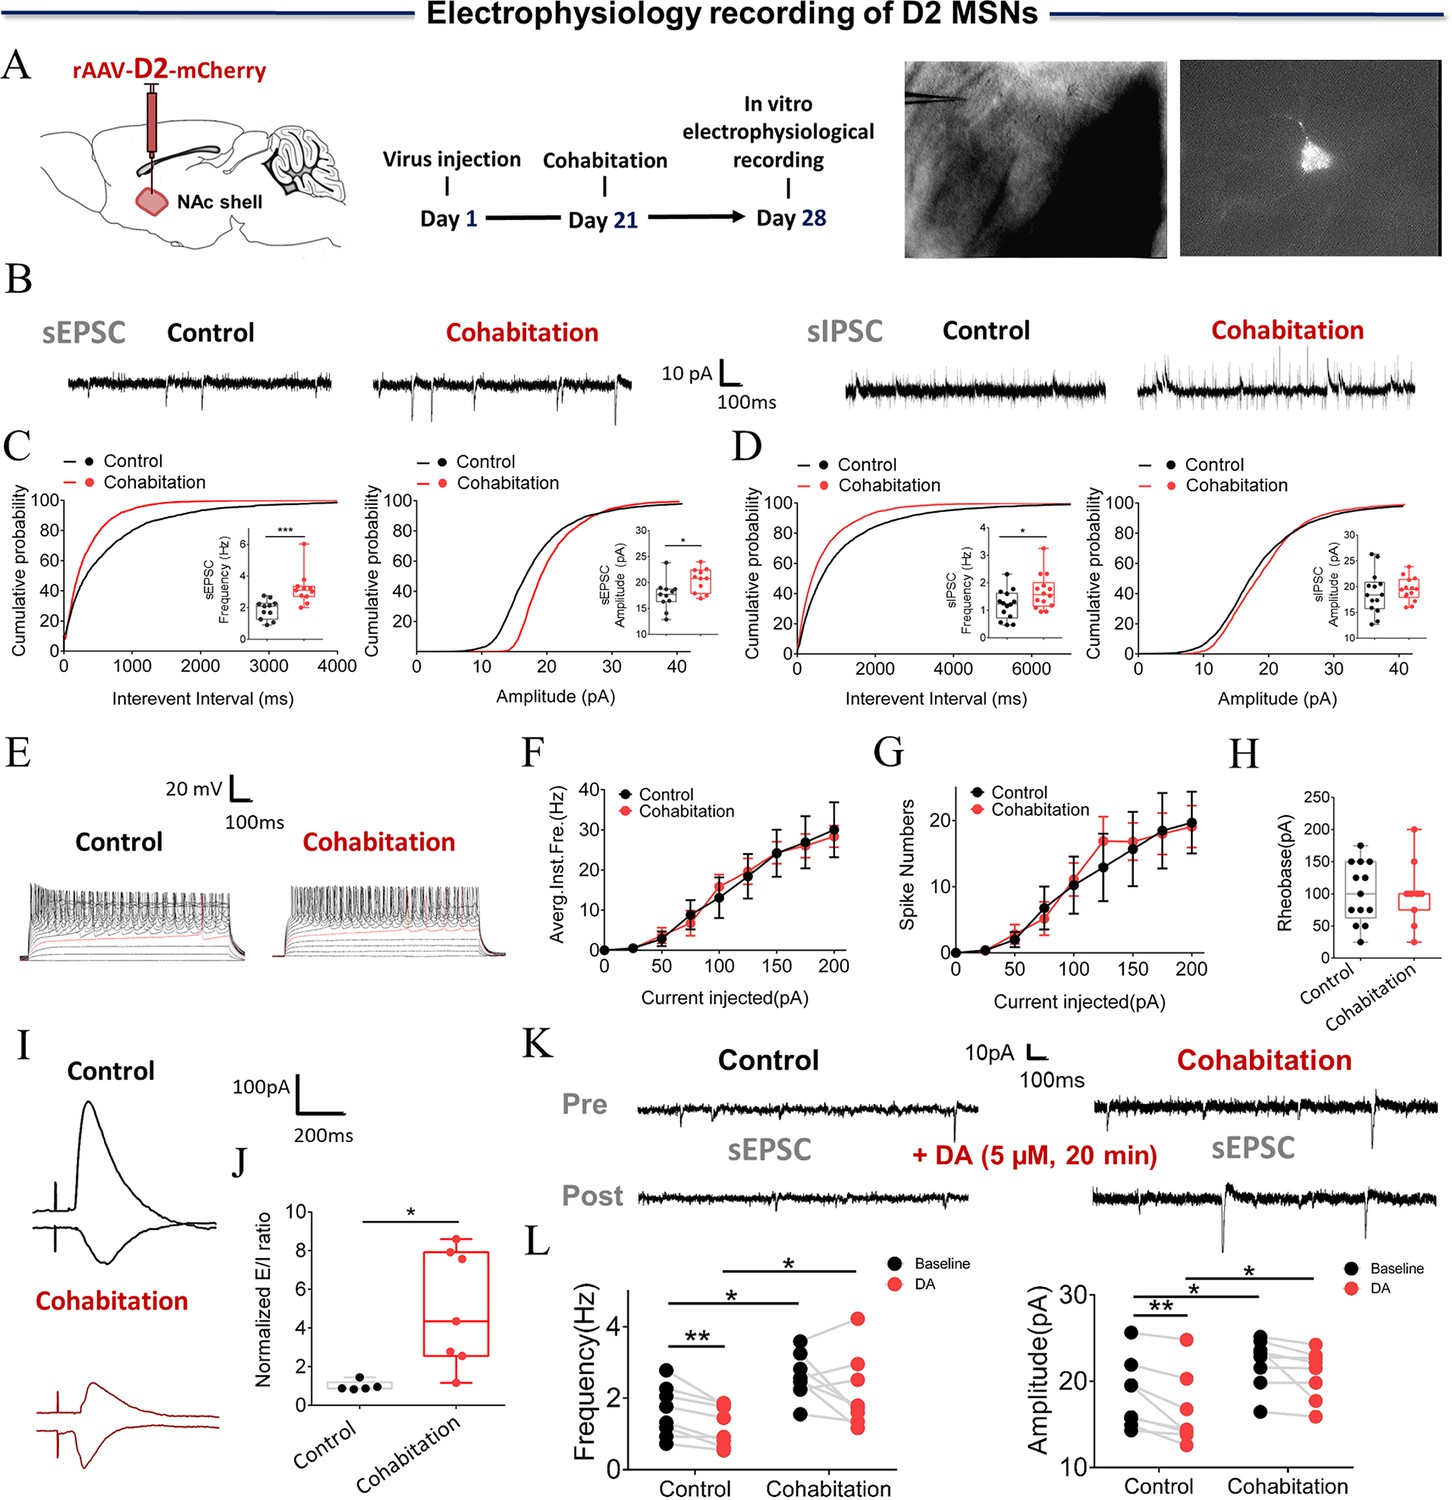
Synaptic transmission and neuronal excitability of D2 MSNs in the NAc shell change after cohabitation.
(A) Timeline of experiments (left), schematic diagrams depicting virus injection and recording sites (middle), and a D2-positive neuron with a micropipette (right). (B) Representative spontaneous excitatory postsynaptic current (sEPSC) and spontaneous inhibitory postsynaptic currents (sIPSC) traces from paired and naive voles. (C) NAc shell D2 MSNs in paired voles exhibited sEPSCs with higher frequencies (Cohabitation: n=11 cells from four voles; Control: n=11 cells from four voles) and peak amplitudes (Cohabitation: n=11 cells from four voles; Control: n=11 cells from four voles) than those observed in naive voles. (D) NAc shell D2 MSNs in paired voles exhibited sIPSCs with higher frequencies (Cohabitation: n=14 cells from four voles; Control: n=14 cells from four voles) than those observed in naive voles. (Amplitude: Cohabitation: n=14 cells from four voles; Control: n=14 cells from four voles) (E–H) The neuronal excitability of D2 MSNs in the NAc shell of paired voles was similar to that of naive voles. (Cohabitation: n=11 cells from four voles; Control: n=13 cells from six voles). (I and J) The excitation-inhibition ratio was higher in paired voles than in naive voles. (Cohabitation: n=7 cells from four voles; Control: n=5 cells from four voles). (K and L) D2-sEPSCs are evoked over a background of bath-applied DA in naive voles and cohabitated (7 days) voles. (Cohabitation: n=8 cells from four voles; Control: n=8 cells from three voles). Error bars = SEM. * represents p<0.05, ** represents p<0.01, and *** represents p<0.001. See Figure 4—source data 1 for detailed statistics.
-
Figure 4—source data 1
Raw data and statistical results of sEPSC, sIPSC, neuronal excitability, and excitation-inhibition ratio in the NAc shell D2 MSNs in naive voles and cohabitated (7 days) voles.
- https://cdn.elifesciences.org/articles/100292/elife-100292-fig4-data1-v1.xlsx
Figure 5
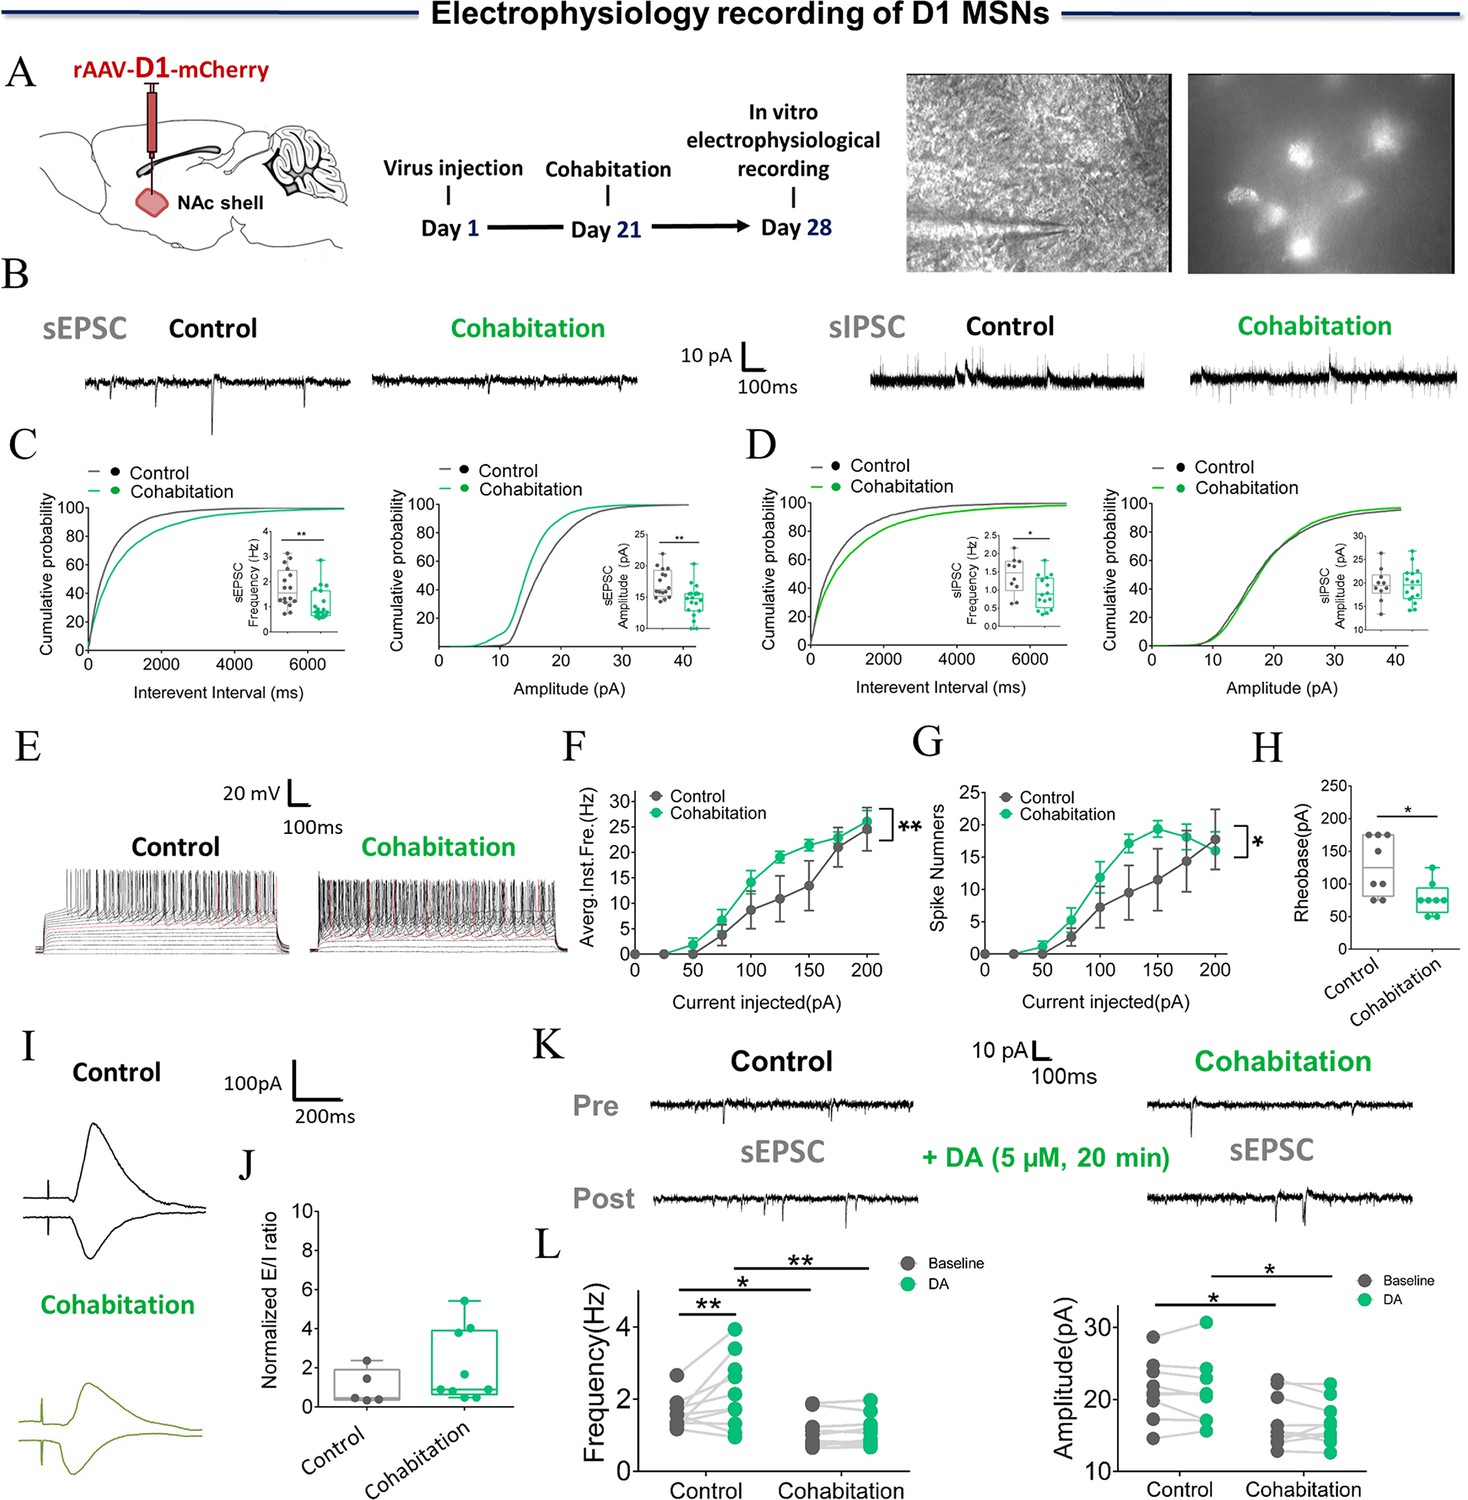
Synaptic transmission and neuronal excitability of D1 MSNs in NAc shell change after cohabitation.
(A) Timeline of experiments (left), schematic diagrams depicting virus injection and recording sites (middle), and a D1-positive neuron with a micropipette (right). (B) Representative sEPSC and sIPSC traces from paired and naive voles. (C) NAc shell D1 MSNs in paired voles exhibited sEPSCs with lower frequencies (Cohabitation: n=19 cells from five voles; Control: n=16 cells from four voles) and peak amplitudes (Cohabitation: n=19 cells from five voles; Control: n=16 cells from four voles) than those observed in naive voles. (D) NAc shell D1 MSNs in paired voles exhibited sIPSCs with lower frequencies (Cohabitation: n=16 cells from four voles; Control: n=10 cells from three voles) than those observed in naive voles (amplitude: Cohabitation: n=16 cells from four voles; Control: n=10 cells from three voles). (E–H) Neuronal excitability of D1 MSNs in the NAc shell of paired voles was higher than those observed in naive voles (Cohabitation: n=8 cells from three voles; Control: n=8 cells from four voles). (I, J) Excitation-inhibition ratio of paired voles was similar to naive voles. (Cohabitation: n=9 cells from four voles; Control: n=5 cells from three voles). (K, L) D1-sEPSCs are evoked over a background of bath-applied DA in naive voles and cohabitated (7 days) voles. (Cohabitation: n=10 cells from five voles; Control: n=10 cells from four voles). Error bars = SEM. * represents p<0.05, and ** represents p<0.01. See Figure 5—source data 1 for detailed statistics.
-
Figure 5—source data 1
Raw data and statistical results of sEPSC, sIPSC, neuronal excitability, and excitation-inhibition ratio in the NAc shell D1 MSNs in naive voles and cohabitated (7 days) voles.
- https://cdn.elifesciences.org/articles/100292/elife-100292-fig5-data1-v1.xlsx
Figure 6 with 2 supplements
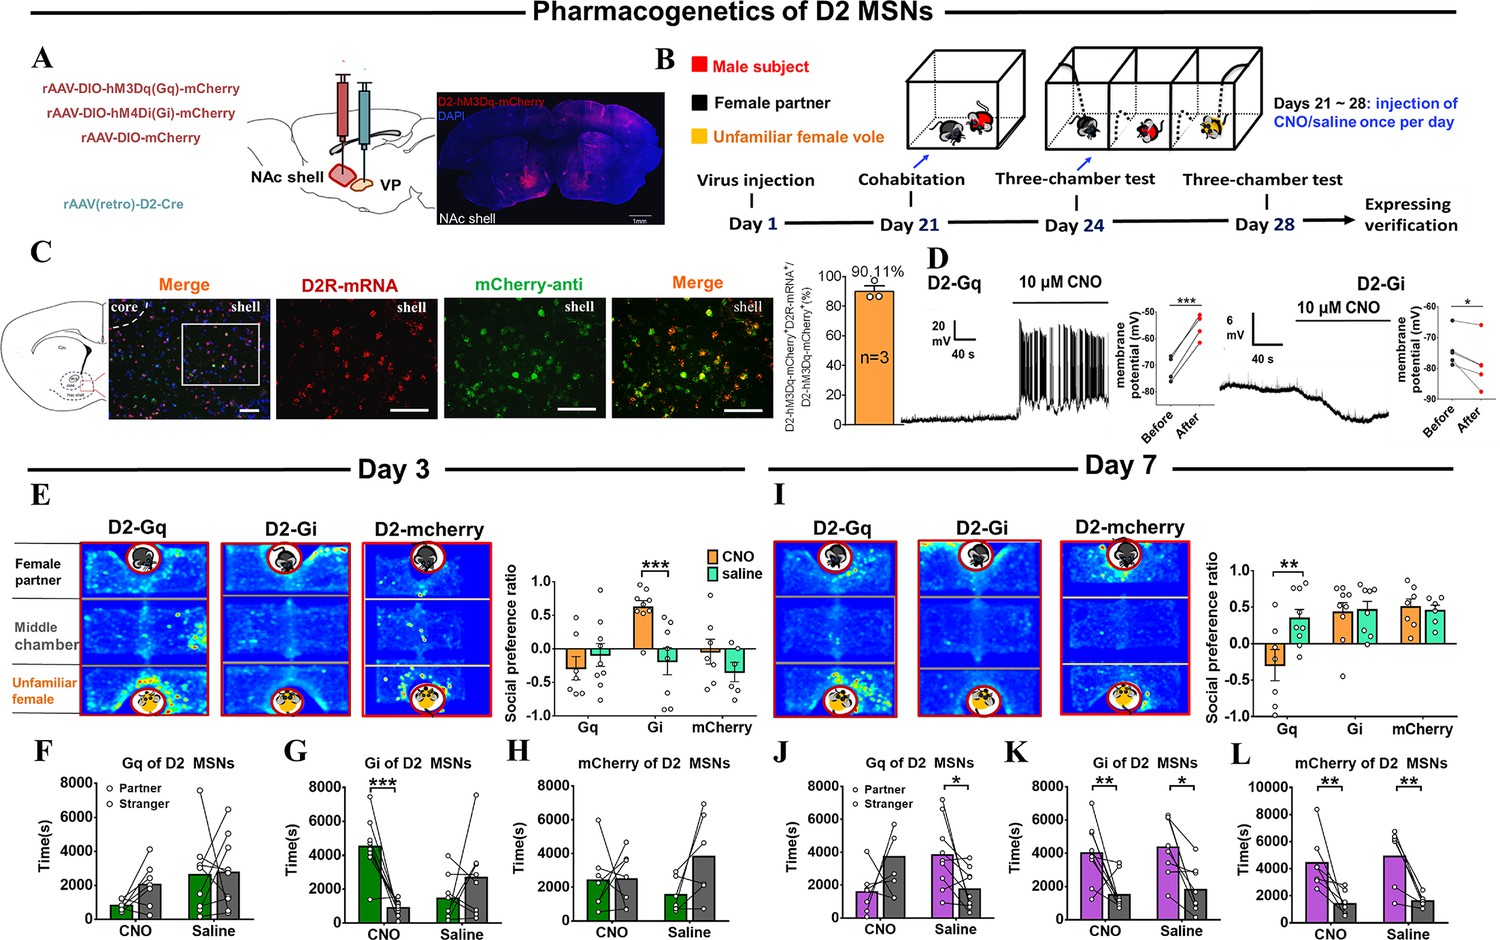
Effects of chemogenetic manipulation of NAc shell VP-projecting D2 MSNs on the formation of a partner preference.
(A) Schematic of the chemogenetic viral strategy and injection sites as well as histology showing the expression of D2-hM3Dq-mcherry within the NAc shell. Scale bar: 1 mm. (B) Timeline of experiments. (C) Immunohistology image showing co-localization of hM3Dq-mCherry-anti expression (green), D2R-mRNA (red), and DAPI (blue) in the NAc shell. Scale bar: 100 μm. Statistical chart showing that D2-mRNA cells were relatively restricted to D2-hM3Dq-mCherry cells (n=3 voles). (D) Representative traces from a Gq-DREADD (left) neuron and Gi-DREADD (right) neuron after CNO bath. (E) Representative heatmaps of the partner preference test after 3 days of cohabitation. Left: Gq group. Middle: Gi group. Right: mcherry group. (F–H) Quantification of side-by-side times in partner preference tests after cohabitation for 3 days. (I) Representative heatmaps of the partner preference test after cohabitation for 7 days. Left: Gq group. Middle: Gi group. Right: mcherry group. (J–L) Quantification of side-by-side times in the partner preference test after cohabitation for 7 days. (D2-hM3Dq: CNO: n=7, saline: n=9; D2-hM4Di: CNO: n=9, saline: n=8; D2-mCherry: CNO: n=7, saline: n=6). Error bars = SEM. * represents p<0.05, ** represents p<0.01, and *** represents p<0.001. See Figure 6—source data 1 for detailed statistics.
-
Figure 6—source data 1
Raw data and statistical results of social preference ratio and side-by-side times in partner preference test after cohabitation in Gq group, Gi group, and mcherry group.
- https://cdn.elifesciences.org/articles/100292/elife-100292-fig6-data1-v1.xlsx
Figure 6—figure supplement 1
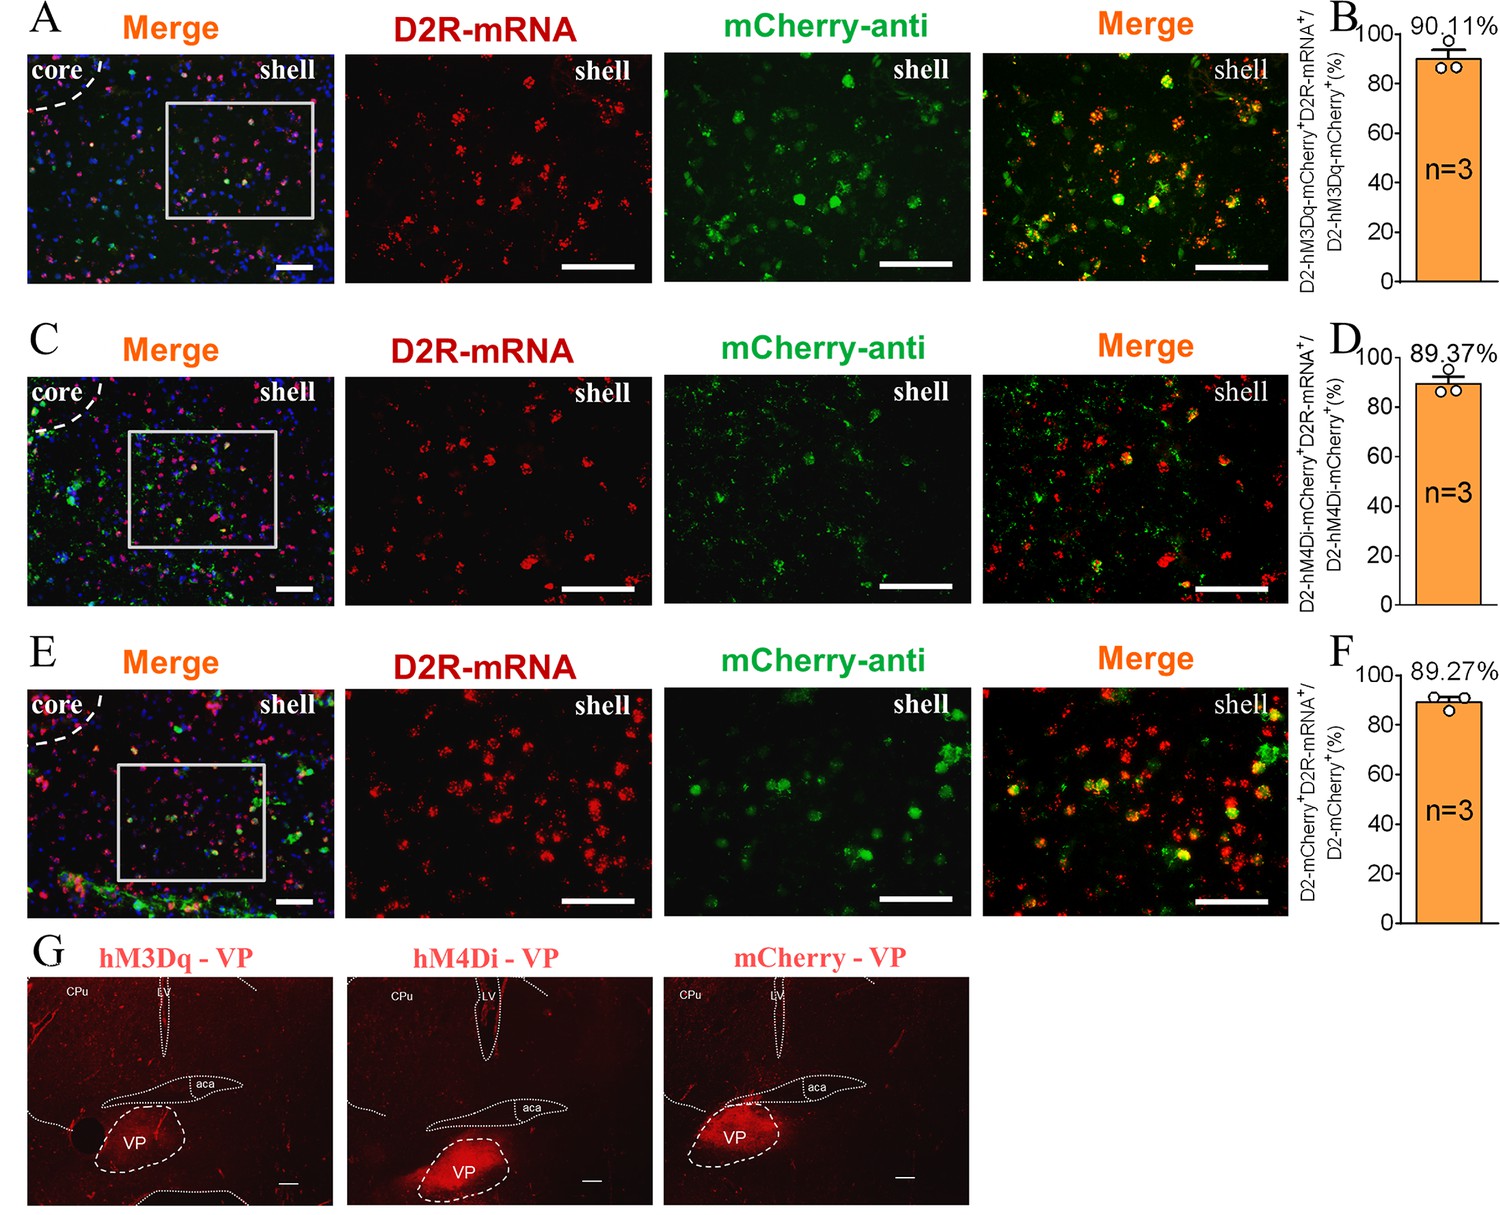
The supplement Immunohistochemistry image of the D2 MSNs chemogenetics test.
(A, C, E) Immunohistochemistry image showing co-localization of hM3Dq-mCherry-anti (A), hM4Di-mCherry-anti (C) and mCherry-anti (E) expression (green), D2R-mRNA (red), and DAPI (blue) in the NAc shell. Scale bar: 100 μm. (B, D, F) Statistical chart showed that hM3Dq (B), hM4Di (D) and mCherry (F) was relatively restricted to D2-positive cells (hM3Dq n=3 voles, hM4Di n=3 voles, and mCherry n=3 voles). (G) Immunohistochemistry image showing viral injection in the VP of hM3Dq (left), hM4Di (middle), and mCherry (right) group. Scale bar: 200 μm.
-
Figure 6—figure supplement 1—source data 1
Counts of mCherry-anti (green) positive neurons, D2R-mRNA (red) positive neurons, and co-expressed cells in hM3Dq, hM4Di, and mCherry group.
- https://cdn.elifesciences.org/articles/100292/elife-100292-fig6-figsupp1-data1-v1.xlsx
Figure 6—figure supplement 2
The supplement FISH image of the D2-mCherry MSNs in the NAc shell.
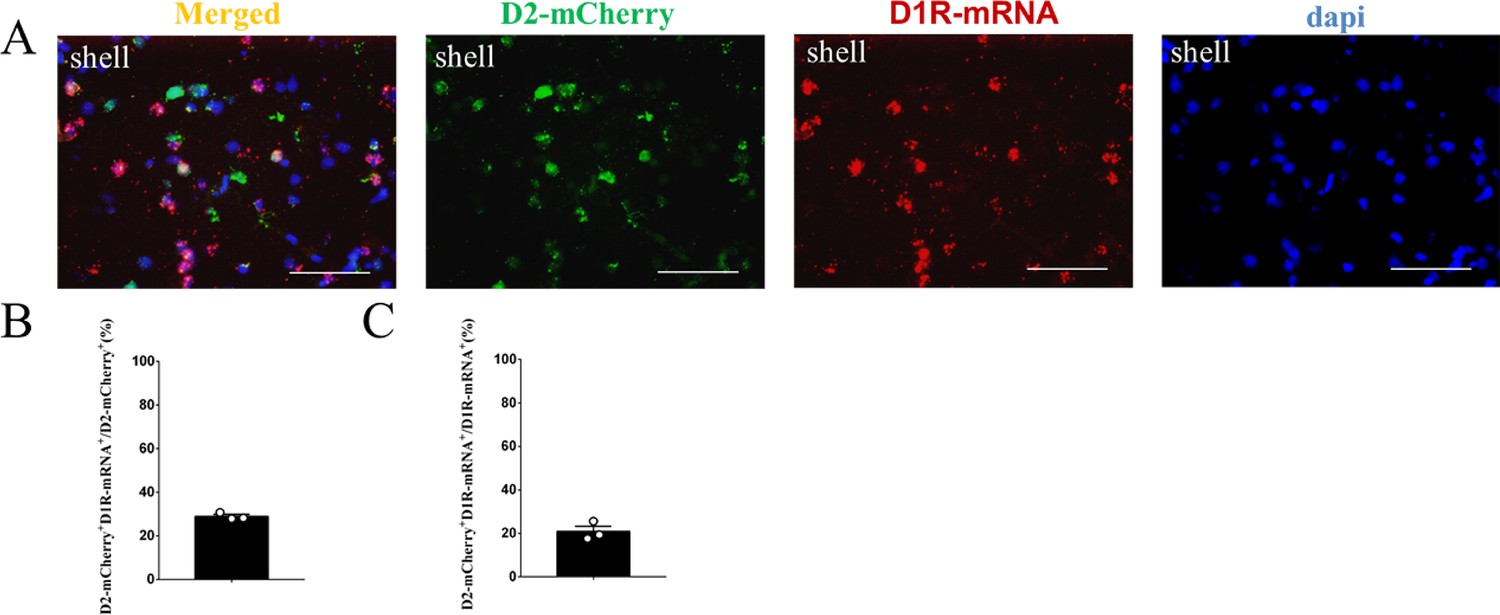
(A) Overlap of D2- mCherry (green), D1R-mRNA (red), and DAPI (blue) in the NAc shell. Scale bar: 100 μm. (B–C) Statistical chart showed that D2-mCherry was relatively restricted to D1R-mRNA-positive neurons (n=3 voles).
-
Figure 6—figure supplement 2—source data 1
Counts of D2-mCherry (green) positive neurons, D1R-mRNA (red) positive neurons, and co-expressed cells.
- https://cdn.elifesciences.org/articles/100292/elife-100292-fig6-figsupp2-data1-v1.xlsx
Figure 7 with 3 supplements
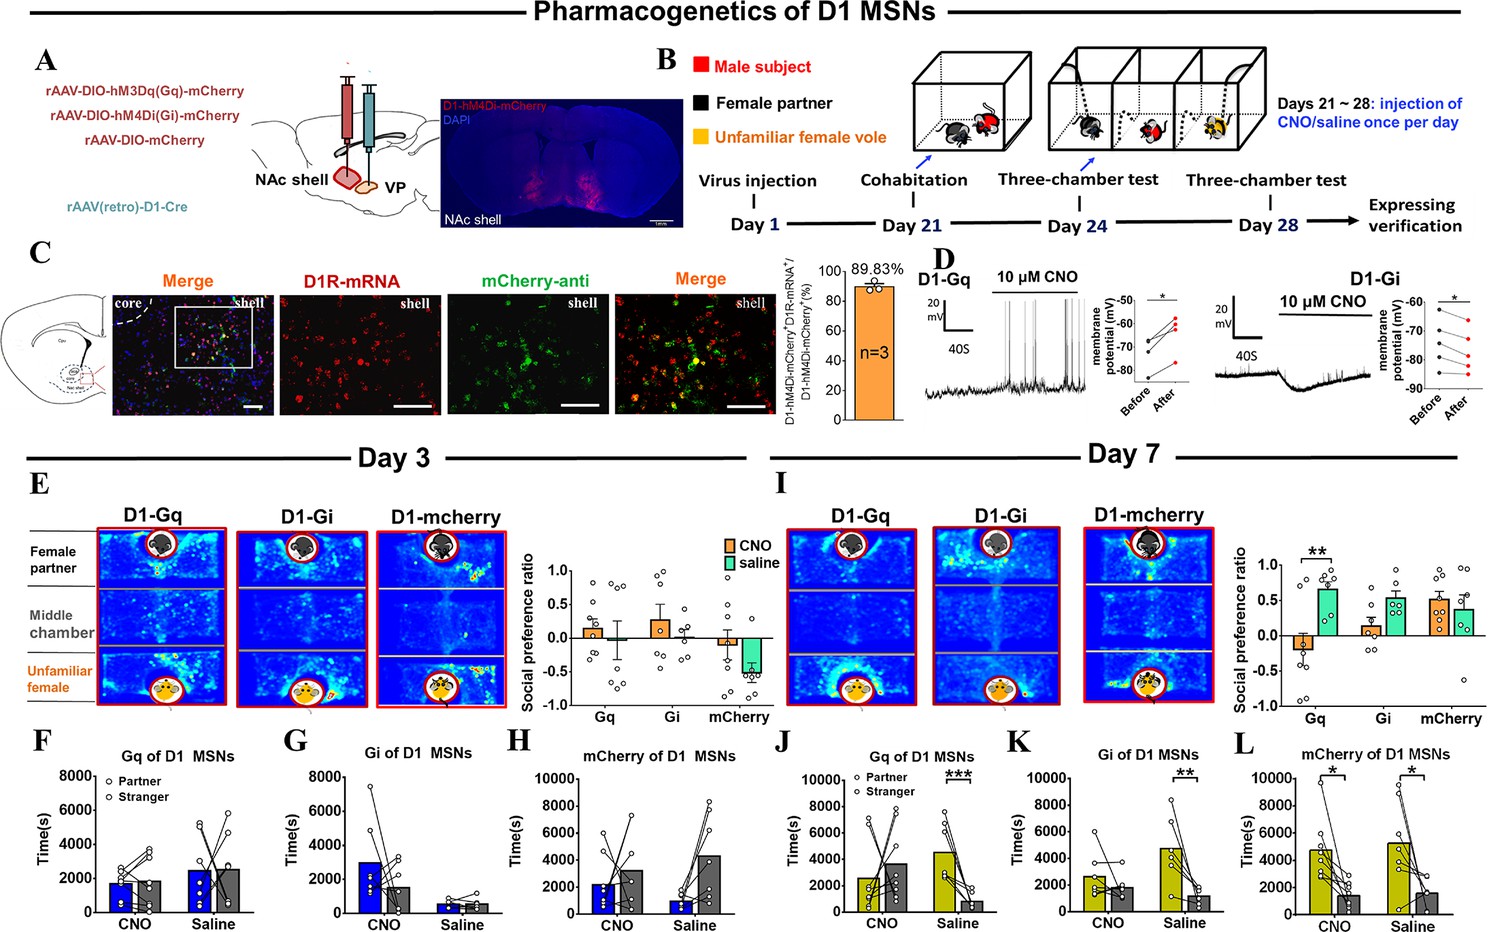
Effects of chemogenetic manipulation of NAc shell VP-projecting D1 MSNs on the formation of partner preference.
(A) Schematic of chemogenetic viral strategy and injection sites as well as histology showing the expression of D1-hM4Di-mcherry within the NAc shell. Scale bar: 1 mm. (B) Timeline of experiments. (C) Immunohistology image showing co-localization of hM4Di-mCherry-anti expression (green), D1R-mRNA (red), and DAPI (blue) in the NAc shell. Scale bar: 100 μm. Statistical chart showing that D1-mRNA cells were relatively restricted to D1-hM4Di-mCherry cells (n=3 voles). (D) Representative traces of a Gq-DREADD (left) neuron and Gi-DREADD (right) neuron after CNO bath. (E) Representative heatmaps of the partner preference test after 3 days of cohabitation. Left: Gq group. Middle: Gi group. Right: mcherry group. (F–H) Quantification of side-by-side times in the partner preference test after 3 days of cohabitation. (I) Representative heatmaps of the partner preference test after 7 days of cohabitation. Left: Gq group. Middle: Gi group. Right: mcherry group. (J–L) Quantification of side-by-side times in the partner preference test after 7 days of cohabitation. (D1-hM3Dq: CNO: n=8, saline: n=7; D1-hM4Di: CNO: n=7, saline: n=6; D1-mCherry: CNO: n=8, saline: n=7). Error bars = SEM. * represents p<0.05, ** represents p<0.01, and *** represents p<0.001. See Figure 7—source data 1 for detailed statistics.
-
Figure 7—source data 1
Raw data and statistical results of social preference ratio and side-by-side times in partner preference test after cohabitation in Gq group, Gi group, and mcherry group.
- https://cdn.elifesciences.org/articles/100292/elife-100292-fig7-data1-v1.xlsx
Figure 7—figure supplement 1
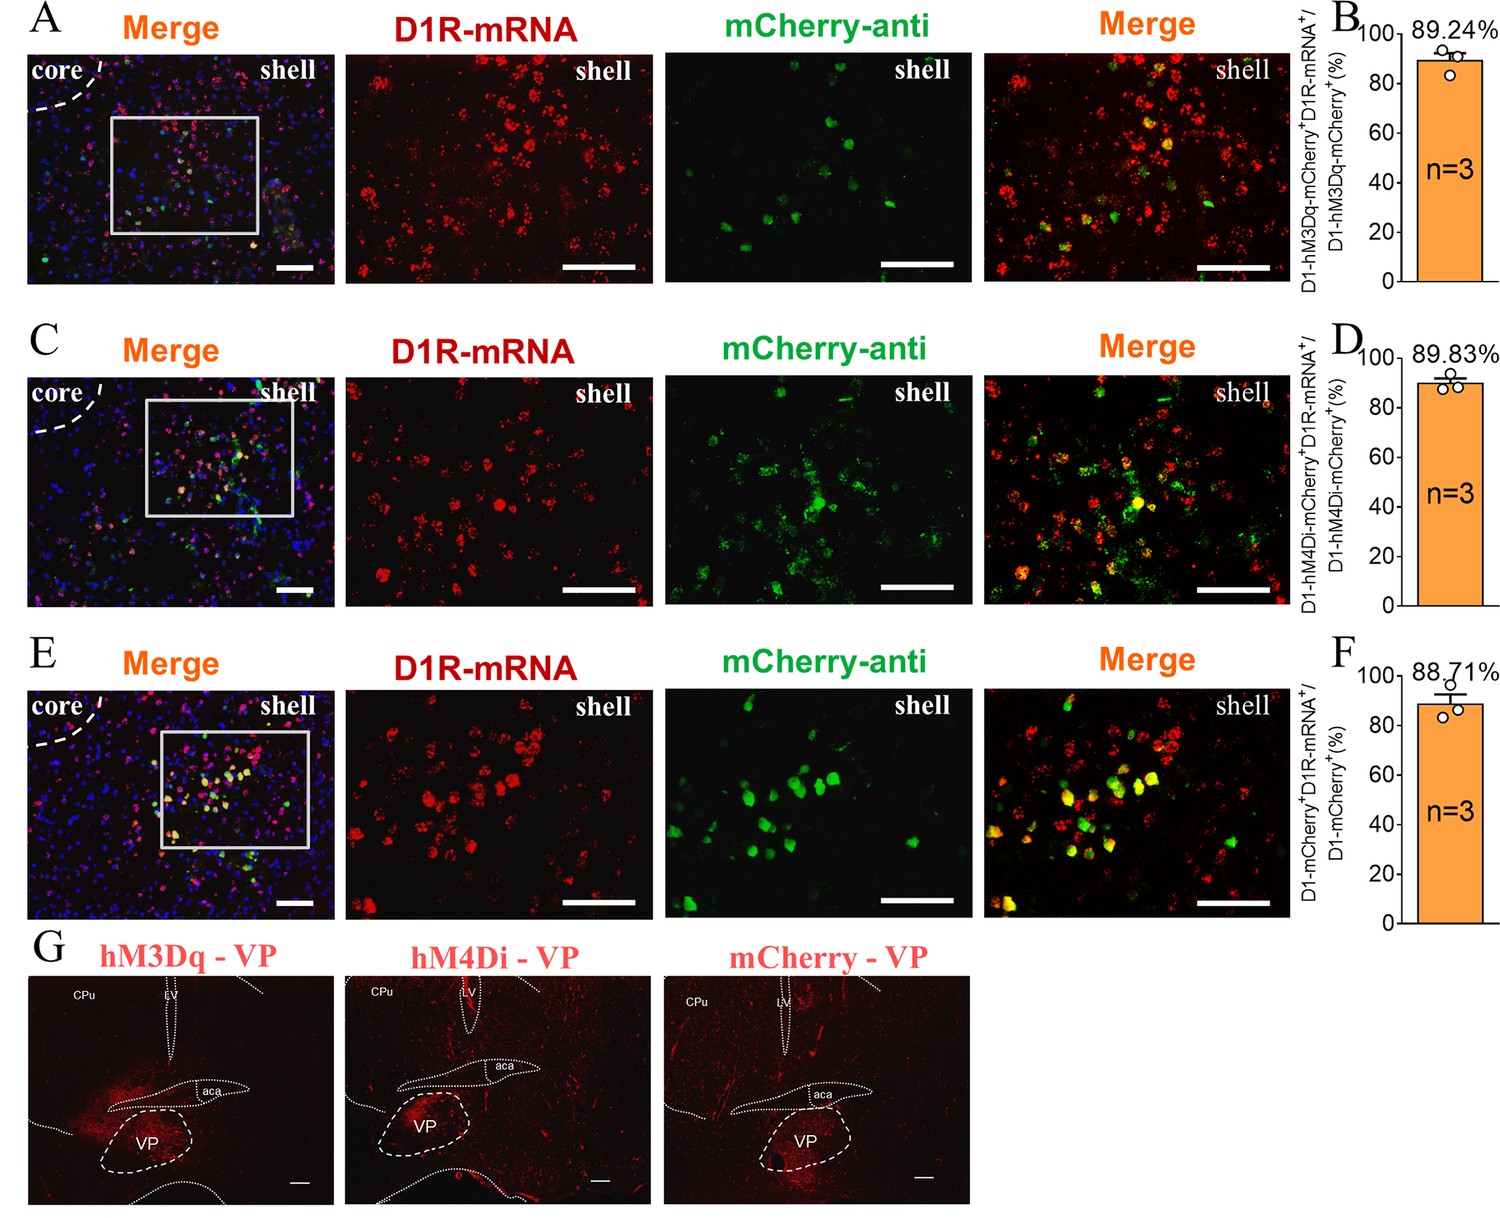
The supplement Immunohistochemistry image of the D1 MSNs chemogenetics test.
(A, C, E) Immunohistochemistry image showing co-localization of hM3Dq-mCherry-anti (A), hM4Di-mCherry-anti (C) and mCherry-anti (E) expression (green), D1R-mRNA (red), and DAPI (blue) in the NAc shell. Scale bar: 100 μm. (B, D, F) Statistical chart showed that hM3Dq (B), hM4Di (D) and mCherry (F) was relatively restricted to D1-positive cells (hM3Dq n=3 voles, hM4Di n=3 voles, and mCherry n=3 voles). (G) Immunohistochemistry image showing viral injections in the VP of hM3Dq (left), hM4Di (middle), and mCherry (right) group. Scale bar: 200 μm.
-
Figure 7—figure supplement 1—source data 1
Counts of mCherry-anti (green) positive neurons, D1R-mRNA (red) positive neurons, and co-expressed cells in hM3Dq, hM4Di, and mCherry group.
- https://cdn.elifesciences.org/articles/100292/elife-100292-fig7-figsupp1-data1-v1.xlsx
Figure 7—figure supplement 2
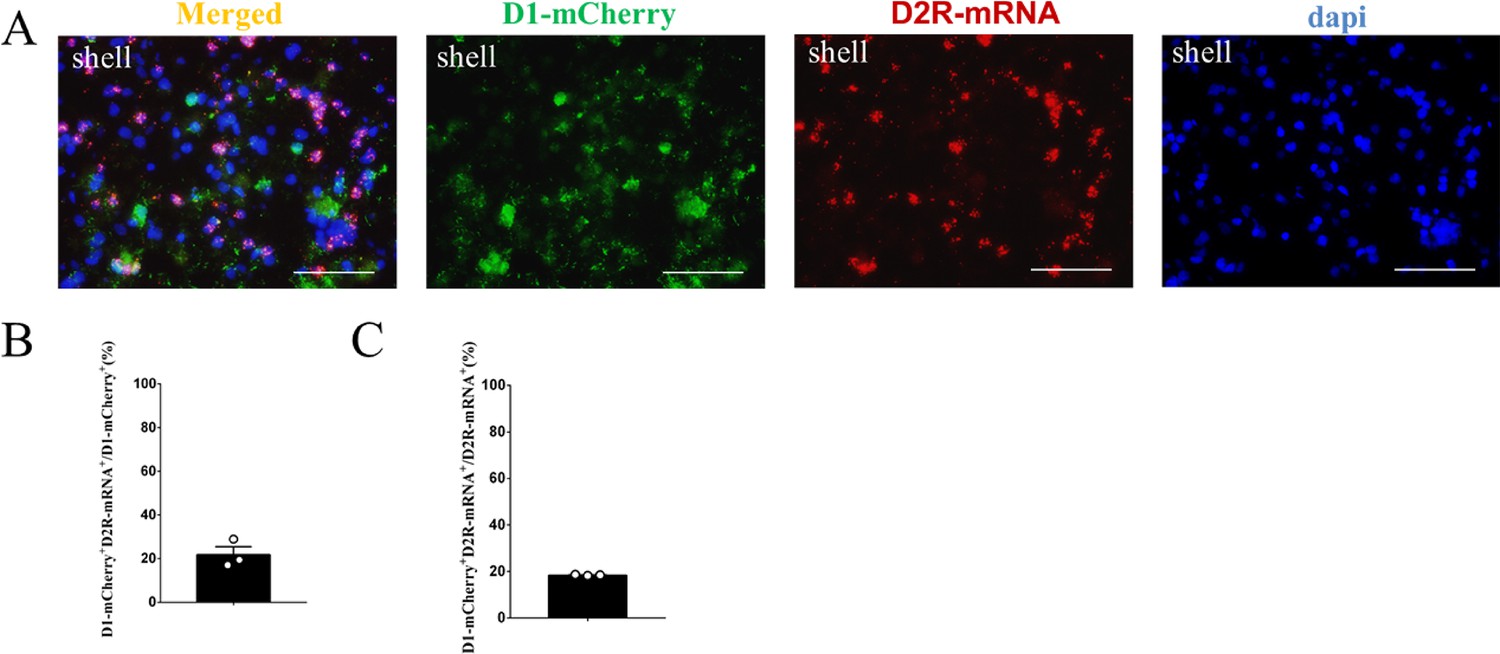
The supplement FISH image of the D1-mCherry MSNs in the NAc shell.
(A) Overlap of D1- mCherry (green), D2R-mRNA (red), and DAPI (blue) in the NAc shell. Scale bar: 100 μm. (B–C) Statistical chart showed that D1-mCherry was relatively restricted to D2R-mRNA positive neurons (n=3 voles).
-
Figure 7—figure supplement 2—source data 1
Counts of D1-mCherry (green) positive neurons, D2R-mRNA (red) positive neurons, and co-expressed cells.
- https://cdn.elifesciences.org/articles/100292/elife-100292-fig7-figsupp2-data1-v1.xlsx
Figure 7—figure supplement 3
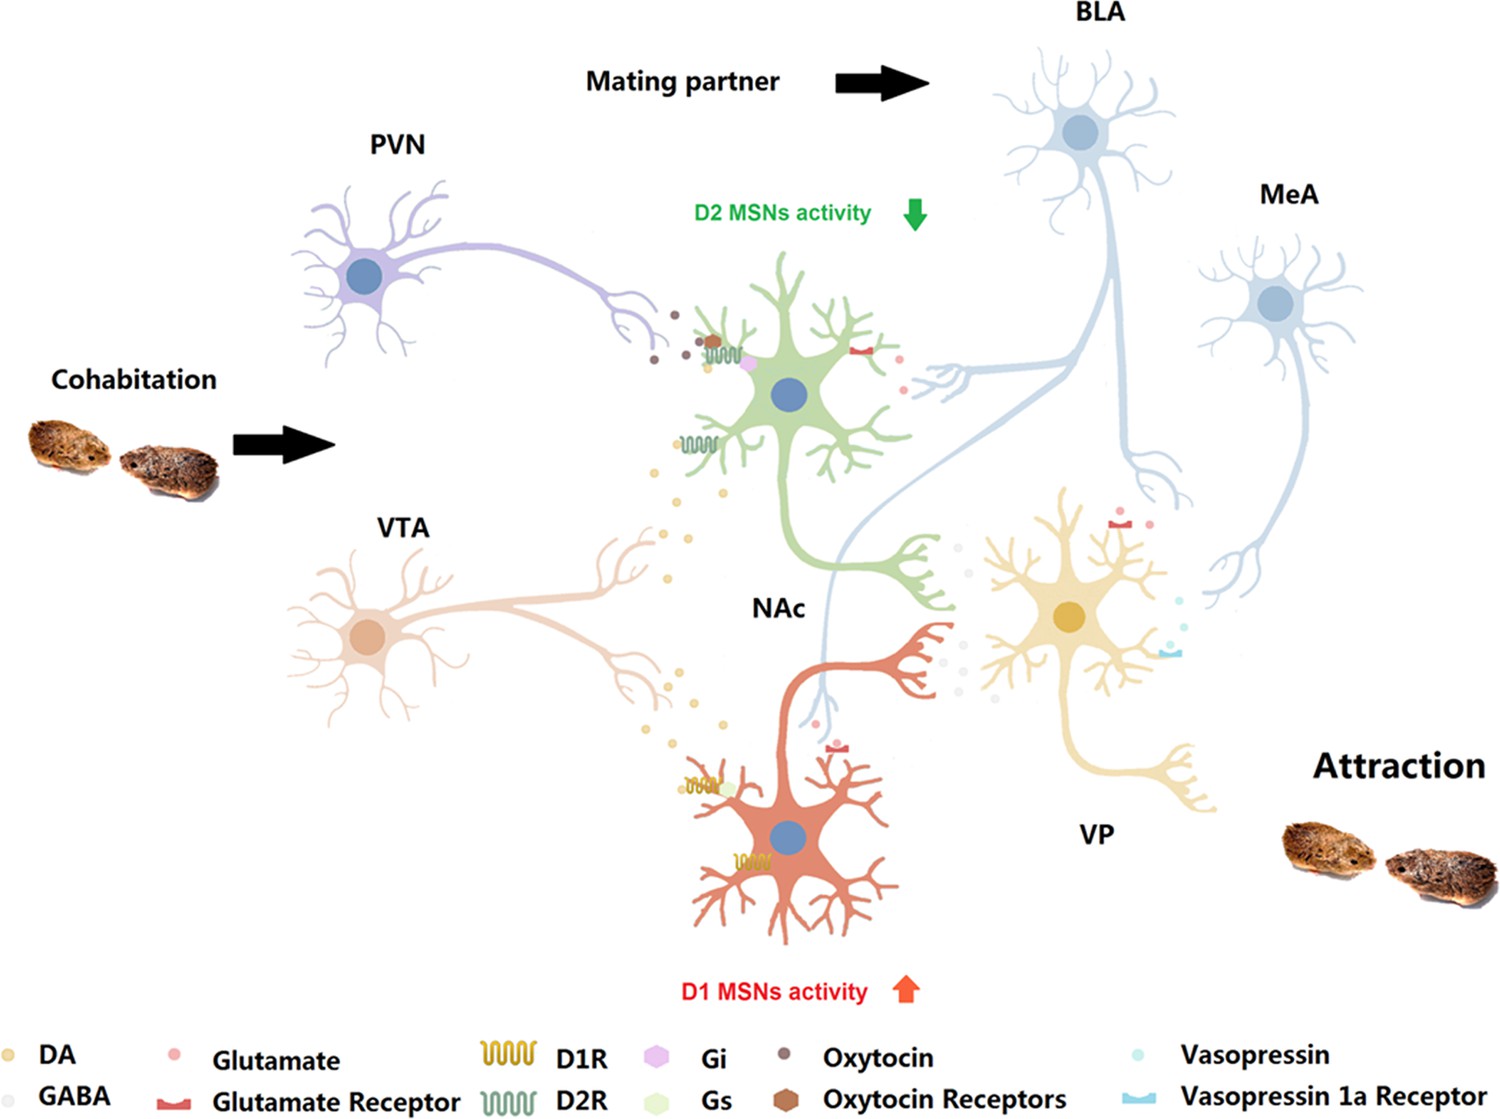
Neurobiological mechanism and circuit mechanism underlying the formation of a pair bond.
Possible neural model within NAc, where the co-action of DA on D2R and oxytocin on oxytocin receptors depresses the output of MSNs to VP; then, the VP mediates the attraction of partners during the formation of the pair bond. BLA: basolateral amygdala; MeA: medial amygdala; VTA: ventral tegmental area; PVN: paraventricular nucleus.
Author response image 1

(A) Gene carrier of rAAV-D2-mCherry-WPRE-bGH_polyA. (B-C) Gene sequence of D1 promoter and D2 promoter.
Author response image 2

(A) Immunohistological image showing co-localization of hM3Dq- mCherry-anti expression (green), D2R-mRNA (red), and DAPI (blue) in the NAc shell. Scale bar: 100 μm. (B) The cell counts and the determination of colocalization of the 20× immunohistochemistry images. The marked neurons were counted with white dots. (C) The cell counts and the determination of colocalization of the 40× immunohistochemistry images. The marked neurons were counted with white dots.
Tables
Key resources table
| Reagent type (species) or resource | Designation | Source or reference | Identifiers | Additional information |
|---|---|---|---|---|
| Recombinant DNA reagent | rAAV-CAG-dLight1.1-WPRE-hGH_polyA | BrainVTA | PT-1138 | Serotype titer 2/9, 5.00×10¹² vg/ml |
| Recombinant DNA reagent | rAAV-D1-GCaMp6m-WPRE-hGH_polyA | BrainVTA | PT-2749 | Serotype titer 2/9, 2.55×10¹² vg/ml |
| Recombinant DNA reagent | rAAV-D2-GCaMp6m-WPRE-hGH_polyA | BrainVTA | PT-2750 | Serotype titer 2/9, 2.69×10¹² vg/ml |
| Recombinant DNA reagent | rAAV-D1-EGFP-WPRE-bGH_polyA | BrainVTA | PT-0214 | Serotype titer 2/9, 2.78×10¹² vg/ml |
| Recombinant DNA reagent | rAAV-D2-EGFP-WPRE-hGH_polyA | BrainVTA | PT-3245 | Serotype titer 2/9, 2.26×10¹² vg/ml |
| Recombinant DNA reagent | rAAV-D1-mCherry-WPRE-bGH_polyA | BrainVTA | PT-0757 | Serotype titer 2/9, 3.66×10¹² vg/ml |
| Recombinant DNA reagent | rAAV-D2-mCherry-WPRE-bGH_polyA | BrainVTA | PT-0367 | Serotype titer 2/9, 2.44×10¹² vg/ml |
| Recombinant DNA reagent | rAAV-D1-CRE-WPRE-hGH_polyA | BrainVTA | PT-1217 | Serotype titer 2 /R, 4.72×10¹² vg/ml |
| Recombinant DNA reagent | rAAV-D2-CRE-WPRE-bGH_polyA | BrainVTA | PT-0571 | Serotype titer 2 /R, 5.00×10¹² vg/ml |
| Recombinant DNA reagent | rAAV-CAG-EGFP | BrainVTA | PT-0305 | Serotype titer 2/9, 5.28×10¹² vg/ml |
| Recombinant DNA reagent | rAAV-EF1α-DIO-hM3D(Gq)-mCherry | BrainVTA | PT-0042 | Serotype titer 2/9, 2.70×10¹² vg/ml |
| Recombinant DNA reagent | rAAV-EF1α-DIO-hM4D(Gi)-mCherry | BrainVTA | PT-0043 | Serotype titer 2/9, 5.53×10¹² vg/ml |
| Recombinant DNA reagent | rAAV- EF1α-DIO-mCherry | BrainVTA | PT-0013 | Serotype titer 2/9, 5.19×10¹² vg/ml |
| Antibody | Anti-mCherry | abcam | ab183628 | 1:300 |
| Antibody | anti-rabbit goat conjugated with Alexa Fluor 488 | JacksonImmuno | 111-545-003 | 1: 500 |
| Recombinant DNA reagent | RNAscope Probe-Mo-Drd1-C3 | Advanced Cell Diagnostics | #588161-C3 | |
| Recombinant DNA reagent | RNAscope Probe-Mo-Drd2-C2 | Advanced Cell Diagnostics | #534471-C2 | |
| Chemical compound, drug | RNAscope Multiplex Fluorescent Reagent Kit v2 | Advanced Cell Diagnostics | 323100 | |
| Chemical compound, drug | Clozapine N-oxide dihydrochloride | BrainVTA | CNO-02 | |
| Chemical compound, drug | 17-β-Estradiol-3-Benzoate | Sigma | E8875 | |
| Chemical compound, drug | Dopamine | Sigma | H8502 | |
| Chemical compound, drug | picrotoxinin | Sigma | P8390 | |
| Chemical compound, drug | CNQX | Sigma | 504914 | |
| Chemical compound, drug | D-AP5 | Sigma | 165304 | |
| Software, algorithm | MATLAB | MathWorks | RRID:SCR_001622 | |
| Software, algorithm | JWatcher | http://www.jwatcher.ucla.edu/ | RRID:SCR_017595 | |
| Software, algorithm | SPSS | IBM | RRID:SCR_002865 |
Additional files
Download links
A two-part list of links to download the article, or parts of the article, in various formats.
Downloads (link to download the article as PDF)
Open citations (links to open the citations from this article in various online reference manager services)
Cite this article (links to download the citations from this article in formats compatible with various reference manager tools)
Different roles of D1/D2 medium spiny neurons in the nucleus accumbens in pair bond formation of male mandarin voles
eLife 13:RP100292.
https://doi.org/10.7554/eLife.100292.3


