IDH1 regulates human erythropoiesis by eliciting chromatin state reprogramming
- State Key Laboratory of Metabolic Dysregulation and Prevention and Treatment of Esophageal Cancer; School of Life Sciences, Zhengzhou University, China
- Department of Hematology, First Affiliated Hospital of Zhengzhou University, China
- Department of Gastroenterology, Children's Hospital Affiliated to Zhengzhou University, China
- Laboratory of Membrane Biology, New York Blood Center, United States
Figures
Figure 1 with 7 supplements
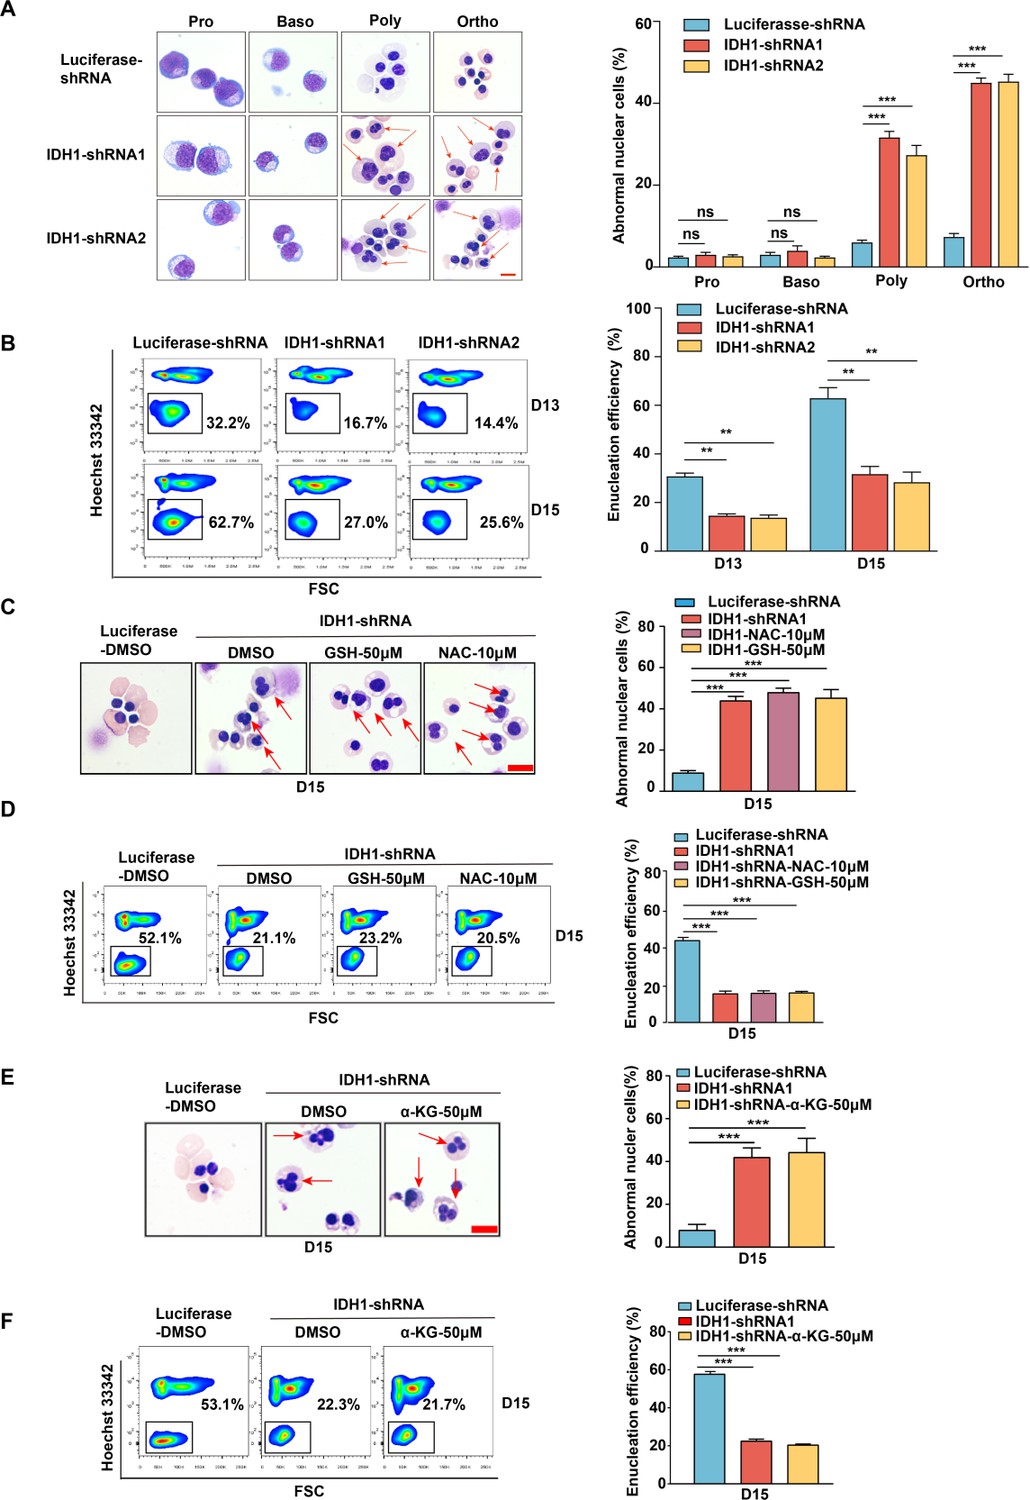
Isocitrate dehydrogenase 1 (IDH1) deficiency impaired terminal stage erythropoiesis.
(A) Representative cytospin images on proerythroblasts, basophilic erythroblasts, polychromatic erythroblasts, and orthochromatic erythroblasts differentiated from cord blood hematopoietic stem cells. The red arrows point to the cells that are abnormal nucleus. Scale bar, 10 μm. Quantitative analysis of the percentage of abnormal nuclear cells from three independent biological experiments. (B) Flow cytometry analysis showed the efficiency of enucleation on day 13 and day 15. Quantitative analysis of enucleation efficiency from three independent biological experiments. (C) Representative cytospin images of erythroblasts after adding glutathione (GSH) (50 μM) and N-acetyl-L-cysteine (NAC) (10 μM) on day 15. Scale bar, 10 μm. Quantitative analysis of the percentage of the cells with abnormal nucleus. (D) Flow cytometry analysis showed the enucleation efficiency after adding GSH (50 μM) and NAC (10 μM) on day 15. Quantitative analysis of the enucleation efficiency after adding GSH (50 μM) and NAC (10 μM) on day 15 from three independent biological experiments. (E) Representative cytospin images of erythroblasts after supplement α-ketoglutarate (α-KG) (50 μM) on day 15. Scale bar, 10 μm. Quantitative analysis of the percentage of the abnormal nucleus from three independent biological experiments. (F) Flow cytometry analysis showed the efficiency of enucleation after supplement α-KG (50 μM) on day 15. Quantitative analysis of the enucleation efficiency after supplement α-KG (50 μM) on day 15 from three independent experiments. Statistical analysis is from three independent biological experiments, and the bar plot represents mean ± SD of triplicate samples. Not significant (ns), *p<0.05, **p<0.01, ***p<0.001.
Figure 1—figure supplement 1
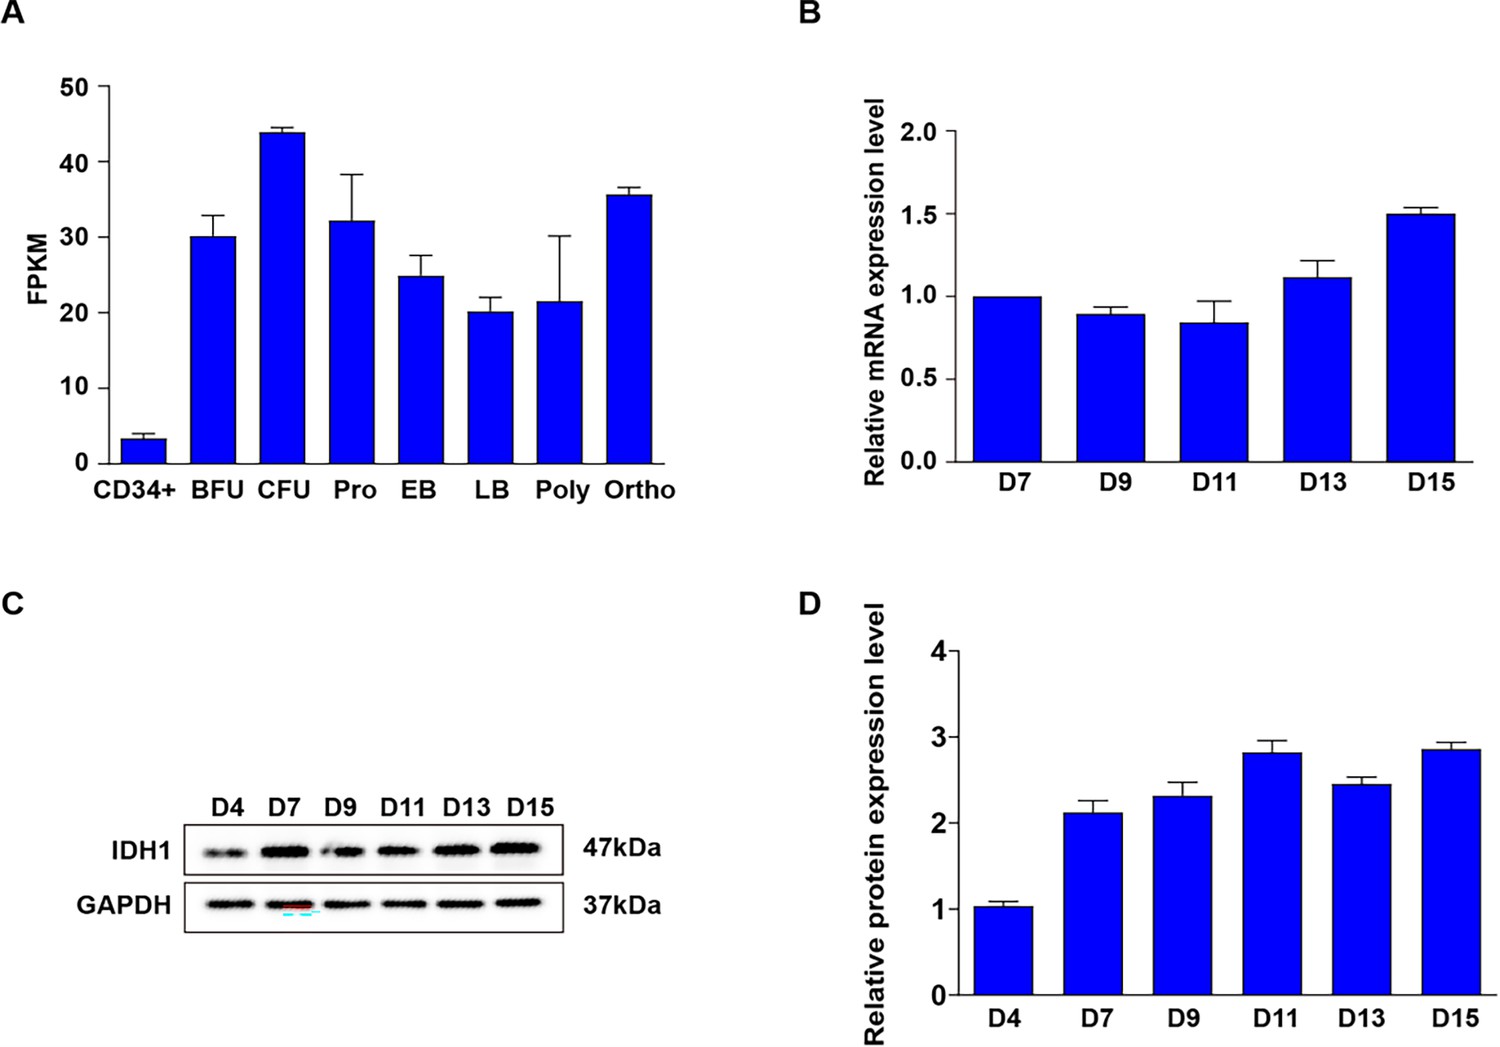
The expression level of Isocitrate dehydrogenase 1 (IDH1) during erythropoiesis.
(A) RNA-seq analysis of IDH1 on each erythroid cell. (B) qRT-PCR results showing IDH1 expression in erythroblasts infected with lentivirus containing Luciferase-shRNA, IDH1-shRNA1, and IDH1-shRNA2 on D7, D11, and D15 from three independent biological experiments. (C) Representative images of Western Blotting showing IDH1 expression level in erythroblasts infected with Luciferase-shRNA, IDH1-shRNA1, and IDH1-shRNA2 on D7, D11, and D15.The results were normalized to GAPDH protein expression level. (D) Quantitative analysis of the knockdown efficiency of IDH1 from three independent biological experiments.
-
Figure 1—figure supplement 1—source data 1
Original western blots for Figure 1—figure supplement 1C, indicating the relevant bands.
- https://cdn.elifesciences.org/articles/100406/elife-100406-fig1-figsupp1-data1-v2.pdf
-
Figure 1—figure supplement 1—source data 2
Original files for western blot analysis displayed in Figure 1—figure supplement 1C.
- https://cdn.elifesciences.org/articles/100406/elife-100406-fig1-figsupp1-data2-v2.zip
Figure 1—figure supplement 2
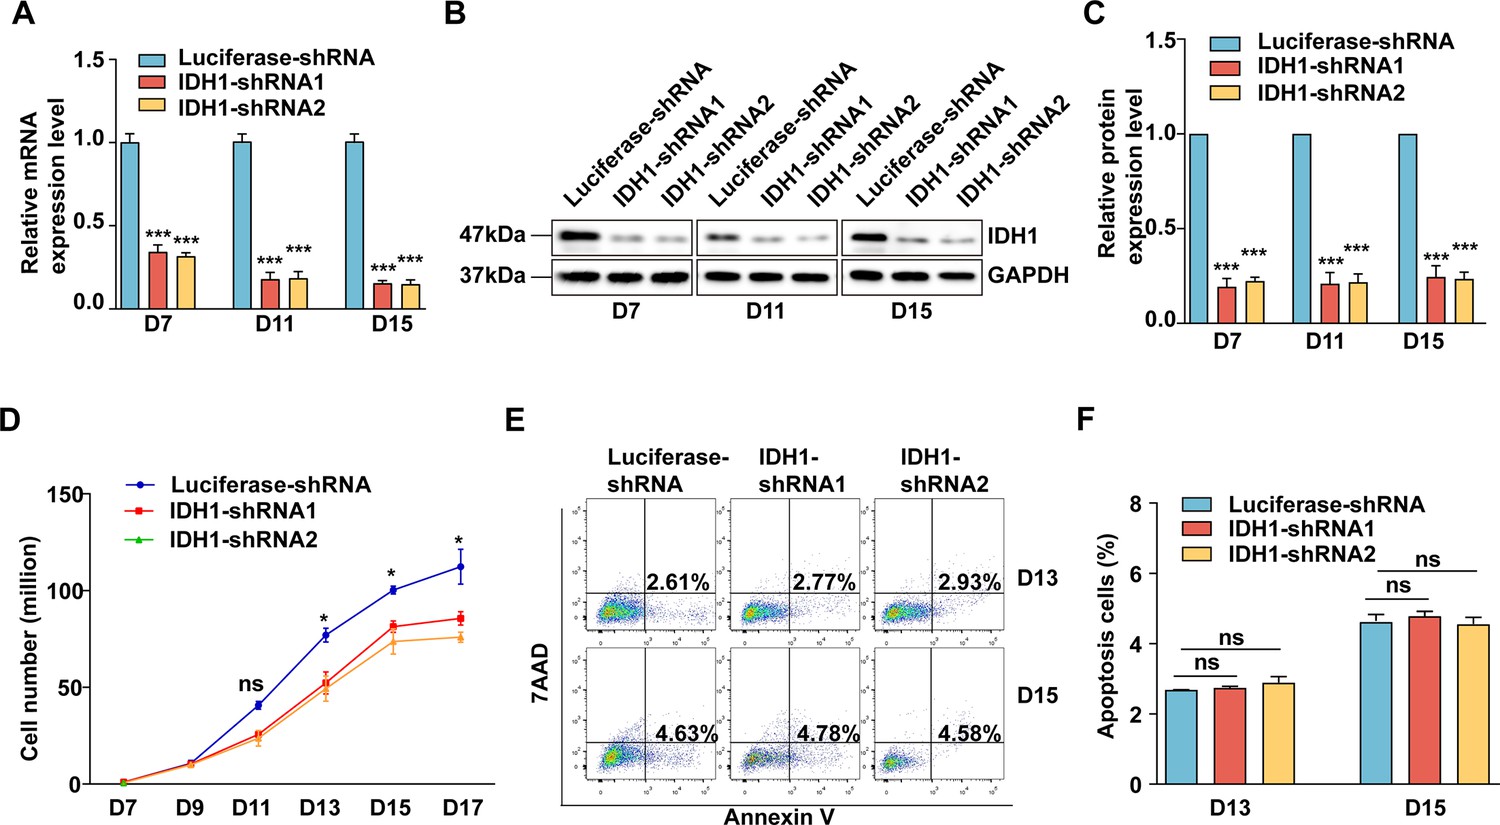
Deficiency of Isocitrate dehydrogenase 1 (IDH1) slightly affect the proliferation and have on effect on apoptosis on terminal erythroblast.
(A) qRT-PCR results showing IDH1 expression in erythroblasts infected with lentivirus containing Luciferase-shRNA, IDH1-shRNA1, and IDH1-shRNA2 on days 7, 11, and 15 from three independent biological experiments. (B) Representative images of western blotting showing IDH1 expression level in erythroblasts infected with Luciferase-shRNA, IDH1-shRNA1, and IDH1-shRNA2 on day 7, day 11, and day 15 from three independent biological experiments. Results were normalized to GAPDH protein expression level. (C) Quantitative analysis of the knockdown efficiency of IDH1 from three independent experiments from three independent biological experiments. (D) Growth curves of cells including Luciferase-shRNA, IDH1-shRNA1, and IDH1-shRNA2 at each day. (E) Representative flow cytometric profiles of apoptosis stained with 7AAD and Annexin V at day 13 and day 15 of culture cells transfected with Luciferase-shRNA, IDH1-shRNA1, and IDH1-shRNA2. (F) Quantitative analysis of apoptosis cells from three independent experiments. Statistical analysis is from three independent biological experiments, and the bar plot represents mean ± SD of triplicate samples. Not significant (ns), *p<0.05, **p<0.01, ***p<0.001.
-
Figure 1—figure supplement 2—source data 1
Original western blots for Figure 1—figure supplement 2B, indicating the relevant bands.
- https://cdn.elifesciences.org/articles/100406/elife-100406-fig1-figsupp2-data1-v2.pdf
-
Figure 1—figure supplement 2—source data 2
Original files for western blot analysis displayed in Figure 1—figure supplement 2B.
- https://cdn.elifesciences.org/articles/100406/elife-100406-fig1-figsupp2-data2-v2.zip
Figure 1—figure supplement 3
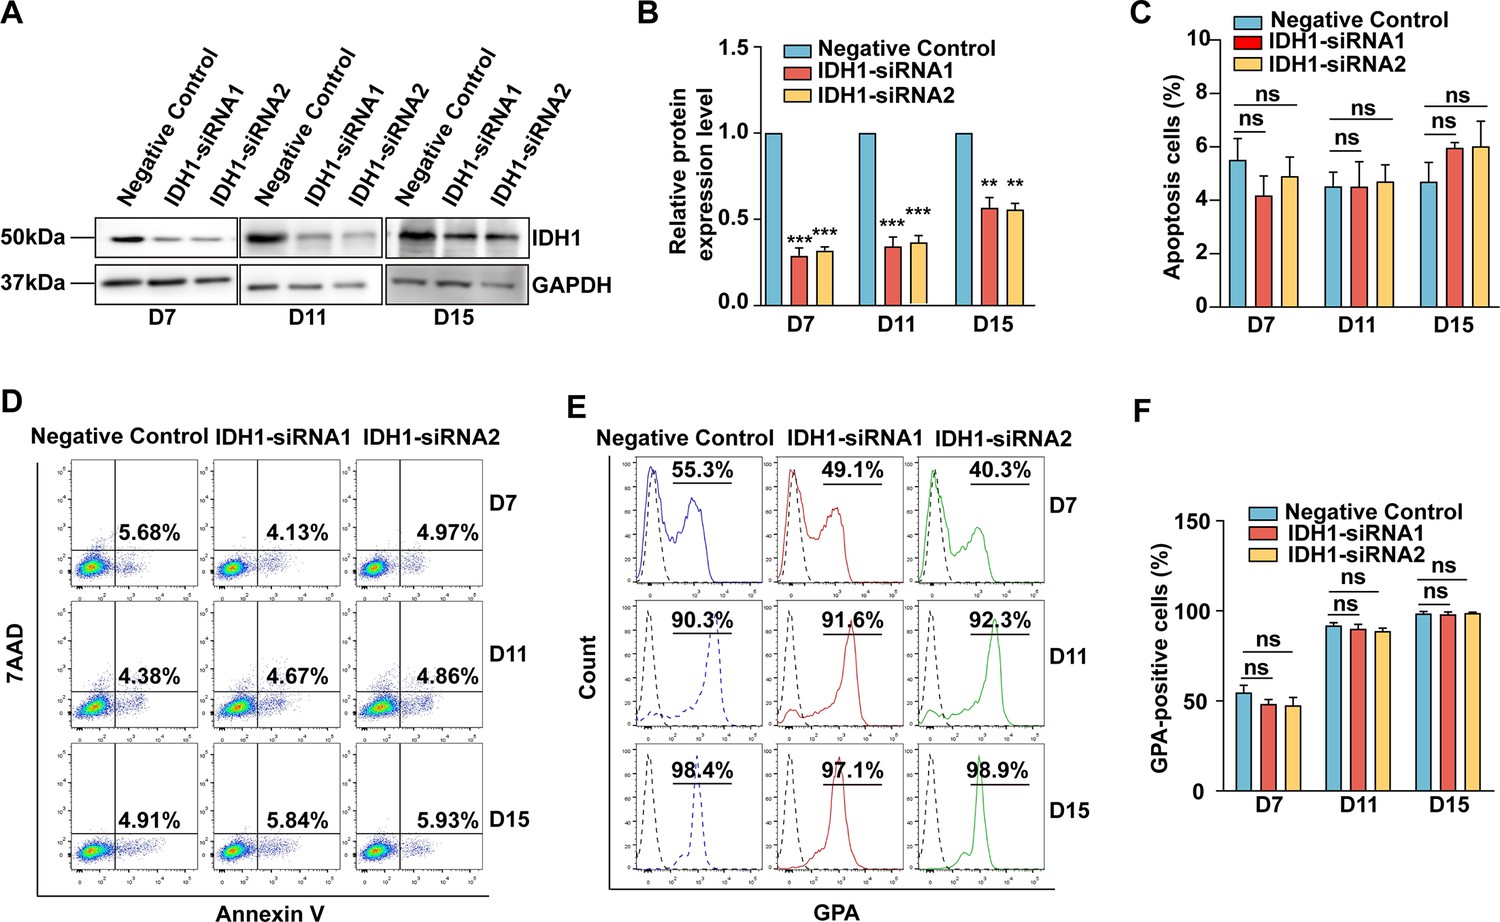
siRNA-mediated knockdown of isocitrate dehydrogenase 1 (IDH1) have no effect on apoptosis and GPA expression.
(A) Representative images of Western Blotting showing IDH1 expression level in erythroblasts with siRNA-NC, IDH1-siRNA1, and IDH1-siRNA2 on days 7,11, and 15. The results were normalized to GAPDH protein expression level. (B) Quantitative analysis of the knockdown efficiency of IDH1 from three independent biological experiments. (C) Quantitative analysis of apoptosis cells from three independent experiments. (D) Representative flow cytometry profiles of apoptosis stained with 7AAD and Annexin V on erythroid cells with siRNA-NC, IDH1-siRNA1, and IDH1-siRNA2 on day 7, day 11, and day 15 from three independent biological experiments. (E) Flow cytometric analysis showing the percentage of GPA-positive cells on day 7, day 11, and day 15. (F) Quantitative analysis of GPA-positive cells from three independent biological experiments.
-
Figure 1—figure supplement 3—source data 1
Original western blots for Figure 1—figure supplement 3A, indicating the relevant bands.
- https://cdn.elifesciences.org/articles/100406/elife-100406-fig1-figsupp3-data1-v2.pdf
-
Figure 1—figure supplement 3—source data 2
Original files for western blot analysis displayed in Figure 1—figure supplement 3A.
- https://cdn.elifesciences.org/articles/100406/elife-100406-fig1-figsupp3-data2-v2.zip
Figure 1—figure supplement 4
Deficiency of isocitrate dehydrogenase 1 (IDH1) affect the generation of orthochromatic erythroblasts.
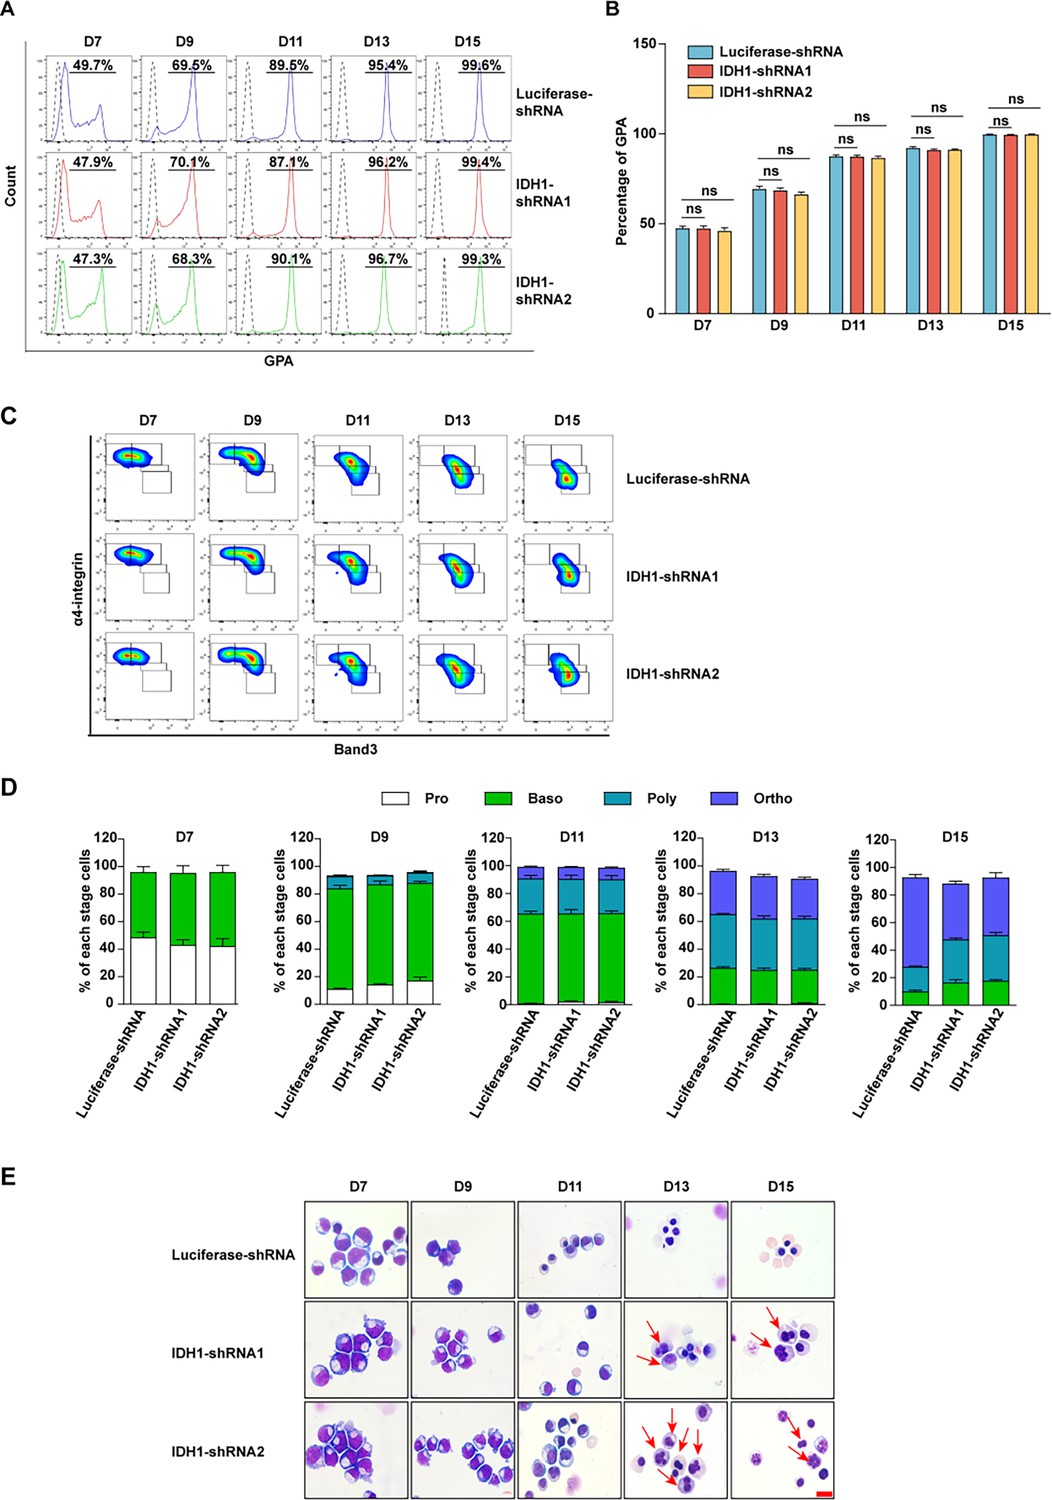
(A) Representative flow cytometry profiles of GPA staining of erythroid cells cultured on days 7, 9, 11, 13, and 15. (B) Quantitative analysis of the percentage of GPA-positive cells from three independent biological experiments. (C) Representative flow cytometry profiles of double-stained with band 3 and α4-integrin on days 7, 9, 11, 13, and 15. (D) Representative cytospin images on days 7, 9, 11, 13, and 15 from three independent biological experiments. Scale bar, 10 μm. (E) Quantitative analysis of the percentage of each stage cells from three independent experiments. Statistical analysis is from three independent biological experiments, and the bar plot represents mean ± SD of triplicate samples. Not significant (ns), *p<0.05, **p<0.01, ***p<0.001.
Figure 1—figure supplement 5
siRNA-mediated knockdown of isocitrate dehydrogenase 1 (IDH1) impaired the terminal stage erythropoiesis.
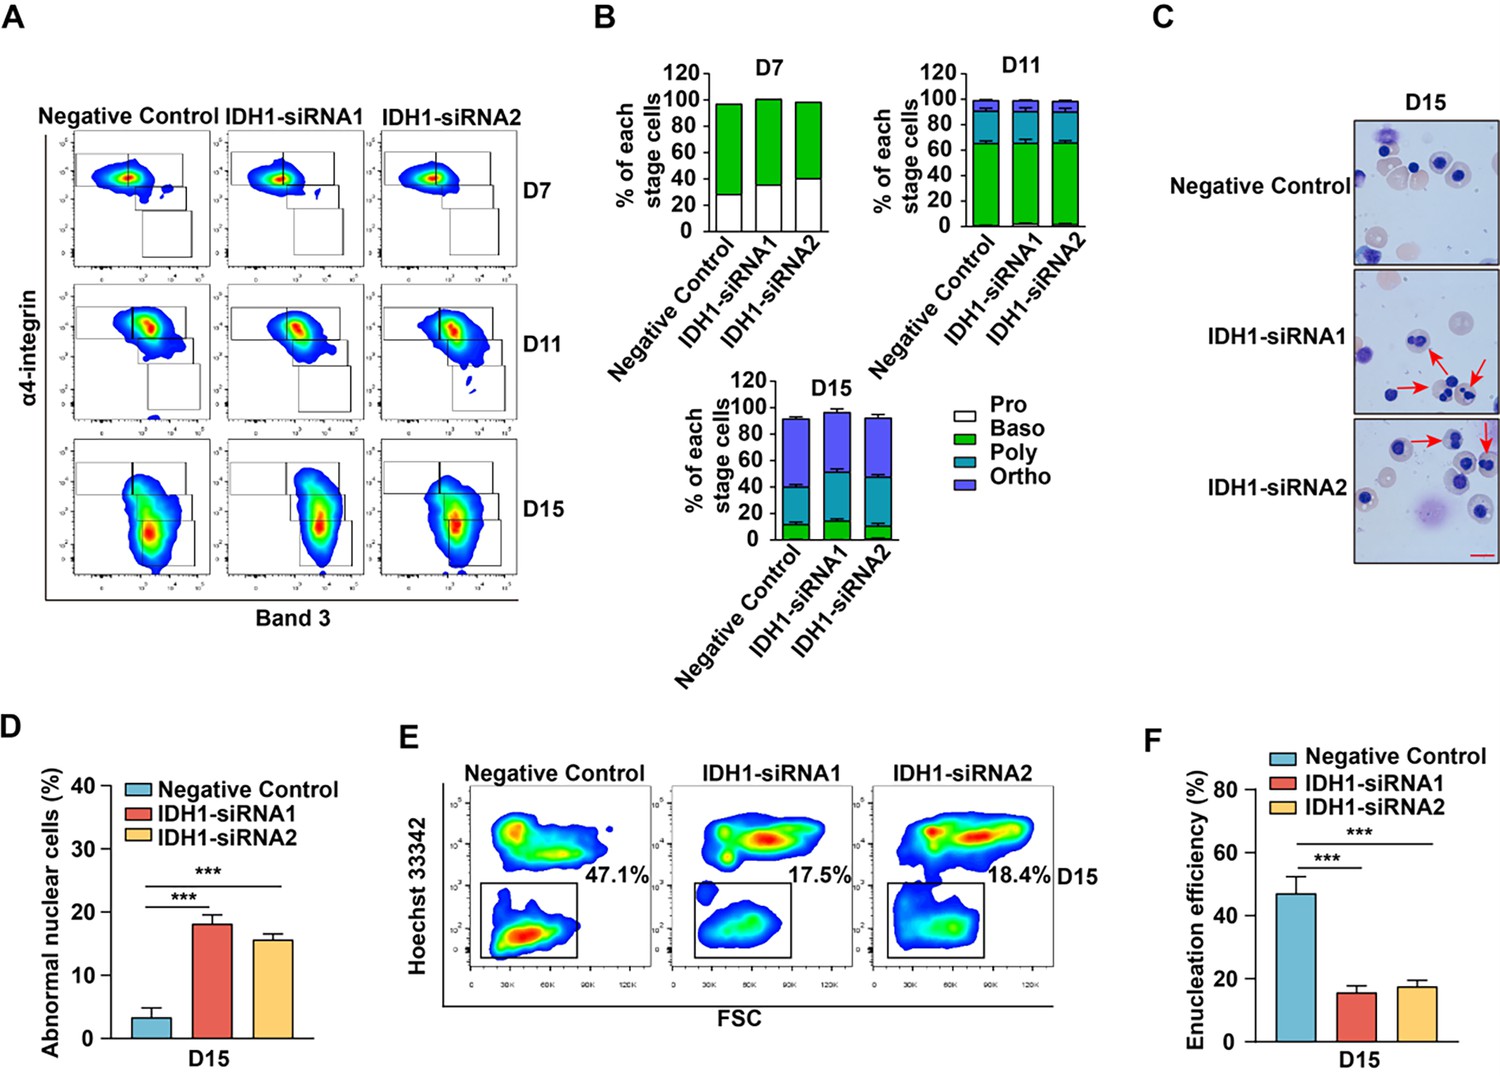
(A) Flow cytometric analysis showing the expression of α4 integrin and band 3 of erythroid cells cultured for day 7, day 11, and day 15. (B) Quantitative analysis of the percentage of each stage cells from three independent biological experiments. (1) day 7, (2) day 11, (3) day 15. (C) Representative cytospin images on day 15 cultured erythroid cells. Scale bar, 10 μm. (D) Statistical analysis of the ratio of abnormal nuclear cells from three independent biological experiments. (E) Flow cytometric analysis showing the enucleation efficiency of Luciferase-shRNA, IDH1-siRNA1, and IDH1-siRNA2 on day 13 and day 15. (F) Statistics analysis of enucleation efficiency from three independent experiments. Statistical analysis is from three independent biological experiments, and the bar plot represents mean ± SD of triplicate samples. Not significant (ns), *p<0.05, **p<0.01, ***p<0.001.
Figure 1—figure supplement 6
Deficiency of isocitrate dehydrogenase 1 (IDH1) impaired nuclear condensation.
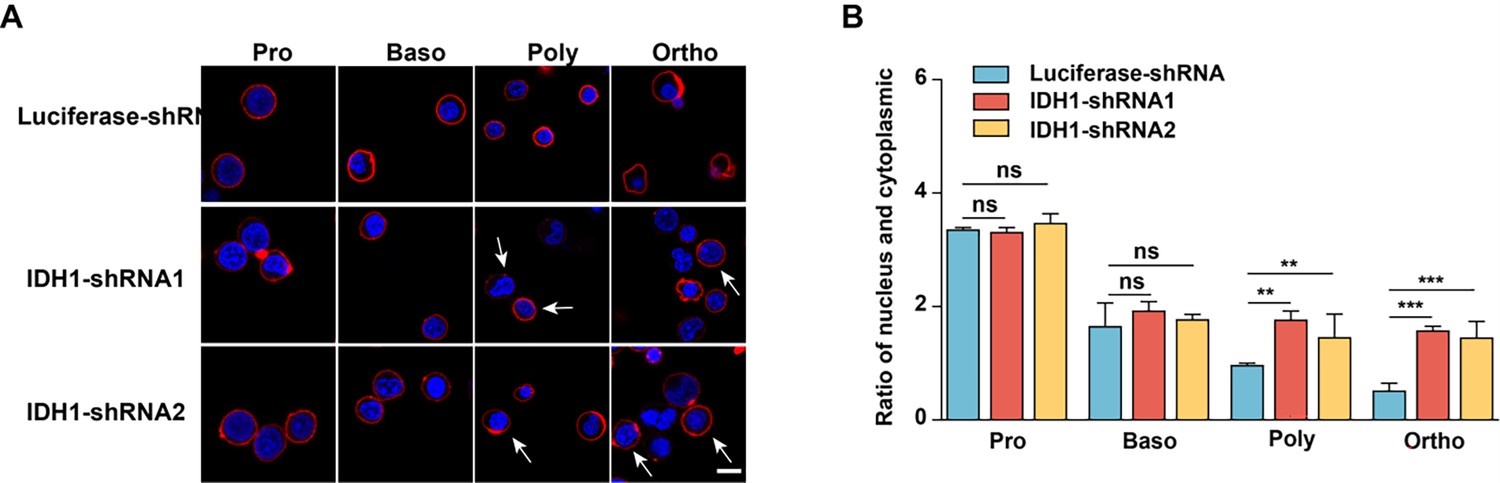
(A) Representative confocal images of proerythroblasts, basophilic erythroblasts, polychromatic erythroblasts, and orthochromatic erythroblasts. The nuclei were stained with DAPI and the color was blue. The cell membrane was stained with GPA and the color was red. Scale bar, 10 μm. (B) Quantitative analysis of the ratio of the nuclear and cytoplasm from three independent biological experiments.
Figure 1—figure supplement 7
Isocitrate dehydrogenase 1 (IDH1) deficiency induced increase of reactive oxygen species (ROS) and decrease of α-ketoglutarate (α-KG).
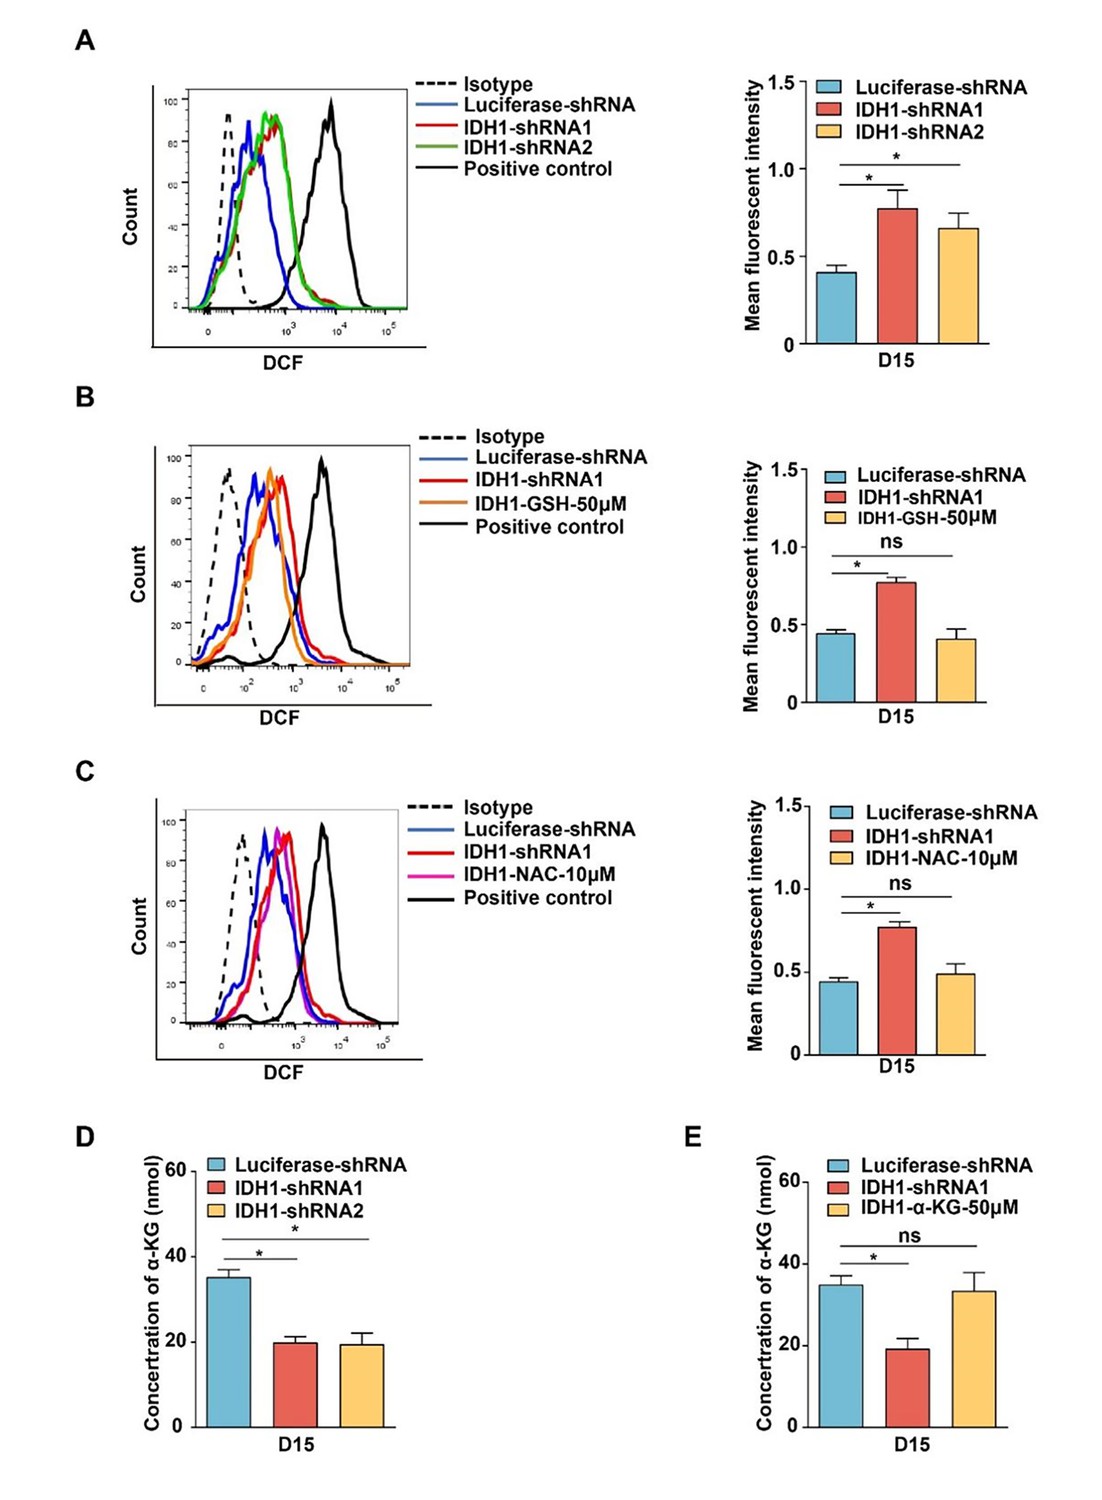
(A) Flow cytometry analysis showed the level of ROS on day 15 erythroid cells with Luciferase-shRNA, IDH1-shRNA1, and IDH1-shRNA2. Quantitative analysis of ROS from three independent biological experiments. (B) Flow cytometry analysis showed the level of ROS on day 15 erythroid cells with Luciferase-shRNA, IDH1-shRNA1, and IDH1-GSH-50μM. Quantitative analysis of ROS from three independent biological experiments. (C) Flow cytometry analysis showed the level of ROS on day 15 erythroid cells with Luciferase-shRNA, IDH1-shRNA1, and IDH1-NAC-10 μM. Quantitative analysis of ROS from three independent biological experiments. (D) Quantitative analysis of the concentration of α-KG with Luciferase-shRNA, IDH1-shRNA1, and IDH1-shRNA2 on day 15 from three independent biological experiments. (E) Quantitative analysis of the concentration of α-KG after supplement α-KG (50 μM) on day 15 from three independent experiments. Statistical analysis is from three independent biological experiments, and the bar plot represents mean ± SD of triplicate samples. Not significant (ns), *p<0.05, **p<0.01, ***p<0.001.
Figure 2 with 1 supplement
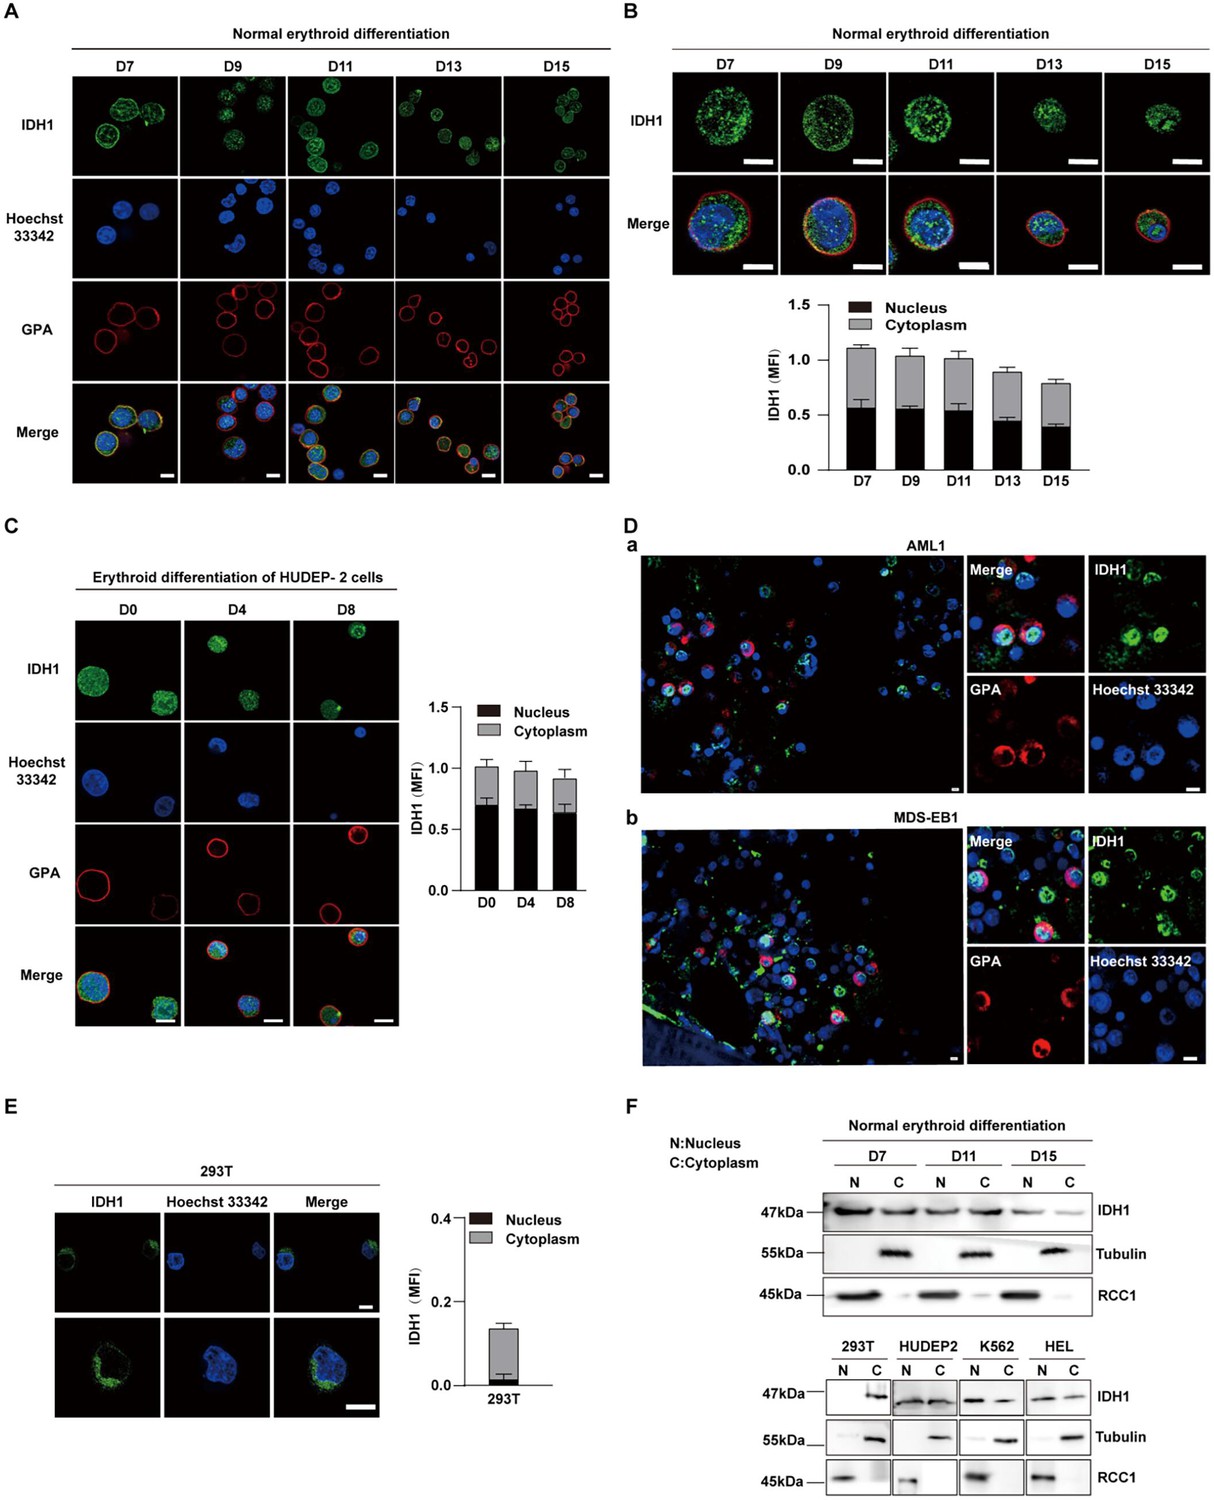
Isocitrate dehydrogenase 1 (IDH1) localizes to nucleus in human erythroid cells.
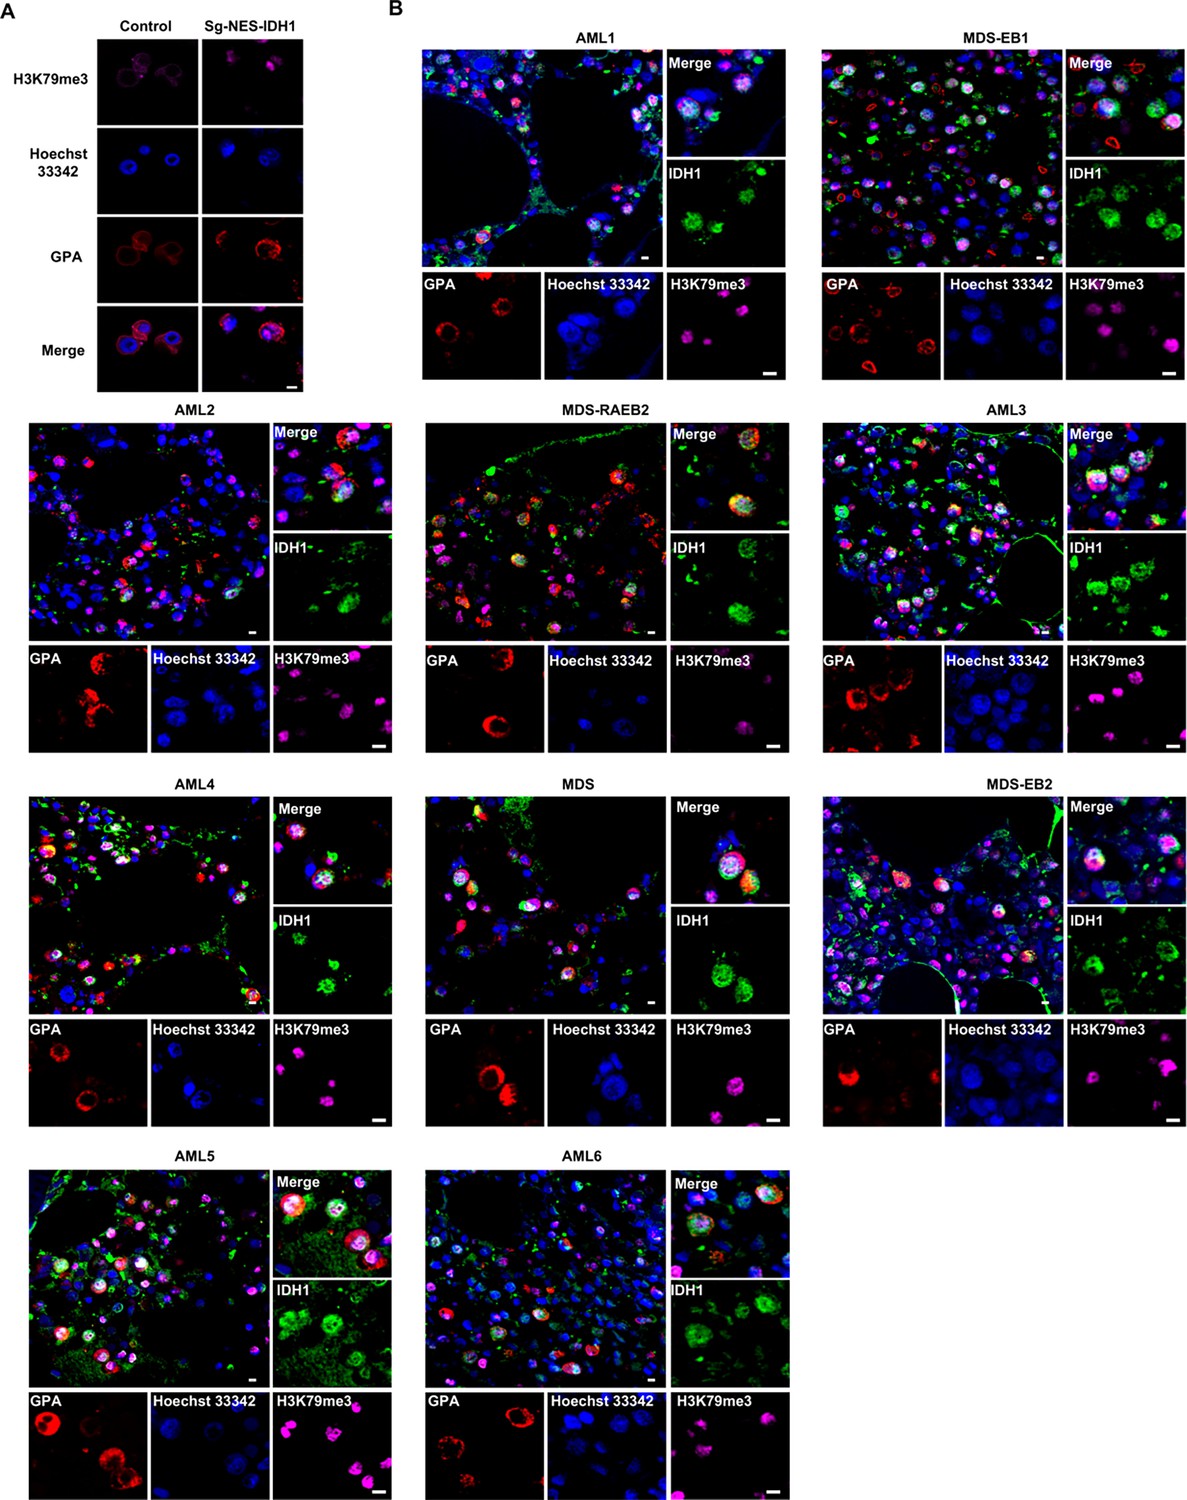
(A, B) Nuclear location of IDH1 (green) on the terminal stages of erythroid cells. Normal human terminal erythroid cells induced from umbilical cord blood-derived CD34+ cells were stained with antibodies targeting IDH1 together with GPA (red) and Hoechst 33342 (blue). Scale bars, 5 μm. MFI (mean fluorescent intensity) of IDH1 in nucleus and cytoplasm during the terminal stages of erythropoiesis was shown at the lower panel. (C) Representative immunofluorescence images showed the location of IDH1 at different time points in the human umbilical cord blood-derived erythroid progenitor 2 (HUDEP-2) cell line. IDH1 (green), GPA (red), and Hoechst 33342 (blue). Scale bars, 5 μm. MFI of IDH1 in nucleus and cytoplasm of erythroid cells was shown at right panel. Data are presented as the mean ± SD from three independent experiments containing at least 30 cells each. (D) Representative immunofluorescence images of IDH1 (green), GPA (red), and Hoechst 33342 (blue) staining of the paraffin-embedded human bone marrow cells of acute myeloid leukemia (AML) and myelodysplastic syndrome (MDS) patients with IDH1 mutation. a. AML1, b. MDS-EB1. Scale bars, 5 μm. (E) Representative immunofluorescence images of IDH1 (green), GPA (red), and Hoechst 33342 (blue) staining of the 293T cells. Scale bars, 5 μm. (F) Representative western blotting images showed the protein expression level of IDH1 on nucleus and cytoplasm of terminal erythroid cells, 293T cells, human HUDEP2 cell lines, K562 and HEL cell lines. RCC1 was used as nuclear loading control, while Tubulin was used as cytoplasm loading control.
-
Figure 2—source data 1
Original western blots for Figure 2F, indicating the relevant bands.
- https://cdn.elifesciences.org/articles/100406/elife-100406-fig2-data1-v2.pdf
-
Figure 2—source data 2
Original files for western blot analysis displayed in Figure 2F.
- https://cdn.elifesciences.org/articles/100406/elife-100406-fig2-data2-v2.zip
Figure 2—figure supplement 1
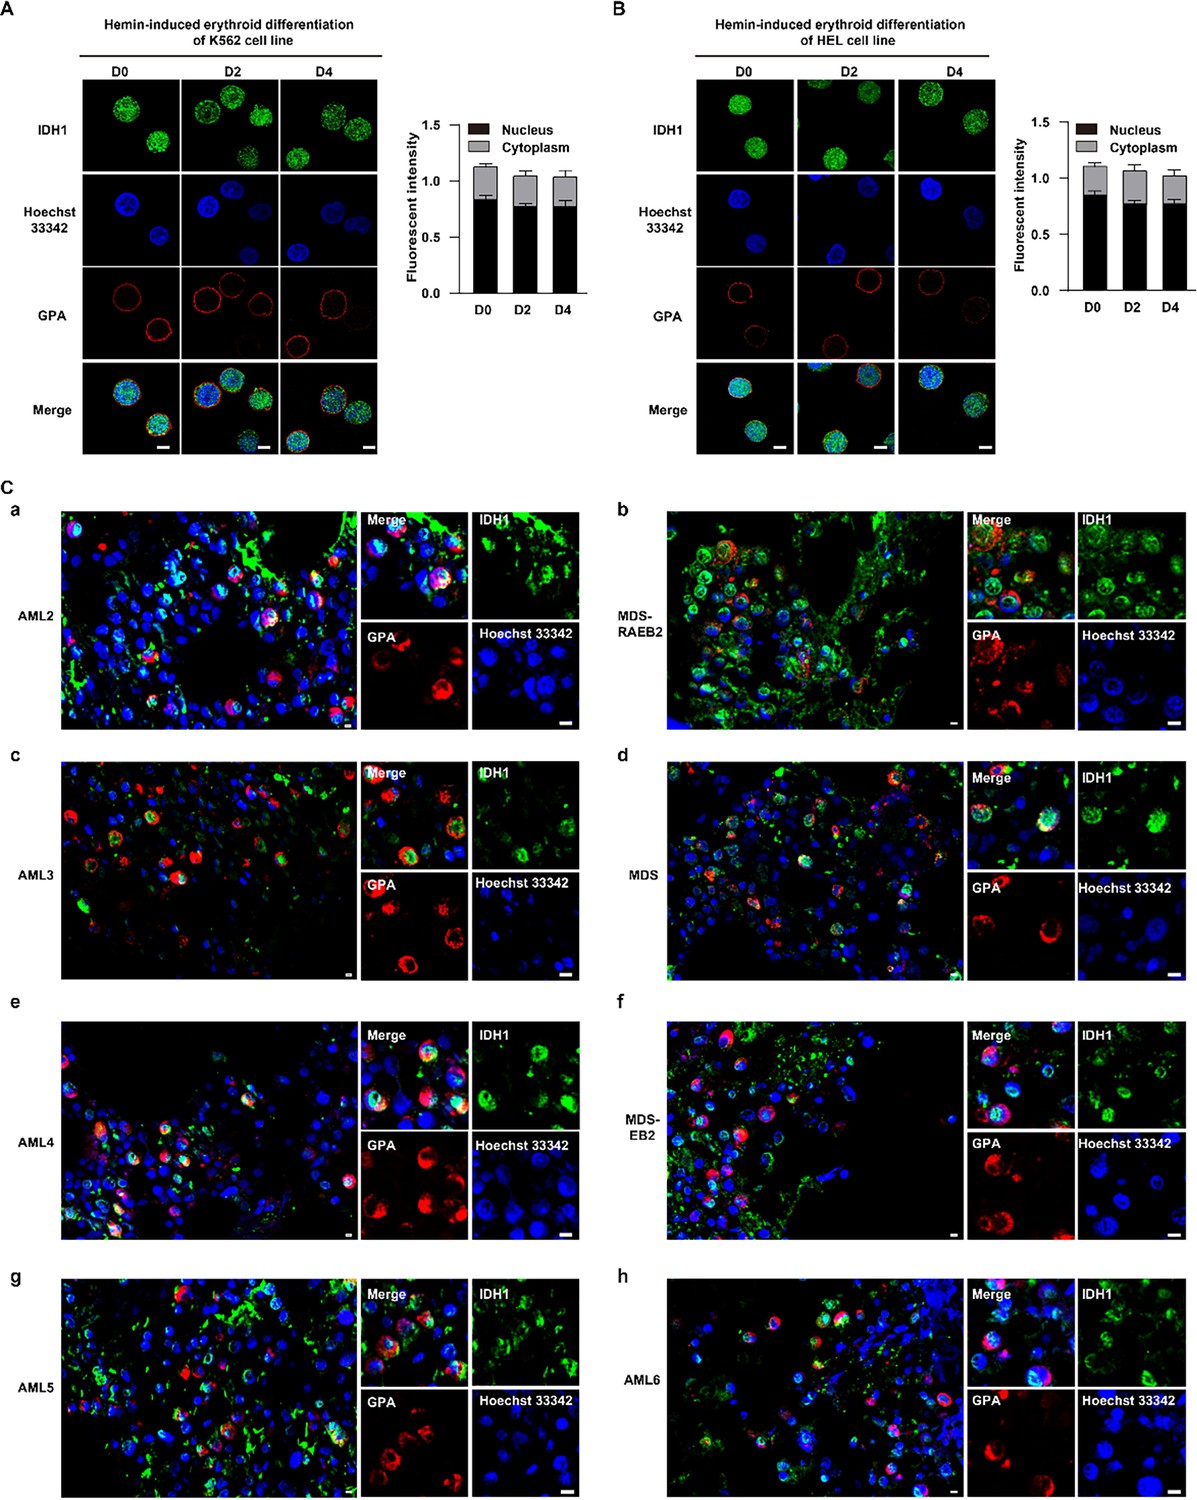
Isocitrate dehydrogenase 1 (IDH1) localizes to nucleus during human erythropoiesis.
(A, B) Representative images on location of IDH1 at erythroid differentiation of hemin-induced (A) K562 and (B) HEL cell lines. IDH1 (green), GPA (red), and Hoechst 33342 (blue). Scale bars, 5 μm. IDH1 MFI of nucleus and cytoplasm of erythroid cells was shown at right panel. Data are presented as the mean ± SD from three independent experiments containing at least 30 cells each. (C) Representative immunofluorescence images of IDH1 (green), GPA (red), and Hoechst 33342 (blue) staining of the paraffin-embedded human bone marrow cells. a. AML-2, b. MDS-RAEB2, c. AML-3, d. MDS, e. AML-4, f. MDS-EB2, e. AML-5, h. AML-6. Scale bars, 5 μm. IDH1 MFI of nucleus and cytoplasm of erythroid cells was shown at right panel. Data are presented as the mean ± SD from three independent experiments containing at least 30 cells each.
Figure 3 with 1 supplement

Nuclear isocitrate dehydrogenase 1 (IDH1) deletion increased abnormal nuclear cells.
(A) Schematic diagram of selectively knockdown nuclear IDH1. (B) A working model for the construction of Sg-IDH1 HUDEP2 cell line and Sg-NES-IDH1 HUDEP2 cell line. (C) Representative immunofluorescence images of location of IDH1 at D8 in HUDEP-2 cell lines. IDH1 (purple), GPA (red), and Hoechst 33342 (blue). Scale bars, 5 μm. (D) Representative western blotting images showed the expression level of IDH1 at D8 in the HUDEP-2 cell lines. (E) Representative cytospin images of control, Sg-IDH1 HUDEP2 cell line and Sg-NES-IDH1 HUDEP2 cell line. Scale bars, 5 μm. (F) Quantitative analysis of the percentage of the abnormal nucleus. Statistical analysis is from three independent biological experiments, and the bar plot represents mean ± SD of triplicate samples. Not significant (ns), *p<0.05, **p<0.01, ***p<0.001.
-
Figure 3—source data 1
Original western blots for Figure 3D, indicating the relevant bands.
- https://cdn.elifesciences.org/articles/100406/elife-100406-fig3-data1-v2.pdf
-
Figure 3—source data 2
Original files for western blot analysis displayed in Figure 3D.
- https://cdn.elifesciences.org/articles/100406/elife-100406-fig3-data2-v2.zip
Figure 3—figure supplement 1
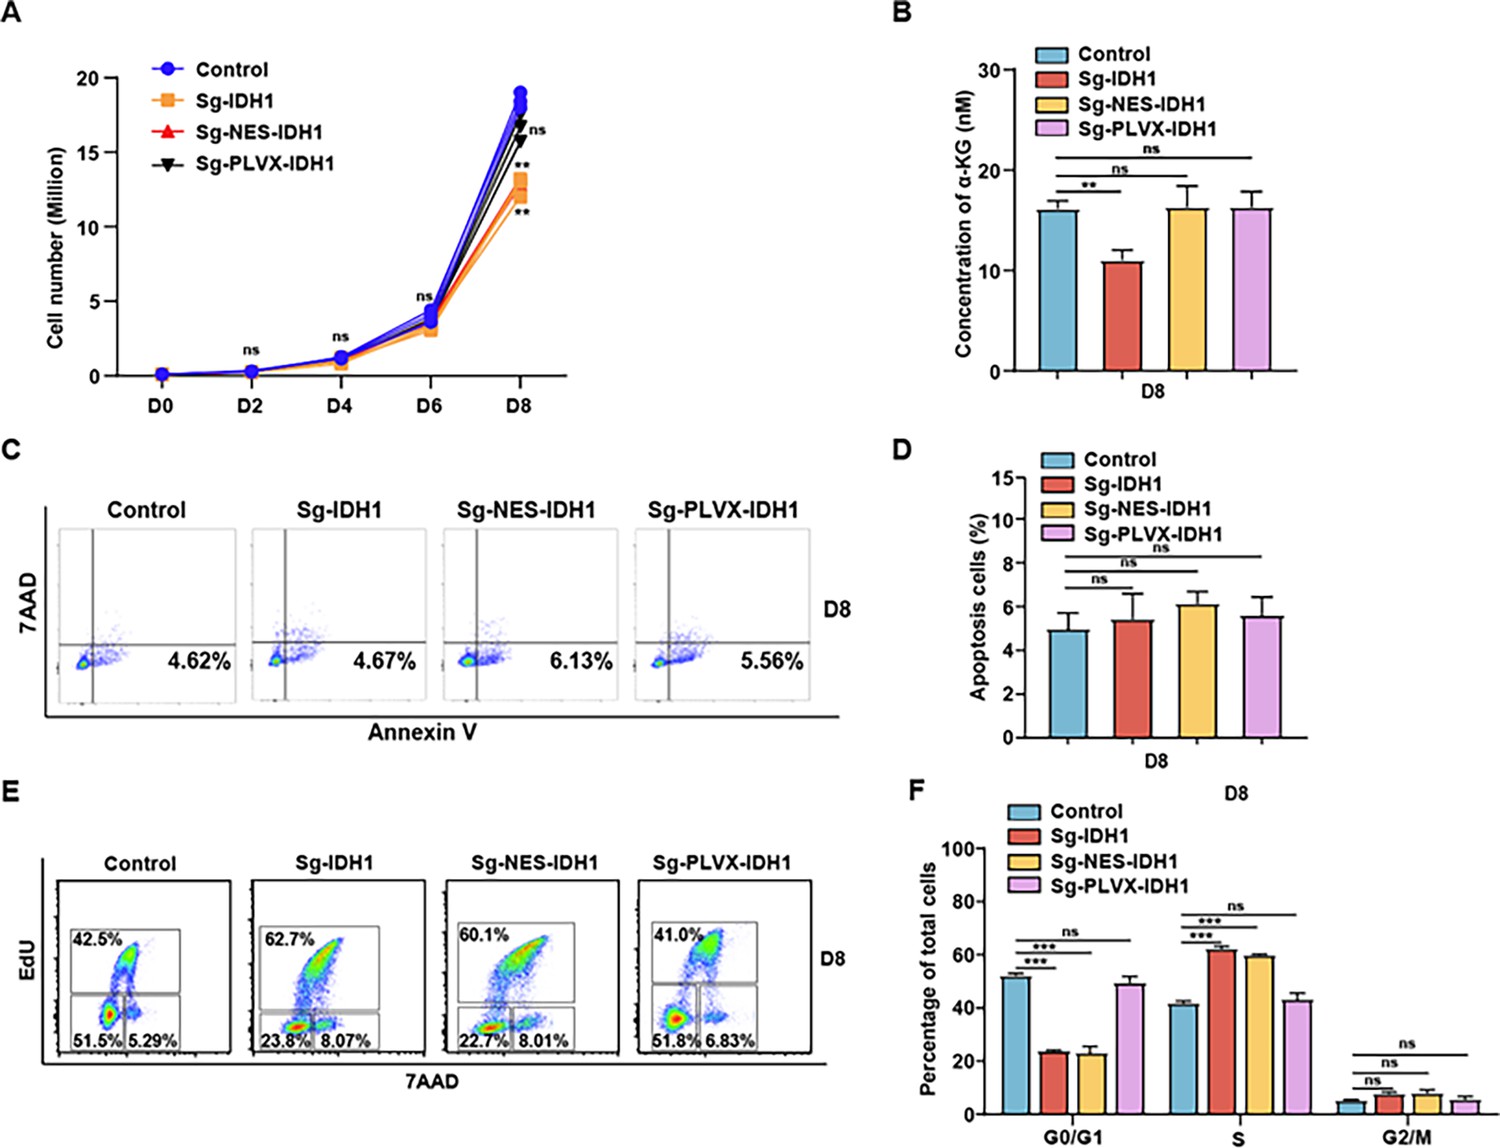
Knockout nuclear isocitrate dehydrogenase 1 (IDH1) lead to cell number decrease of HUDEP2 cells.
(A) Representative growth curve of control, sg-IDH1, sg-NES-IDH1,sg-PLVX-IDH1 on days 0, 2, 4, 6, 8. (B) Quantitative analysis of the concentration of α-ketoglutarate (α-KG) from three independent biological experiments. (C) Representative flow cytometry profiles of apoptosis with Annexin V and 7AAD on days 8. (D) Quantitative analysis of the apoptosis percentage from three independent biological experiments. (E) Representative profiles flow cytometry of cell cycle with Edu and 7AAD on days 8. (F) Quantitative analysis of percentage of G0/G1, S, and G2/M on days 8. Statistical analysis is from three independent biological experiments, and the bar plot represents mean SD of triplicate samples. Not significant (ns), *p<0.05, **p<0.01, ***p<0.001.
Figure 4 with 2 supplements
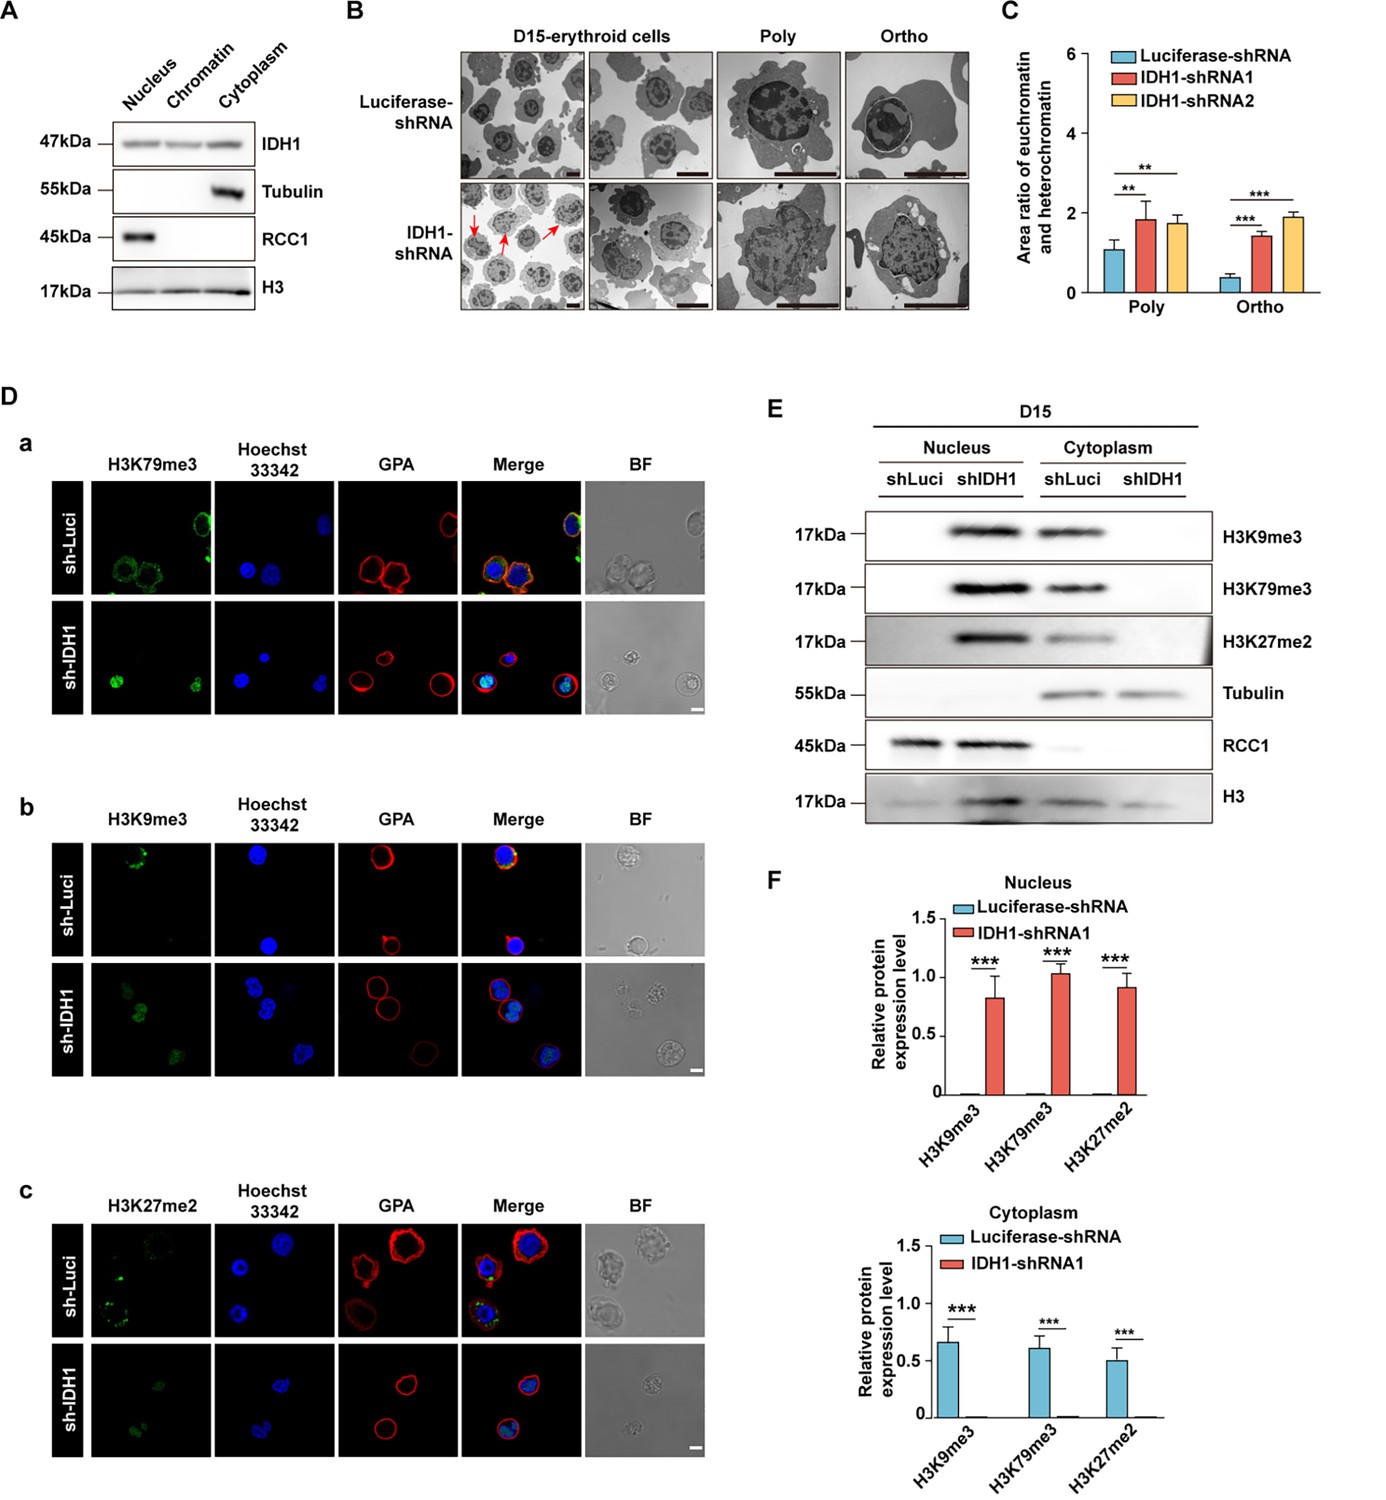
Deficiency of isocitrate dehydrogenase 1 (IDH1) reshape chromatin landscape.
(A) Representative western blotting images showed the expression level of IDH1 in nucleus, chromatin, and cytoplasm of erythroid cells cultured on day 15. (B) Representative transmission electron microscopy images showed the distribution of euchromatin and heterochromatin in nuclear on day 15 erythroid cells. (C) Quantitative analysis showed the area ratio of euchromatin and heterochromatin from three independent experiments. (D) Representative immunofluorescence images of (a) H3K79me3 (green), (b) H3K9me3 (green), (c) H3K27me2 (green). GPA (red) and Hoechst 33342 (blue) staining of Luciferase-shRNA and IDH1-shRNA erythroid cells cultured on day 15. Scale bar, 10 μm. (E) Representative western blotting images showed the abundance of H3K79me3, H3K9me3, H3K27me2 in nucleus and cytoplasm of Luciferase-shRNA and IDH1-shRNA erythroid cells cultured on day 15. (F) Quantitative analysis of the abundance of H3K79me3, H3K9me3, H3K27me2 in nucleus (above) and cytoplasm (below) of Luciferase-shRNA and IDH1-shRNA erythroid cells cultured on day 15 from three independent biological experiments. The bar plot represents mean ± SD of triplicate samples. Not significant (ns), *p<0.05, **p<0.01, ***p<0.001.
-
Figure 4—source data 1
Original western blots for Figure 4A and E, indicating the relevant bands.
- https://cdn.elifesciences.org/articles/100406/elife-100406-fig4-data1-v2.pdf
-
Figure 4—source data 2
Original files for western blot analysis displayed in Figure 4A and E.
- https://cdn.elifesciences.org/articles/100406/elife-100406-fig4-data2-v2.zip
Figure 4—figure supplement 1
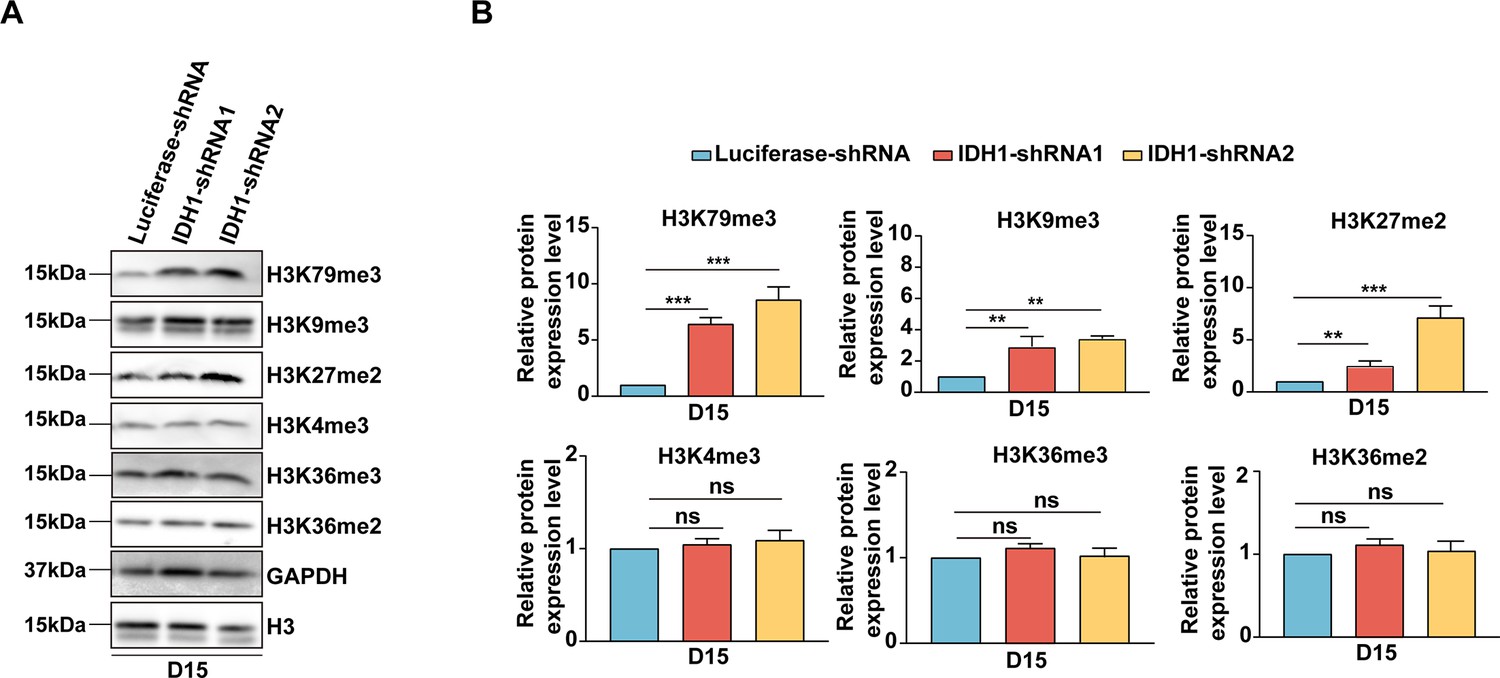
Isocitrate dehydrogenase 1 (IDH1) deficiency induced aberrant distribution and accumulation of histone modifications.
(A) Representative Western Blotting images showed the total protein expression level of histone modification on day 15. (B) Quantitative analysis of the relative protein expression level of histone modification on day 15 from three independent biological experiments, and the bar plot represents mean SD of triplicate samples. Not significant (ns), *p<0.05, **p<0.01, ***p<0.001.
-
Figure 4—figure supplement 1—source data 1
Original western blots for Figure 4—figure supplement 1A, indicating the relevant bands.
- https://cdn.elifesciences.org/articles/100406/elife-100406-fig4-figsupp1-data1-v2.pdf
-
Figure 4—figure supplement 1—source data 2
Original files for western blot analysis displayed in Figure 4—figure supplement 1A.
- https://cdn.elifesciences.org/articles/100406/elife-100406-fig4-figsupp1-data2-v2.zip
Figure 4—figure supplement 2
The location of isocitrate dehydrogenase 1 (IDH1) and H3K79me3 in terminal erythroblasts of sg-NES-IDH1 HUDEP-2 cell line and AML/MDA patients.
(A) Representative immunofluorescence images of location of H3K79me3 in control and sg-NES-IDH1 HUDEP-2 cell lines. H3K79me3 (purple), GPA (red) and Hoechst 33342 (blue). Scale bars, 5 μm. (B) Representative immunofluorescence images of IDH1 (green), H3K79me3 (purple), GPA (red), and Hoechst 33342 (blue) staining of the paraffin-embedded human bone marrow cells.
Figure 5

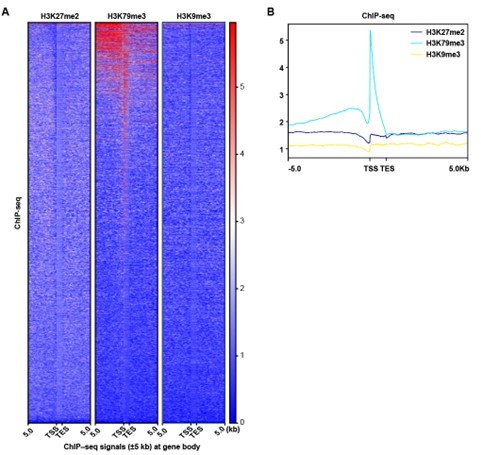
Identification of H3K79me3 as the critical factor in response to isocitrate dehydrogenase 1 (IDH1) deficiency.
(A) Heatmaps displayed normalized ChIP signal of H3K27me2 (left), H3K79me3 (middle), and H3K9me3 (right) at gene body regions. The window represents ±1.5 kb regions from the gene body. TES, transcriptional end site; TSS, transcriptional start site. (B) Representative peaks chart image showed normalized ChIP signal of H3K27me2 (cyan), H3K79me3 (blue), and H3K9me3 (yellow) at gene body regions. (C) Statistics analysis of total peak number of H3K27me2, H3K79me3, and H3K9me3 from three independent biological experiments. (D) The bar plot showed the distribution of ChIPseeker-derived annotations of the genomic loci covered by peaks of H3K79me3, H3K27me2, and H3K9me3. (E) Statistics analysis of promoter peak number of H3K27me2, H3K79me3, and H3K9me3 from three independent biological experiments. (F) The bar plot showed GO enrichment analysis of the H3K79me3 peaks linked gene promoter.
Figure 6 with 1 supplement
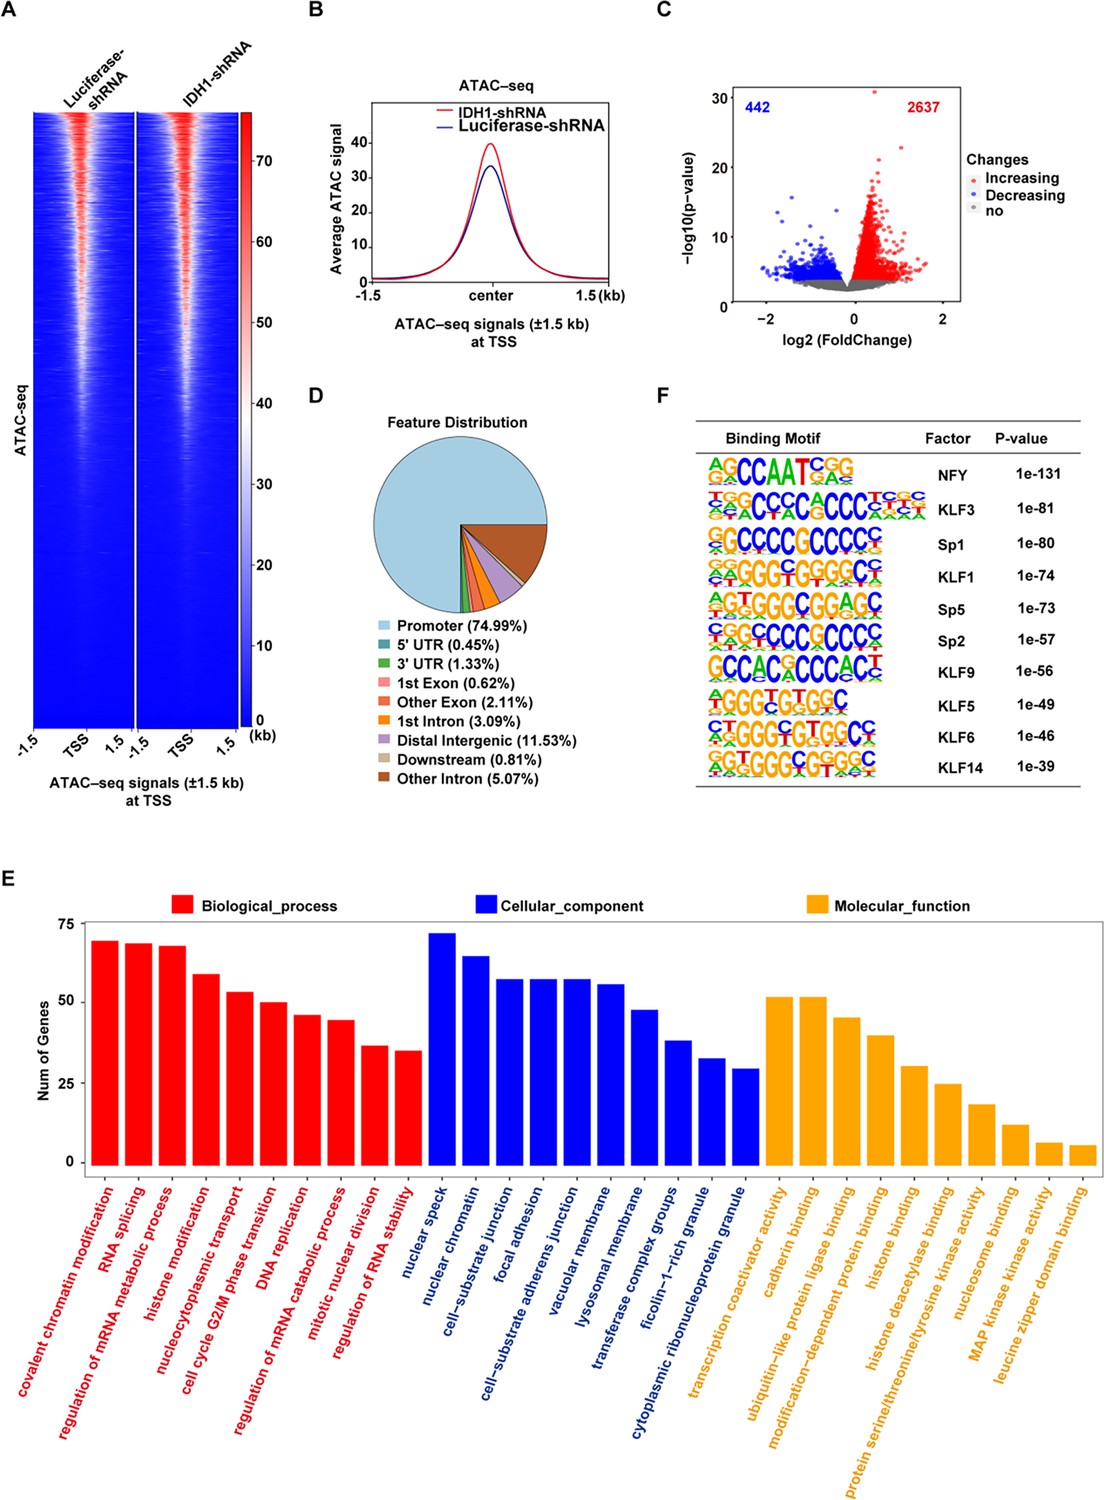
Isocitrate dehydrogenase 1 (IDH1) deletion increase the chromatin accessibility in late-stage erythroid cells.
(A) Heatmaps displayed assay for transposase-accessible chromatin (ATAC) signal of Luciferase-shRNA (left) and IDH1-shRNA (right) at transcriptional start site (TSS). The window represents ±1.5 kb regions from the TSS. (B) Representative peaks chart image showed ATAC signal of IDH1-shRNA (green) and Luciferase-shRNA (blue) at TSS. (C) The volcano map showed differentially accessible peaks of gain (red color) and loss (blue color). (D) The bar plot displayed the distribution of peaks relative to gene features for differentially accessible peaks. (E) The bar plot showed GO enrichment analysis of the gained peaks linked gene promoter. (F) The top regulatory protein-binding sites identified by the HOMER algorithm from differentially accessible peaks. The top 10 motifs were ranked by p-value.
Figure 6—figure supplement 1
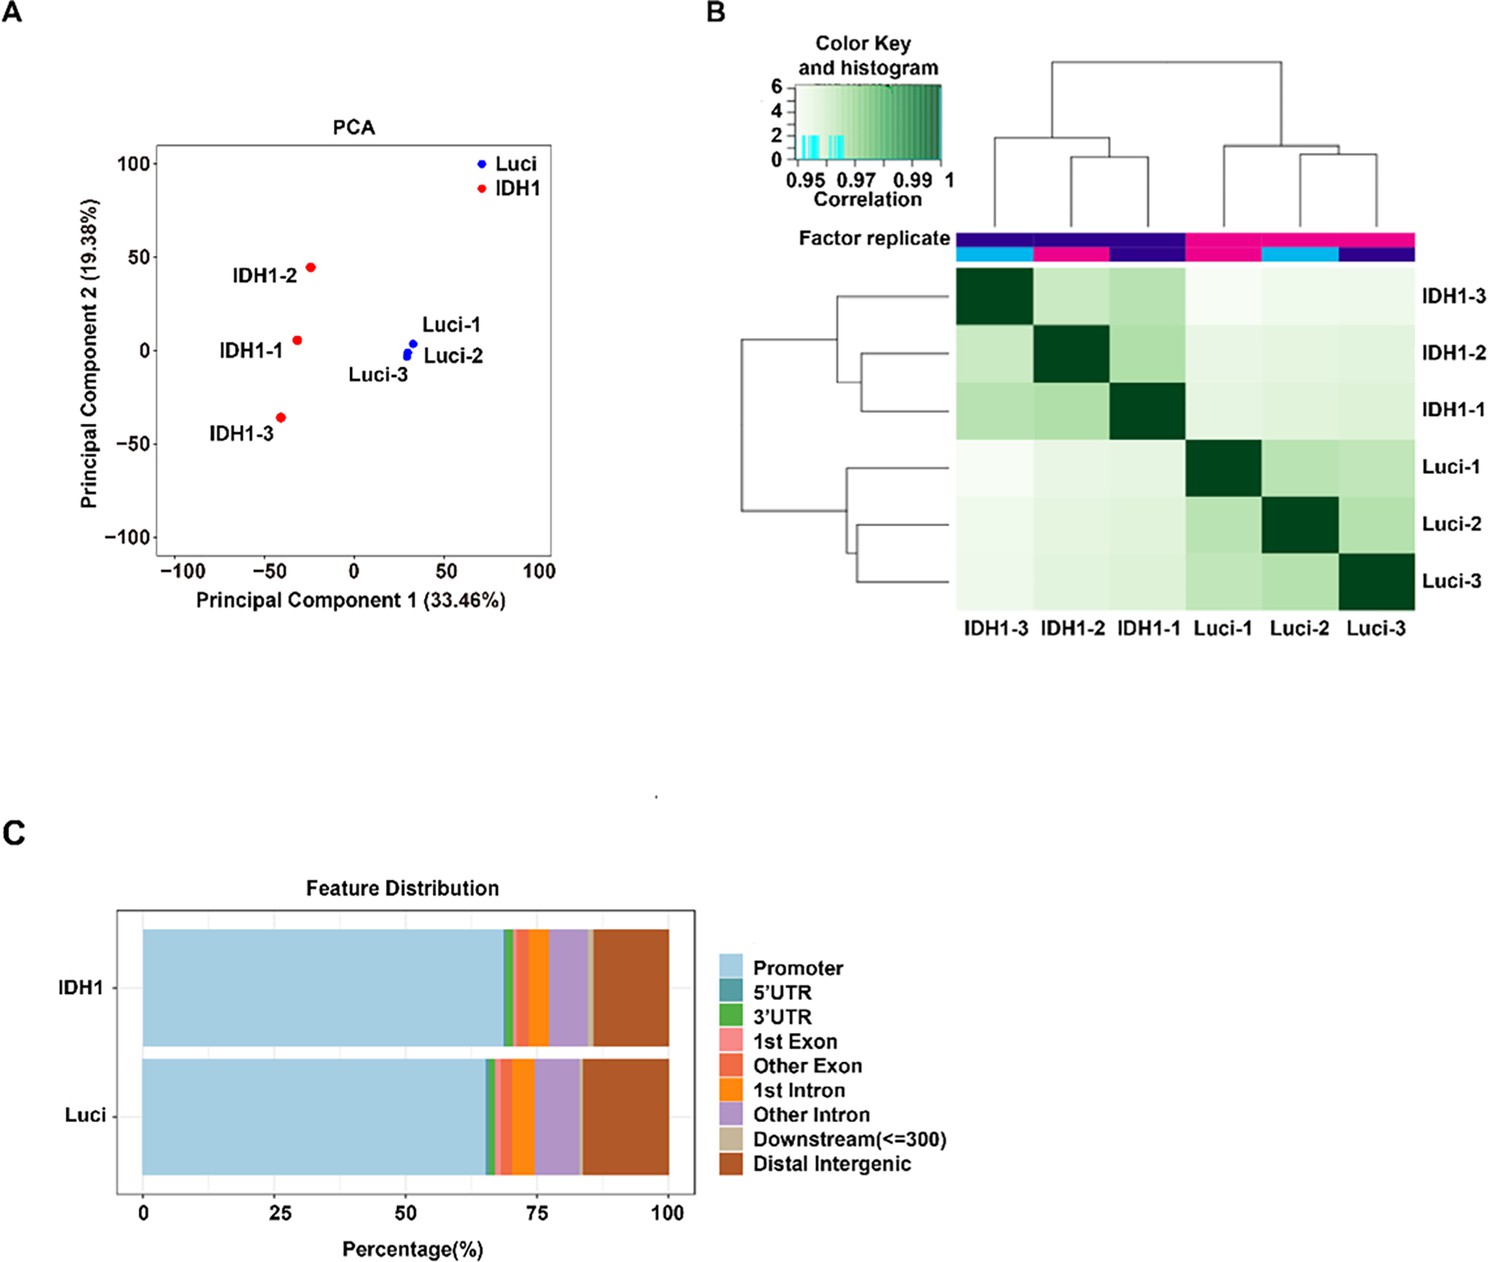
assay for transposase-accessible chromatin with high-throughput sequencing (ATAC-seq) analysis.
(A) Principal component analysis of (PCA) of ATAC-seq data. (B) Pearson correlation analysis of ATAC-seq data. (C) Bar plot displayed the distribution of peaks relative to gene features for isocitrate dehydrogenase 1 (IDH1)-shRNA and Luciferase-shRNA.
Figure 7 with 2 supplements
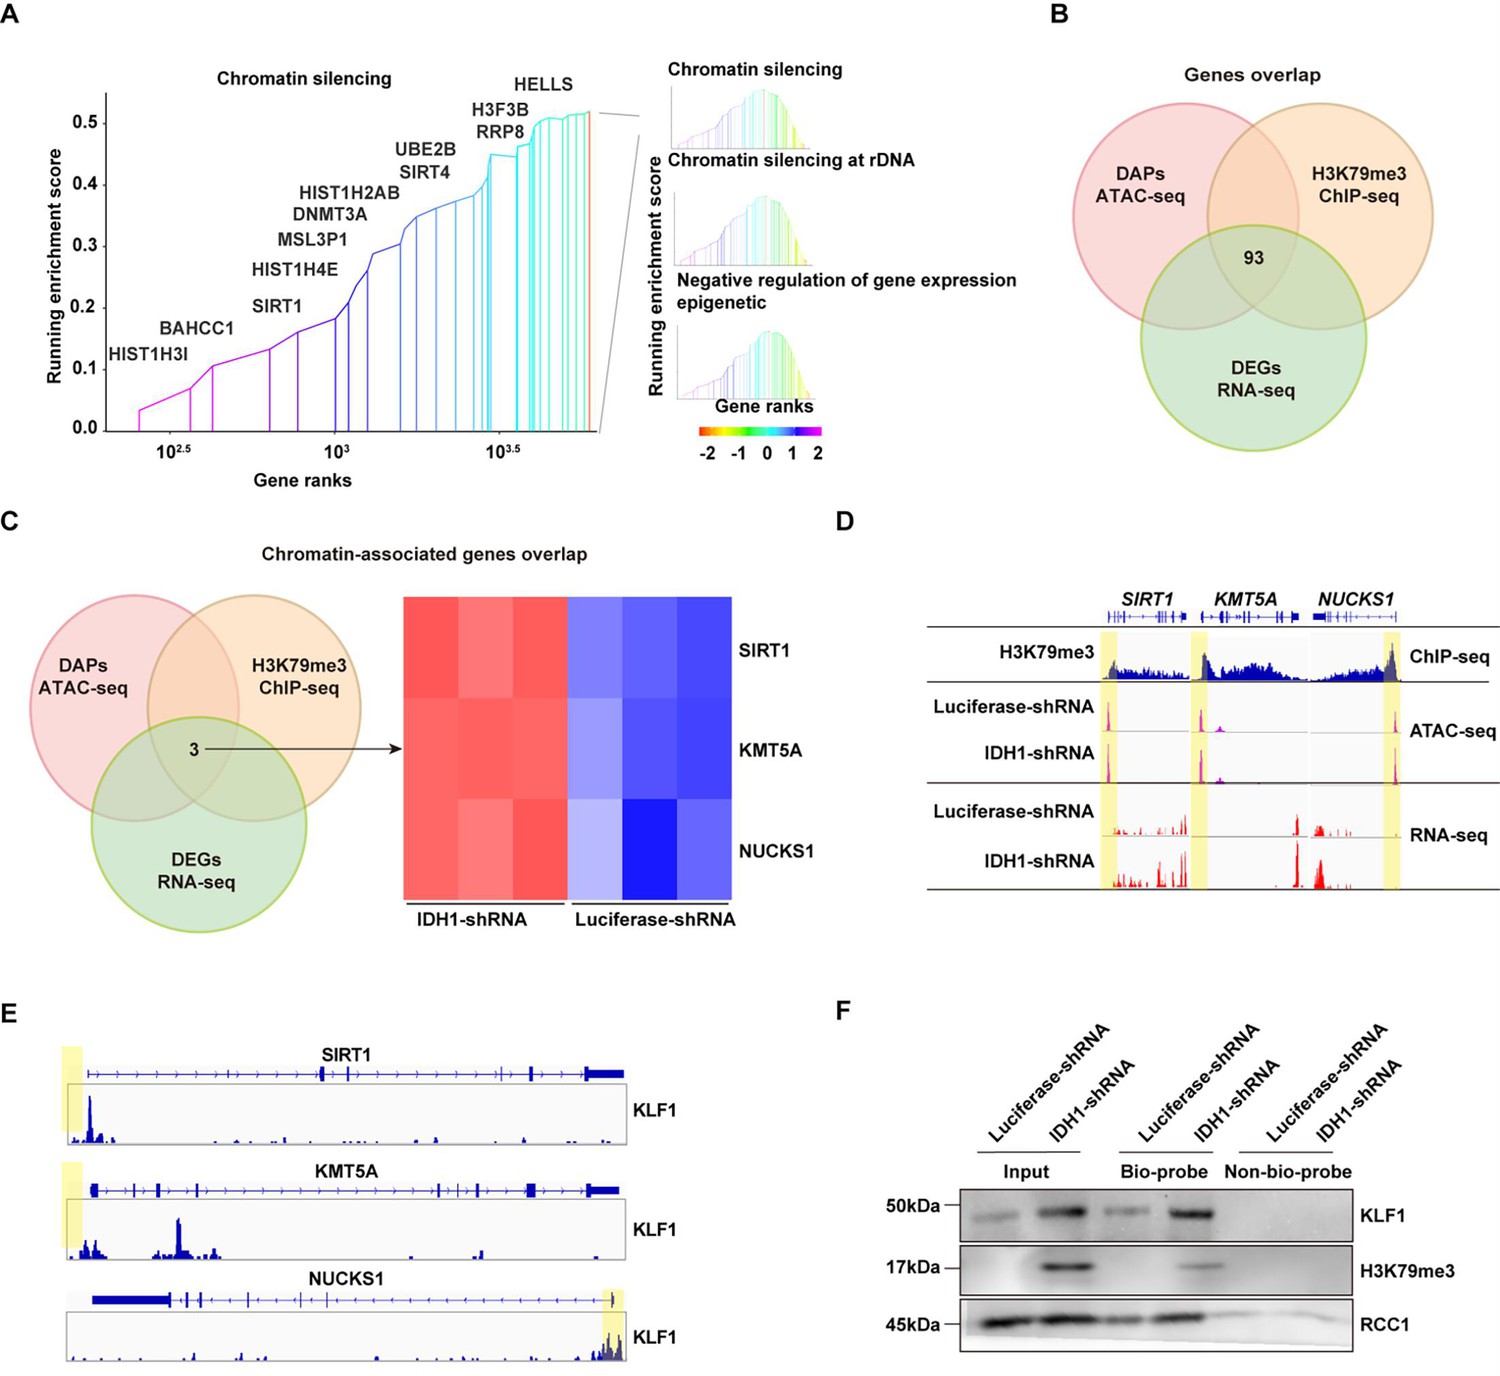
Integrated analysis of ChIP-seq, assay for transposase-accessible chromatin with high-throughput sequencing (ATAC-seq), and RNA-seq.
(A) Gene set enrichment analysis (GSEA) howed chromatin-associated pathways from differentially expressed genes (DEGs) with promoter region marked by H3K79me3. (B) Gene overlap analysis of ATAC-seq, ChIP-seq, and RNA-seq. (C) Chromatin-associated genes overlap analysis of ATAC-seq, ChIP-seq, and RNA-seq. (D) SIRT1, KMT5A, and NUCKS1 gene locus. Patterns of H3K79me3 modification denoted by ChIP peaks (red) are apparent in IDH1-shRNA increased chromatin accessibility (identified by ATAC-seq) (orange) and gene expression (identified by RNA-seq) (blue). (E) KLF1 binding sites of SIRT1, KMT5A, and NUCKS1 locus. (F) DNA pull-down assay showed KLF1 and H3K79me3 could binding to SIRT1 gene promoter.
-
Figure 7—source data 1
Original western blots for Figure 7F, indicating the relevant bands.
- https://cdn.elifesciences.org/articles/100406/elife-100406-fig7-data1-v2.pdf
-
Figure 7—source data 2
Original files for western blot analysis displayed in Figure 7F.
- https://cdn.elifesciences.org/articles/100406/elife-100406-fig7-data2-v2.zip
Figure 7—figure supplement 1
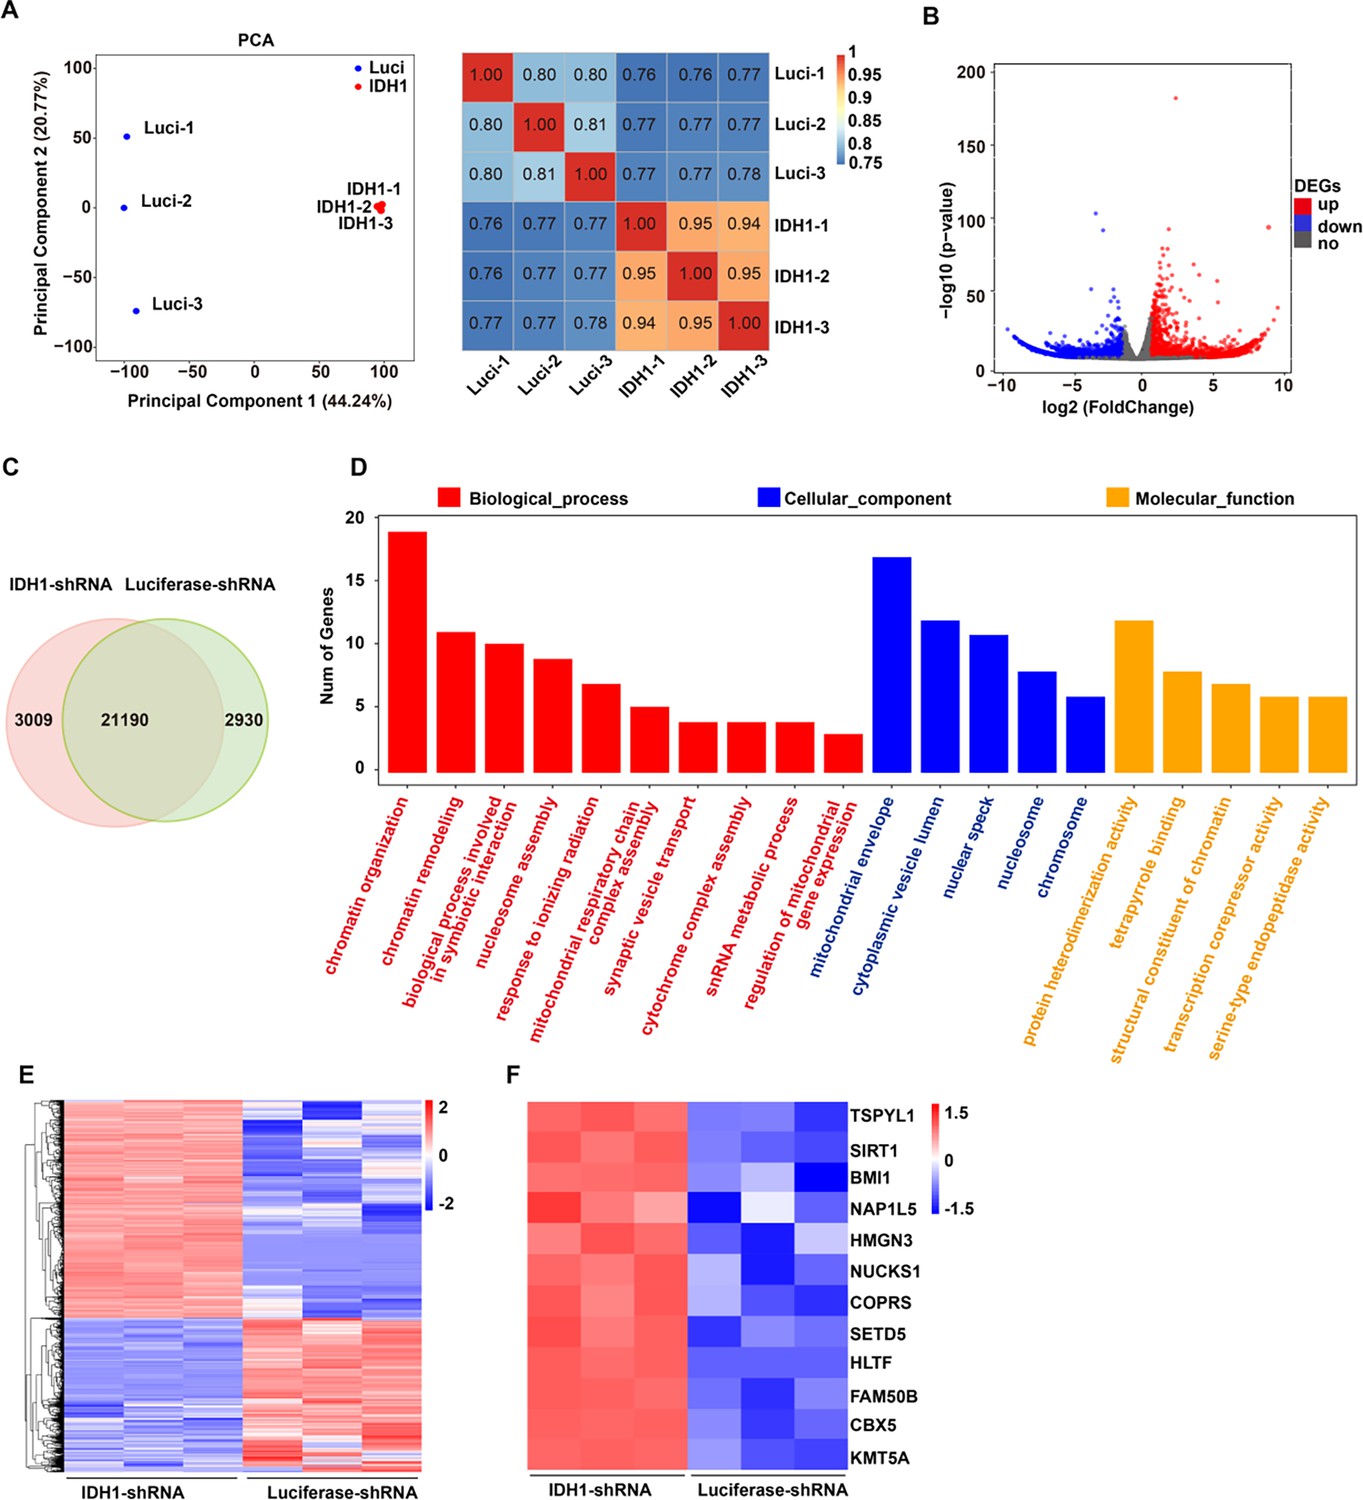
RNA-seq analysis.
(A) Principal component analysis (left) and Pearson correlation analysis (right) of RNA-seq data. (B) The volcano map showed differentially expressed genes (DEGs) that upregulated (red color) and downregulated (blue color). (C) Representative images displayed DEGs of Luciferase-shRNA and isocitrate dehydrogenase 1 (IDH1)-shRNA from three independent biological experiments. (D) GO analysis. (E) Upregulated genes in chromatin associated pathways in IDH1-shRNA group. The color represents log-transformed adjusted p-value; the width indicates the number of DEGs in the category. (F) Heatmaps displayed DEGs associated chromatin of Luciferase-shRNA and IDH1-shRNA.
Figure 7—figure supplement 2
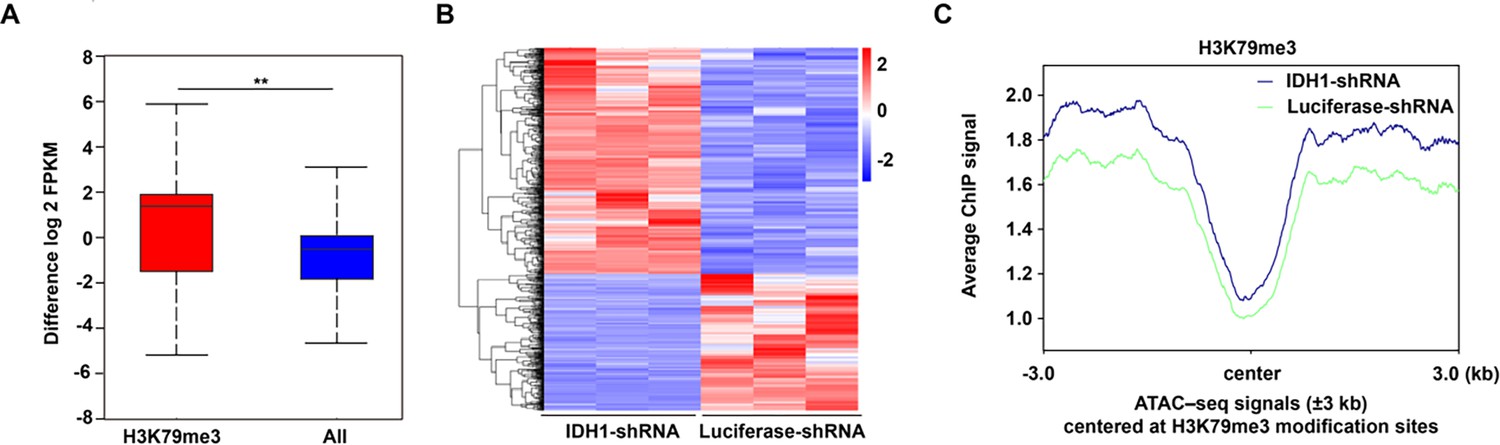
Integrated analysis of ChIP-seq, assay for transposase-accessible chromatin with high-throughput sequencing (ATAC-seq), and RNA-seq.
(A) Box plot showed that the genes modified by H3K79me3 were upregulated. (B) Heatmaps displayed differentially expressed genes (DEGs) with promoter region marked by H3K79me3. (C) The mean of ATAC signals at H3K79me3 modification sites.
Figure 8 with 2 supplements
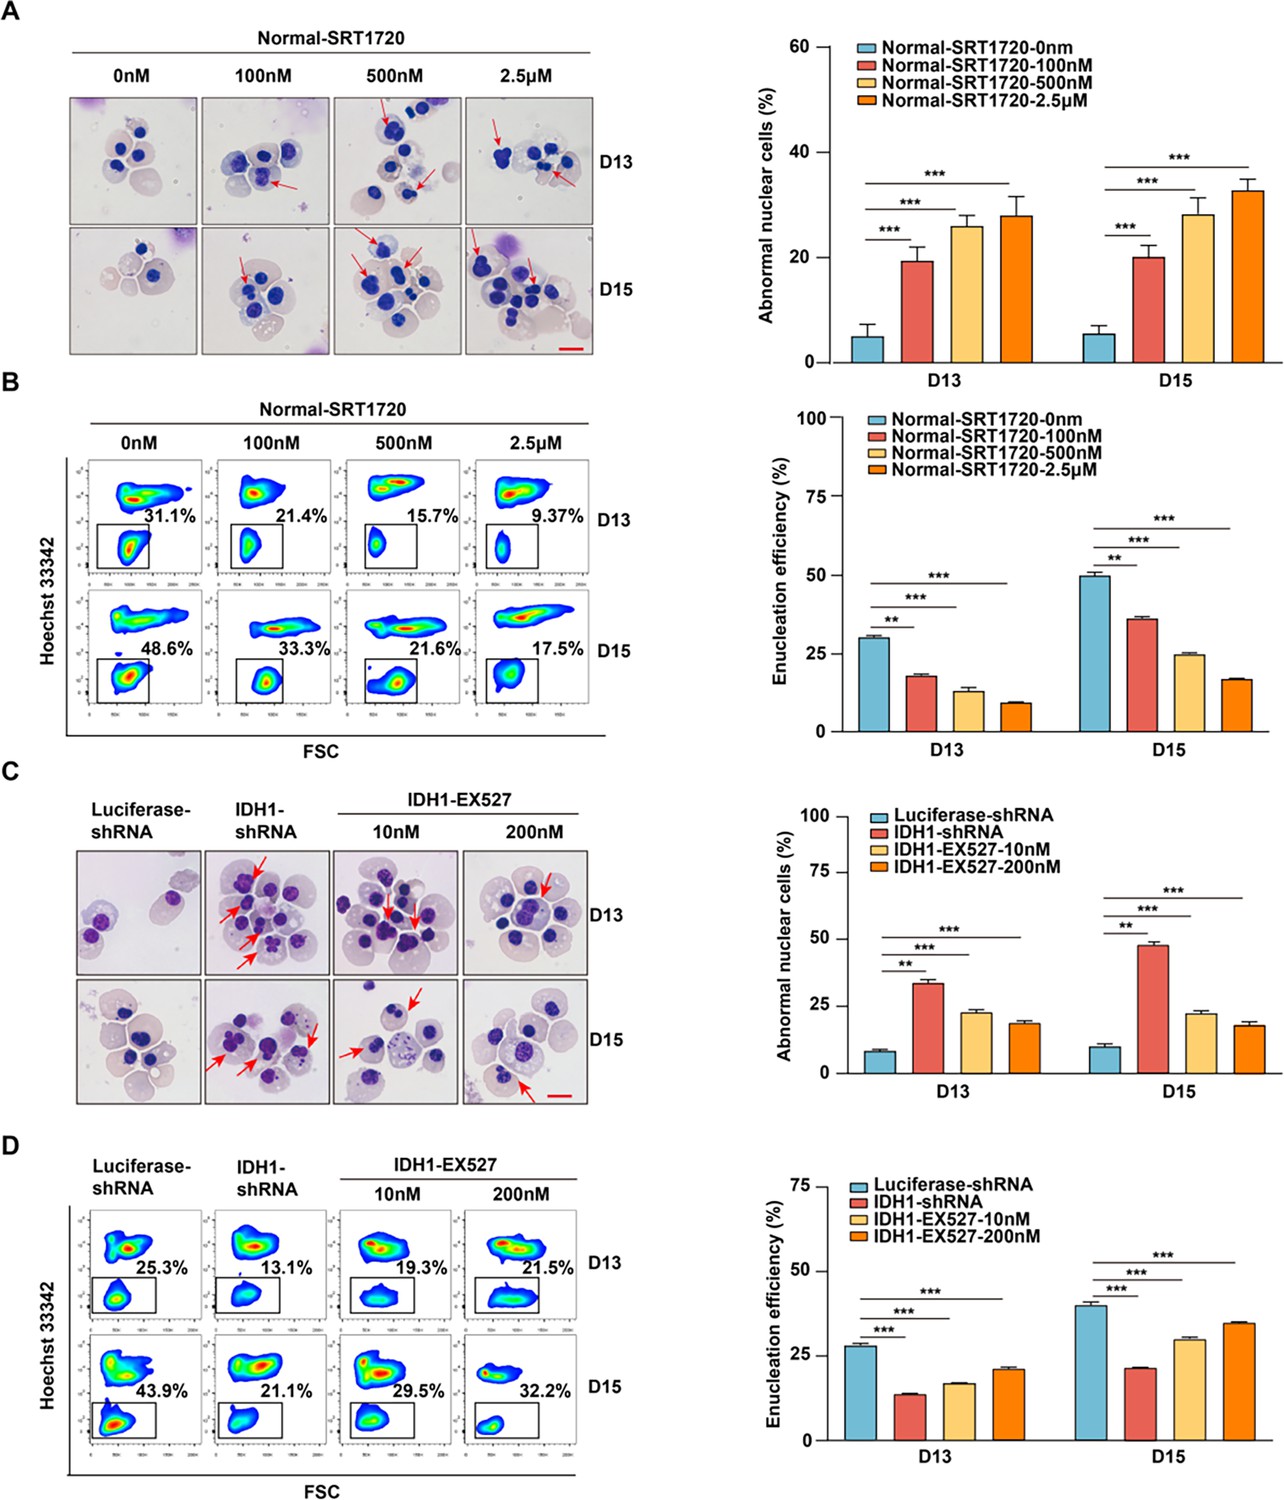
SIRT1 plays a critical role in mediating the regulatory effect of isocitrate dehydrogenase 1 (IDH1) during terminal stage erythropoiesis.
(A) Representative cytospin images of Normal-SRT1720 (0 nM, 100 nM, 500 nM, 2.5 μM) on day 13 and day 15. The red arrows point to the cells with abnormal nucleus. Scale bar, 10 μm. Statistics analysis of abnormal nuclear cells from three independent biological experiments. (B) Flow cytometric showing the enucleation efficiency of Normal-SRT1720 (0 nM, 100 nM, 500 nM, 2.5 μM) on day 13 and day 15. Statistics analysis of enucleation efficiency from three independent biological experiments. (C) Representative cytospin images of Luciferase-shRNA, IDH1-shRNA, IDH1-shRNA-EX527 (10 nM, 200 nM) on day 13 and day 15. The red arrows point to the cells that are abnormal nucleus. Scale bar, 10 μm. Statistics analysis of abnormal nuclear cells from three independent biological experiments. (D) Flow cytometric showing the enucleation efficiency of Luciferase-shRNA, IDH1-shRNA, IDH1-shRNA-EX527 (10 nM, 200 nM) on day 13 and day 15. Statistics analysis of enucleation efficiency from three independent experiments. Statistical analysis is from three independent biological experiments, and the bar plot represents mean ± SD of triplicate samples. Not significant (ns), *p<0.05, **p<0.01, ***p<0.001.
Figure 8—figure supplement 1
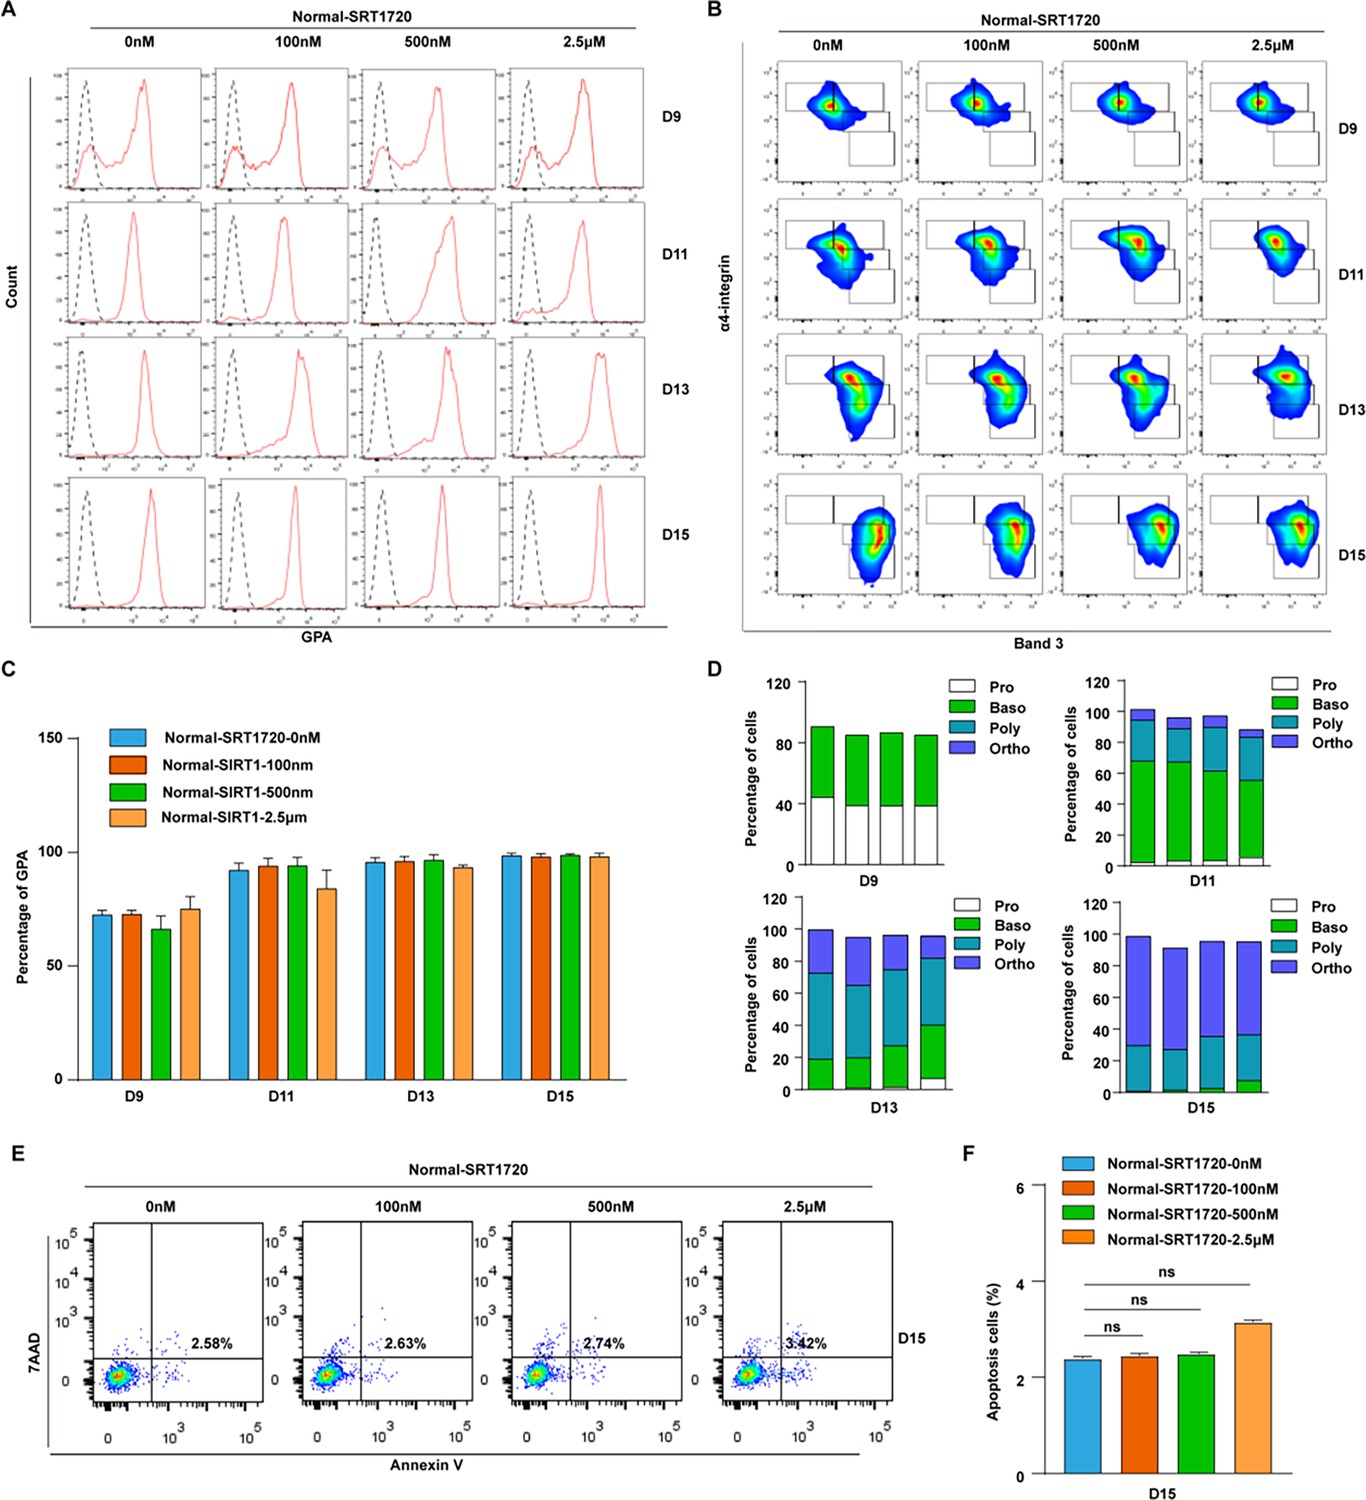
Treatment with SIRT1 activator have no effet on cell differentiation and apoptosis of terminal erythroblasts.
(A) Representative flow cytometry profiles of GPA staining with Normal-SRT1720 (0 nM, 100 nM, 500 nM, 2.5 μM) on days 9, 11, 13, and 15. (B) Quantitative analysis of the percentage of GPA-positive cells from three independent biological experiments. (B) (C) Representative flow cytometric profiles of apoptosis stained with 7AAD and Annexin V on day 15 erythroid cells with Normal-SRT1720 (0 nM, 100 nM, 500 nM, 2.5 μM) from three independent biological experiments. (D) Quantitative analysis of apoptosis cells from three independent biological experiments. (E) Representative flow cytometric profiles of apoptosis stained with 7AAD and Annexin V at day 15 of culture cells with Normal-SRT1720 (0 nM, 100 nM, 500 nM, 2.5 μM). (F) Quantitative analysis of apoptosis cells from three independent biological experiments. Statistical analysis is from three independent biological experiments, and the bar plot represents mean ± SD of triplicate samples. Not significant (ns), *p<0.05, **p<0.01, ***p<0.001.
Figure 8—figure supplement 2
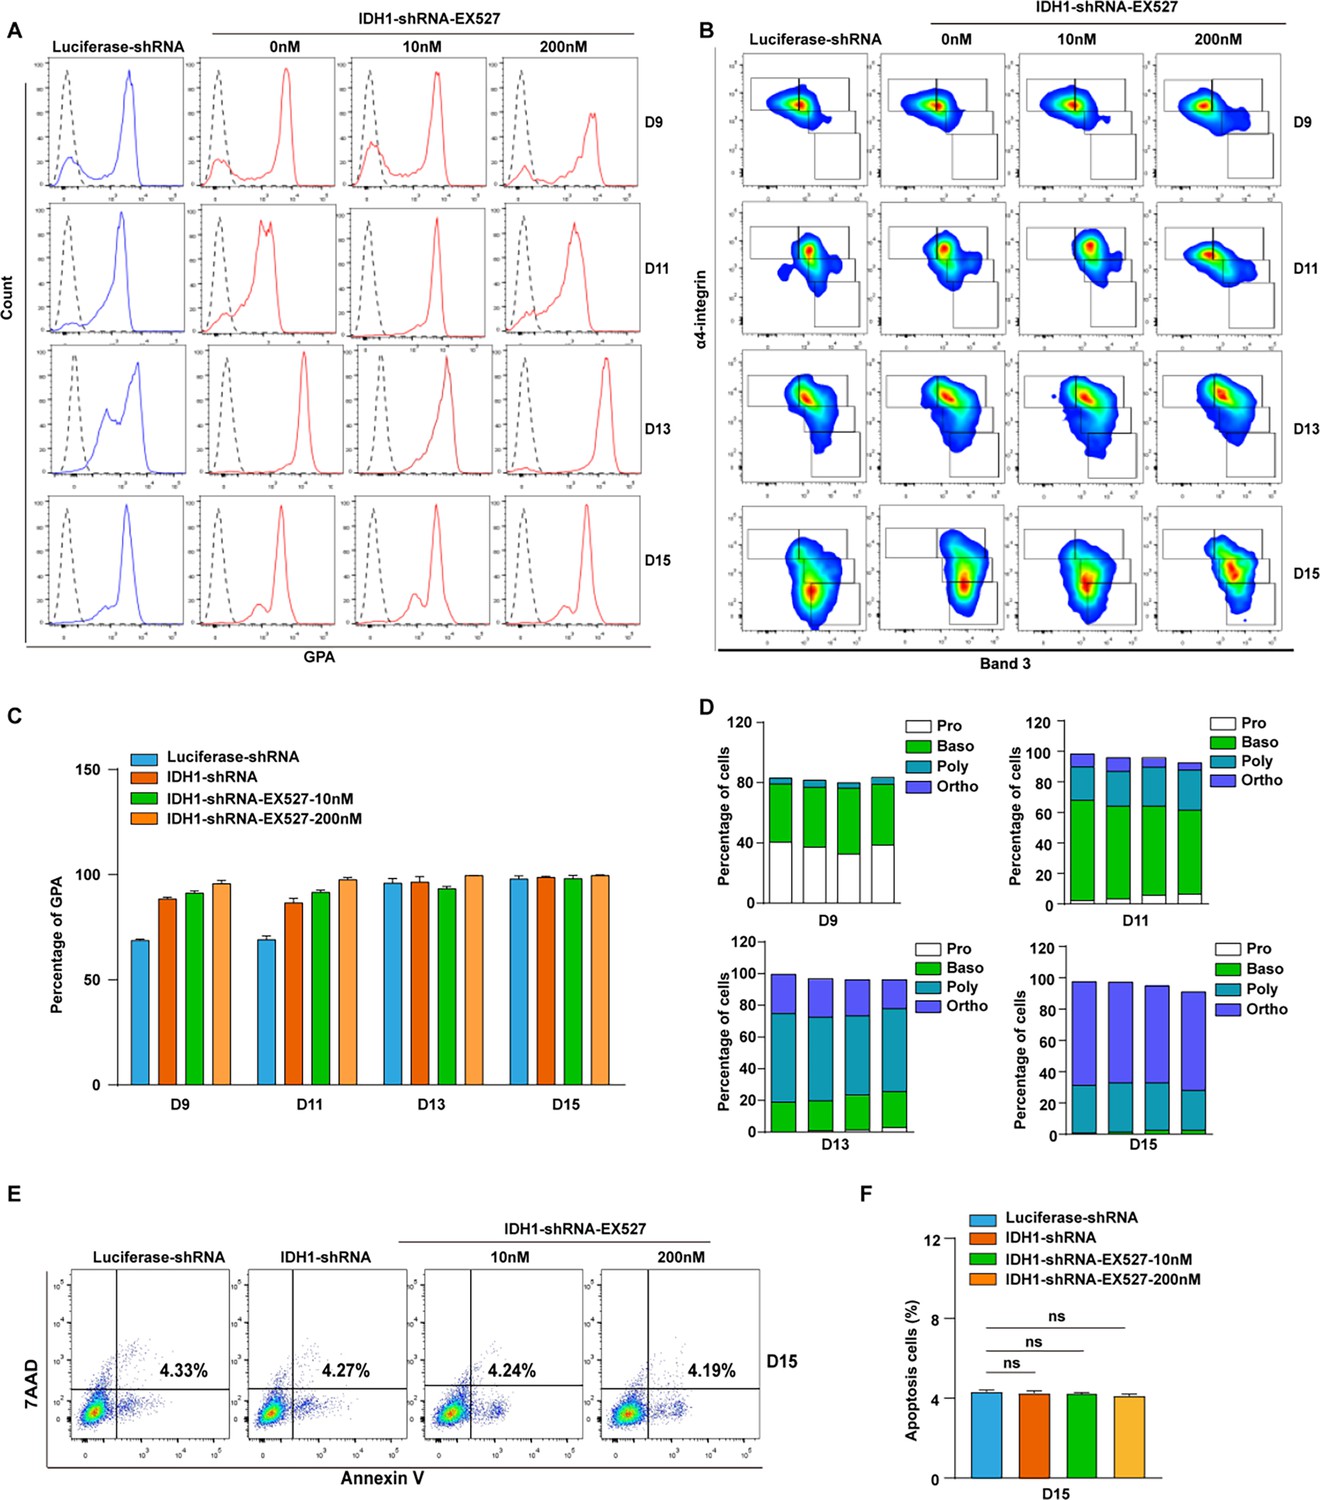
Treatment with SIRT inhibitor have no effect on cell differentiation and apoptosis of terminal erythroblasts.
(A) Representative flow cytometry profiles of GPA staining of Luciferase-shRNA, IDH1-shRNA, IDH1-shRNA-EX527 (10 nM, 200 nM) cells on days 9, 11, 13, and 15. (B) Quantitative analysis of the percentage of GPA-positive cells from three independent biological experiments. (C) Representative flow cytometry profiles of double-stained with band 3 and α4-integrin on days 9, 11, 13, and 15. (D) Quantitative analysis of the percentage of each stage cells from three independent biological experiments. (E) Representative flow cytometric profiles of apoptosis stained with 7AAD and Annexin V at day 15 of culture cells with Luciferase-shRNA, IDH1-shRNA, IDH1-shRNA-EX527 (10 nM, 200 nM) cells. (F) Quantitative analysis of apoptosis cells from three independent experiments. Statistical analysis is from three independent biological experiments, and the bar plot represents mean ± SD of triplicate samples. Not significant (ns), *p<0.05, **p<0.01, ***p<0.001.
Author response image 1
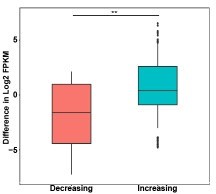
Box plots of gene expression differences of differential ATAC peaks located in promoter for the signal increasing and decreasing groups.
Author response image 2
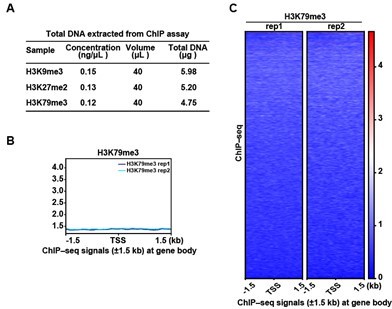
ChIP-seq analysis show that there was no marked peak signal of H3K79me3 on D15.
(A) Quality control of ChIP assay for H3K9me3, H3K27me2, and H3K79me3. (B) Representative peaks chart image showed normalized ChIP signal of H3K79me3 at gene body regions. (C) Heatmaps displayed normalized ChIP signal of H3K79me3 at gene body regions. The window represents ±1.5 kb regions from the gene body. TES, transcriptional end site; TSS, transcriptional start site.
Author response image 3
ChIP-seq analysis show that the peak signal of H3K79me3,H3K27me2 and H3K9me3.
(A) Heatmaps displayed normalized ChIP signal of H3K9me3, H3K27me2, and H3K79me3 at gene body regions. The window represents ±5 kb regions from the gene body. TES, transcriptional end site; TSS, transcriptional start site. (B) Representative peaks chart image showed normalized ChIP signal of H3K9me3, H3K27me2, and H3K79me3 at gene body regions.
Tables
Author response table 1
The composition of erythroblast during terminal stage erythropoiesis.
| Day | Pro-E | Baso-E | Poly-E | Ortho-E |
|---|---|---|---|---|
| 7 | 50% | 50% | \ | \ |
| 9 | 10% | 80% | 10% | \ |
| 11 | \ | 65% | 20% | 15% |
| 13 | \ | 20% | 30% | 50% |
| 15 | \ | 10% | 20% | 70% |
Additional files
-
Supplementary file 1
Information for human research participants and primer sequence.
- https://cdn.elifesciences.org/articles/100406/elife-100406-supp1-v2.docx
-
MDAR checklist
- https://cdn.elifesciences.org/articles/100406/elife-100406-mdarchecklist1-v2.docx
Download links
A two-part list of links to download the article, or parts of the article, in various formats.
Downloads (link to download the article as PDF)
Open citations (links to open the citations from this article in various online reference manager services)
Cite this article (links to download the citations from this article in formats compatible with various reference manager tools)
IDH1 regulates human erythropoiesis by eliciting chromatin state reprogramming
eLife 13:RP100406.
https://doi.org/10.7554/eLife.100406.3


