Position-dependent plasticity of distinct progenitor types in the primitive streak
- University of Edinburgh, United Kingdom
Figures
Figure 1
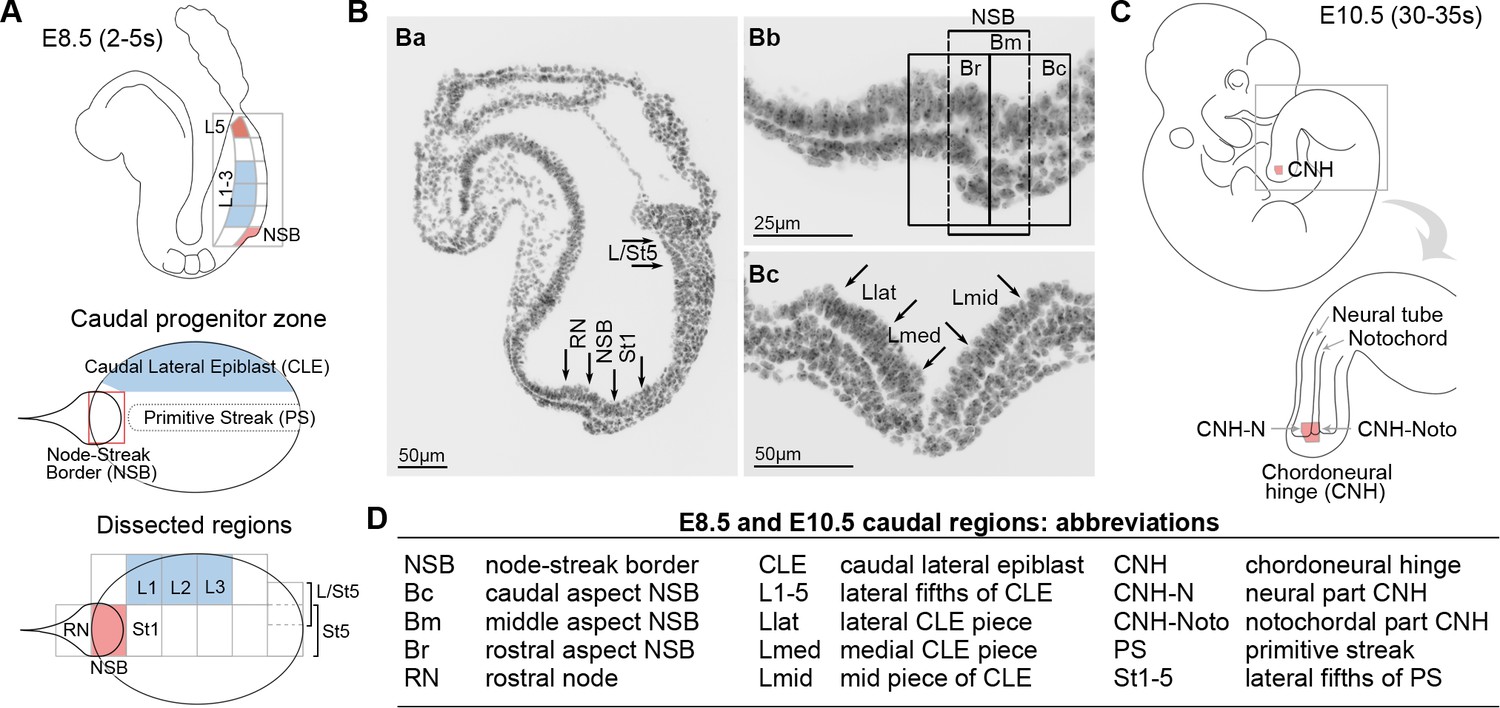
Location of neuromesodermal and lateral/ventral mesoderm progenitors.
(A) Diagrams of the E8.5 (2–5 s) embryo showing the location of neuromesodermal and lateral/ventral-fated progenitors and the terminology used in this study. NSB, node-streak border; CLE, caudal lateral epiblast; RN, rostral node; St1, rostral 1/5 of the streak; St5, caudal 1/5 of the streak; L1-5, lateral fifths of the lateral epiblast, with L1 corresponding to most rostral adjacent to St1, and L5 adjacent to St5. (B) DAPI-stained sections through the E8.5 (2–5 s) embryo. (Ba) Transverse section illustrates dissected midline regions. (Bb) Magnified view of the NSB region shows the rostral, mid and caudal border (termed Br, Bm and Bc). (Bc) Transverse section through the mid primitive streak shows the position of Lmid, Llat and Lmed (mid, lateral and medial CLE, respectively). (C) At mid-gestation, NMPs are located in the chordoneural hinge (CNH). The CNH is composed of two parts: the dorsal (neural) part (termed CNH-N) and the ventral (notochordal) part (CNH-Noto). (D) Abbreviations of embryonic regions used in this manuscript.
Figure 2

The potency of NM-fated regions is restricted to neural and mesodermal lineages.
Grafts of primitive streak and tail bud regions to the kidney capsule. (A) Masson’s trichrome-stained tumour sections derived from the indicated embryonic tissue regions. (B) Percentage of tumours that contain any of the scored tissues. (C) Average tumour area per stage. E7.5 cells give rise to larger tumours compared to tumours, derived from E8.5 or E10.5 grafts (*, p<0.01). a, adipose; b, bone; c, cartilage; ec, embryonal carcinoma cells; kw, keratin whorl; k, adult kidney; n, neural; m, skeletal muscle.
Figure 3 with 1 supplement
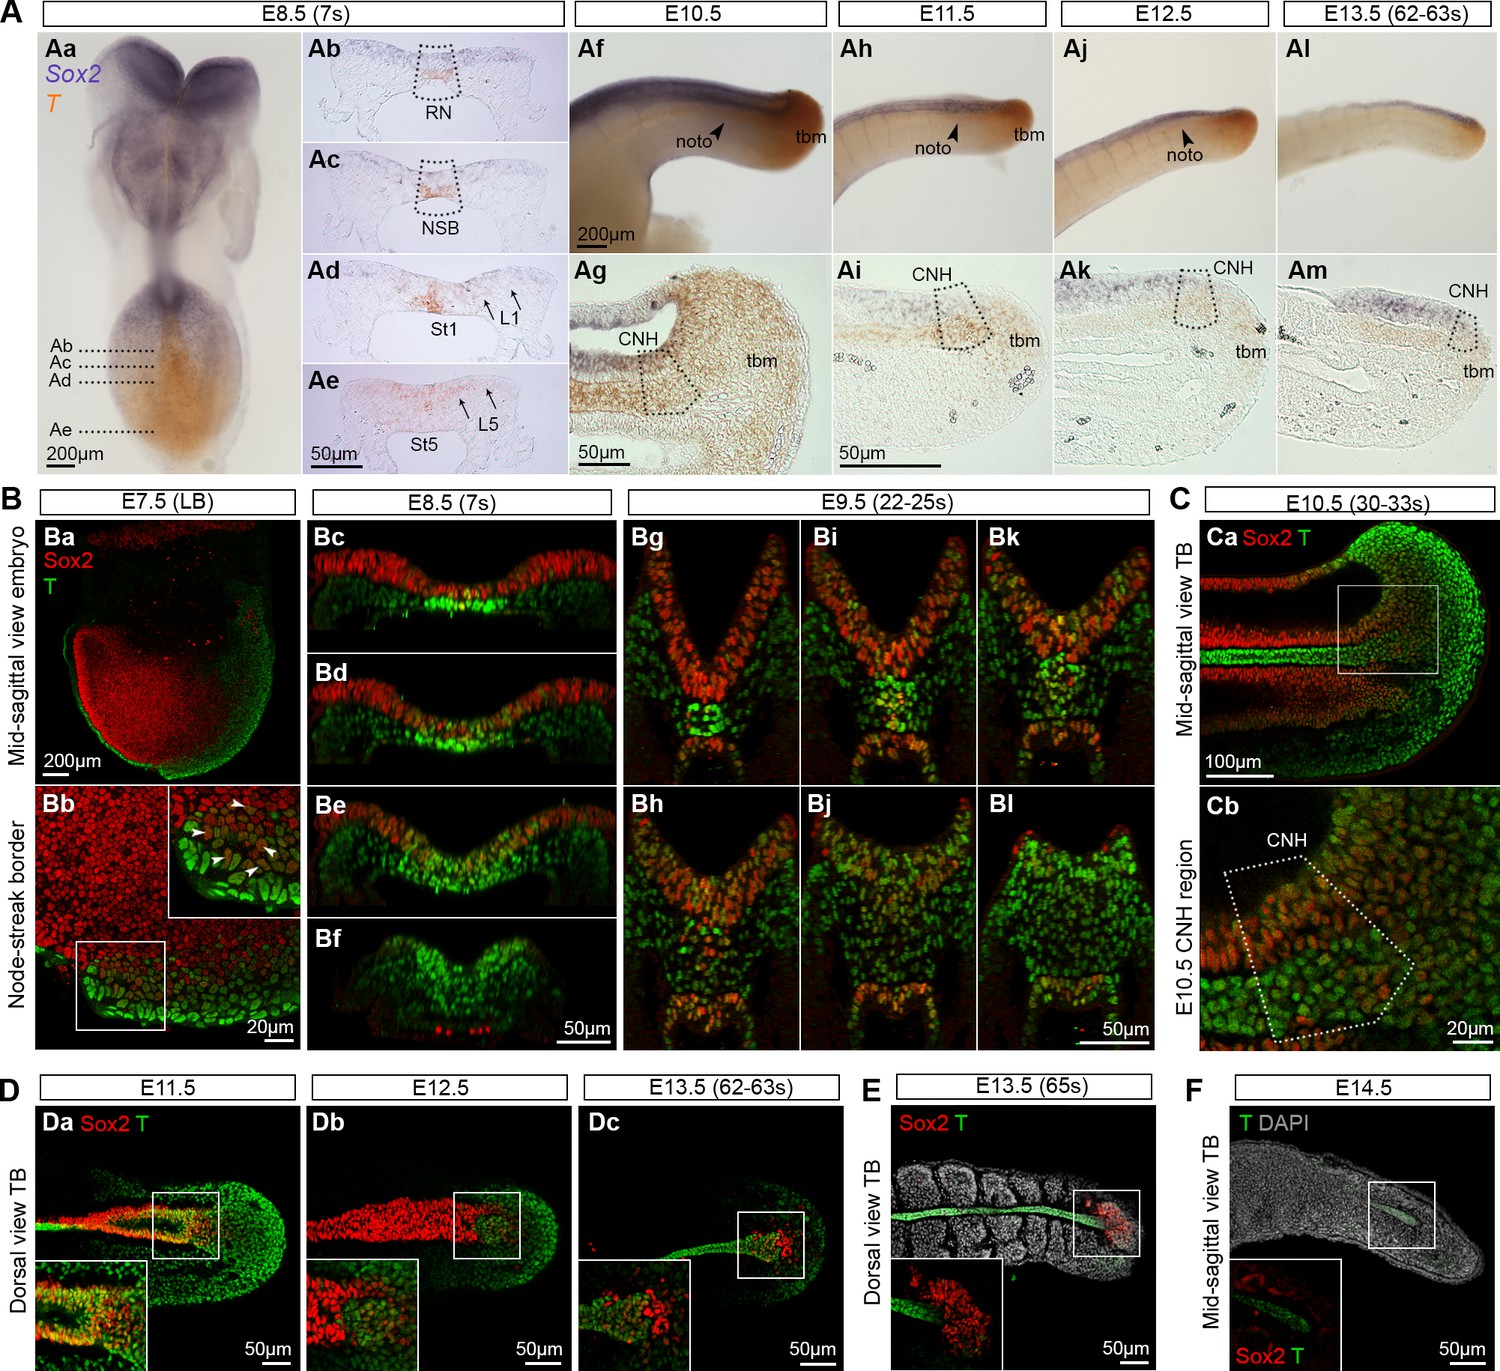
Sox2+T+cells coincide with NMP regions.
(A) In situ hybridisation for Sox2 and T. Abbreviations are the same as in Figure 1D. Noto, notochord; tbm, tail bud mesoderm. (B–F) Confocal sections of wholemount, immunostained embryos; DAPI-counterstain in grey. (Ba) Parasagittal section through a late bud (LB) stage embryo. (Bb) NSB magnified from Ba (arrowheads, Sox2+T+ cells). (Bc–l) Transverse sections through the caudal progenitor area at E8.5 (Bc–f) and E9.5 (Bg–l) show double positive cells in the NSB and CLE. (Ca–b) Sagittal sections through the E10.5 tail bud. (Da–c) Sox2+T+ cells are detected in the E11.5 tail bud, but become sparser in the E12.5 and E13.5 (up to 63s) tail bud. (E) Overlapping Sox2 and T expression has all but disappeared in the E13.5 (65s) tail bud in which somitogenesis is complete. (F) No Sox2+T+ cells were detected in the E14.5 tail tip. Inset, shows the overexposed red field (Sox2).
Figure 3—figure supplement 1
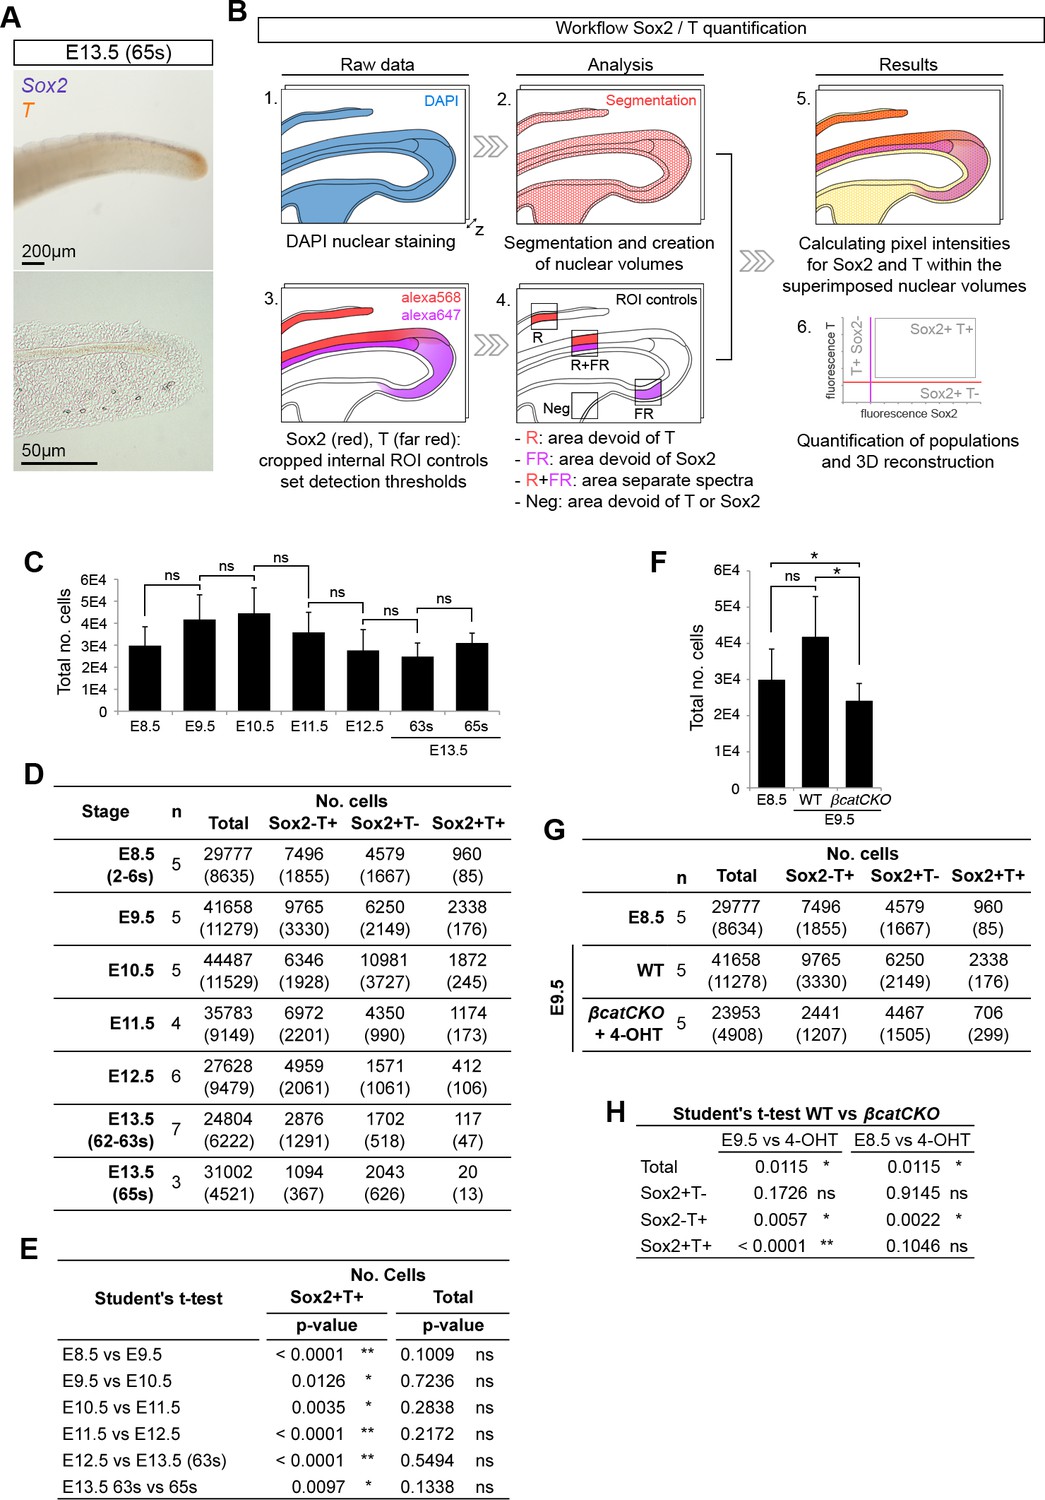
Quantifying Sox2+T+cells during axis elongation.
(A) Double in situ hybridisation for Sox2 and T at the end of axis elongation (E13.5, 65s). (B) Workflow for Sox2/T quantification and 3D reconstruction. (C and F) Total cells analysed per embryonic stage (C) or in 4-OHT-treated βcatCKO embryos (F). Data is shown as the mean ± s.d. (D and G) Quantification of Sox2/T populations per embryonic stage (D) or in 4-OHT-treated βcatCKO embryos (G). Data is shown as the mean (s.d.) with n, the number of embryos analysed. (E and H) Statistical analysis. (E) A standard, unpaired Student’s t-test was used to test the significance in Sox2+T+ cell number and the total cells analysed between consecutive stages. (H) P-values obtained through an unpaired Student's t-test (with Welch’s correction) comparing Sox2/T populations in E9.5 and E8.5 wildtype to E9.5 4-OHT-treated βcatCKO embryos (*, p-value<0.05; **, p-value<0.0001; ns, not significantly different).
Figure 4
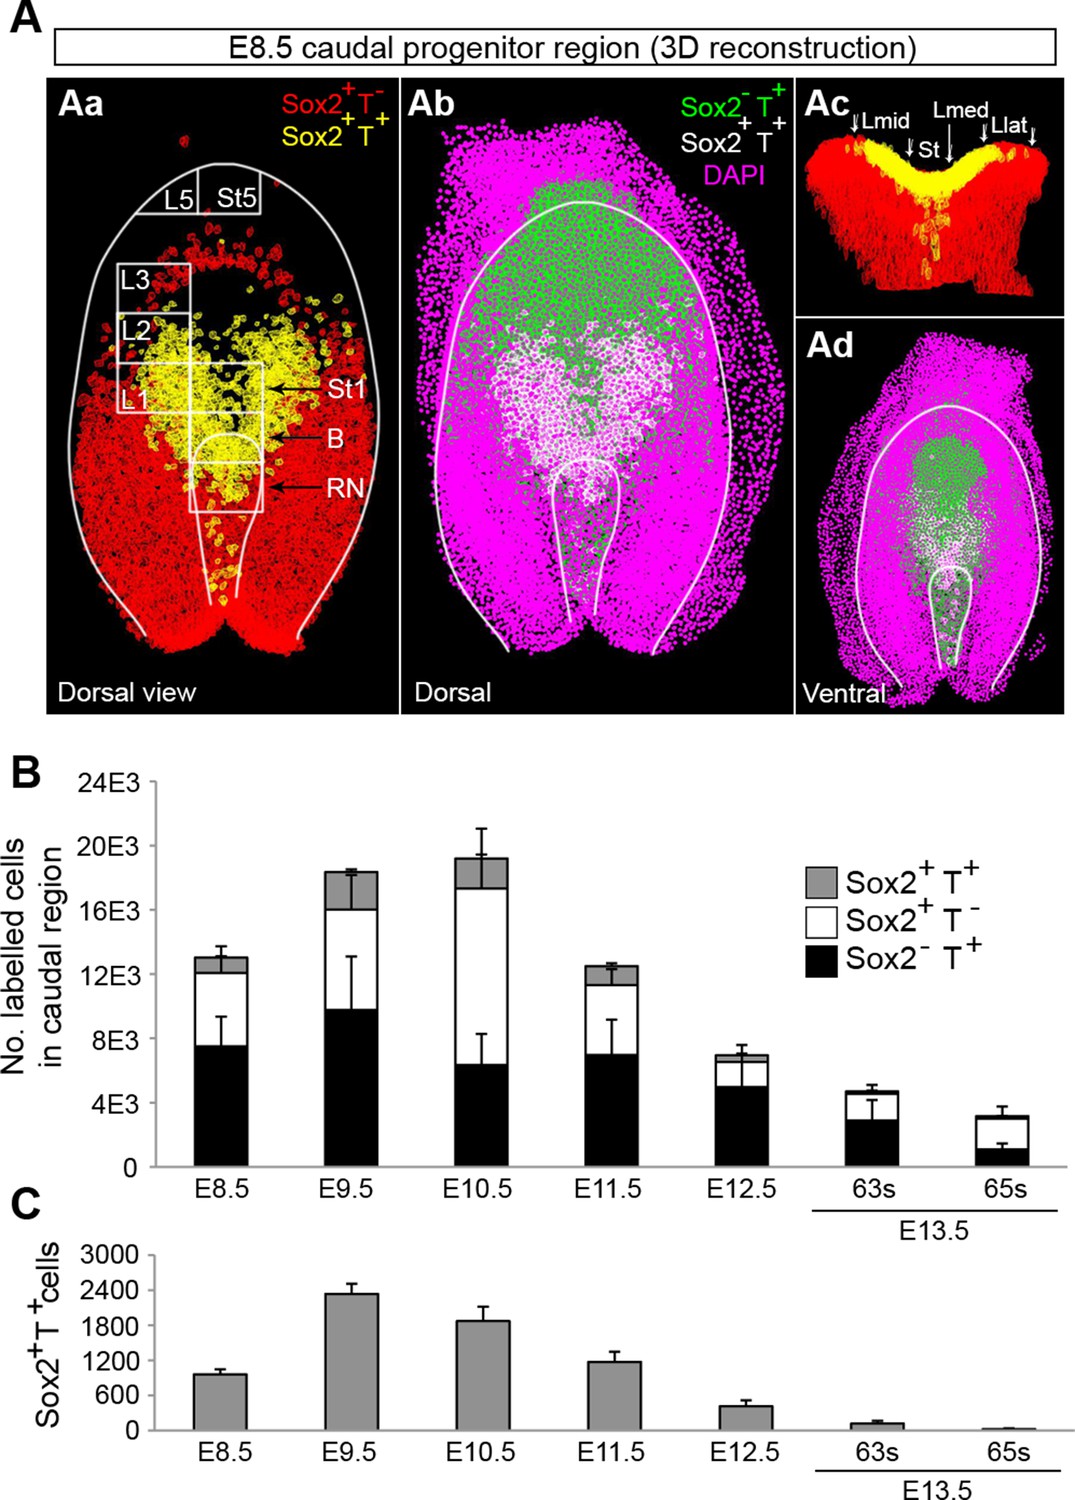
Sox2+T+ NMPs peak at mid trunk formation.
(A) 3D reconstruction of the E8.5 caudal region. (Aa–b) Dorsal view. (Ac) Frontal view along the PS and CLE. Colours show different thresholded Sox2/T populations. (B–C) Quantification of different Sox2/T populations in the caudal embryo shows a peak in overall cell labelling at E10.5 (B). Sox2+T+ cell numbers are highest at E9.5 (C). Data in graphs is shown as the mean ± s.d. See also Figure 3—figure supplement 1B–E and Video 1.
Figure 5
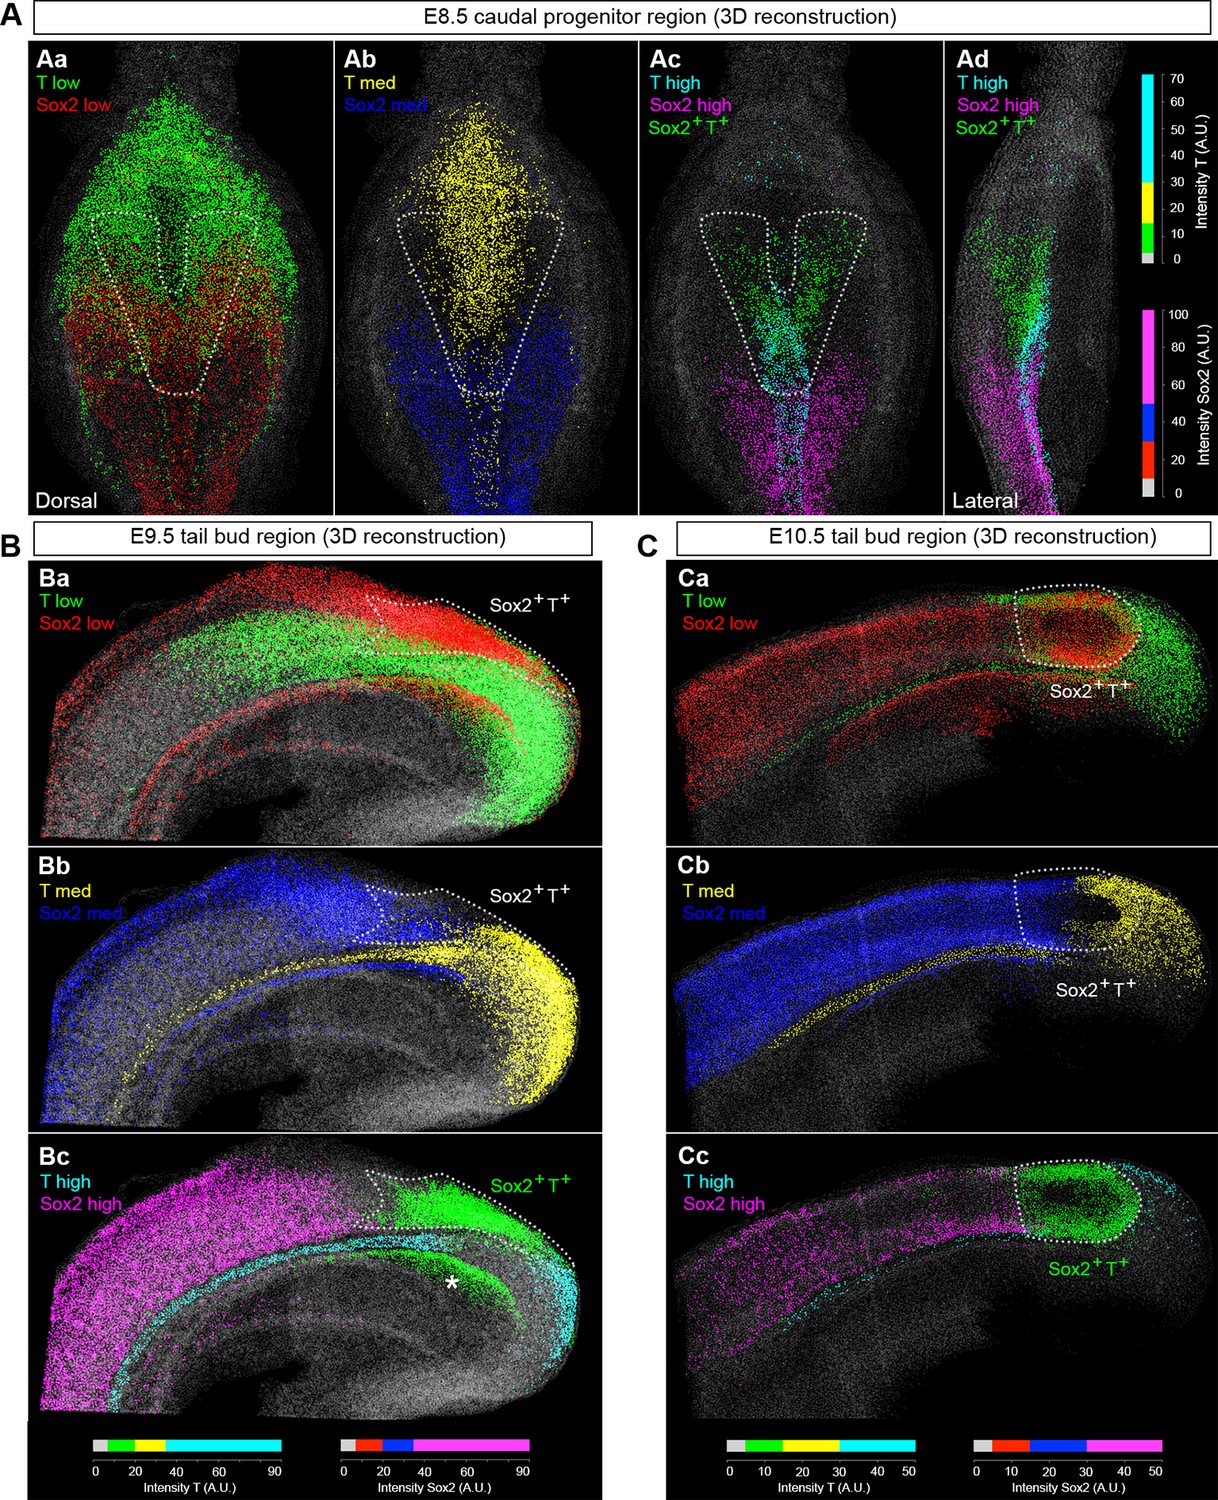
NMPs express low levels of T and Sox2.
(A–C) 3D analysis showing the relative levels of Sox2 and T protein in the E8.5–10.5 caudal region. Sox2+T+ cells express low-to-medium levels of both transcription factors (green cells in Ac, Ad, Bc and Cc represent Sox2+T+ cells, indicated by the area within the white dotted line). Colours represent the intensity range shown as arbitrary units (AU). The lower threshold for positivity was calculated as before (see Figure 3—figure supplement 1B), with the maximum corresponding to the highest intensity recorded in the z-stack. Asterisk, Sox2+T+ cells found in the dorsocaudal part of the gut; grey, segmented nuclear volumes negative for either transcription factor.
Figure 6 with 4 supplements

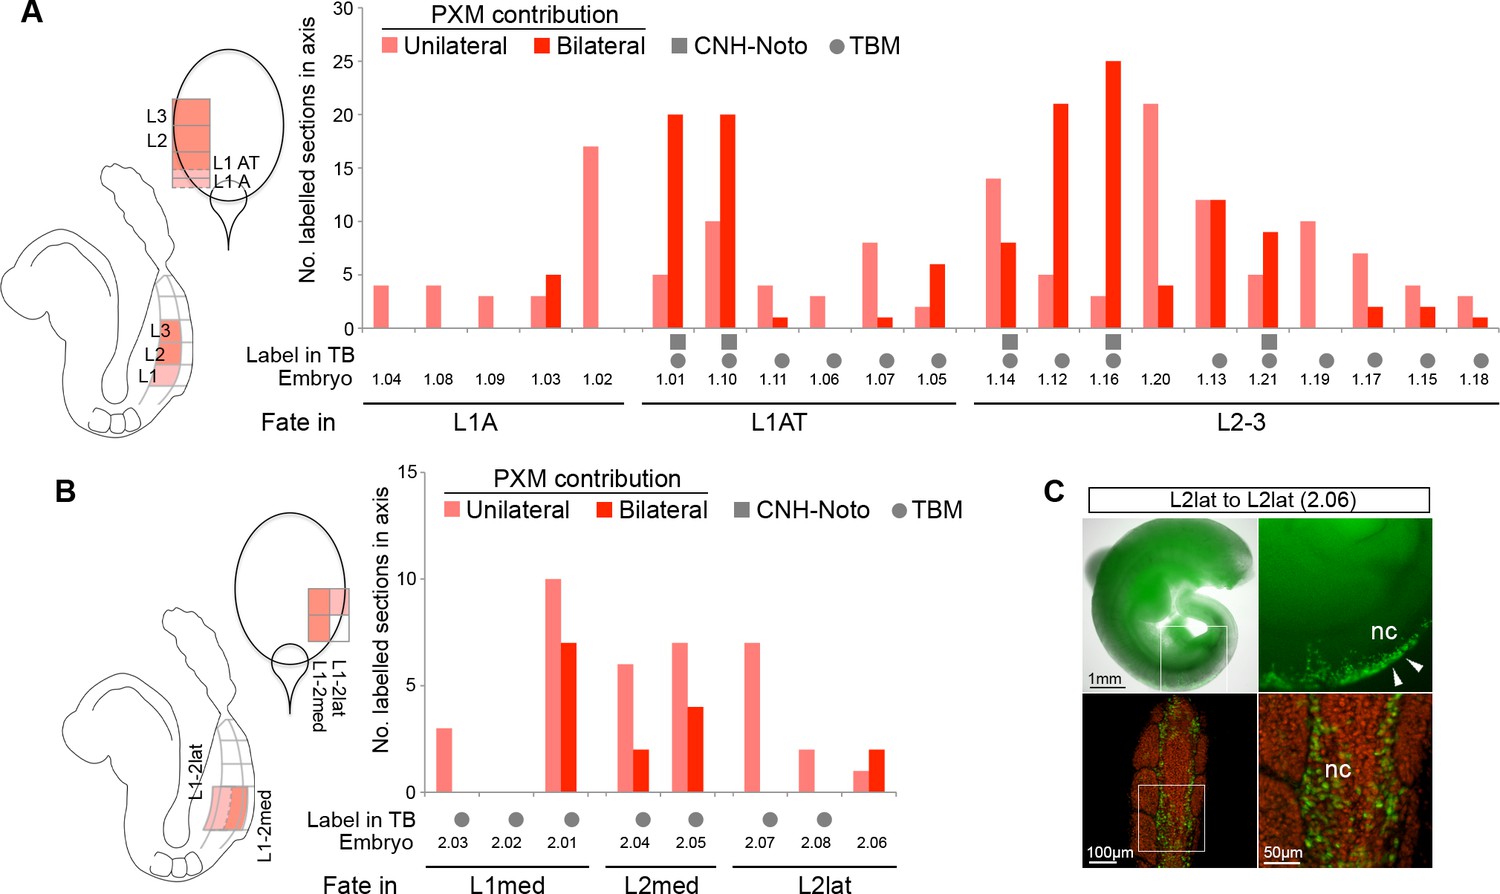
Fate in the caudal lateral epiblast.
(A) Representative examples of homotopic CLE grafts (numbers identify individual embryos in B–D). Cell fate in the rostral CLE in rostral-to-caudal (Aa–l) and medial-to-lateral direction (Am–t). Cell fate in the caudal-most lateral epiblast (Au–x). Arrows show the notochord; white boxes the CNH. lvm, lateral and ventral mesoderm; nt, neural tube; pxm, paraxial mesoderm; tbm, tail bud mesoderm. (B–D) Diagrams indicate the graft type performed, the shading within them, the predominant prospective fate of each region (pink, mesoderm; light blue, neuromesodermal; dark blue, neural; light brown, lateral/ventral mesoderm). Graphs display single grafted embryos and their contribution in the differentiated axis to the neurectoderm (N) and mesoderm (PXM) or both. Numbers below the bars indicate the graft series followed by an individual embryo identifier (e.g. embryo 1.01). Below the x-axis, graft cell contribution in the TB (dorsal part of the CNH, ventral (notochordal) part of CNH and TBM), is represented by a black square, grey square or grey circle, respectively. (B) Fate in L1, L2 and L3. L1 grafts gave rise to two distinct contribution patterns, L1A (axis only) and L1AT (axis and tail bud). (C) Fate in either the medial or lateral half of L1 or L2. One graft (embryo 2.06) contributed to the neural crest (NC). (D) Grafts of L/St5 contributed entirely to the lateral/ventral mesoderm (LVM). Unilateral versus bilateral PXM contribution is shown in Figure 6—figure supplement 4.
-
Figure 6—source data 1
Presomitic mesoderm contamination in CLE grafts.
Additional information and analysis to show the majority of paraxial mesoderm in CLE grafts is derived from NMPs rather than contaminating PSM progenitors that were co-grafted.
- https://doi.org/10.7554/eLife.10042.011
Figure 6—figure supplement 1
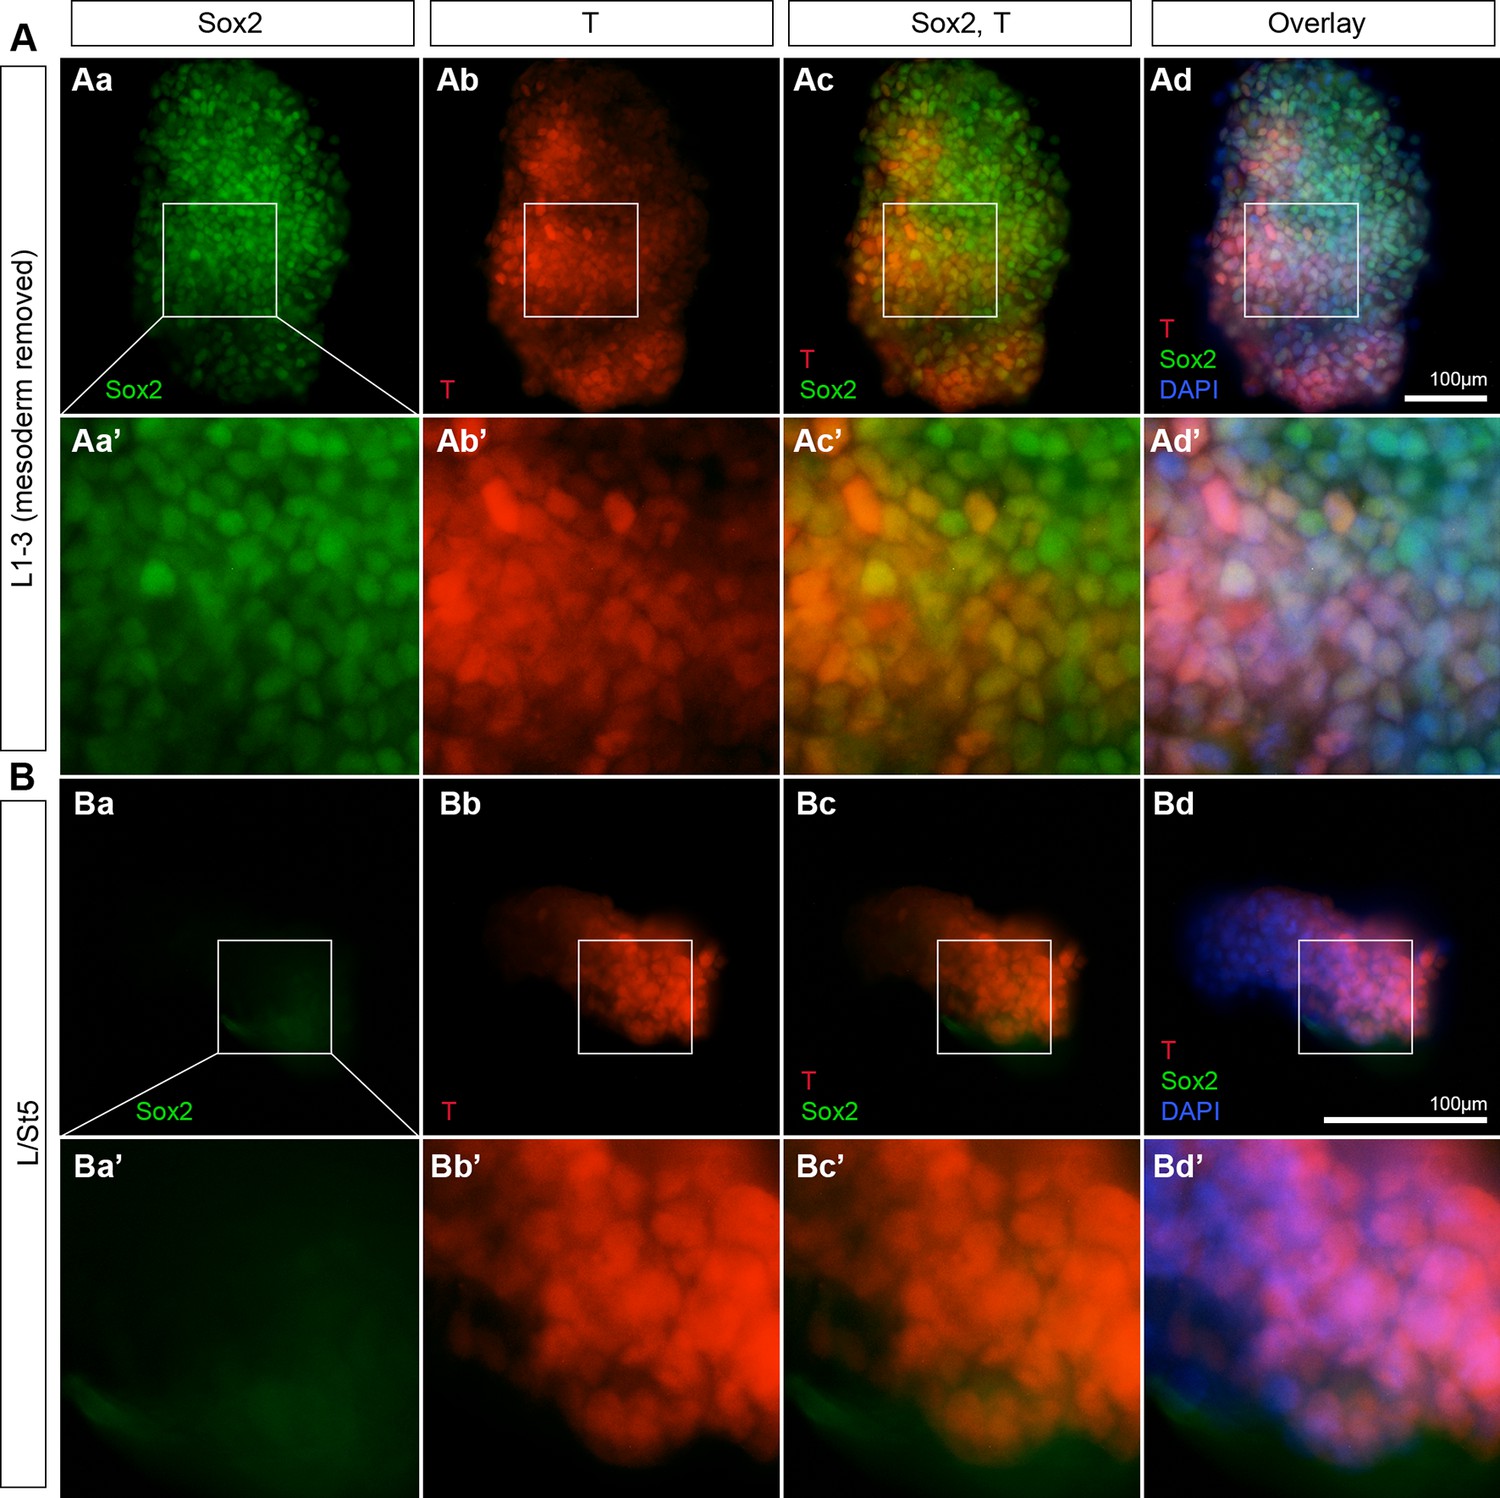
Rostral CLE tissue contains Sox2+T+ cells.
Graft donor tissue was examined for the presence of Sox2/T coexpressing cells. L1-3 and L/St5 pieces were dissected as described above. The underlying presomitic mesoderm was manually removed in the L1-3 grafts. (A) L1-3 donor tissue contains Sox2+T+ cells (n = 7/7). (B) L/St5 were devoid of coexpressing cells (n = 5/5). Blue, DAPI nuclear stain; green, Sox2; red, T.
Figure 6—figure supplement 2
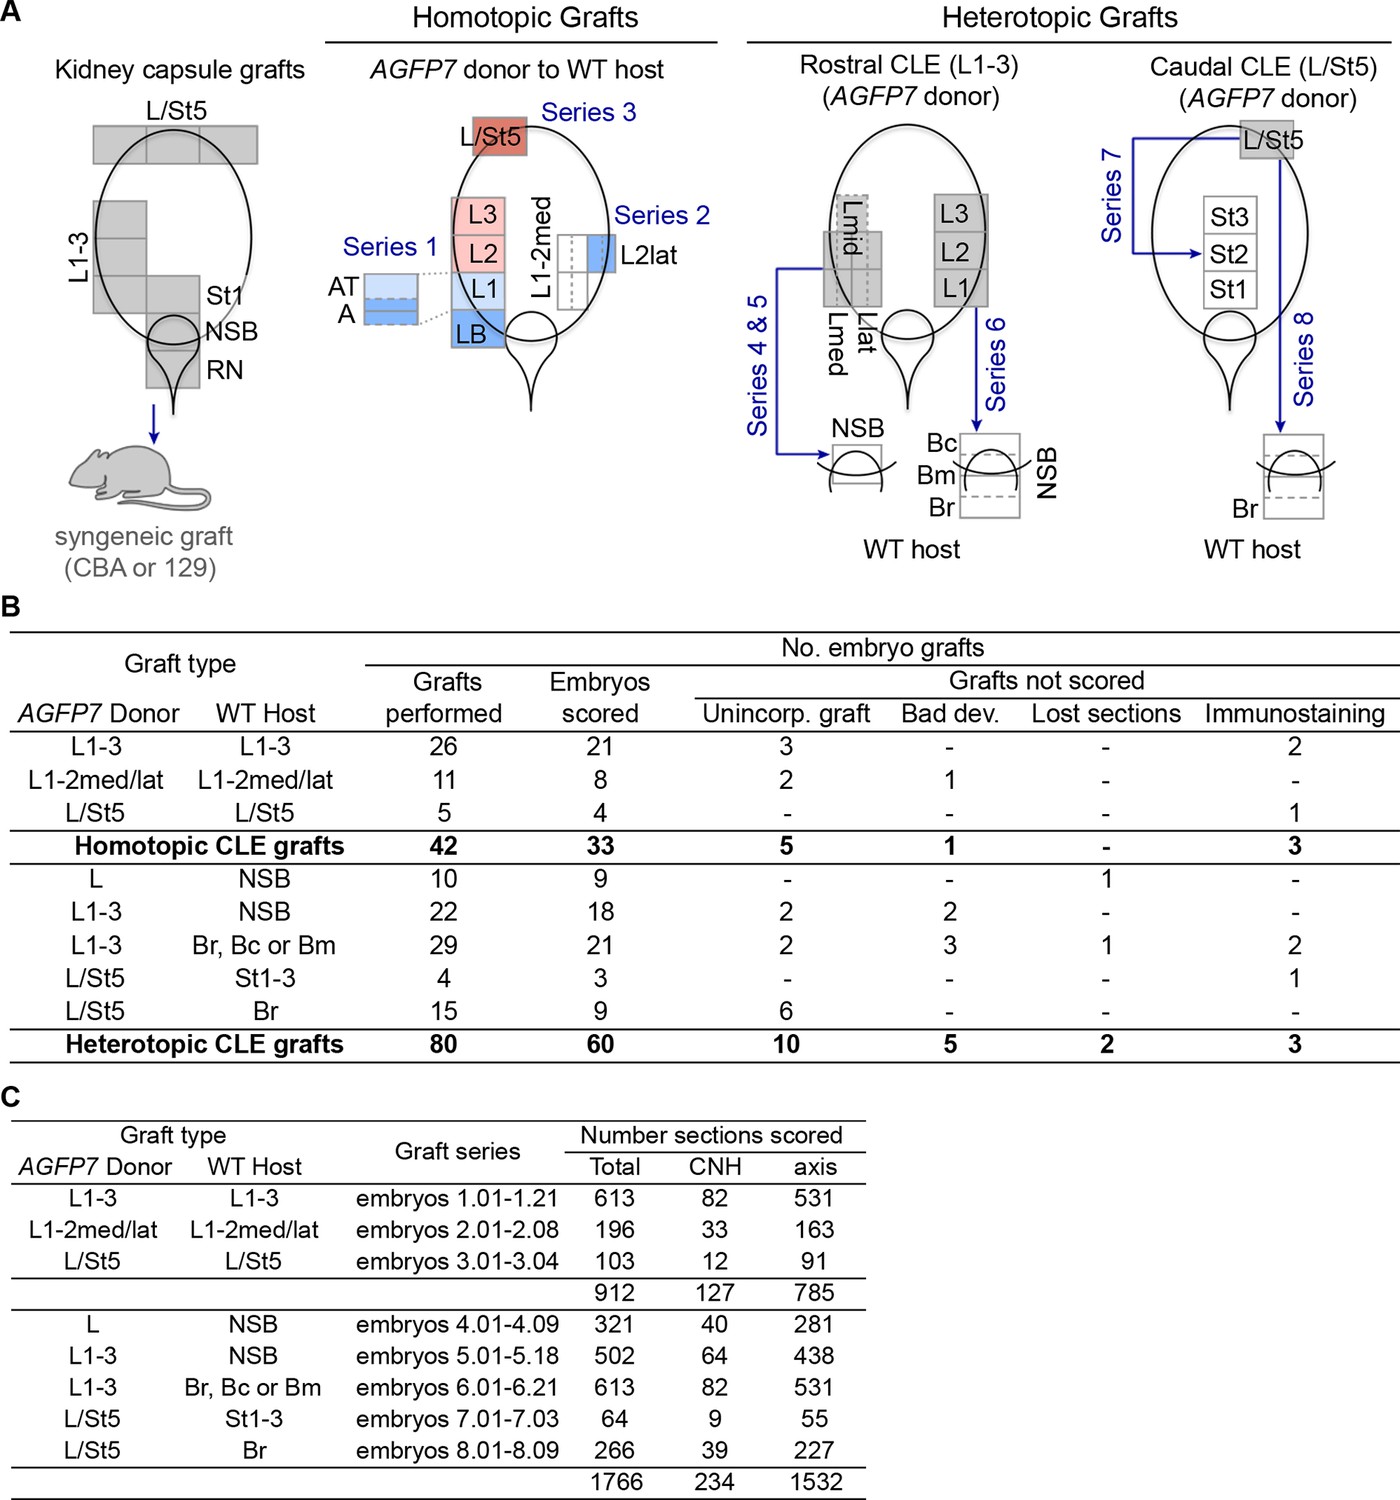
Embryo numbers and section count in different grafting experiments.
(A) Schematic diagram summarising the different grafting experiments conducted in this work and the embryos series they correspond to. Diagrams represent the primitive streak region at E8.5, with coloured regions the donor tissue. In homotopic grafts, the colour indicates the predominant fate in that region (pink, mesoderm; light blue, neuromesodermal; dark blue, neural; dark pink, lateral/ventral mesoderm). (B) Number of embryo grafts performed in this study, using AGFP7 donor cells. The number of embryos that was not scored (and reasons thereof) is also shown. (C) Number of sections scored for each graft series performed.
Figure 6—figure supplement 3
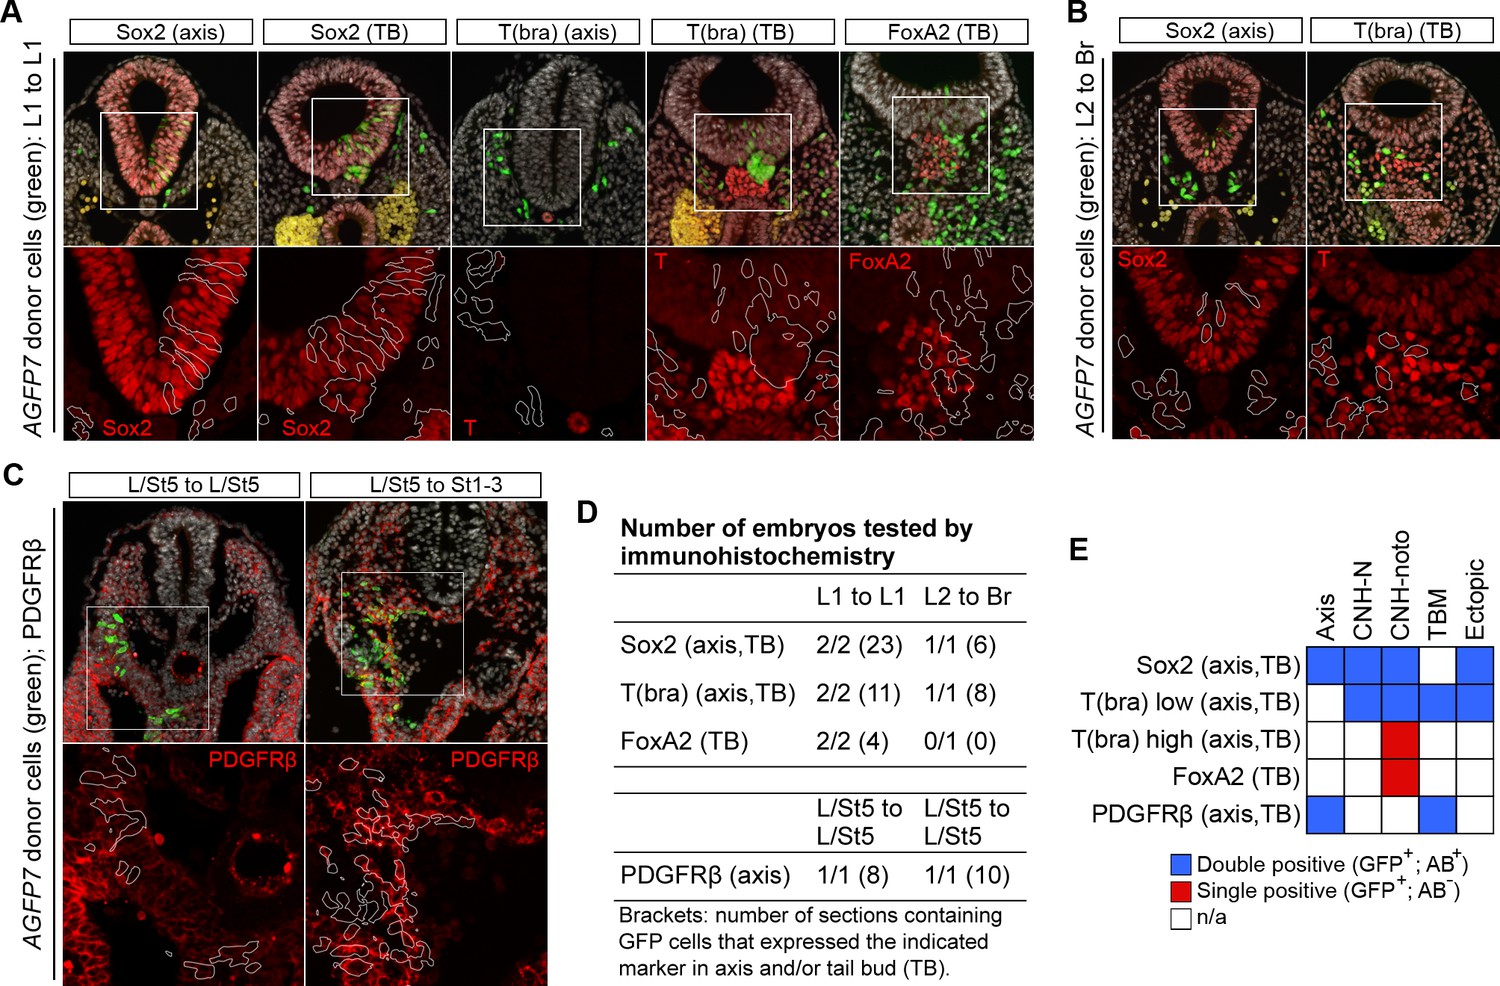
Homotopic and heterotopic grafts incorporate well into host embryos.
(A–C) Immunohistochemical confirmation of differentiation markers in different graft series. Upper row, DAPI-counterstained images (grey). Boxes, region magnified in lower row. Lower row, immunofluorescence channel. Position of grafted donor cells is outlined in white. (A) Sox2, T, and Foxa2 expression in axis and TB sections of L1 homotopic grafts. Note lack of notochord-specific Foxa2 expression in graft-derived cells. (B) Sox2 and T expression in axis and TB sections of L2-3 heterotopic grafts (to Br). (C) PDGFRβ expression in L/St5-derived cells, grafted either homo- or heterotopically to a wildtype host. (D) Table showing the number of embryos and sections stained for each marker. (E) Overview of marker expression in different regions of the axis. Note that none of the CLE-derived grafted cells expressed FoxA2 or high levels of T protein in the caudal notochord domain.
Figure 6—figure supplement 4
Fate of the CLE progenitors in the paraxial mesoderm.
(A-B) Scoring of GFP+ cell contribution to the paraxial mesoderm in CLE homotopic grafts (embryo series 1 and 2). No PXM contribution was observed in L/St5 homotopic grafts. Graph format is the same as in Figure 6. Pink bars show unilateral contribution; red bars bilateral contribution. (C) One grafted embryo (embryo 2.06) showed contribution to the neural crest (nc, white arrows).
Figure 7
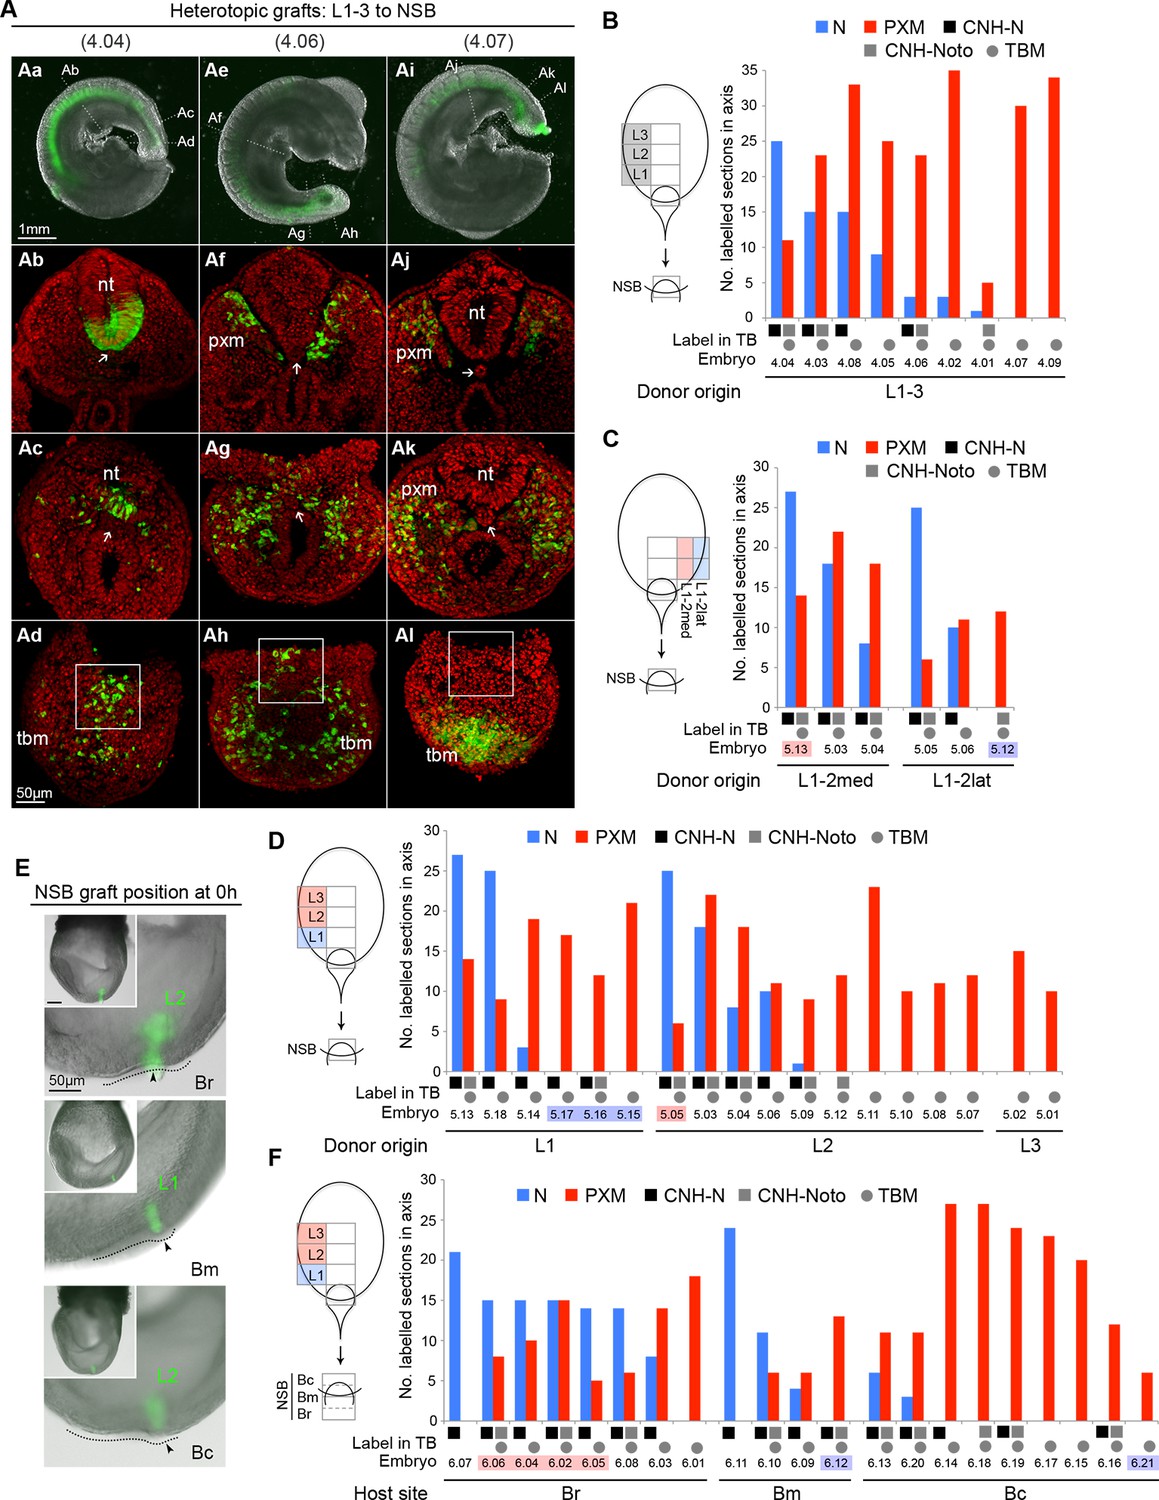
Plasticity of L1-3 cells on heterotopic grafting to the NSB.
(A) Representative examples of heterotopic CLE grafts (numbers identify individual embryos in B). Three different contribution patterns were observed: mainly neural (Aa-d), neuromesodermal (Ae–h) and mainly mesodermal (Ai–l). (B–D and F) Scoring of GFP+ cell contribution in CLE-to-NSB heterotopic grafts. Graph format is the same as in Figure 6. Highlighted numbers indicate embryos in which the graft fate has changed from that predicted by the fate map upon heterotopic grafting. (B) Grafts of L1, 2 or 3 to the NSB. (C) Grafts of medial or lateral halves of L1 or L2 to the NSB. Note that these embryos are also scored with respect to their rostrocaudal origin in D. (D) Grafts of L1, 2 or 3 to the NSB. Note that some of these embryos are also scored according to their mediolateral origin. For example embryo 5.13 received a graft of cells from medial L1, and showed high neural contribution and is therefore highlighted as ‘changed fate’ in C but not in D. (E) Graft position at the start of culture (to Br, Bm or Bc). Donor origin is shown in green. The crown (arrowhead) of the node (dotted line) was used as a landmark for placing GFP+ donor cells (green). (F) Grafts of L1, 2 or 3 to different aspects of the NSB shows the fate of rostral CLE cells is dependent on the environmental cues of the host.
Figure 8
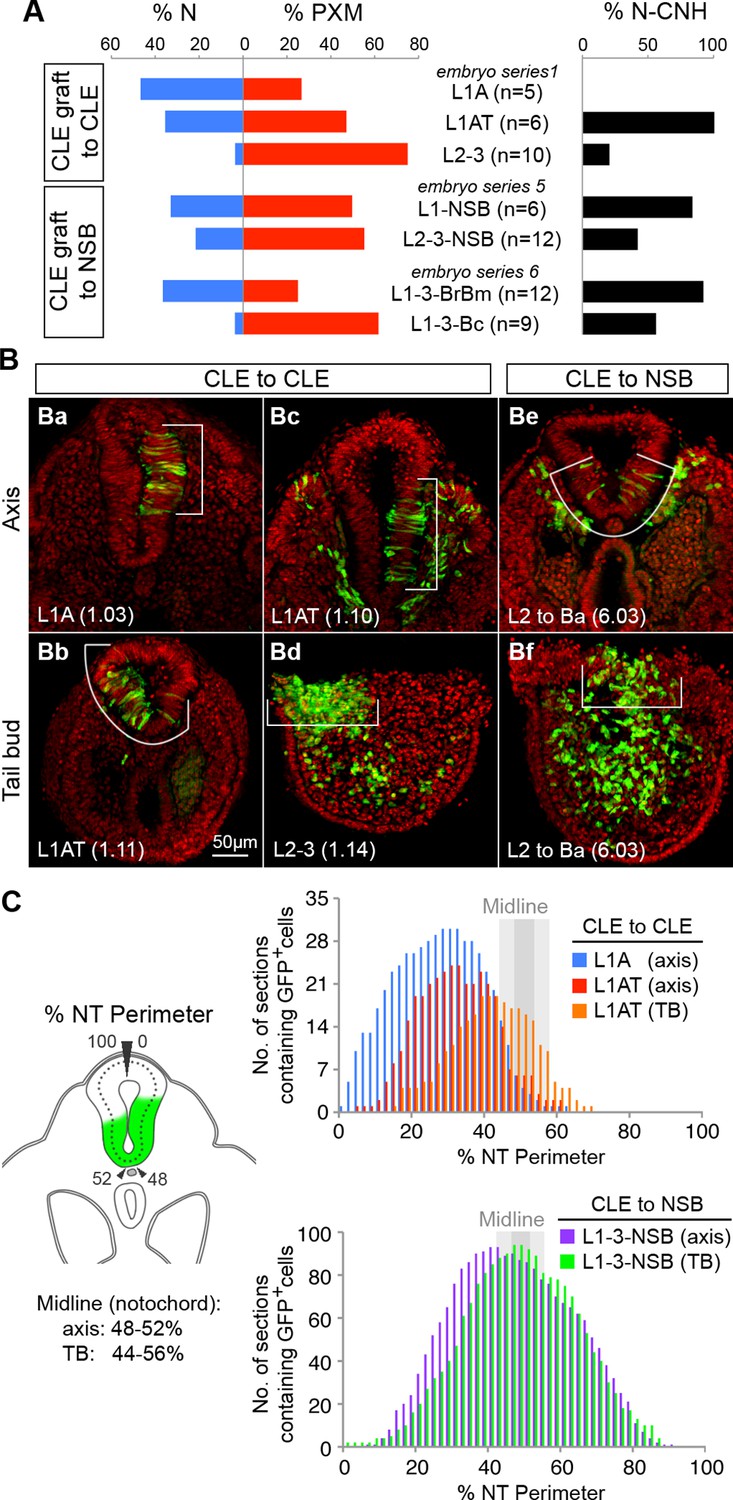
Dorsolateral bias of L1-3 cells is reset upon grafting to the midline.
(A) Quantitative analysis of L1-3 graft contribution. Left, the percentage of neural (N) vs paraxial mesoderm (PXM) contribution in all scorable sections. Right, the percentage of embryos with dorsal (neural) CNH contribution. Labels show the embryo series and the graft performed (with n, the number of embryos). (B) Representative examples of dorsolateral NT distribution of grafted cells to either one lateral side (CLE to CLE) or to the midline (CLE to NSB). White lines show the extent of NT contribution. (C) Left, diagram shows the method used to score mediolateral NT contribution of donor cells (green), expressed as a percentage of the NT perimeter. Right, graphs display the number of sections containing GFP+ cells at defined positions along the NT. Colours represent graft type (blue, L1A homotopic grafts; red and orange, L1AT homotopic grafts; purple and green, L1-3 to NSB heterotopic grafts). Sections in the TB are represented separately from those anterior to the TB (termed ‘axis’). The average notochord position at the ventral midline is shown by dark grey (axis) and light grey (TB) shading.
Figure 9 with 3 supplements
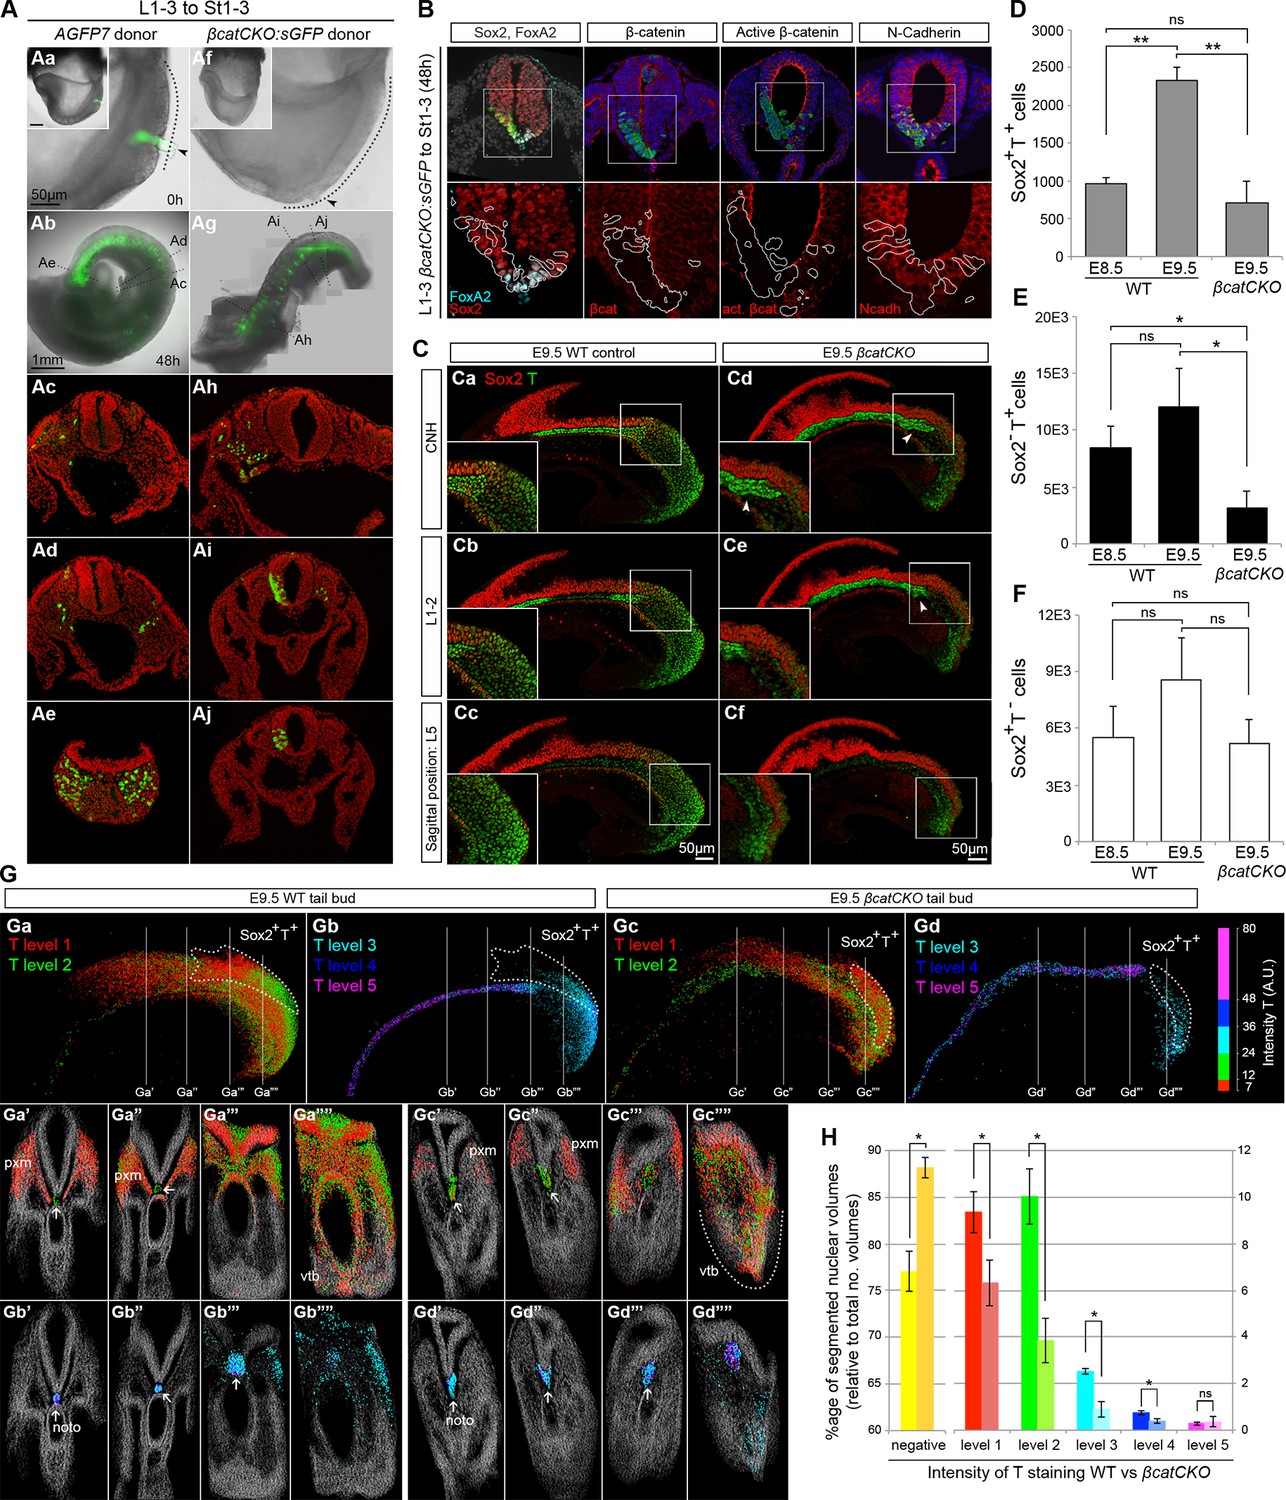
Canonical Wnt signalling mediates neuromesodermal fate decisions.
(A) Representative examples of L1-3 to St1-3 grafts. (Aa and Af) Cells immediately after grafting. βcatCKO:sGFP grafted embryos were grown for 8 hr in the presence of 5µM 4-OHT after which the medium was replaced. Note grafted cells are initially GFP- and turned green upon CreERT2 activation and LoxP recombination. Dotted line, primitive streak. Arrowhead, grafted cell position. (Ab and Ag) Whole embryo after 48 hr ex vivo culture. (Ac–e and Ah–i) Rostral to caudal transverse sections. (Aa–e) L1-3 AGFP7 to St1-3 control grafts contribute only to the paraxial mesoderm, although one embryo showed minor contribution to the CNH and resembled some of the L1-3 to Bc grafts (compare Figure 9—figure supplement 2F and Figure 7F). (Ai–Aj) L1-3 βcatCKO:sGFP to St1-3 grafts shows NMPs switch from mesoderm to neural fate in the absence of β-catenin. (B) Marker and β-catenin expression in graft-derived βcatCKO:sGFP cells. Sections correspond to a similar rostral level as shown in Aj. Upper row, DAPI-counterstained images (grey/blue). Squares, region magnified in lower row. Lower row, immunofluorescence channel with donor cell position outlined in white. See Figure 9—figure supplement 2 for an experimental overview, the number of embryo grafts performed and additional immunostaining results. (C) Immunofluorescence of T (green) and Sox2 (red) in E9.5 WT (n = 5, Ca-c) and βcatCKO embryos (n = 5, Cd-f) after 24 hr in vitro growth in the presence of 5µM 4-OHT. Arrowheads, notochord in treated embryos. (D–F) Quantitation of labelled populations in βcatCKO and WT embryos (*, p-value<0.05; **, p-value<0.0001; ns, not significant). See also Figure 3—figure supplement 1 and Video 2. (G) 3D analysis showing the relative levels of T protein in E9.5 WT (Ga and Gb) and βcatCKO tail buds (Gc and Gd) shown as arbitrary units (AU) of staining intensity). Arrows, notochord (noto) position; grey, T- cells; pxm, paraxial mesoderm; white dotted line, NMP area. (H) Quantification of T levels in E9.5 WT (n = 2) and βcatCKO tail buds (n = 4). Left bars, WT; right bars, βcatCKO embryos. (*, p-value<0.05; ns, not significant). See also Figure 9—figure supplement 3C.
Figure 9—figure supplement 1
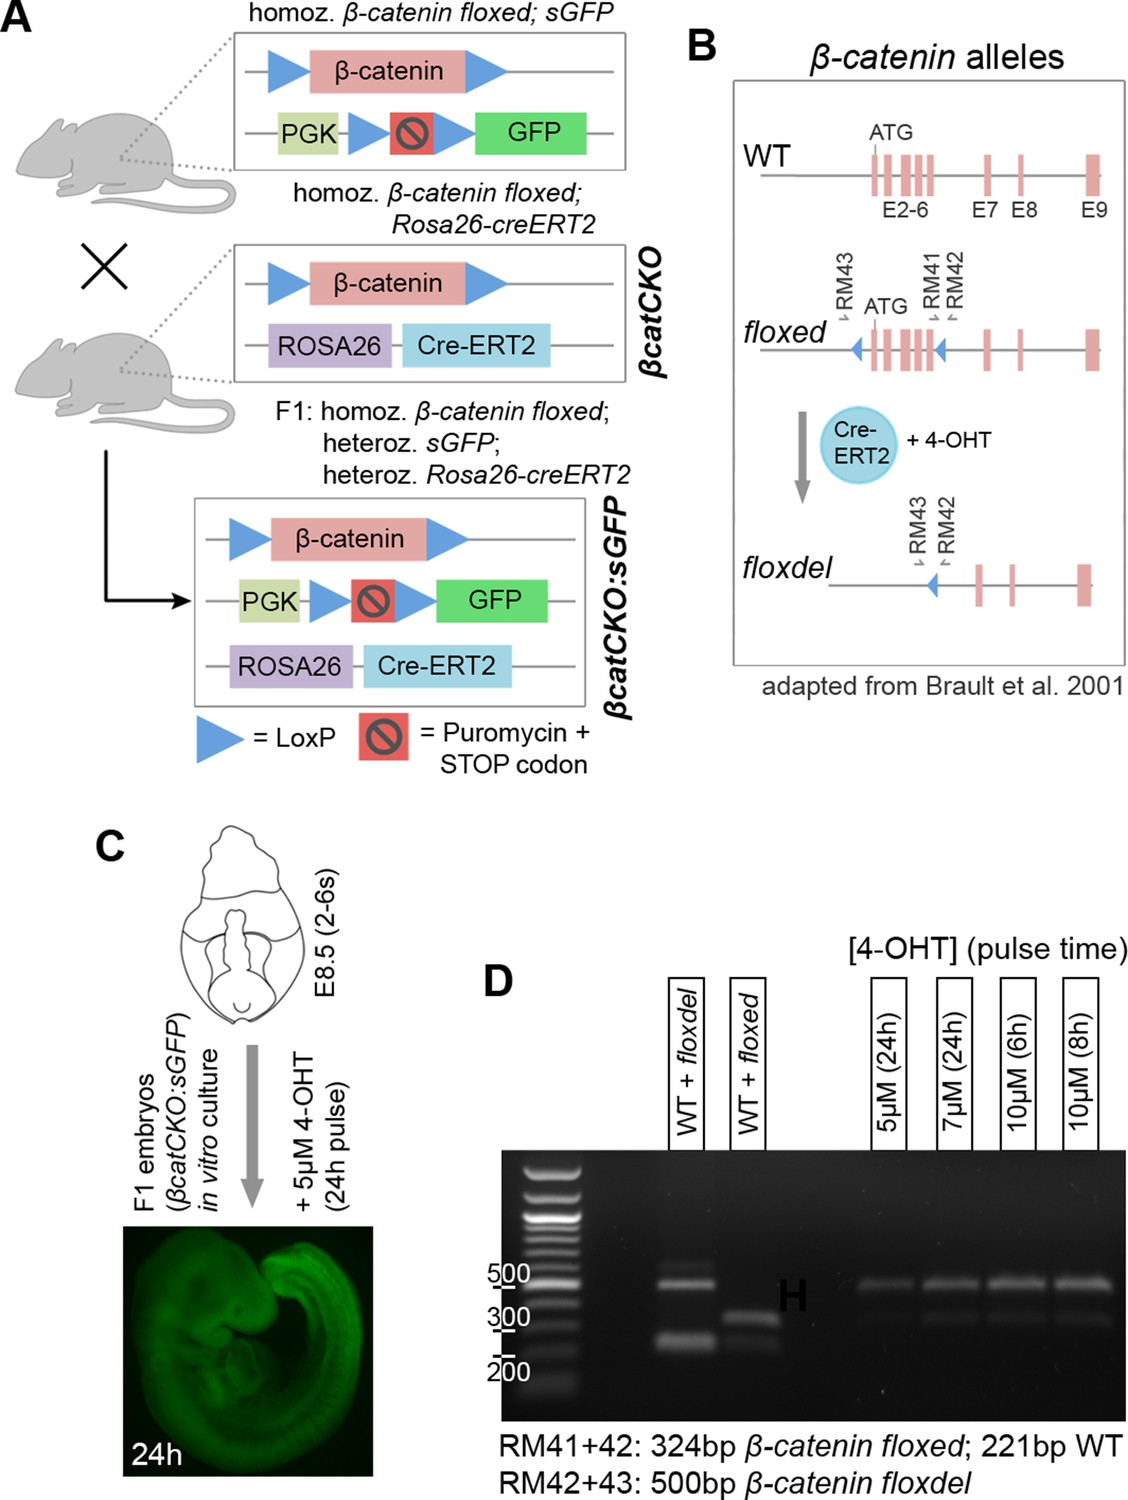
Obtaining conditional β-catenin knock out embryos.
(A) Schematic diagram of mouse cross to obtain βcatCKO:sGFP embryos. Mice, homozygous for both a silent GFP (Gilchrist et al., 2003) and floxed β-catenin alleles (Brault et al., 2001) were crossed with mice homozygous for both the ROSA26-CreERT2 and floxed β-catenin alleles (referred to as βcatCKO). F1 offspring are homozygous for the floxed β-catenin and heterozygous for the sGFP and ROSA26-CreERT2 alleles (referred to as βcatCKO:sGFP). (B) Different β-catenin alleles and primers used for genotype screening and 4-OHT pulse dose/time optimisation (primers as in Brault et al. (2001)). (C-D) 4-OHT dose and pulse time optimisation for in vitro embryo culture. (C) GFP fluorescence in F1 embryo after 24 hr 4-OHT treatment (5 µM), cultured from E8.5 (2–6 s). (D) Left part of gel, PCR identification of wild-type (WT), floxed and floxdel alleles from gDNA. Right part, PCR from gDNA of different F1 embryos, grown in vitro for 24 hr at indicated 4-OHT pulse doses/times.
Figure 9—figure supplement 2
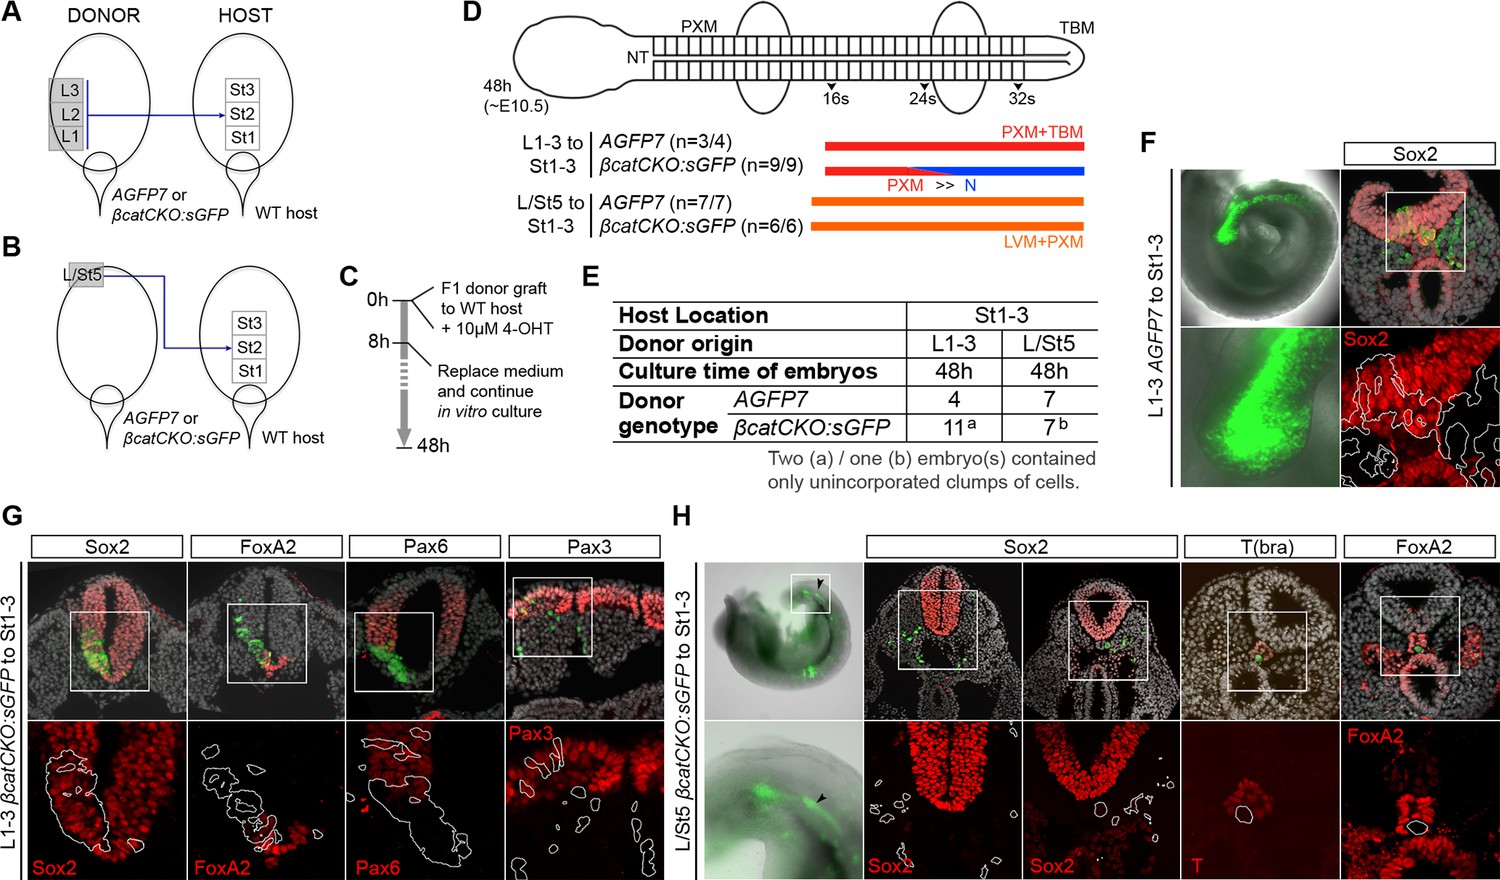
Grafts using β-catenin knock out donor tissue.
(A–C) Grafting scheme of L1-3 (A) or L/St5 (B) to St1-3 heterotopic grafts. Either AGFP7 control or βcatCKO:sGFP donor tissue was used to transplant into WT host embryos. (C) After receiving the graft, embryos were grown in vitro for 48 hr, of which the first 8 hr in the presence of 10 µM 4-OHT. (D) Diagram summarising experimental outcome for L1-3 or L/St5 to St1-3 heterotopic grafts. (E) Number of embryo grafts performed. (F) Exceptional L1-3 AGFP7 to St1-3 grafted embryo showing minor neural CNH contribution, shown by Sox2 immunostaining in the tail bud. (G) DAPI-counterstained images (grey). Immunofluorescent staining for neural Sox2, FoxA2 and Pax6 differentiation, and dermomyotome-specific Pax3 after 48 hr in vitro culture. (H) Example of a L/St5 βcatCKO:sGFP to St1-3 graft that contained non-integrated clumps (arrowhead) near the notochord (n = 3/7). These non-integrated cell clumps did not express Sox2, T or FoxA2.
Figure 9—figure supplement 3
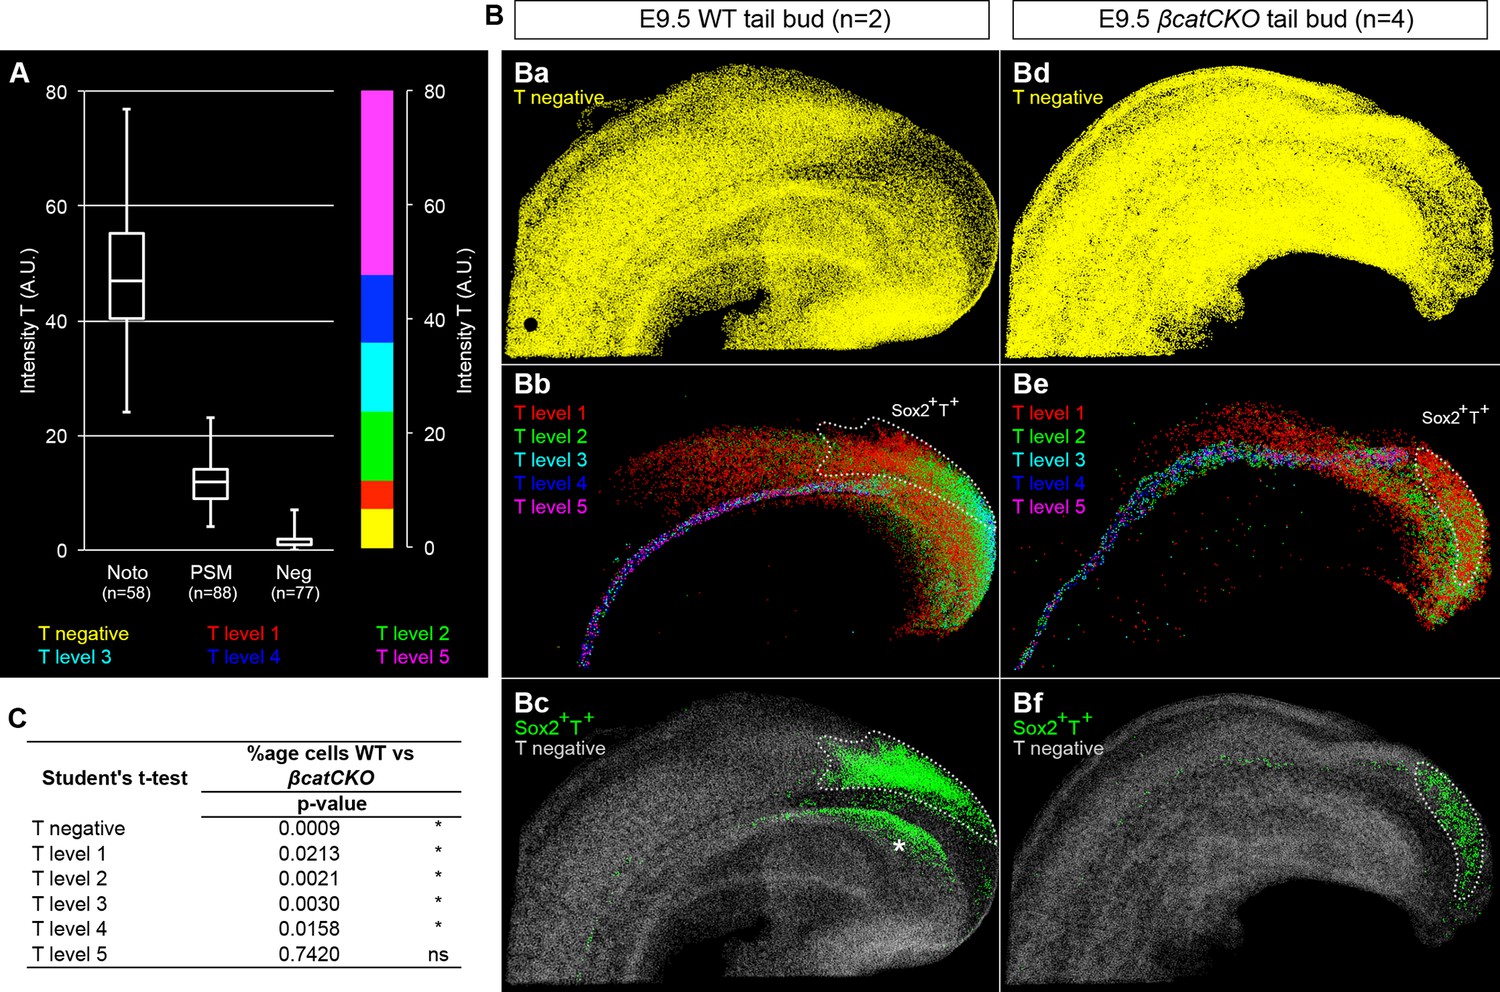
Levels of T in wildtype and 4-OHT-treated βcatCKO embryos.
(A) Boxplot for T intensity in notochord (noto), presomitic mesoderm (PSM) and T- (Neg) cells (n, number of nuclei sampled from wholemount stained embryos). The threshold for positivity was set at 7 AU, with the maximum corresponding to the highest intensity recorded (80 AU). T levels are (intensity [i]): negative [i < 7], level 1 [7 ≤ i < 12], level 2 [12 ≤ i < 24], level 3 [24 ≤ i < 36], level 2 [36 ≤ i <48], level 2 [48 ≤ i]. (B) 3D analysis showing T- cells (Ba, Bd), those with different T levels (Bb and Be) and Sox2+T+ cells in E9.5 WT and βcatCKO tail buds. Asterisk, Sox2+T+ cells found in the dorsocaudal part of the gut. (C) P-values from an unpaired Student's t-test comparing T levels between E9.5 WT (n = 2) and E9.5 4-OHT-treated βcatCKO (n = 4) embryos (*, p-value<0.05; ns, not significantly different).
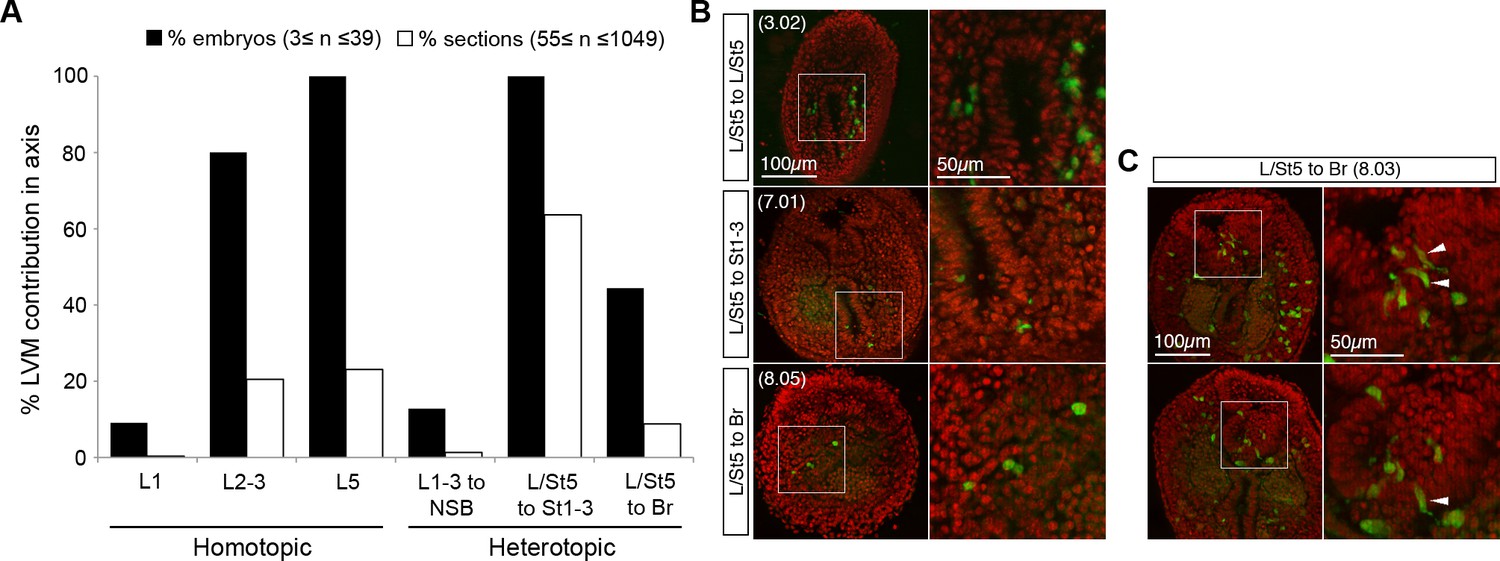
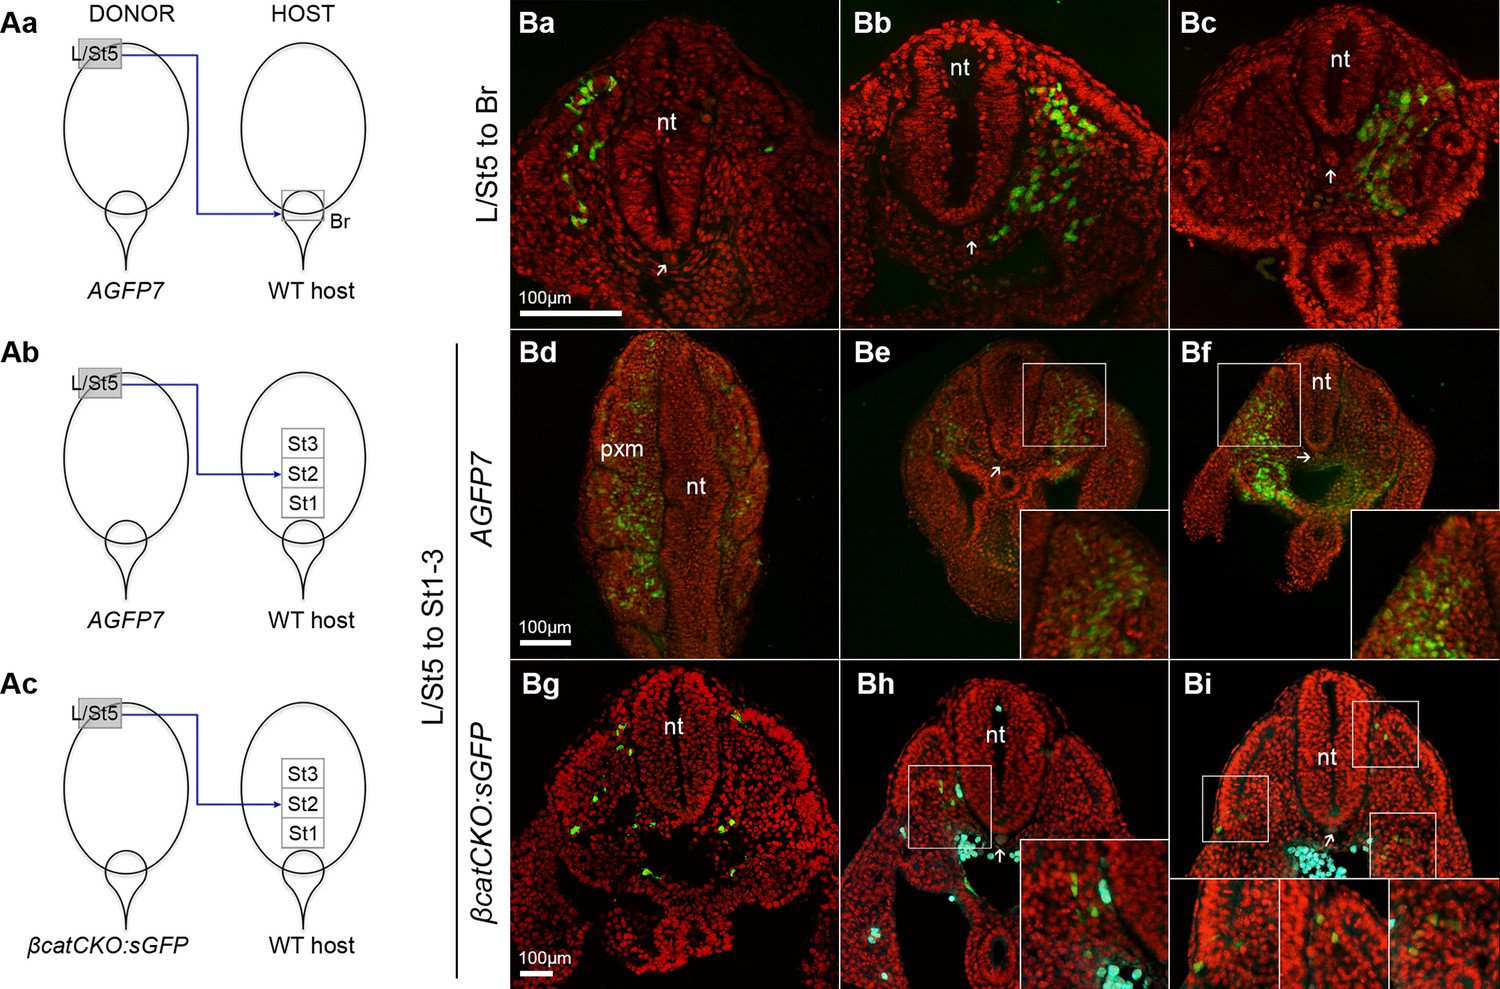
Figure 10 with 2 supplements
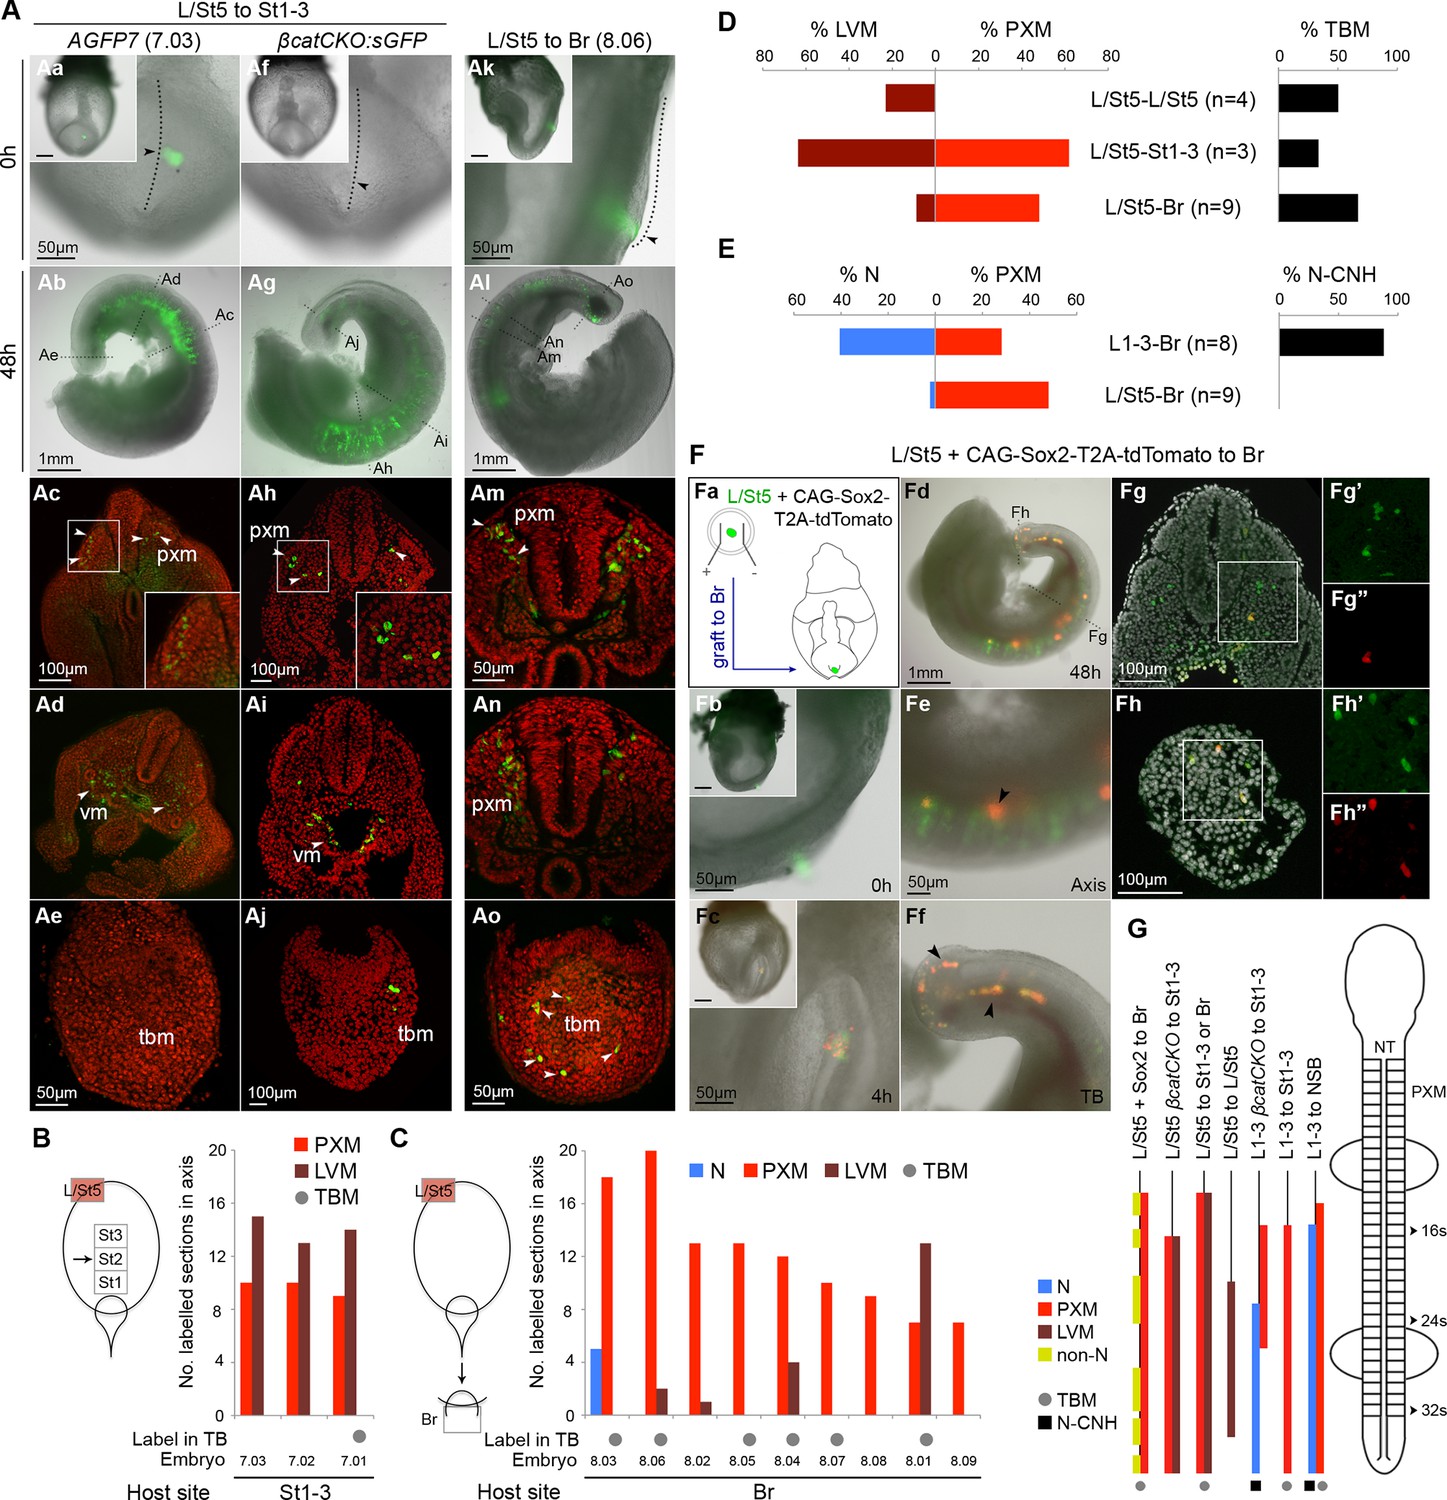
The caudal tip of the CLE shows paraxial mesoderm but not neural potency.
(A) Representative examples of L/St5 heterotopic grafts (numbers in brackets identify individual embryos depicted in (B–C). (Aa, Af and Ak) Cells immediately after grafting. Arrowheads show grafted cell position. (Ab, Ag and Al) Whole embryo after 48 hr ex vivo culture. (Ac–e, Ah–i and Am–o) Rostral to caudal transverse sections. (Aa–e) L/St5 AGFP7 to St1-3 grafts shows LVM-fated cells can switch fate to form PXM. (Af–j) L/St5 βcatCKO:sGFP to St1-3 grafts show a similar contribution pattern to control grafts. Non-integrated clumps near the notochord were observed in 3/7 embryos (see Figure 9—figure supplement 2H). (Ak–o) L/St5 to Br grafts show robust contribution to the paraxial mesoderm. (B–C) Grafting of L/St5 donor cells to the primitive streak (B) or to Br (C). Graph format is the same as in Figure 6. (D–E) Quantitative analysis of L/St5 graft contribution. Left, the percentage of PXM vs LVM (in D) or NT (in E) contribution in all scorable sections. Right, the percentage of embryos with TBM (in D) or dorsal CNH (in E) contribution. (F) Ectopic over-expression of Sox2 in L/St5 cells (n = 6 embryos). (Fa) L/St5 cells of AGFP7 embryos were electroporated with CAG-Sox2-T2A-tdTomato plasmid before grafting to Br of WT hosts. (Fb–c) Electroporated cells immediately after grafting (Fb) and after 4 hr culture (Fc). (Fd–f) Grafted embryo after 48 hr in vitro growth. Arrowheads show areas containing not well-integrated cells (orange). Green cells were not electroporated at the start and contributed to the PXM and LVM as before. (Fg–h) Axis and TB sections show orange cells never contribute to the NT. (G) Summary of L1-3 and L/St5 heterotopic grafts. Coloured bars represent the contribution to different axial tissues. Contribution in the neural CNH and TBM is represented by a black square or a grey circle, respectively. N, neural; PXM, paraxial mesoderm; LVM, lateral/ventral mesoderm; non-N, non-neural clumps; TBM, tail bud mesoderm; N-CNH, dorsal (neural) part of the CNH.
Figure 10—figure supplement 1
Overall lateral/ventral and tail bud mesoderm contribution.
(A) Percentage of total embryos and sections containing GFP+ cells in the lateral/ventral mesoderm. LVM contribution is very rare in L1 grafts. Note that the L2–3 grafts produced LVM at different sections along the axis, whereas L/St5 derived LVM was always found posterior to the hindlimb. (B) TBM contribution in all L/St5 grafts is limited. (C) Two L/St5 to Br sections illustrate the limited NT contribution in embryo 7.03.
Figure 10—figure supplement 2
Somite contribution in heterotopic LPMP grafts.
(A) Different L/St5 grafts performed. (B) Representative sections taken from grafts in A. Green, grafted cells; cyan, autofluorescence channel; arrows, notochord position; nt, neural tube; pxm, paraxial mesoderm.
Figure 11
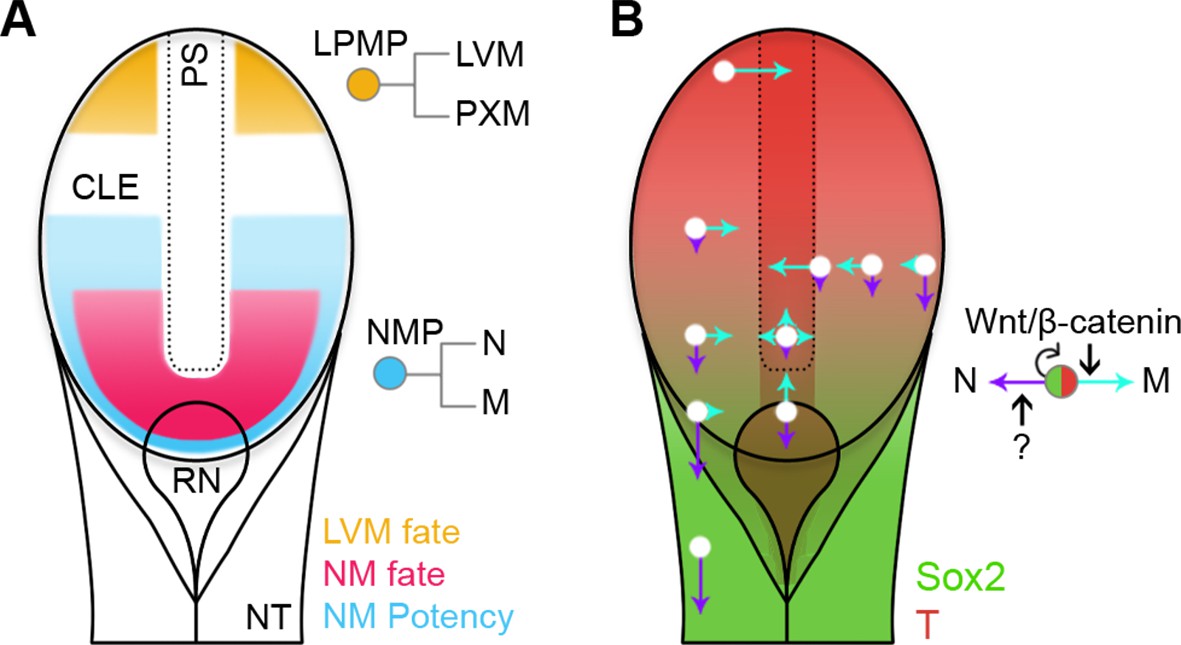
Position-dependent plasticity of primitive streak progenitors.
(A) NMPs and LPMPs coexist in the caudal progenitor zone. The NSB and L1 regions show NM fate. NM potency is broader, encompassing L2–3 regions and coincides with a Sox2+T+ phenotype. LPMPs reside in the caudal-most embryo part; their potency to make PXM is somehow supressed. (B) Relative N vs M fate choices and trajectories for both progenitor populations are represented by directional purple and cyan arrows respectively, with length indicating proportions of cells entering each lineage. Background, relative expression of Sox2 (green) and T (red). Only NMPs require Wnt/β-catenin for mesoderm differentiation and maintenance.
Videos
Video 1
Sox2 and T expression domains during axis elongation.
3D reconstruction of the caudal progenitor region at different stages of axis elongation. (00:00) E8.5 (2-5s); (00:38) E9.5; (01:02) E10.5; (01:26) E11.5; (01:47) E12.5; (02:08) E13.5 (62-63s); (02:33) E13.5 (65s).
Video 2
The number of T+ cells is affected upon β-catenin removal.
3D reconstruction of the caudal progenitor region. (00:00) E9.5 WT sample and (00:28) example of a βcatCKO embryo at E9.5, after it was cultured in vitro for 24 hr in the presence of 5µM 4-OHT.
Download links
A two-part list of links to download the article, or parts of the article, in various formats.
Downloads (link to download the article as PDF)
Open citations (links to open the citations from this article in various online reference manager services)
Cite this article (links to download the citations from this article in formats compatible with various reference manager tools)
Position-dependent plasticity of distinct progenitor types in the primitive streak
eLife 5:e10042.
https://doi.org/10.7554/eLife.10042


