BCAS2 promotes primitive hematopoiesis by sequestering β-catenin within the nucleus
- Innovation Centre of Ministry of Education for Development and Diseases, the Sixth Affiliated Hospital, School of Medicine, South China University of Technology, China
- Affiliated Hospital of Guangdong Medical University & Key Laboratory of Zebrafish Model for Development and Disease of Guangdong Medical University, China
- School of Pharmacy, Qiqihar Medical University, China
- Institute State Key Laboratory of Stem Cell and Reproductive Biology, Institute of Stem Cell and Regeneration, Beijing Institute of Stem Cell and Regenerative Medicine, Institute of Zoology, Chinese Academy of Sciences, China
- University of Chinese Academy of Sciences, China
Figures
Figure 1 with 4 supplements
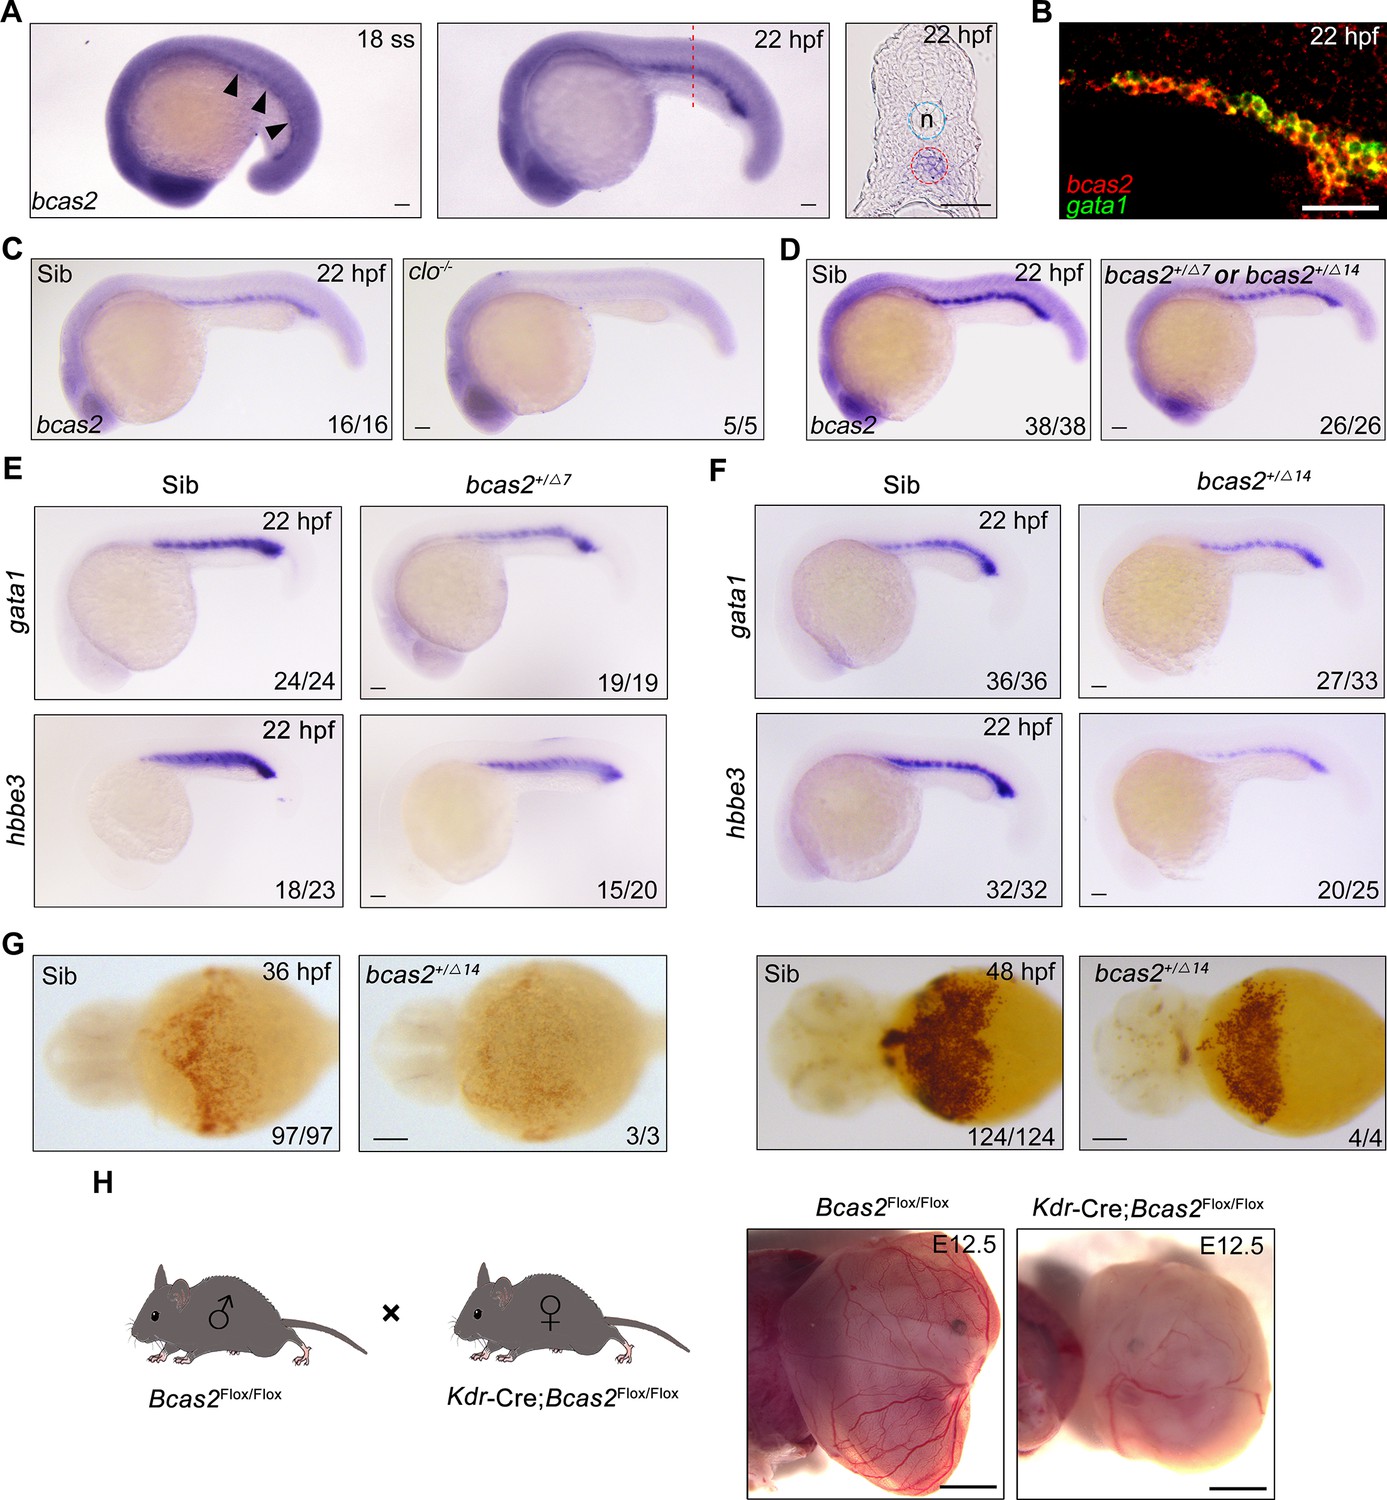
bcas2 is expressed in the intermediate cell mass (ICM) and required for primitive hematopoiesis.
(A) Whole-mount in situ hybridization (WISH) assay showing bcas2 expression in the ICM at the 18-somite stage and 22 hpf. The dotted lines represent the section position and the black arrowheads indicate the ICM region. n, notochord. (B) Double fluorescence in situ hybridization (FISH) assay showing the expression pattern of bcas2 and gata1 in the ICM at 22 hpf. (C, D) Comparison of bcas2 expression in cloche mutants (C) or bcas2 heterozygous mutants (D) along with their corresponding siblings. (E, F) Expression analysis of gata1 and hbbe3 in bcas2+/Δ7 and bcas2+/Δ14 embryos. (G) Hemoglobin detection using o-dianisidine staining in bcas2 homozygous mutant at 36 and 48 hpf. (H) Representative images of yolk sac from the hemangioblast-specific Bcas2 knockout mice and their siblings. Bcas2F/F females were crossed with Bcas2F/+;Kdr-Cre males to induce the deletion of Bcas2 in hemangioblasts. Scale bars, 100 μm (A, C–G), 50 μm (B), 1 mm (H).
Figure 1—figure supplement 1
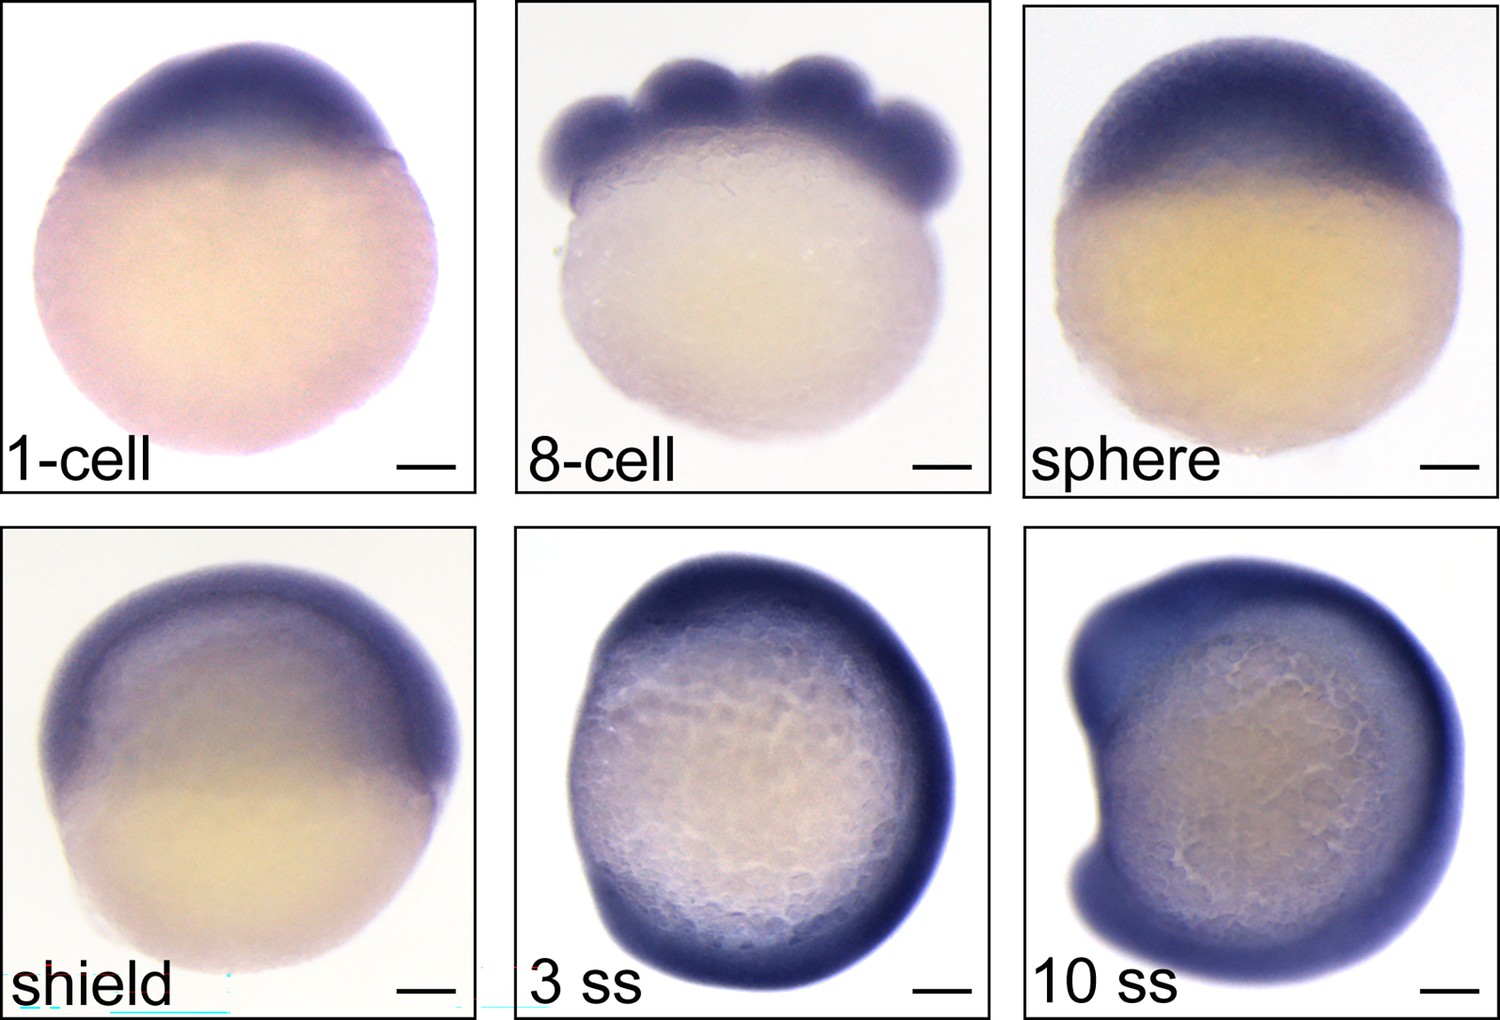
Expression patterns of bcas2 in wild-type embryos during development.
Expression of bcas2 in wild-type embryos at the indicated developmental stages was analyzed using whole-mount in situ hybridization. Scale bars, 100 μm.
Figure 1—figure supplement 2

Zebrafish bcas2 mutants are generated by using CRISPR/Cas9 system.
(A) Schematic showing generation of bcas2 mutants. Two mutant lines were obtained with mutations that resulted in premature translation termination, resulting in truncated Bcas2 proteins lacking the C-terminal CC domains. (B) Identification of bcas2 mutations using DNA sequencing. (C) The bcas2+/Δ7 and bcas2+/Δ14 mutants were identified via T7 endonuclease (the upper panel) or FspI restriction enzyme (the lower panel) digestions. (D) Bright-field images of embryos derived from crossing indicated females with heterozygous male mutants. Black arrows refer to the embryos that exhibited an abnormal cleavage. The ratio of viable embryos was indicated. Scale bars, 1 mm (D).
-
Figure 1—figure supplement 2—source data 1
PDF file containing original gel images for Figure 1—figure supplement 2C with the relevant bands and treatments indicated.
- https://cdn.elifesciences.org/articles/100497/elife-100497-fig1-figsupp2-data1-v1.zip
-
Figure 1—figure supplement 2—source data 2
Original gel images in Figure 1—figure supplement 2C.
- https://cdn.elifesciences.org/articles/100497/elife-100497-fig1-figsupp2-data2-v1.zip
Figure 1—figure supplement 3
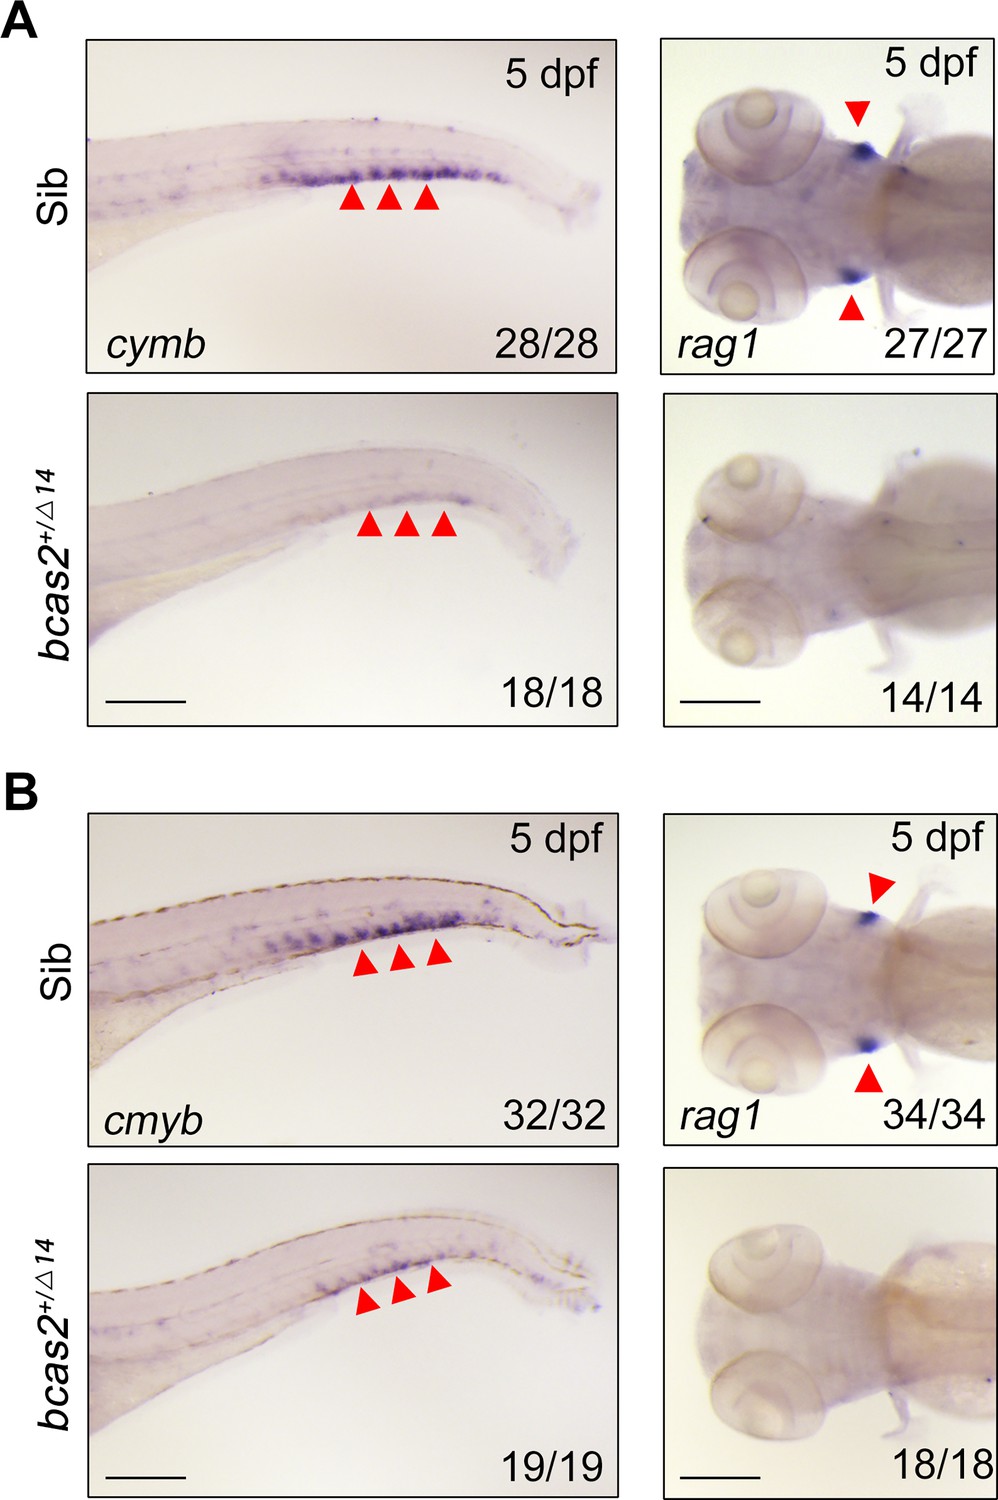
bcas2 is essential for definitive hematopoiesis.
(A, B) Expression changes of cymb and rag1 in bcas2+/Δ7 (A) and bcas2+/Δ14 (B) embryos compared with their siblings. Arrowheads on the left panels indicate the caudal hematopoietic tissue, and those on the right panels indicate the thymus. Scale bars, 200 μm (A, B).
Figure 1—figure supplement 4
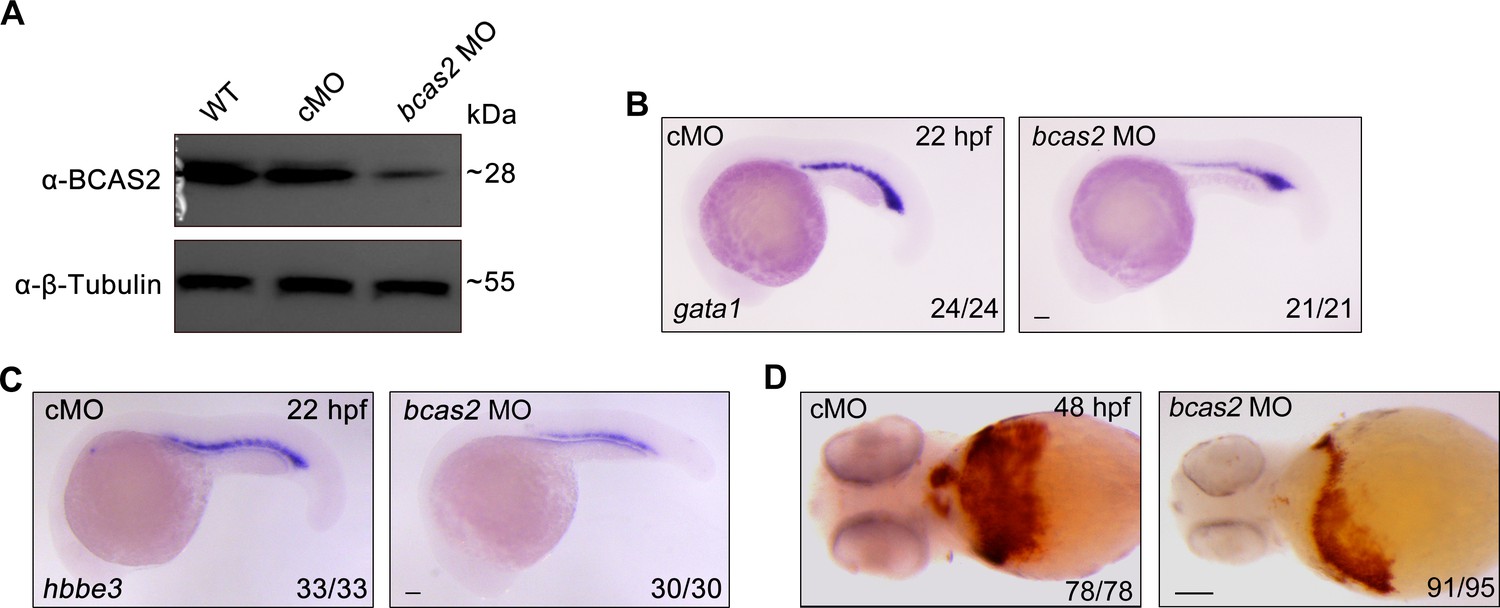
Knockdown of bcas2 impairs primitive hematopoiesis.
(A) Western blot analysis showing the expression changes of Bcas2 protein in wild-type embryos and embryos injected with 8 ng control MO (cMO) or bcas2 MO. (B, C) Expression of gata1 (B) and hbbe3 (C) in bcas2 morphants and control embryos. (D) Detection of hemoglobin levels by o-dianisidine staining in bcas2 morphants and control embryos. Scale bars, 100 μm (B–D).
-
Figure 1—figure supplement 4—source data 1
Original western blots for Figure 1—figure supplement 4A with the relevant bands and treatments indicated.
- https://cdn.elifesciences.org/articles/100497/elife-100497-fig1-figsupp4-data1-v1.zip
-
Figure 1—figure supplement 4—source data 2
Original western blot images in Figure 1—figure supplement 4A.
- https://cdn.elifesciences.org/articles/100497/elife-100497-fig1-figsupp4-data2-v1.zip
Figure 2 with 1 supplement
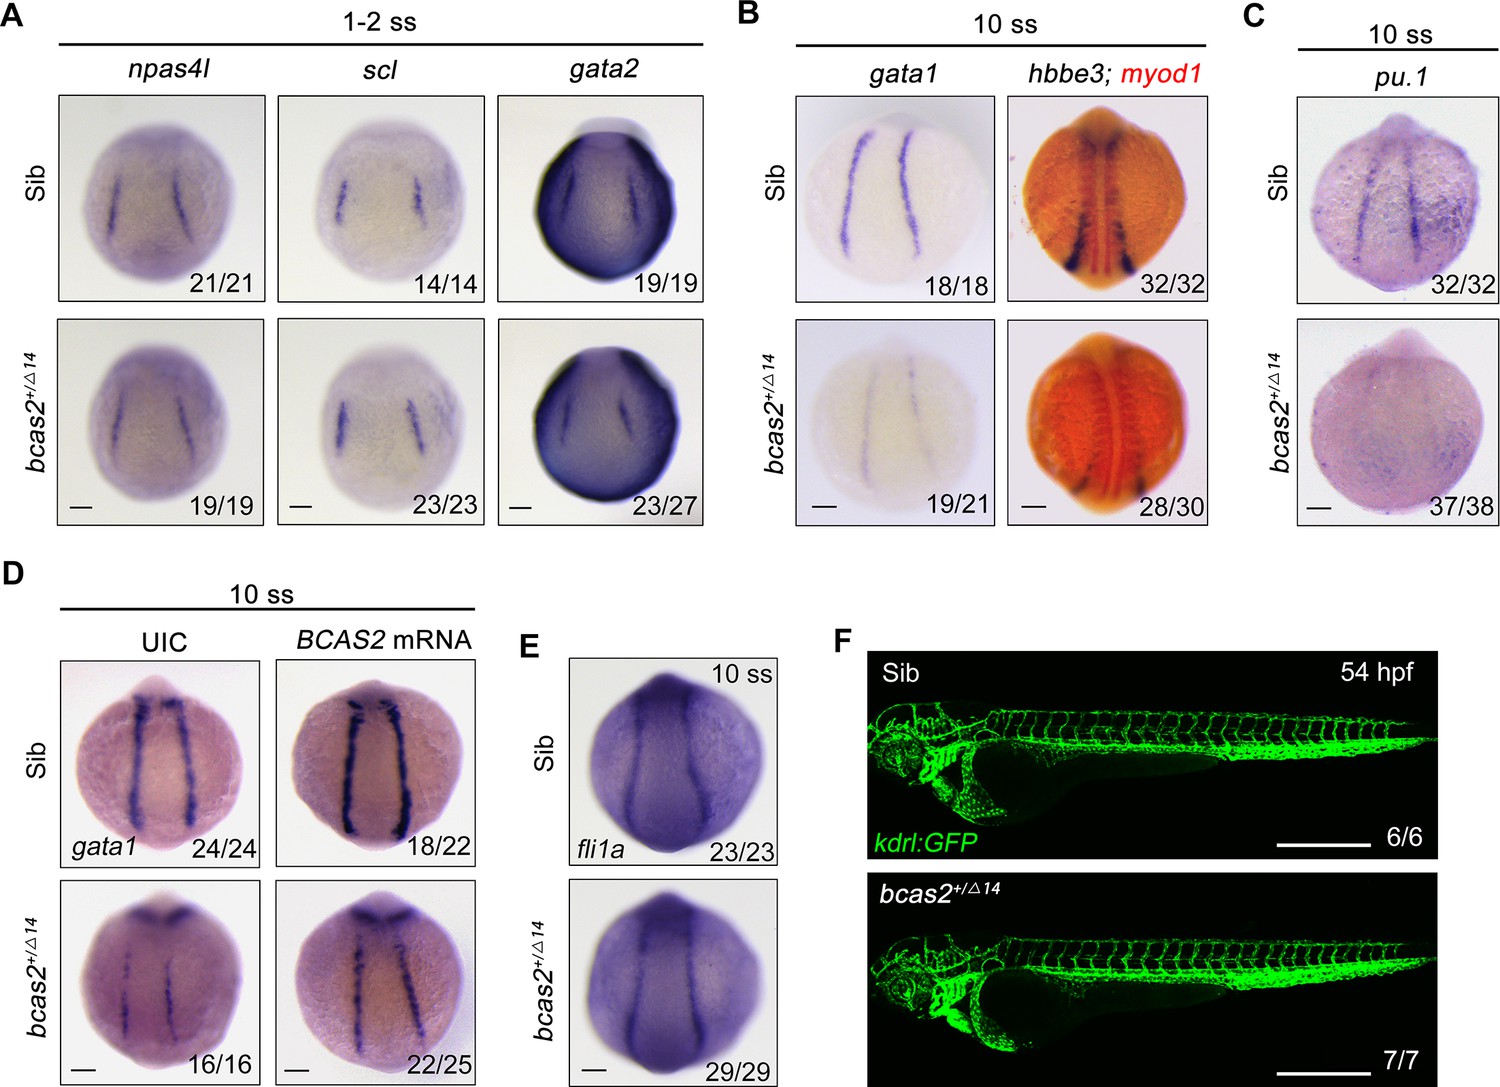
bcas2 is required for hematopoietic progenitor differentiation.
(A–C) Expression analysis of hemangioblast markers npas4l, scl, gata2 (A), erythroid progenitor markers gata1, hbbe3 (B), and myeloid marker pu.1 (C) in bcas2+/Δ14 embryos and their wild-type siblings at indicated stages. (D) Expression changes of gata1 in bcas2+/Δ14 embryos overexpressing BCAS2 at the 10-somite stage. The indicated embryos were injected with or without 300 pg of human BCAS2 mRNA at the one-cell stage. (E) Expression of endothelial marker fli1a in bcas2+/Δ14 and sibling embryos at the 10-somite stage. (F) Confocal imaging of bcas2+/Δ14 and control sibling Tg(kdrl:GFP) embryos at 54 hpf. Scale bars, 100 μm (A–E), 500 μm (F).
Figure 2—figure supplement 1
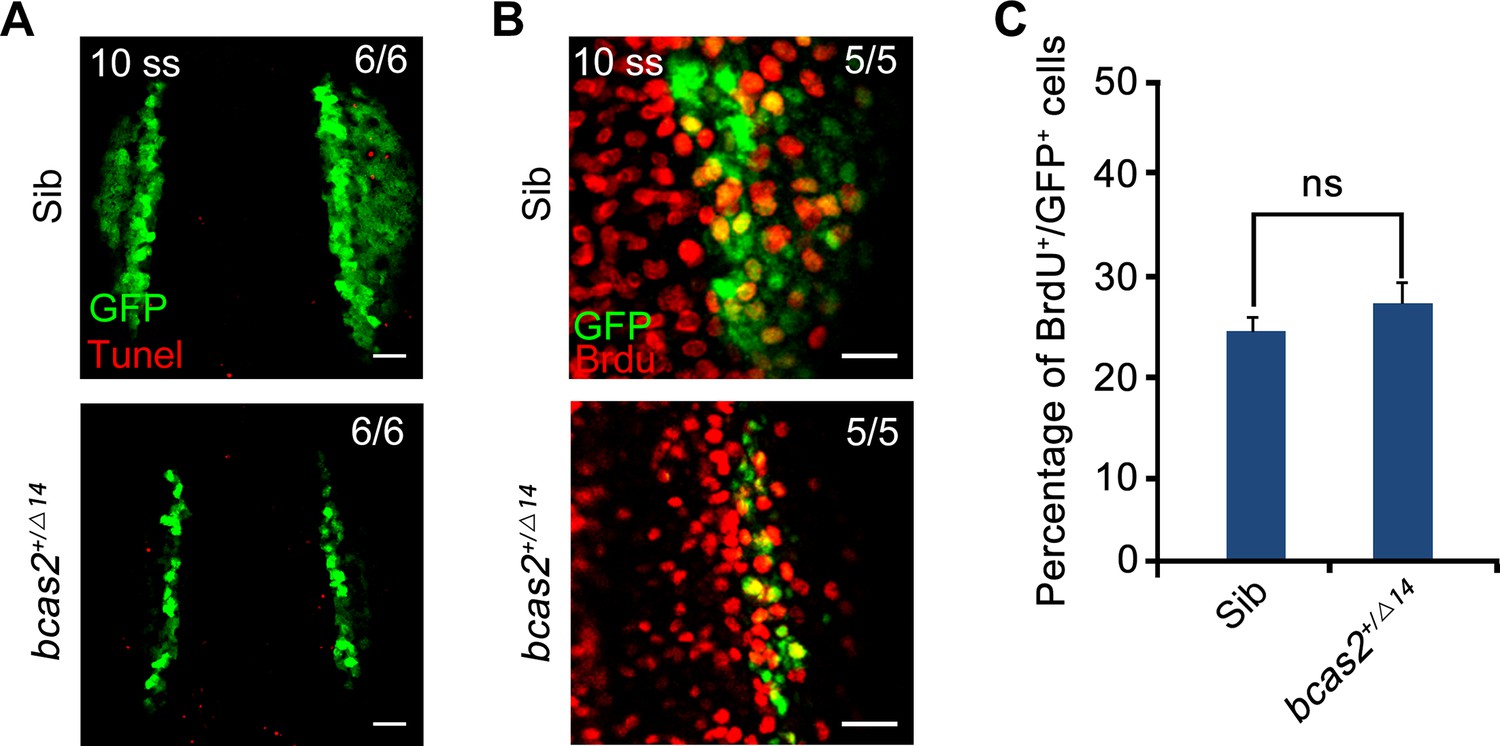
bcas2 is dispensable for the survival and proliferation of hematopoietic cells.
(A) Cell apoptosis was detected by TUNEL assay in bcas2+/Δ14 embryos and their siblings with Tg(gata1:GFP) background. (B, C) Cell proliferation was detected by BrdU staining in bcas2+/Δ14 embryos and their siblings with Tg(gata1:GFP) background. The percentage of BrdU+/GFP+ cells (% over the total number of GFP+ cells) was quantified in (C) (n=6). ns, not significant (Student’s t-test). Scale bars, 50 μm (A), 20 μm (B).
Figure 3 with 4 supplements
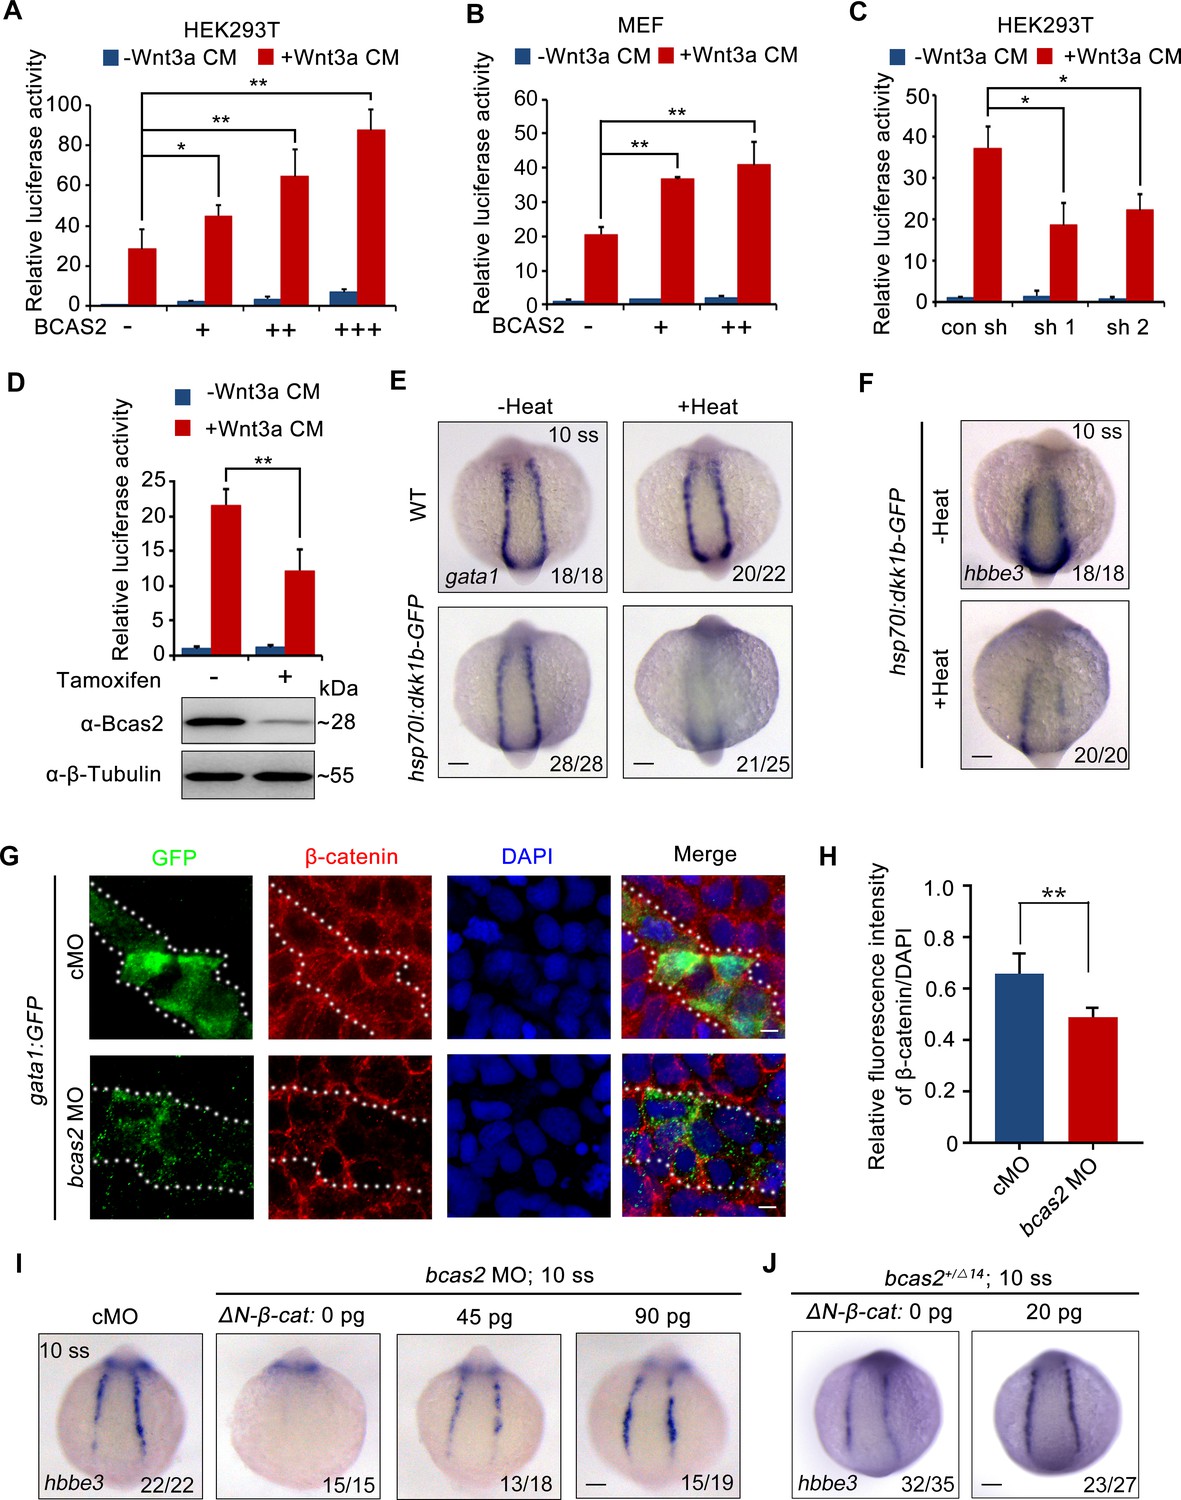
BCAS2 promotes primitive hematopoiesis via activating Wnt signaling.
(A, B) Overexpression of BCAS2 increases Wnt3a-induced TOPflash activity in HEK293T cells (A) and mouse embryonic fibroblasts (MEFs) (B). Different amounts of plasmid expressing BCAS2 (0, 80, 160, or 320 ng/well) were transfected into cells, together with the super-TOPflash luciferase and Renilla luciferase vectors. After 36 h of transfection, cells were treated with or without Wnt3a CM for 12 h and harvested for luciferase assays (n=3). *p<0.05; **p<0.01 (Student’s t-test). (C) The Wnt3a-induced TOPflash activity is decreased in BCAS2-deficient cells. HEK293T cells were transfected with shRNA plasmids, along with indicated plasmids, and harvested for luciferase reporter assay (n=3). *p<0.05 (Student’s t-test) (D) Bcas2-cKO MEFs prepared from Bcas2F/F mouse embryos were incubated in medium containing 100 μM tamoxifen for 72 h and then subjected to western blotting and luciferase reporter assay (n=3). **p<0.01 (Student’s t-test). (E, F) Expression analysis of gata1 (E) and hbbe3 (F) in Tg(hsp70l:dkk1b-GFP) embryos after heat shock at 16 hpf. (G, H) Immunofluorescence staining of β-catenin in Tg(gata1:GFP) embryos at 16 hpf. The embryos were injected with 8 ng of the indicated MO at the one-cell stage. The dotted lines show the GFP-positive hematopoietic progenitor cells. The relative fluorescence intensity of nuclear β-catenin was quantified in (H) (n=6). **p<0.01 (Student’s t-test). (I, J) Expression of hbbe3 in bcas2 morphants (I) and bcas2+/Δ14 mutants (J) overexpressing ΔN-β-catenin. Embryos were injected with the indicated MO together with ΔN-β-catenin mRNA at the 1-cell stage and harvested at the 10-somite stage for in situ hybridization. Scale bars, 100 μm (E, F, I, J), 5 μm (G).
-
Figure 3—source data 1
Original western blots for Figure 3D, indicating the relevant bands and treatments.
- https://cdn.elifesciences.org/articles/100497/elife-100497-fig3-data1-v1.zip
-
Figure 3—source data 2
Original western blot images in Figure 3D.
- https://cdn.elifesciences.org/articles/100497/elife-100497-fig3-data2-v1.zip
Figure 3—figure supplement 1

Western blot analysis of HEK293T cells transfected with corresponding shRNA constructs.
-
Figure 3—figure supplement 1—source data 1
Original western blots for Figure 3—figure supplement 1 with the relevant bands labeled.
- https://cdn.elifesciences.org/articles/100497/elife-100497-fig3-figsupp1-data1-v1.zip
-
Figure 3—figure supplement 1—source data 2
Uncropped immunoblotting images in Figure 3—figure supplement 1.
- https://cdn.elifesciences.org/articles/100497/elife-100497-fig3-figsupp1-data2-v1.zip
Figure 3—figure supplement 2
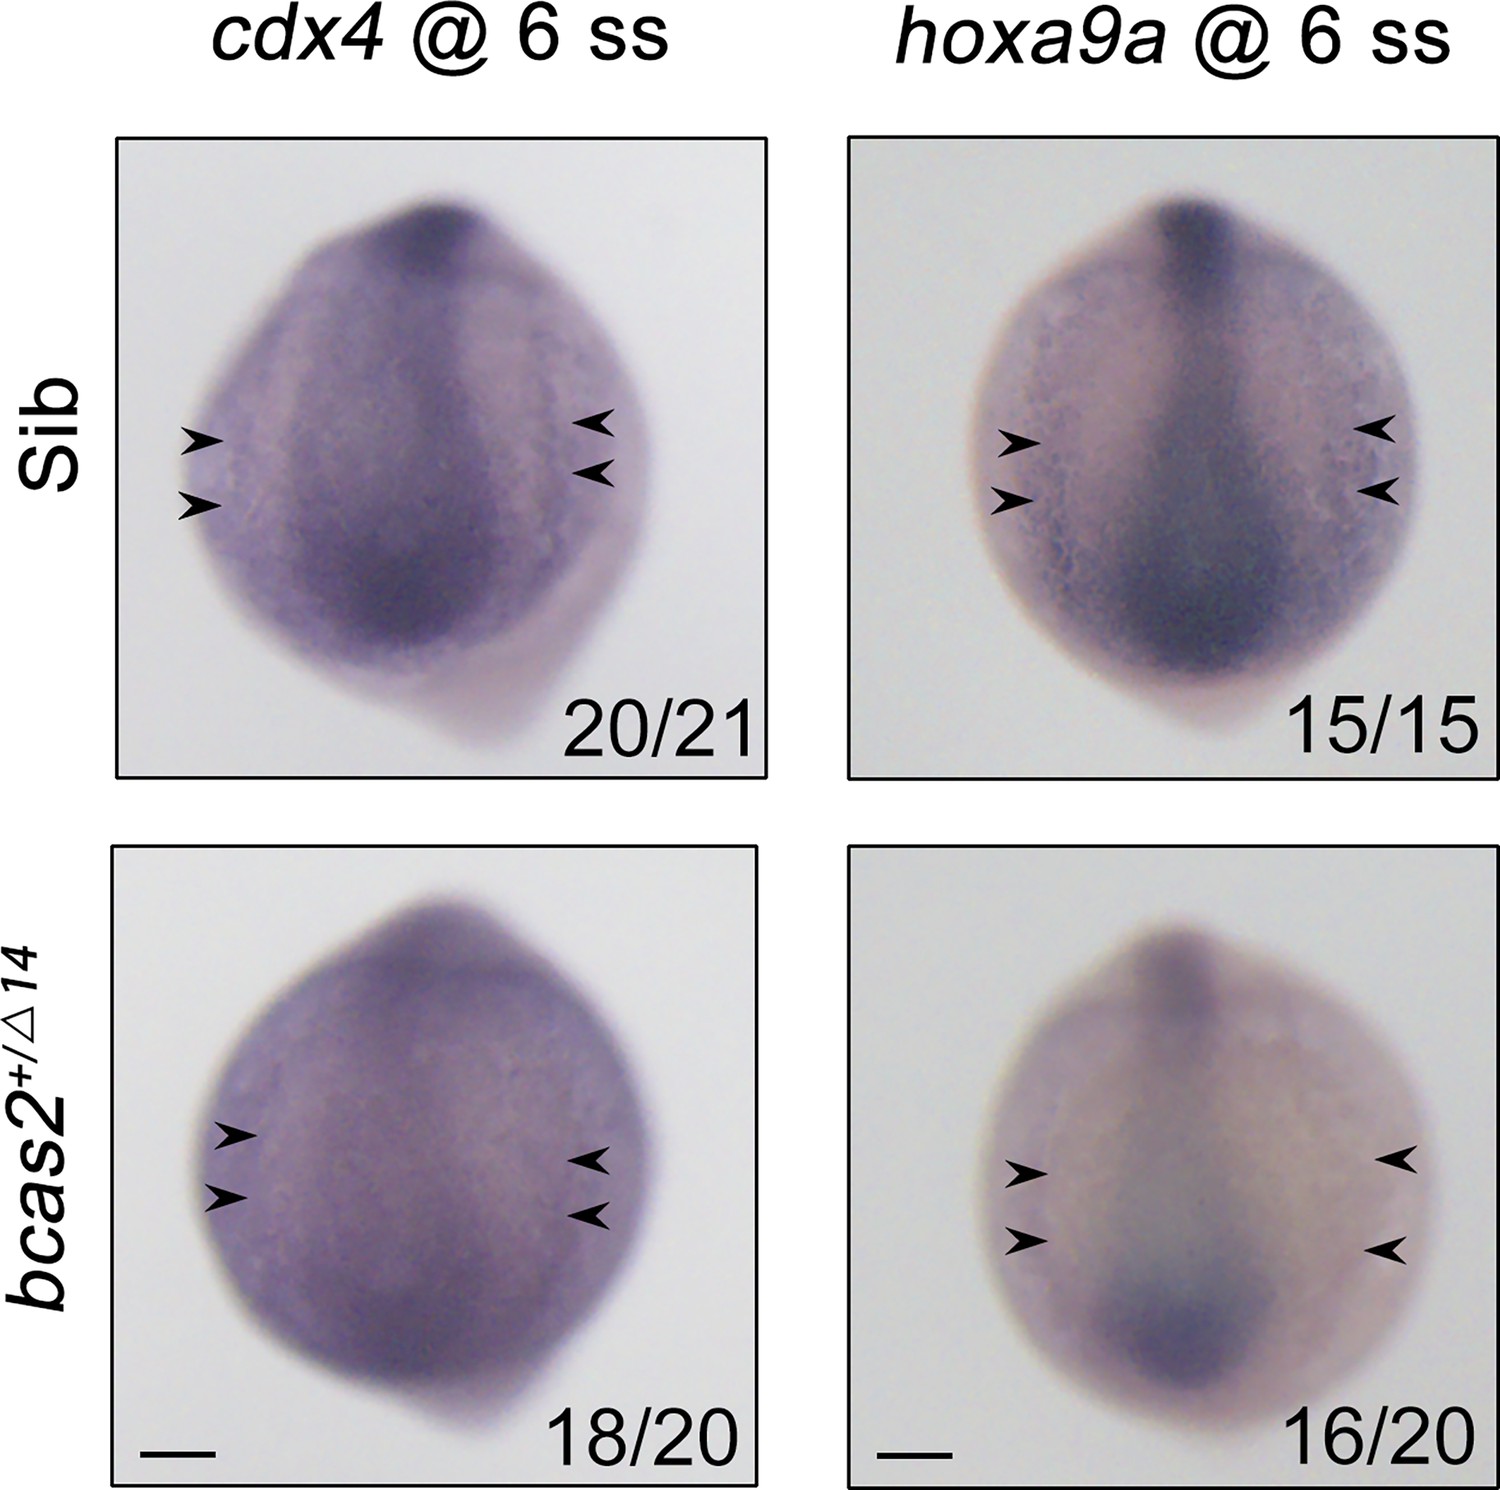
Expression patterns of cdx4 and hoxa9a in bcas2+/Δ14 embryos and their siblings at the 6-somite stage.
Black arrows indicate the posterior lateral mesoderm. Scale bars, 100 μm.
Figure 3—figure supplement 3
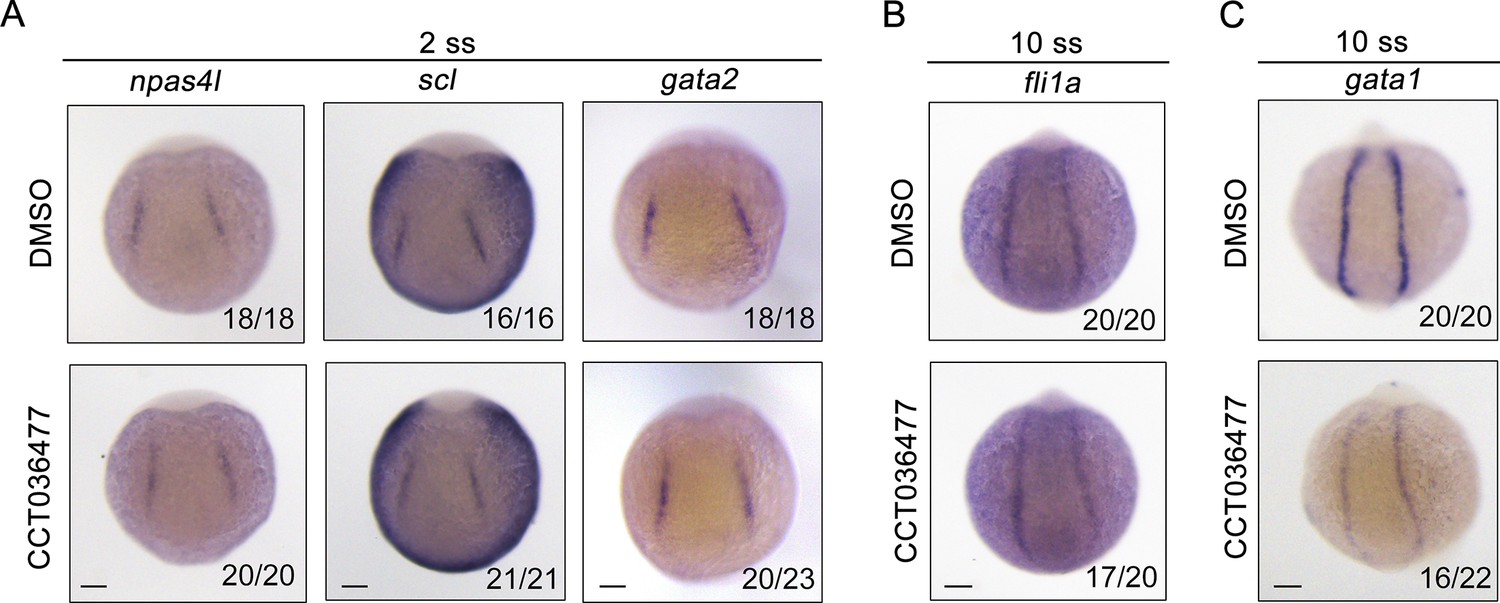
Inhibition of Wnt signaling does not affect the generation of hemangioblasts or their endothelial differentiation, but impairs their hematopoietic differentiation.
Expression of hemangioblast markers npas4l, scl, gata2 (A), endothelial marker fli1a (B) and erythroid progenitor marker gata1 (C) at the indicated stages. Wild-type embryos were treated with 10 µM CCT036477 from 9 hpf and then collected for whole-mount in situ hybridizations. DMSO treated wild-type embryos were regarded as control groups. Scale bars, 100 μm (A–C).
Figure 3—figure supplement 4

Knockdown of bcas2 significantly reduces nuclear β-catenin in the primitive myeloid cells.
(A) Immunofluorescence staining of β-catenin in Tg(coro1a:GFP) embryos at 17 hpf. The embryos were injected with 8 ng of the indicated MOs at the one-cell stage and then collected for immunofluorescence staining. The dotted lines refer to the GFP-positive primitive myeloid cells. The relative fluorescence intensity of β-catenin was quantified in (B) (n=6). **p<0.01 (Student’s t-test). Scale bars, 10 μm (A).
Figure 4
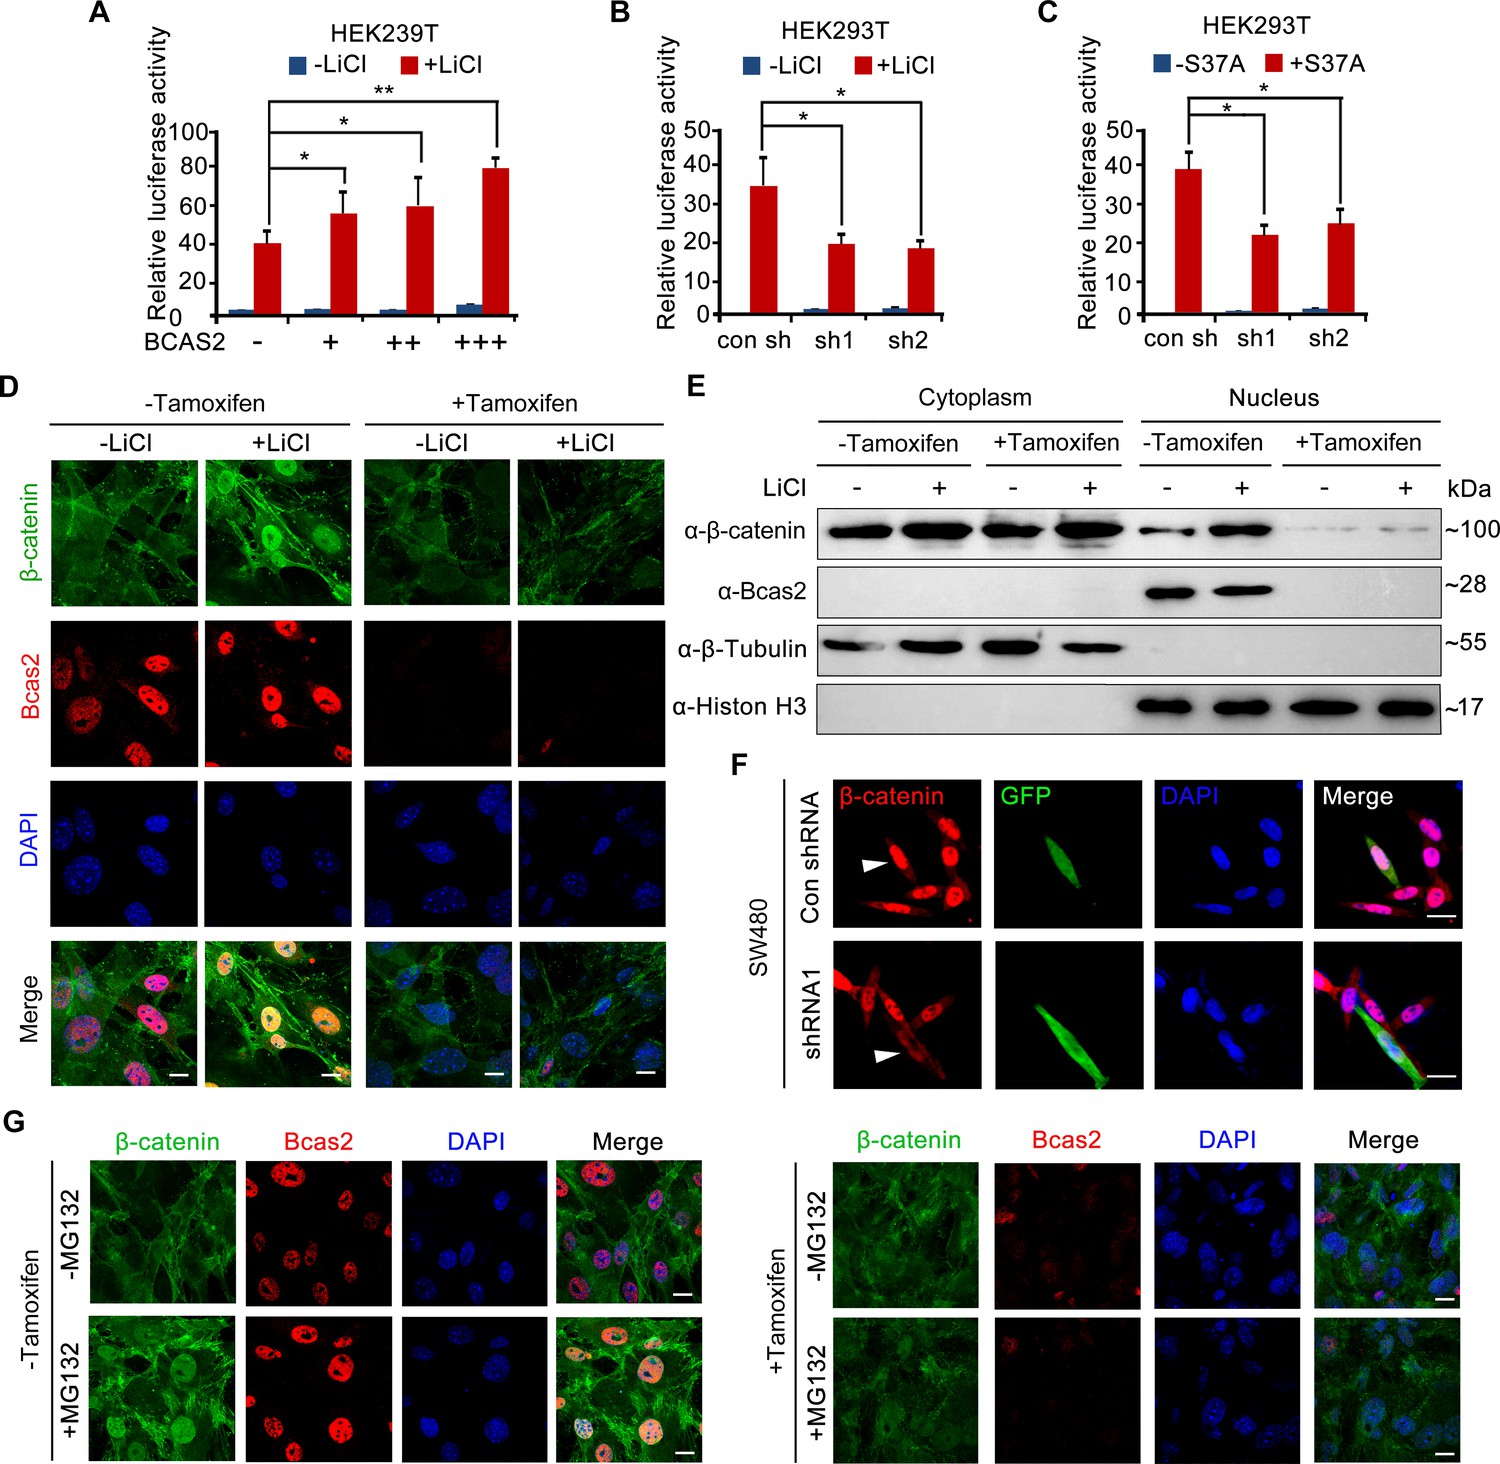
BCAS2 is essential for β-catenin nuclear accumulation.
(A–C) BCAS2 enhances LiCl-induced TOPflash activity in HEK293T cells. Cells were transfected with BCAS2 expression plasmids (A), shRNA plasmids (B), or S37A-β-catenin expression plasmids (C), together with the TOPflash luciferase and Renilla luciferase vectors. After transfection, cells were subsequently treated with or without 100 ng/ml LiCl for 12 h and assayed for luciferase activity (n=3). *p<0.05; **p<0.01 (Student’s t-test). (D, E) Bcas2-cKO mouse embryonic fibroblasts (MEFs) were incubated with tamoxifen for 24 h and then treated with or without 100 ng/mL LiCl. The nuclear accumulation of β-catenin was analyzed using immunofluorescence (D) and western blotting (E). (F) SW480 cells were transfected with the indicated shRNA constructs, and the endogenous β-catenin protein was detected using immunofluorescence 48 h after transfection. The expression of GFP served as a transfection control. The arrowheads indicate the cells transfected with indicated shRNA constructs. (G) Bcas2-cKO MEFs were cultured in the presence of tamoxifen for 24 h and then treated with 20 μM MG132 for 6 h. The expression of BCAS2 and β-catenin was measured by immunofluorescence. Scale bars, 10 μm (D, F, G).
-
Figure 4—source data 1
Original western blots for Figure 4E with the relevant bands and treatments labeled.
- https://cdn.elifesciences.org/articles/100497/elife-100497-fig4-data1-v1.zip
-
Figure 4—source data 2
Original western blot images in Figure 4E.
- https://cdn.elifesciences.org/articles/100497/elife-100497-fig4-data2-v1.zip
Figure 5 with 2 supplements
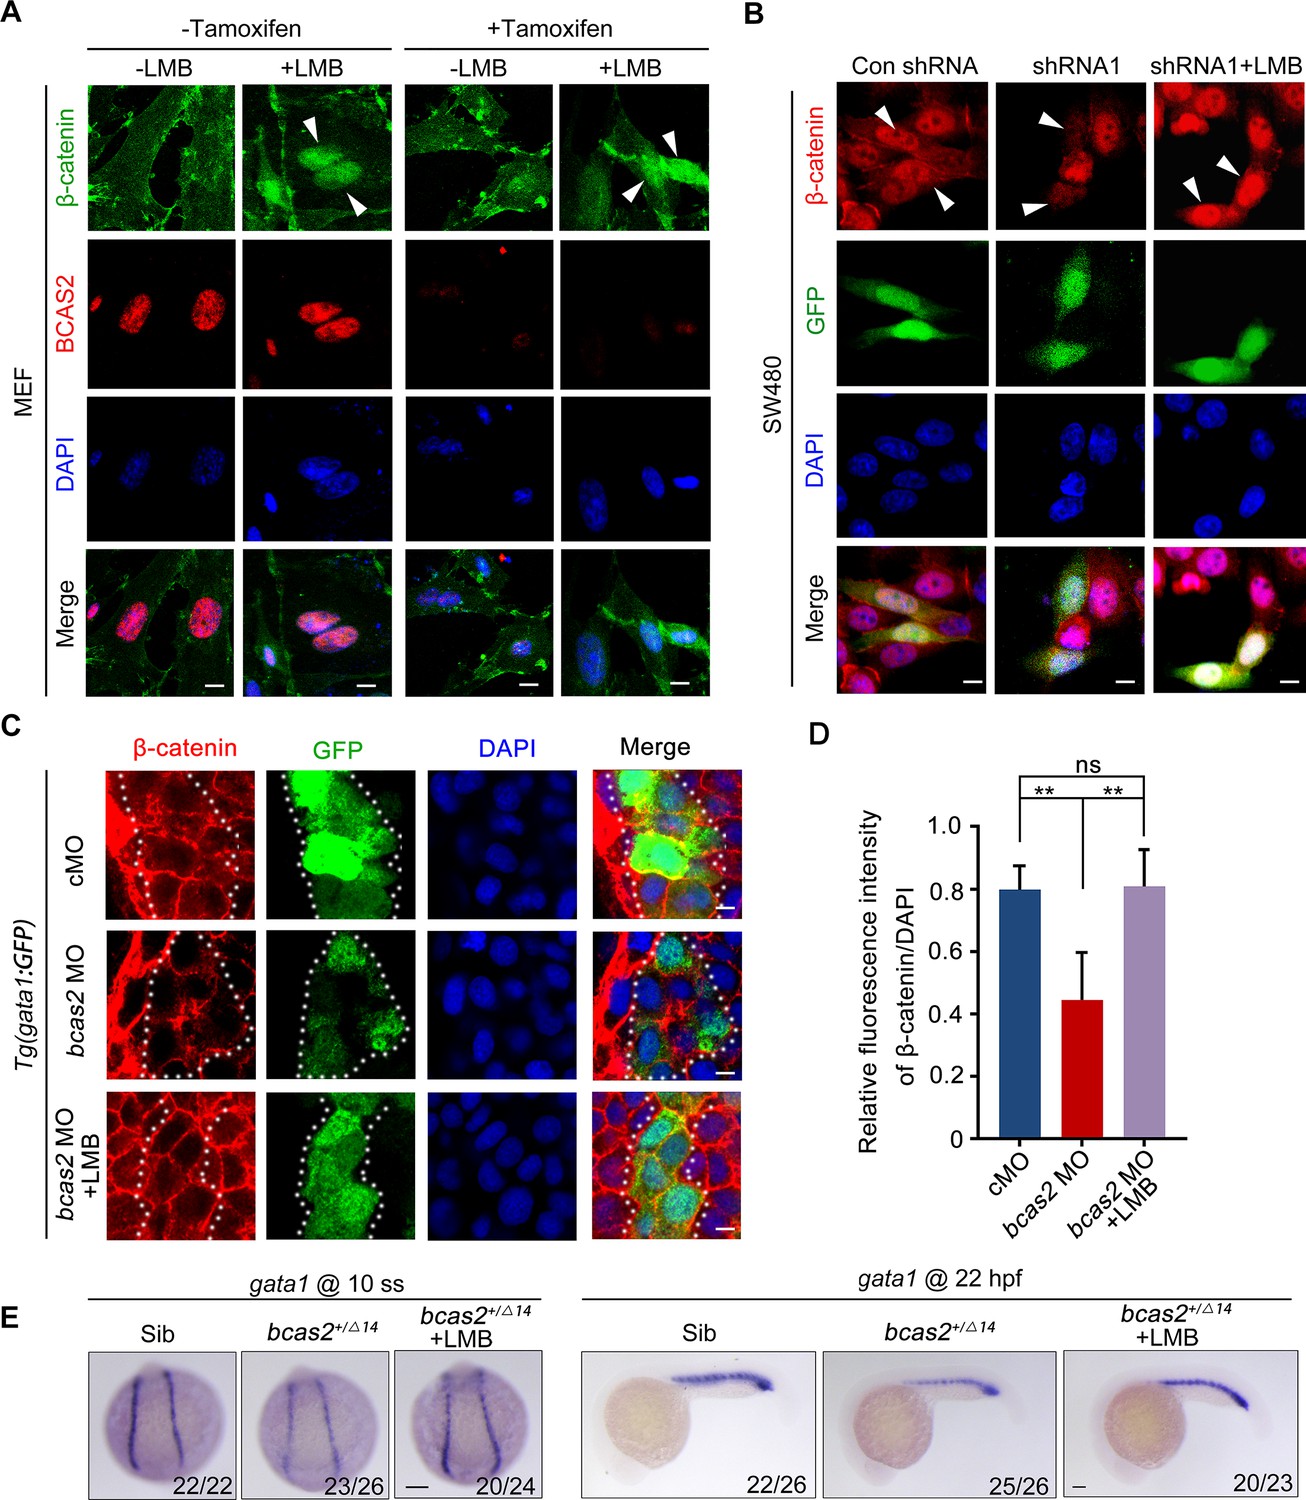
BCAS2 functions in CRM1-mediated nuclear export of β-catenin.
(A) Tamoxifen-treated Bcas2-cKO mouse embryonic fibroblasts (MEFs) were incubated with 20 nM LMB for 3 h. The expression of Bcas2 and β-catenin was analyzed using immunofluorescence. The arrowheads show the cells with nuclear β-catenin accumulation. (B) SW480 cells were transfected with the indicated shRNA constructs and then treated with LMB for 3 h before immunostaining. GFP was regarded as a transfection control. The arrowheads indicate the transfected cells. (C, D) Immunofluorescence staining of β-catenin in bcas2 morphants with Tg(gata1:GFP) background at 16 hpf. Embryos were exposed to 20 nM LMB from the bud stage. The dotted lines indicate the GFP-positive hematopoietic progenitor cells. The relative fluorescence intensity of nuclear β-catenin was quantified in (D) (n=6). ns, not significant; **p<0.01 (Student’s t-test). (E) bcas2+/Δ14 embryos were treated with 20 nM LMB for 6 h and then subjected to WISH assay to analyze the expression of gata1 at the indicated stages. Scale bars, 10 μm (A, B), 5 μm (C), 100 μm (E).
Figure 5—figure supplement 1
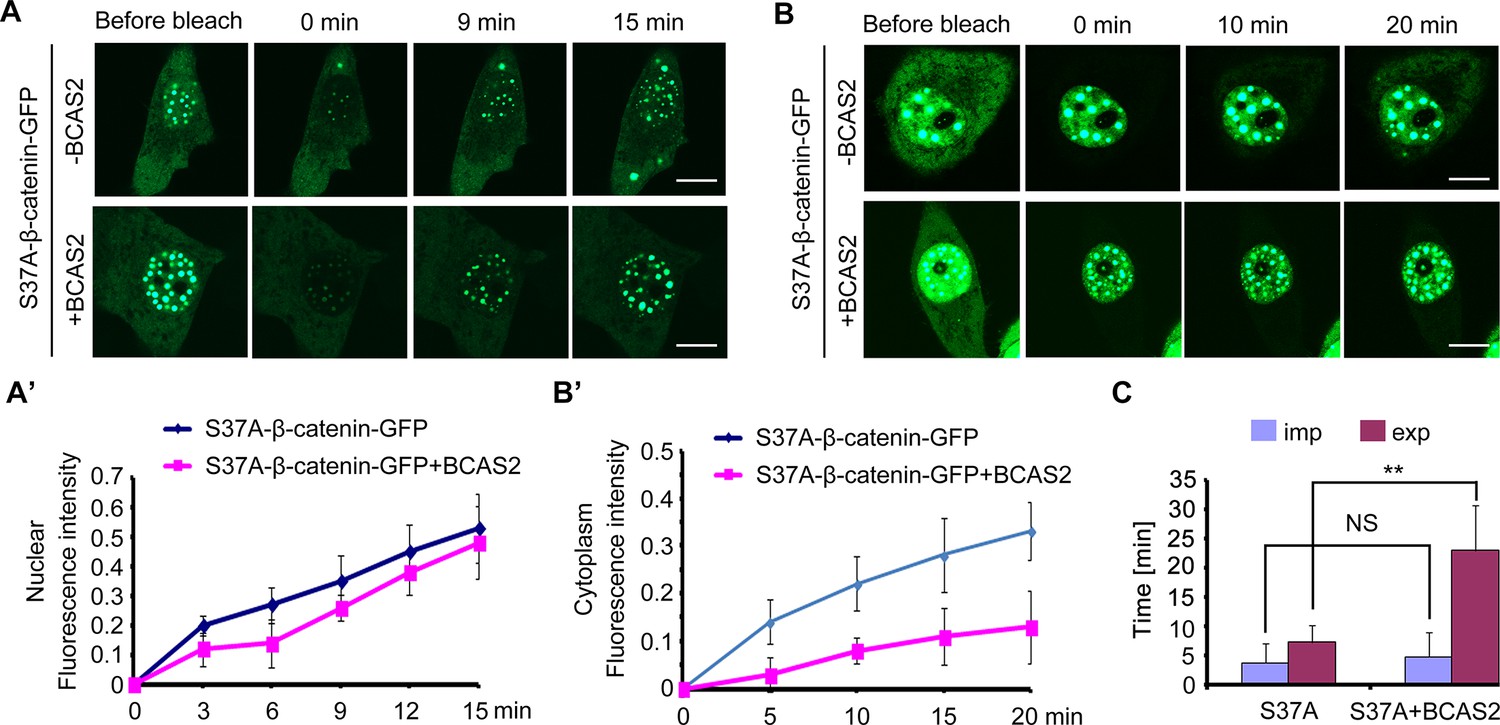
BCAS2 inhibits the nuclear export of β-catenin.
(A–B’) GFP-tagged S37A-β-catenin was co-expressed with or without BCAS2 in HeLa cells. The entire nucleus (A) or entire cytoplasm (B) was bleached. (A, A’) Representative images at the indicated timepoints (A) and the related fluorescence recovery curves (A’, n=7) showing the kinetics of nuclear import of S37A-β-catenin. (B, B’) Time-lapse imaging (B) and recovery curves (B’, n=7) from cytoplasmic photobleaching experiments reflecting the kinetics of nuclear export of S37A-β-catenin. (C) Quantitative analysis of fluorescence recoveries after photobleaching (n=7). ns, not significant, **p<0.01 (Student’s t-test). Scale bars, 10 μm (A, B).
Figure 5—figure supplement 2
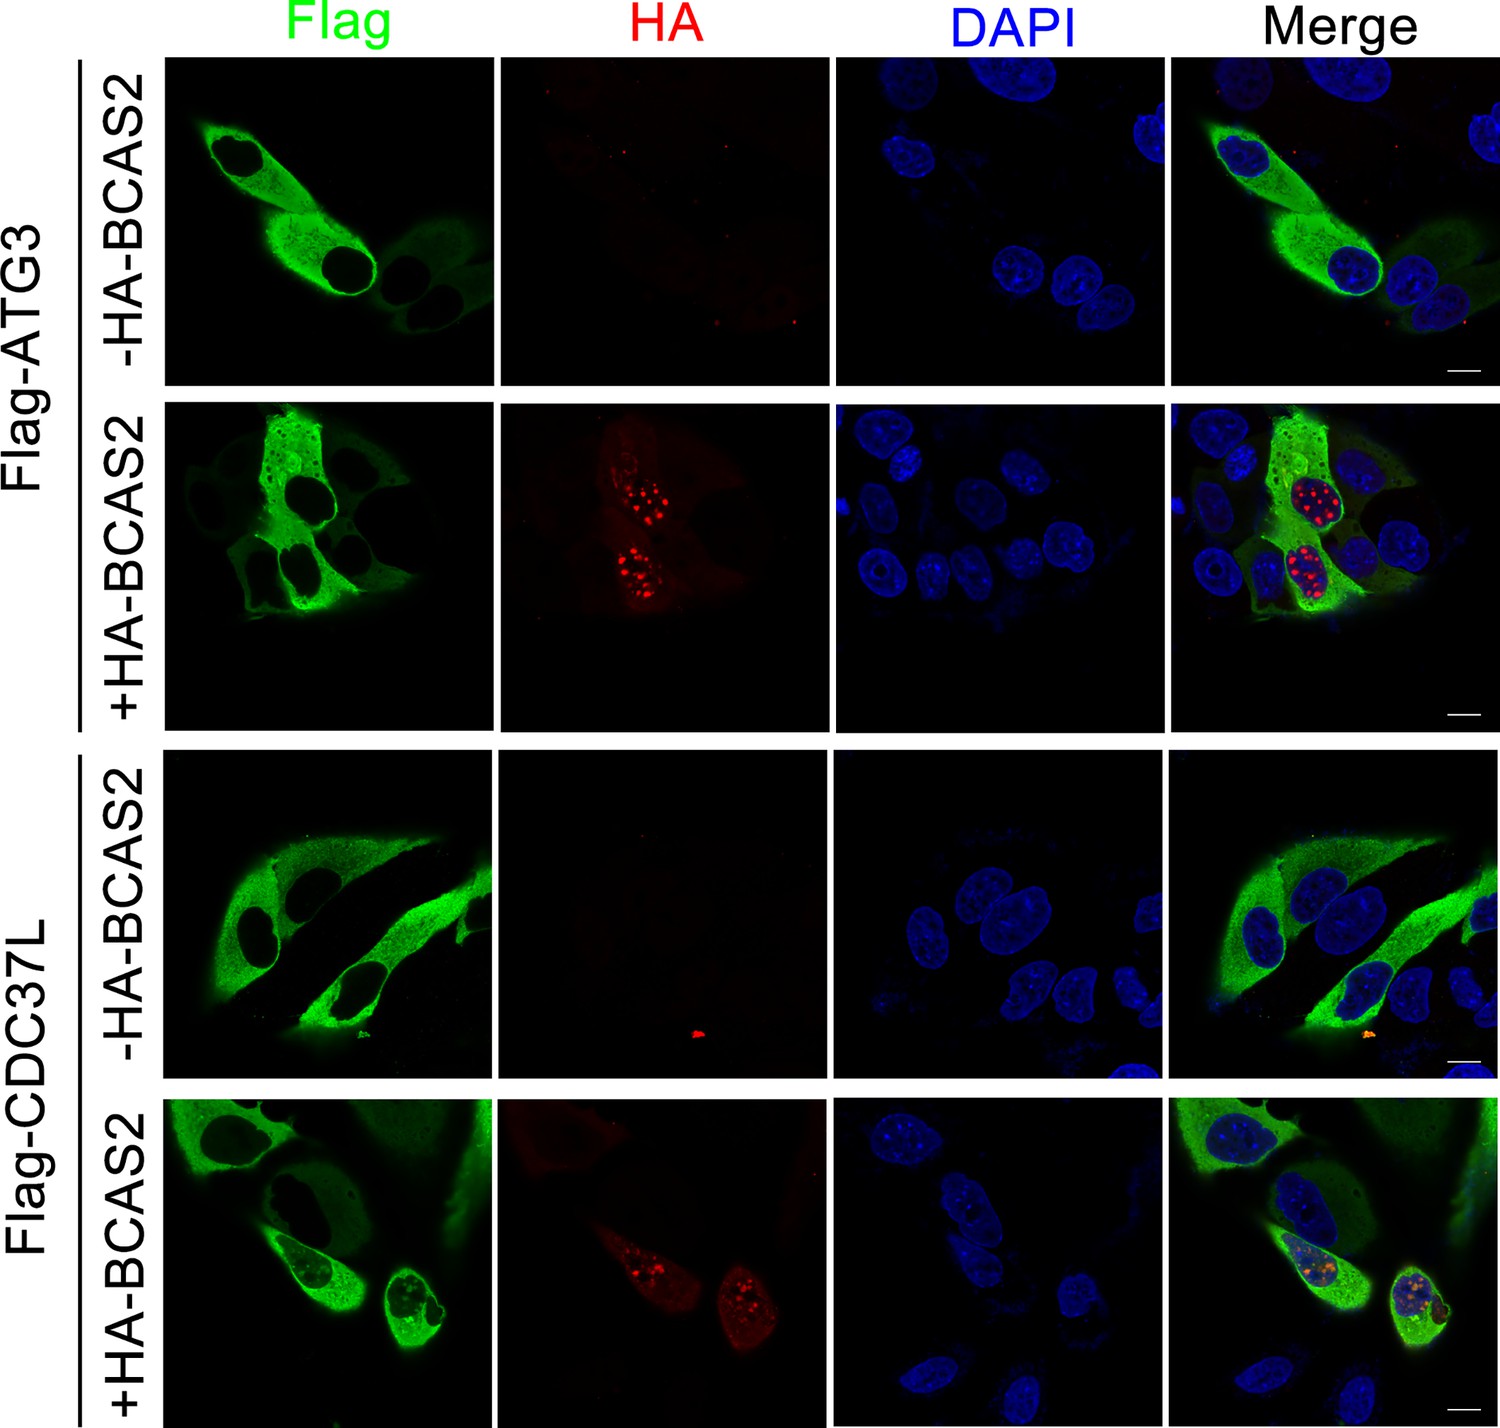
Overexpression of BCAS2 slightly enhances the nuclear accumulation of CDC37L and has no influence on the distribution of ATG3.
HeLa cells were transfected with the indicated plasmids and then subjected to immunostaining using anti-Flag and anti-HA antibodies. The nuclei were labeled with DAPI. Scale bar, 10 μm.
Figure 6 with 1 supplement
BCAS2 interacts with β-catenin.
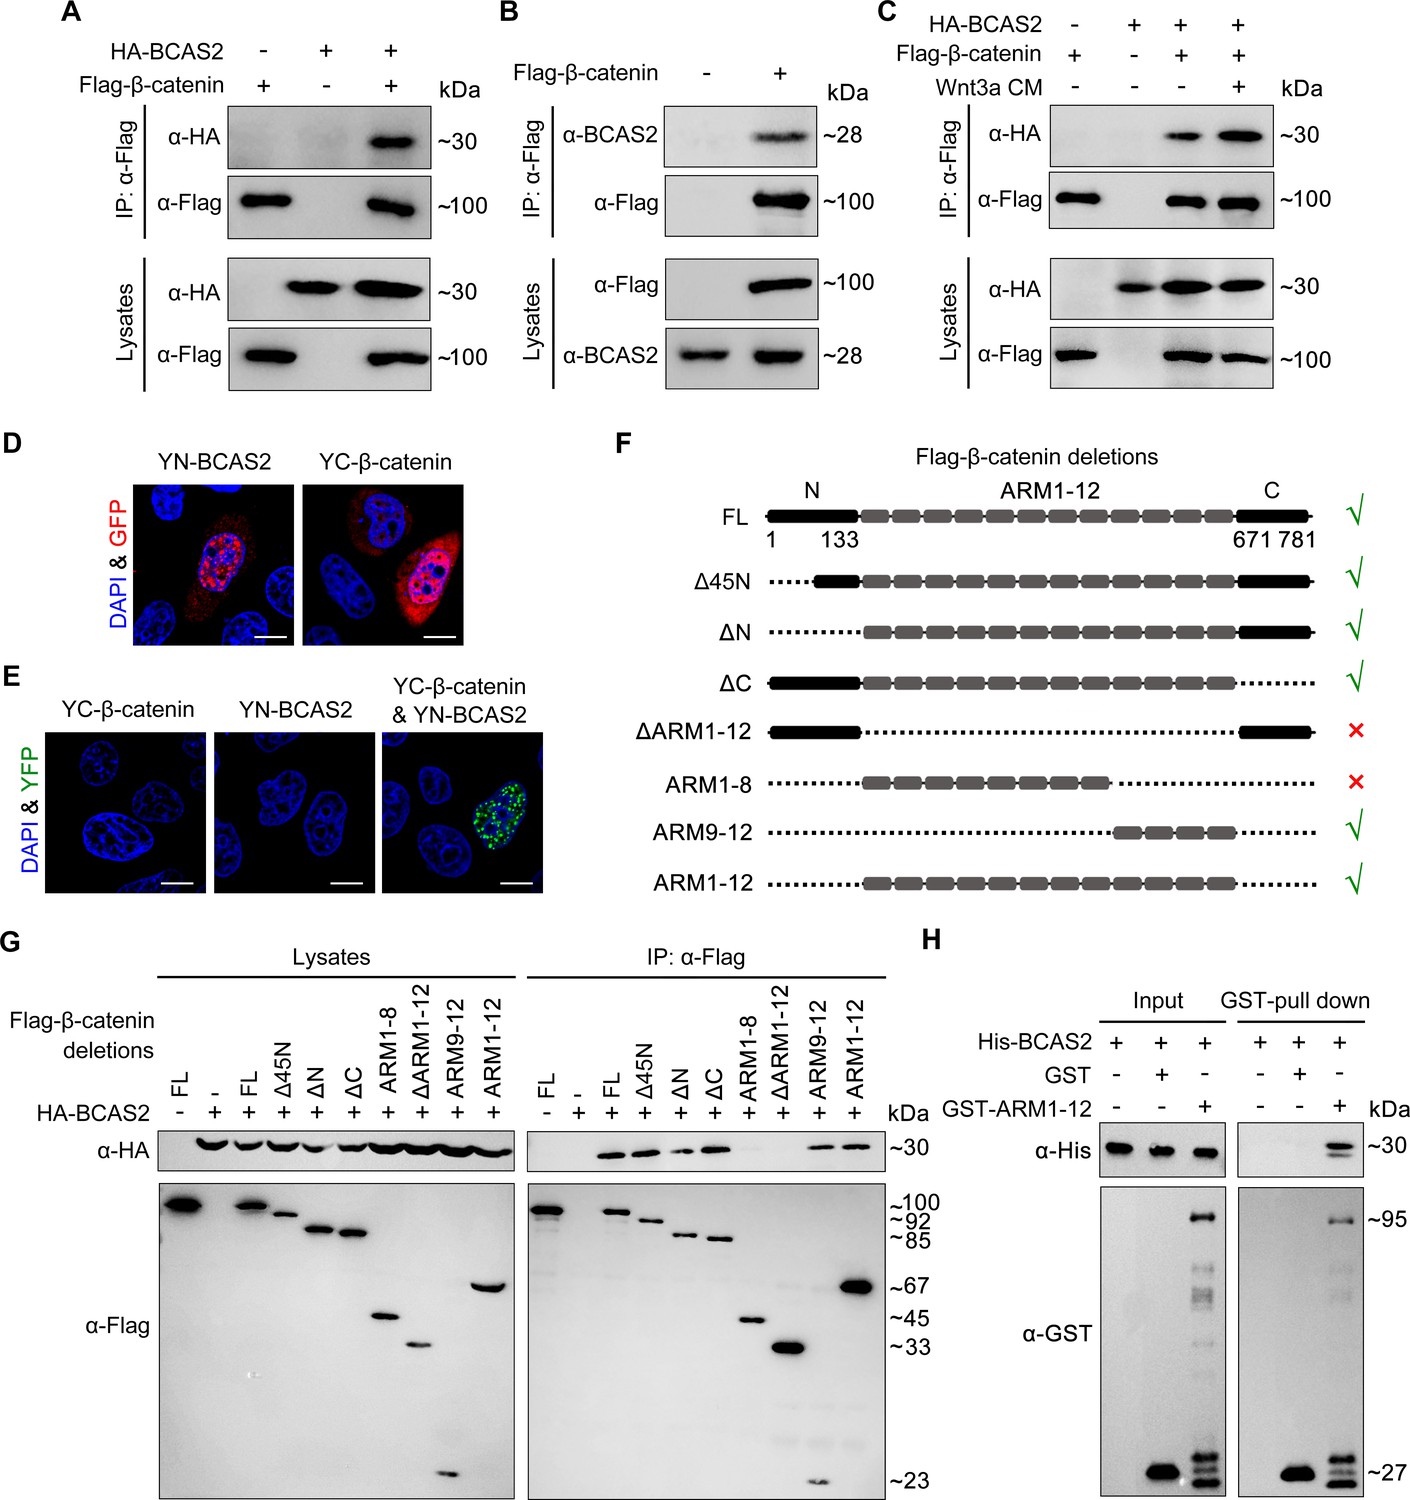
(A–C) Flag-tagged β-catenin was co-transfected with or without HA-tagged BCAS2 into HEK293T cells. Cell lysates were immunoprecipitated using anti-Flag antibody. Eluted proteins were analyzed by western blotting using indicated antibodies. In (C), for Wnt signaling activation, cells were treated with Wnt3a CM for 5 h before harvest. (D, E) YN-BCAS2 and YC-β-catenin were either individually or collectively transfected into HeLa cells. The expression of YN-BCAS2 and YC-β-catenin was analyzed with anti-GFP antibody (D). The reconstituted YFP fluorescence in living cells was detected by confocal laser scanning microscopy with excitation at 488 nm (E). (F) Schematics of full-length and deletion mutants of β-catenin. (G) HEK293T cells were transfected with HA-tagged BCAS2 and Flag-tagged deletion mutants of β-catenin. Cell lysates were then immunoprecipitated using anti-Flag antibody followed by western blot analysis. (H) GST pull-down assays were performed using bacterially expressed GST, GST-ARM1-12, and His-BCAS2. Scale bars, 10 μm (D, E).
-
Figure 6—source data 1
Original western blots for Figure 6A–C, G and H with the relevant bands and treatments indicated.
- https://cdn.elifesciences.org/articles/100497/elife-100497-fig6-data1-v1.zip
-
Figure 6—source data 2
Uncropped immunoblotting images in Figure 6A–C, G and H.
- https://cdn.elifesciences.org/articles/100497/elife-100497-fig6-data2-v1.zip
Figure 6—figure supplement 1
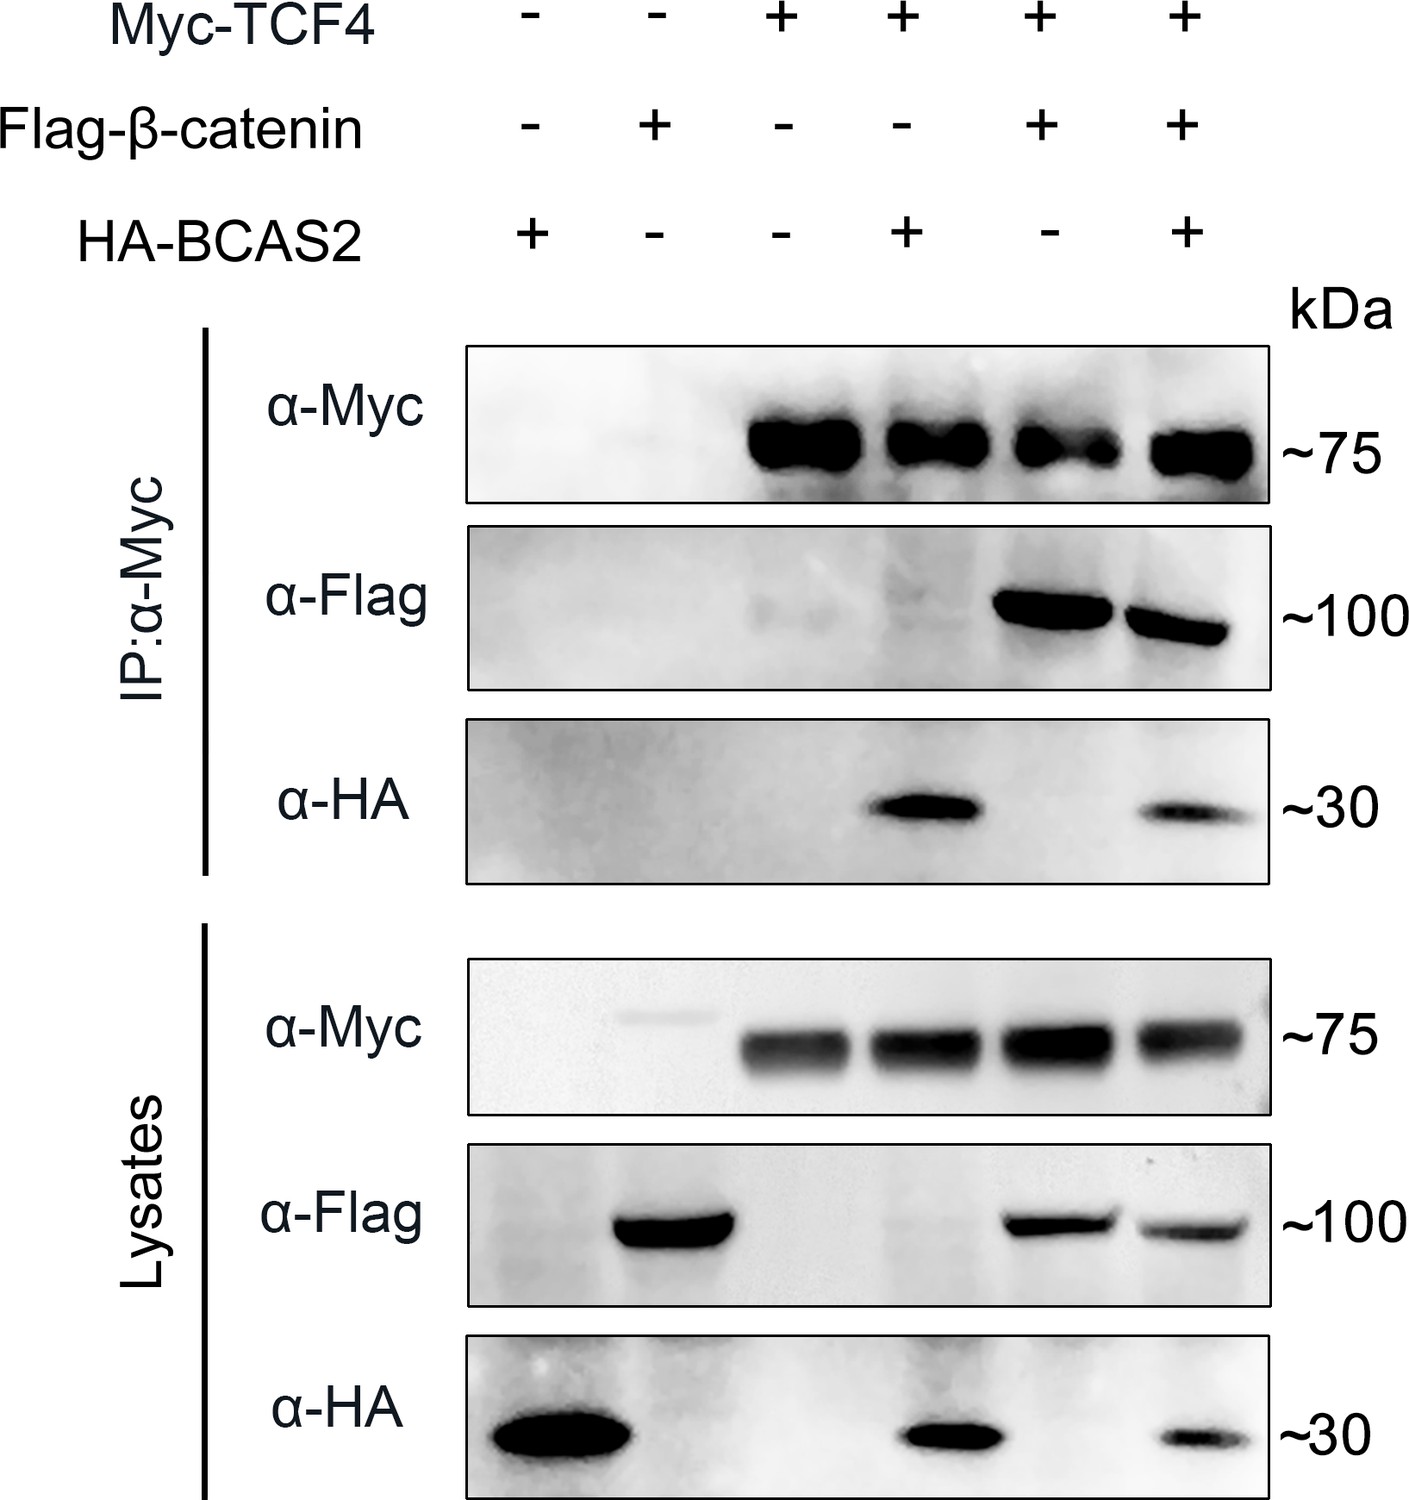
The interaction between β-catenin and TCF4 remains unaffected in the presence of BCAS2.
HEK293T cells were transfected with the indicated constructs. Cell lysates were immunoprecipitated using anti-c-Myc antibody and the eluted proteins were analyzed by western blotting.
-
Figure 6—figure supplement 1—source data 1
Original western blots for Figure 6—figure supplement 1, indicating the relevant bands and treatments.
- https://cdn.elifesciences.org/articles/100497/elife-100497-fig6-figsupp1-data1-v1.zip
-
Figure 6—figure supplement 1—source data 2
Original files for western blot analysis in Figure 6—figure supplement 1.
- https://cdn.elifesciences.org/articles/100497/elife-100497-fig6-figsupp1-data2-v1.zip
Figure 7 with 2 supplements
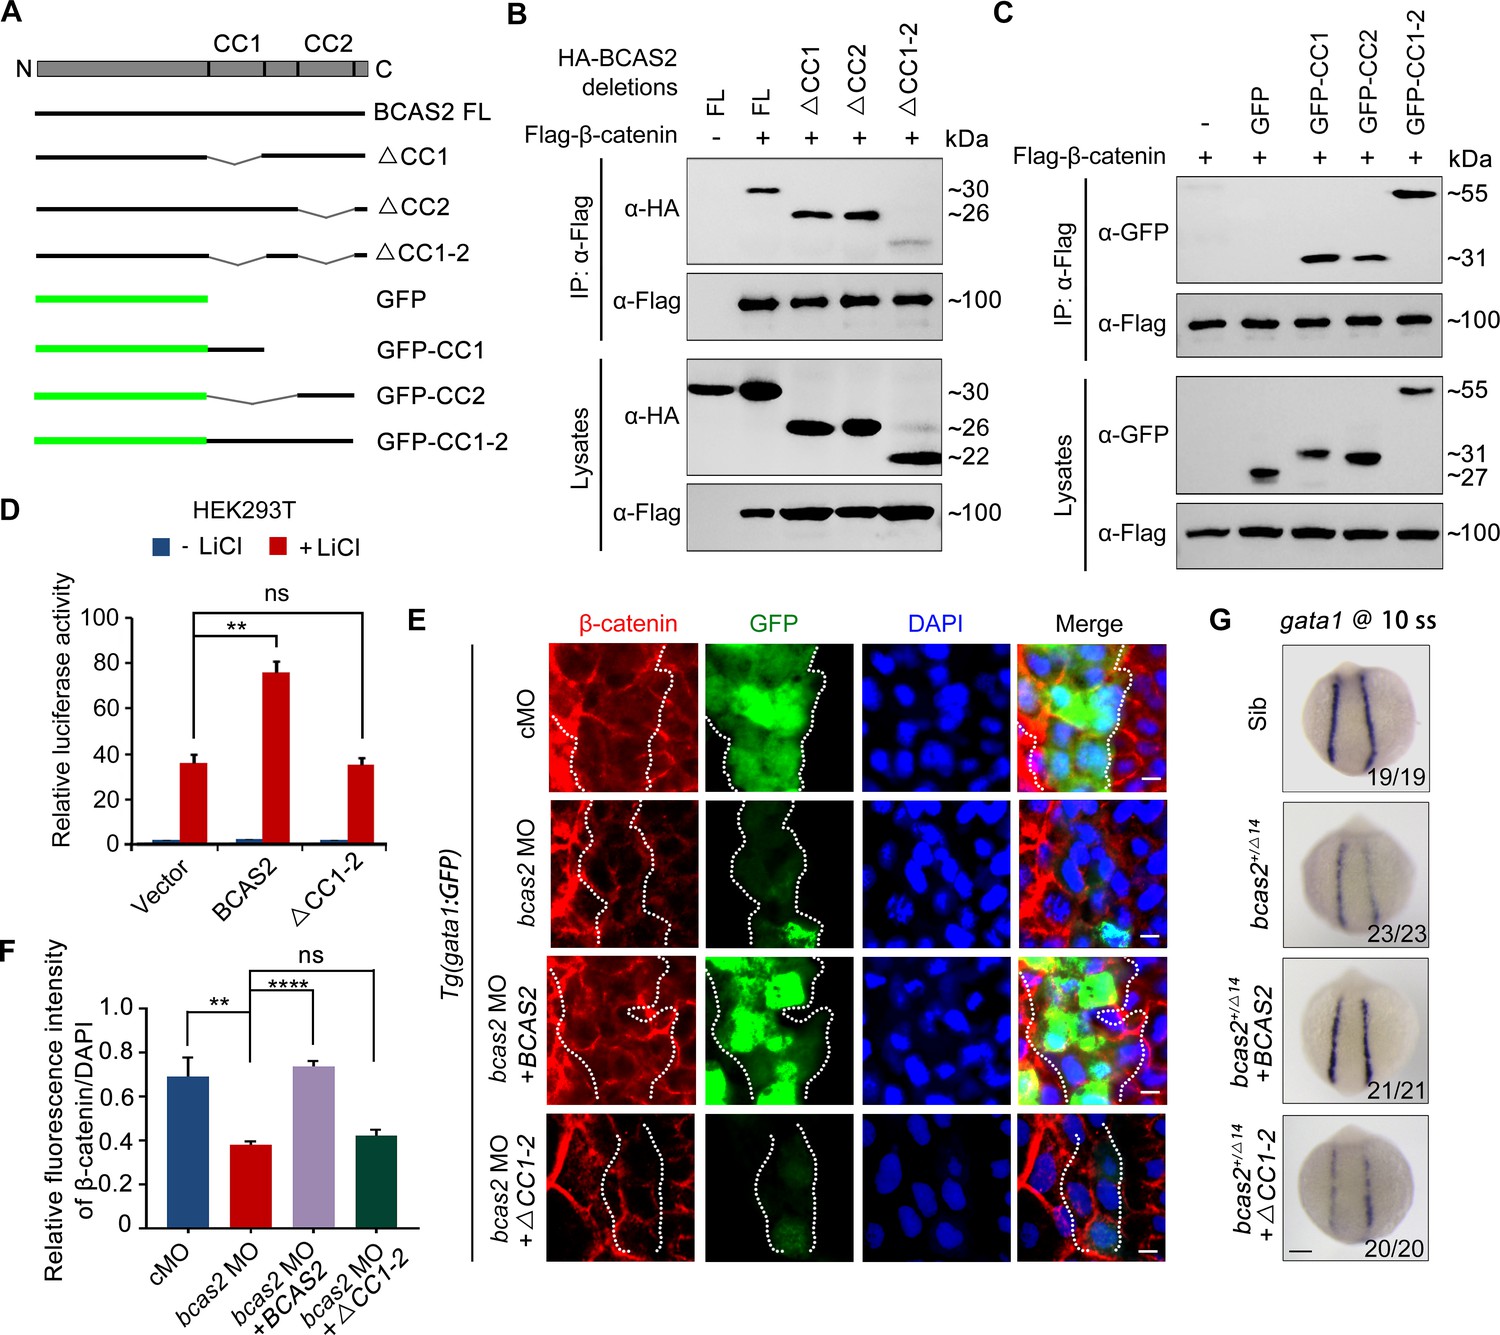
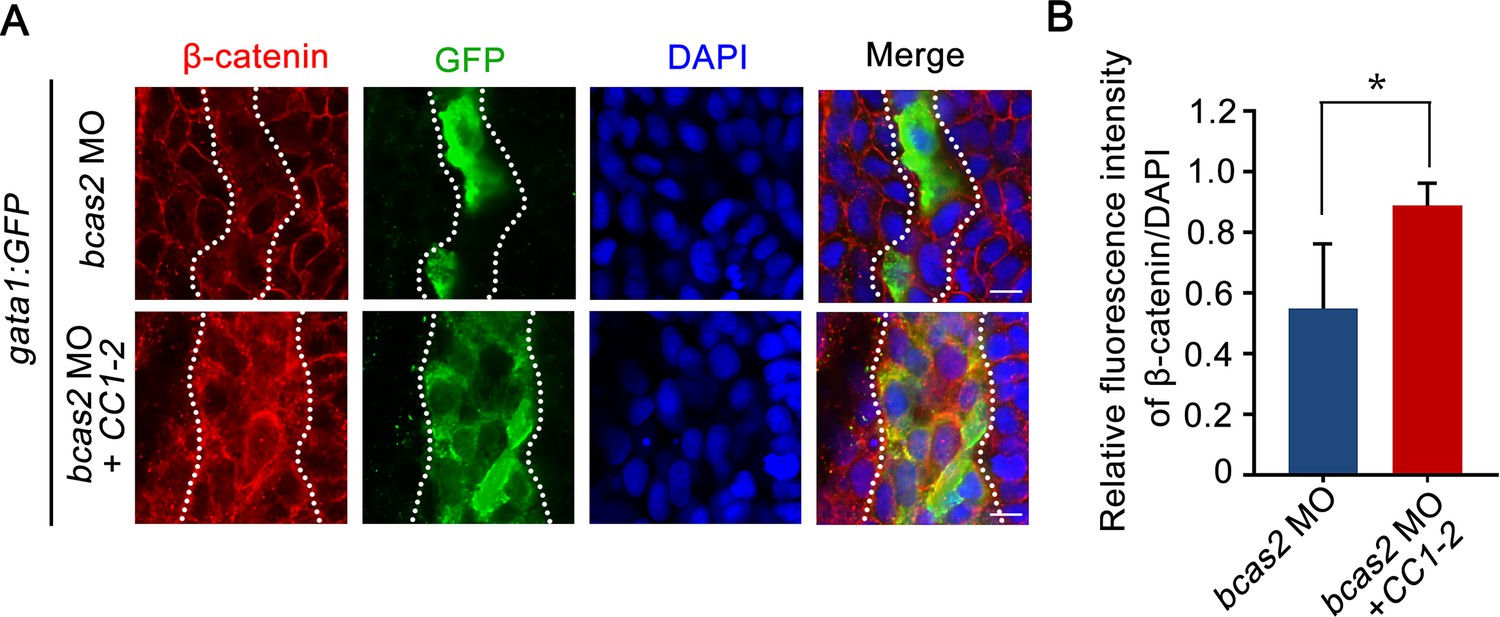
BCAS2 sequesters β-catenin in the nucleus via its CC domains.
(A) Schematics of full length and deletion mutants of BCAS2. (B, C) HEK293T cells were transfected with Flag-β-catenin and indicated deletion mutants of BCAS2. Cell lysates were subjected to immunoprecipitation with anti-Flag antibody. Eluted proteins were immunoblotted using anti-HA (B) or anti-GFP antibodies (C) for BCAS2 detection. (D) HEK293T cells transfected with the indicated plasmids were treated with 100 ng/ml LiCl for 12 h, and then subjected to luciferase assay (n=3). ns, not significant; **p<0.01 (Student’s t-test). (E, F) Immunofluorescence staining of β-catenin in Tg(gata1:GFP) embryos at 16 hpf. The embryos were injected with 8 ng bcas2 MO and 300 pg of full-length BCAS2 mRNA or ΔCC1-2 mRNA at the one-cell stage. The relative fluorescence intensity of nuclear β-catenin was quantified in (F) (n=5). ns, not significant; **p<0.01; ****p<0.0001 (Student’s t-test). (G) Transcripts of gata1 were evaluated by WISH in bcas2+/Δ14 embryos injected with 300 pg of BCAS2 mRNA or ΔCC1-2 mRNA. Scale bars, 5 μm (E), 100 μm (G).
-
Figure 7—source data 1
Original western blots for Figure 7B and C, indicating the relevant bands and treatments.
- https://cdn.elifesciences.org/articles/100497/elife-100497-fig7-data1-v1.zip
-
Figure 7—source data 2
Original files for western blot analysis in Figure 7B and C.
- https://cdn.elifesciences.org/articles/100497/elife-100497-fig7-data2-v1.zip
Figure 7—figure supplement 1
Overexpression of the CC domains of BCAS2 restores nuclear β-catenin accumulation in bcas2 morphants.
Immunofluorescence staining of β-catenin in Tg(gata1:GFP) embryos at 16 hpf. The embryos were injected with 8 ng bcas2 MO and 300 pg of BCAS2 CC1-2 mRNA at the one-cell stage. The dotted lines show the GFP-positive hematopoietic progenitor cells. The relative fluorescence of β-catenin was quantified in (B) (n=6). *p<0.05 (Student’s t-test). Scale bars, 10 μm (A).
Figure 7—figure supplement 2
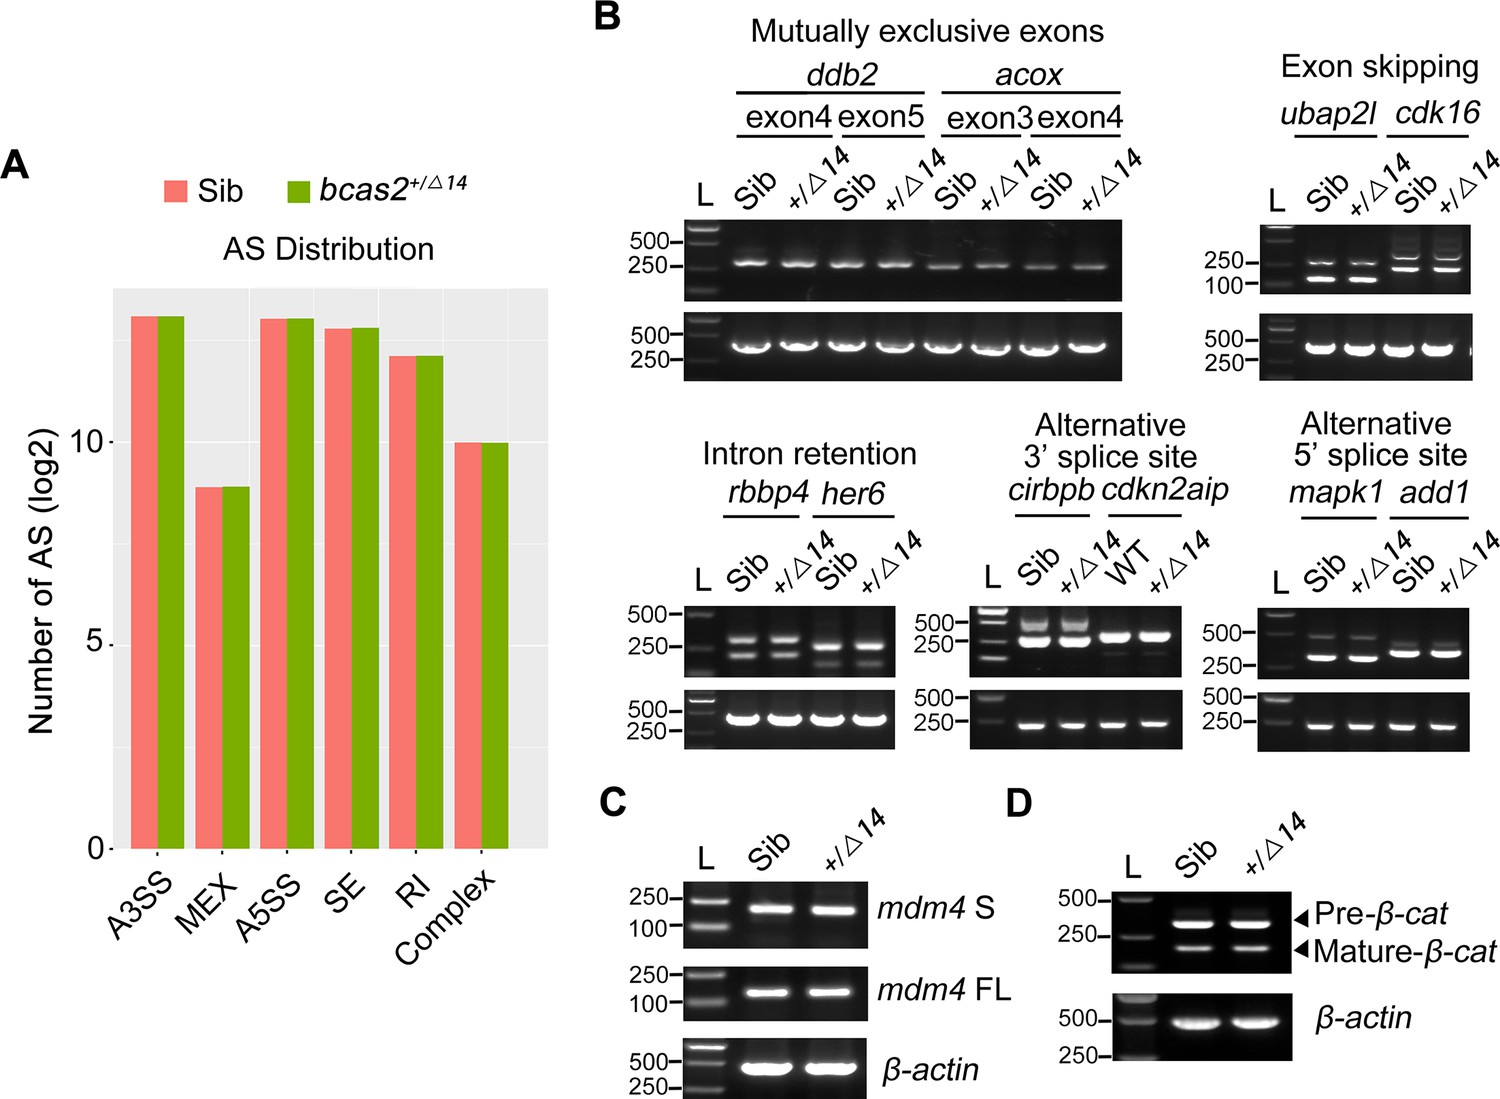
Haploinsufficiency of bcas2 does not affect pre-mRNA splicing during primitive hematopoiesis.
(A) The number of five major types of alternative splicing events was analyzed from RNA sequencing data. Embryos were lysed at the 10-somite stage and subjected to reverse transcription. The cDNA library was prepared, sequenced and then analyzed using rMATS. The five main alternative splicing types refer to exon skipping (SE), alternative 3’ splicing site (A3SS), alternative 5’ splicing site (A5SS), intron retention (RI), and mutually exclusive exons (MEX). (B) Examples of different types of alternative splicing were analyzed by reverse transcription PCR using total RNA from sibling and bcas2+/Δ14 embryos at the 10-somite stage. (C) Reverse transcription PCR analysis of total mdm4-FL and mdm4-S isoforms in bcas2+/Δ14 and sibling embryos at the 10-somite stage. (D) Analysis the pre-mRNA and mature mRNA of β-catenin in bcas2+/Δ14 and sibling embryos at the 10-somite stage.
-
Figure 7—figure supplement 2—source data 1
PDF file containing original gel images for Figure 7—figure supplement 2B, C, D with the relevant bands indicated.
- https://cdn.elifesciences.org/articles/100497/elife-100497-fig7-figsupp2-data1-v1.zip
-
Figure 7—figure supplement 2—source data 2
Original gel images in Figure 7—figure supplement 2B, C, D.
- https://cdn.elifesciences.org/articles/100497/elife-100497-fig7-figsupp2-data2-v1.zip
Additional files
-
MDAR checklist
- https://cdn.elifesciences.org/articles/100497/elife-100497-mdarchecklist1-v1.docx
-
Supplementary file 1
Primers used for genotyping.
- https://cdn.elifesciences.org/articles/100497/elife-100497-supp1-v1.docx
-
Supplementary file 2
Primers used for reverse transcription-PCR.
- https://cdn.elifesciences.org/articles/100497/elife-100497-supp2-v1.docx
Download links
A two-part list of links to download the article, or parts of the article, in various formats.
Downloads (link to download the article as PDF)
Open citations (links to open the citations from this article in various online reference manager services)
Cite this article (links to download the citations from this article in formats compatible with various reference manager tools)
BCAS2 promotes primitive hematopoiesis by sequestering β-catenin within the nucleus
eLife 13:RP100497.
https://doi.org/10.7554/eLife.100497.3


