Stepwise nucleosome translocation by RSC remodeling complexes
- Harvard University, United States
- Howard Hughes Medical Institute, Harvard University, United States
- Harvard Medical School, United States
- University of Texas M.D. Anderson Cancer Center, United States
Figures
Figure 1 with 4 supplements
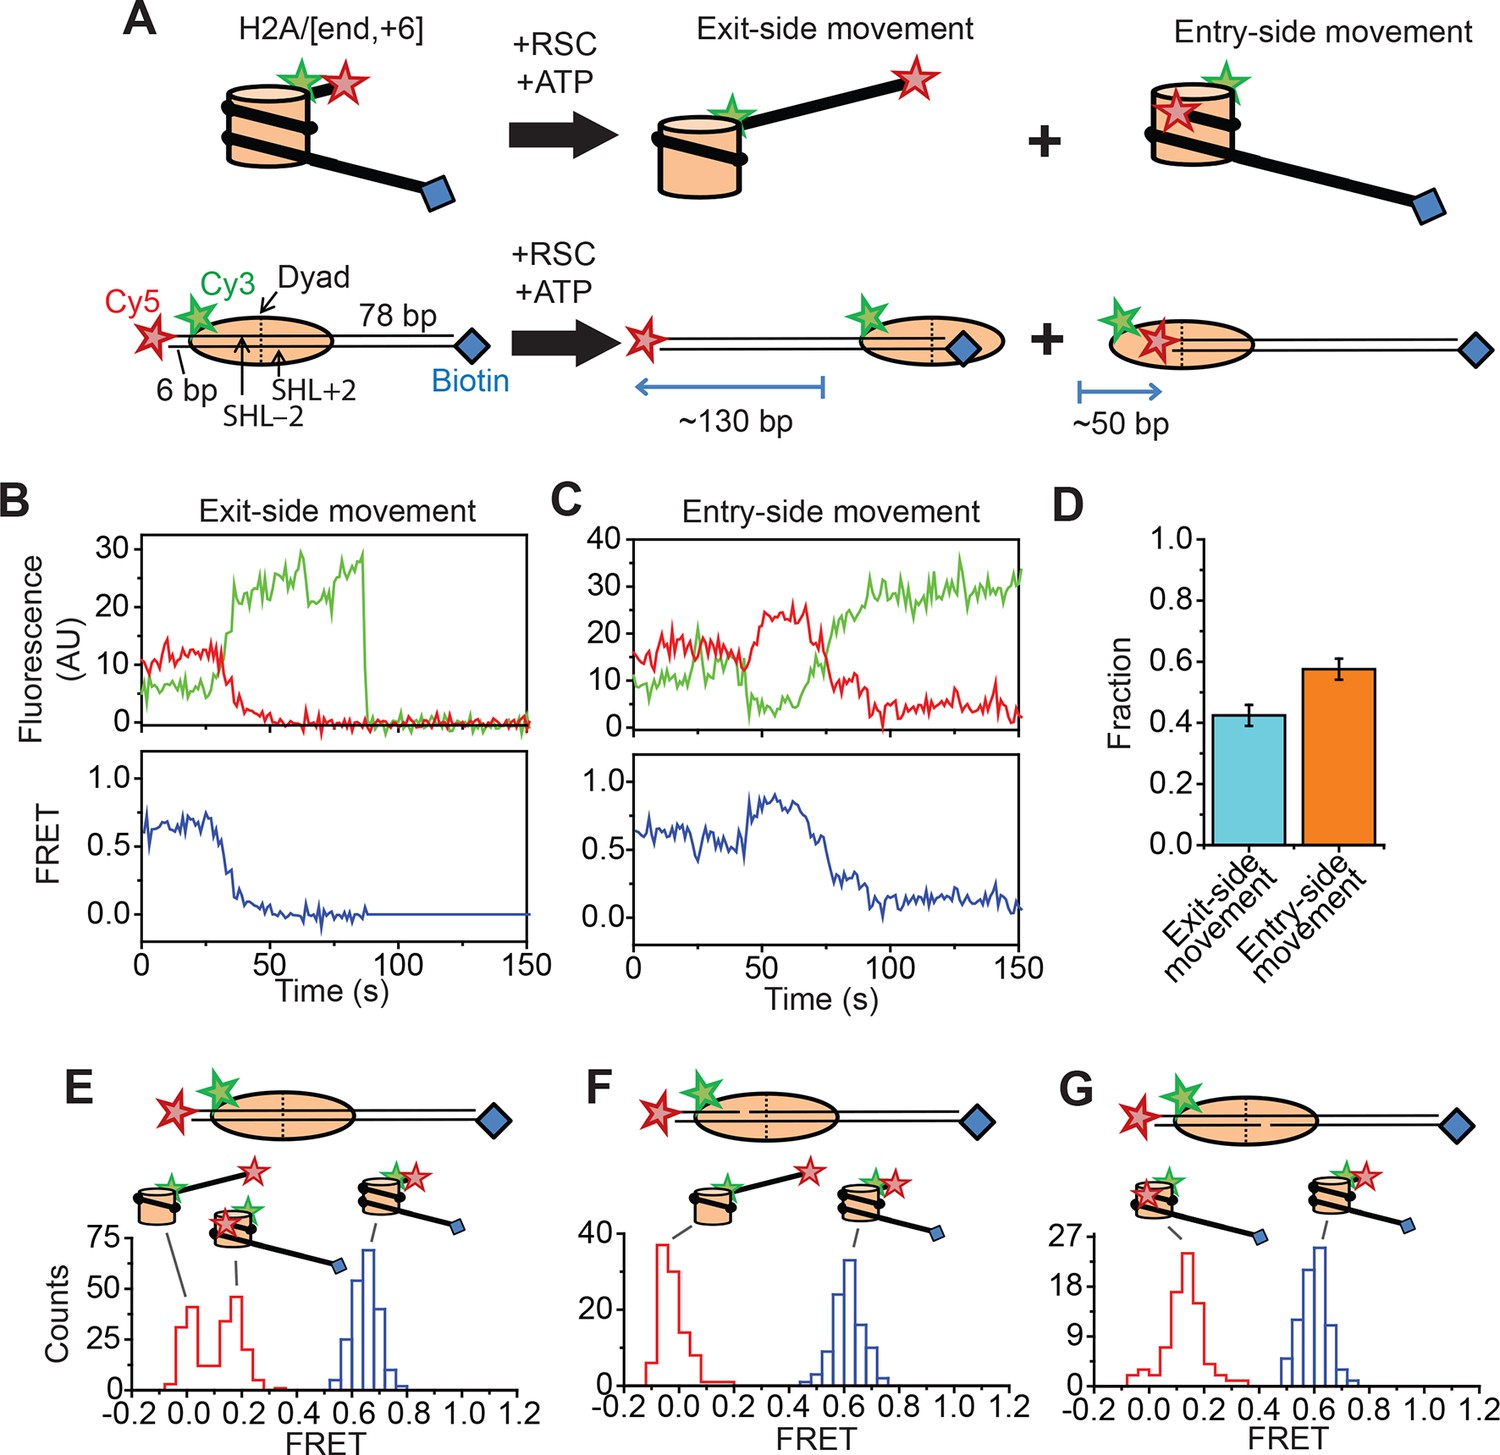
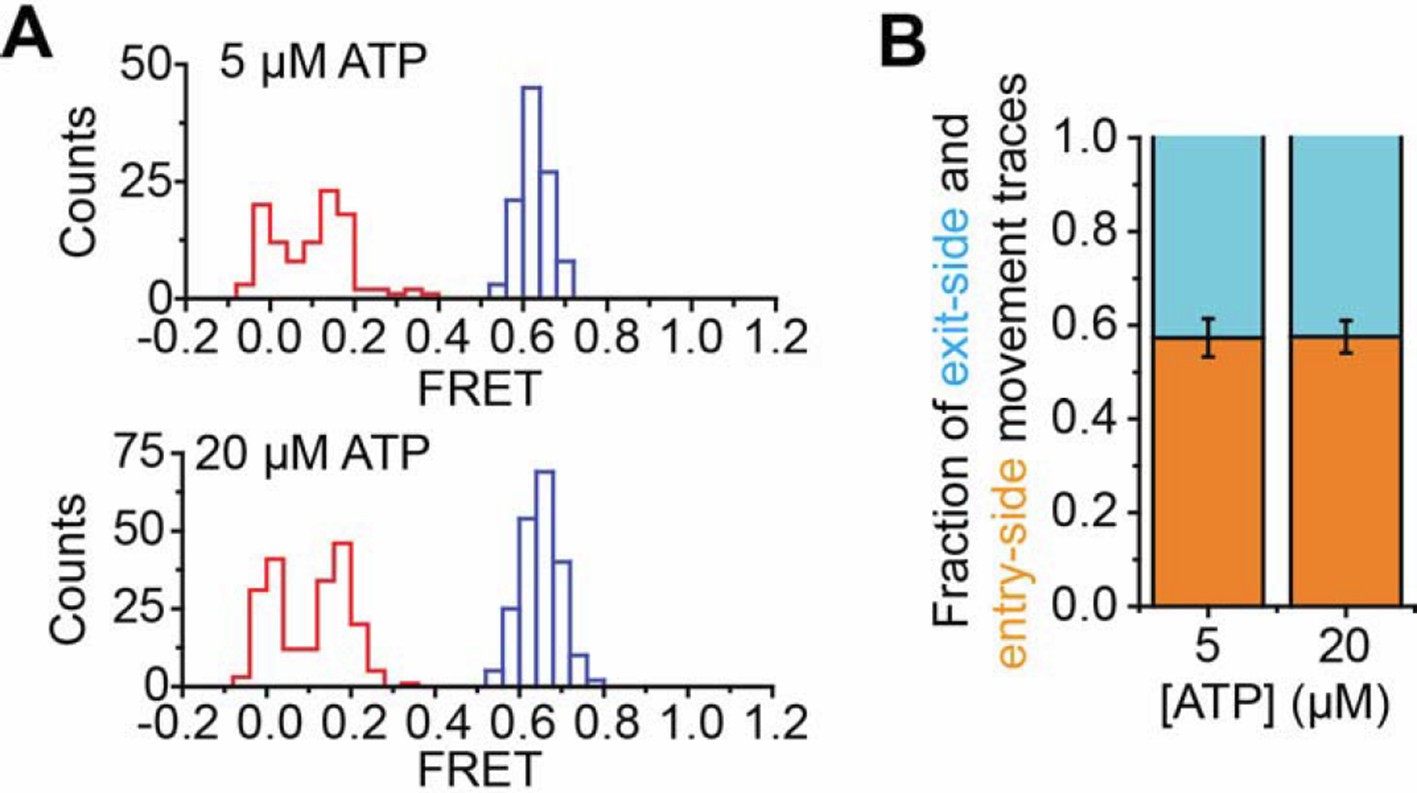
Single-molecule FRET assay for monitoring nucleosome translocation by RSC.
(A) Diagram depicting the nucleosome substrates before and after remodeling by RSC. The top row depicts the nucleosomes in cartoon form while the bottom row shows the footprint of the histone octamer (tan oval) on the DNA (black lines). (B and C) Representative traces showing the Cy3 intensity (green), Cy5 intensity (red), and FRET value (blue) for exit-side movement (B) and entry-side movement (C). [RSC] = 5 nM, [ATP] = 5 µM. (D) The fraction of exit-side movement (cyan) and entry-side movement (orange) traces observed with 1 nM RSC and 20 µM ATP. Error bars represent the standard error from > 200 nucleosomes. (E–G) Histograms of the distribution of initial (before remodeling, blue) and final (after remodeling, red) FRET values of remodeling traces from nucleosomes lacking any ssDNA gap (E), nucleosomes with a 2-nt ssDNA gap at the SHL–2 site (F), and nucleosomes with a 2-nt ssDNA gap at the SHL+2 site (G). [RSC] = 1 nM, [ATP] = 20 µM.
Figure 1—figure supplement 1
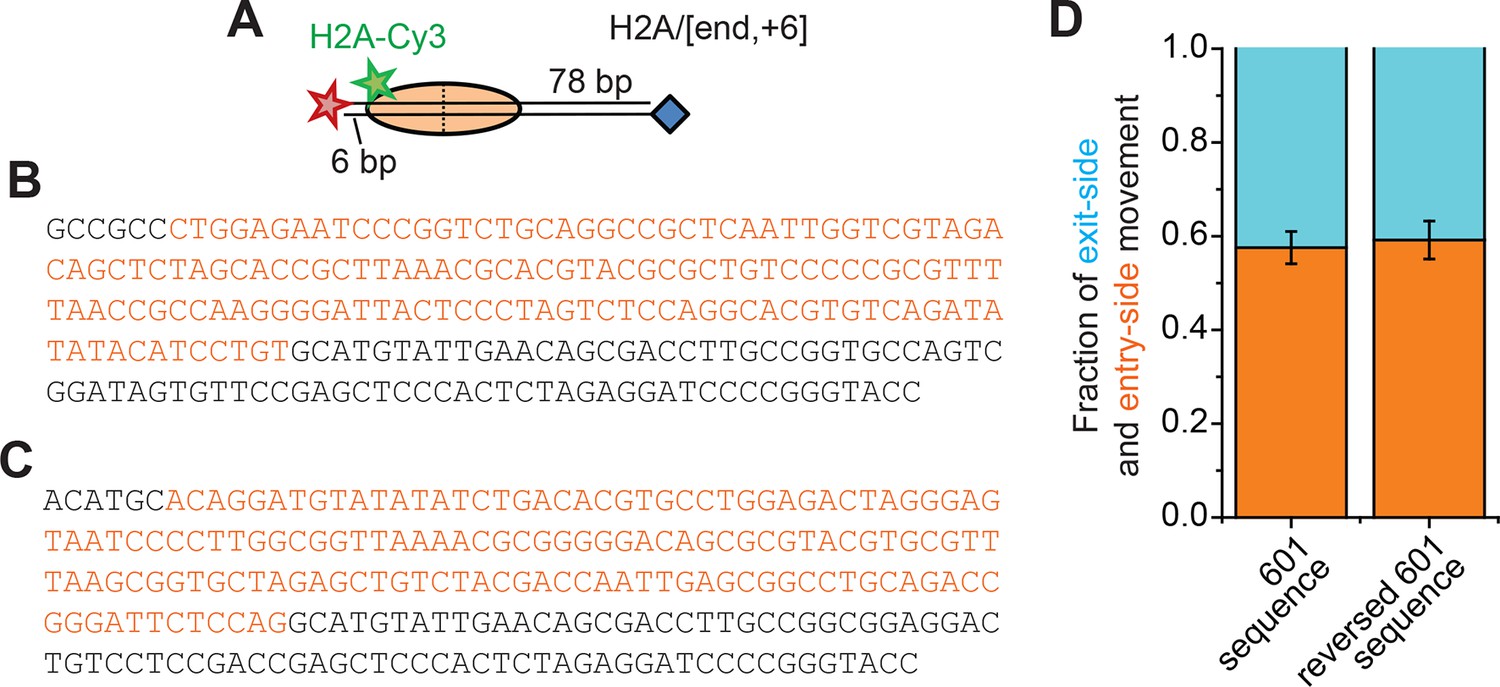
Remodeling of nucleosomes with a reversed 601 positioning sequence.
(A) Cartoon of the H2A/[end,+6] nucleosome construct (B) Sequence of the top strand of the DNA molecule used for the H2A/[end,+6] nucleosomes with the 601 positioning sequence shown in orange. (C) Sequence of the top strand of the DNA molecule in which the orientation of the 601 positioning sequence (orange) has been reversed. (D) The fraction of exit-side movement (cyan) and entry-side movement (orange) traces observed when remodeling nucleosomes with the DNA containing the 601 sequence from panel B (reproduced from Figure 1D for comparison) or the DNA sequence from panel C containing the reversed 601 positioning sequence. [RSC] = 1 nM, [ATP] = 20 µM. Error bars represent the standard error from > 100 nucleosomes.
Figure 1—figure supplement 2
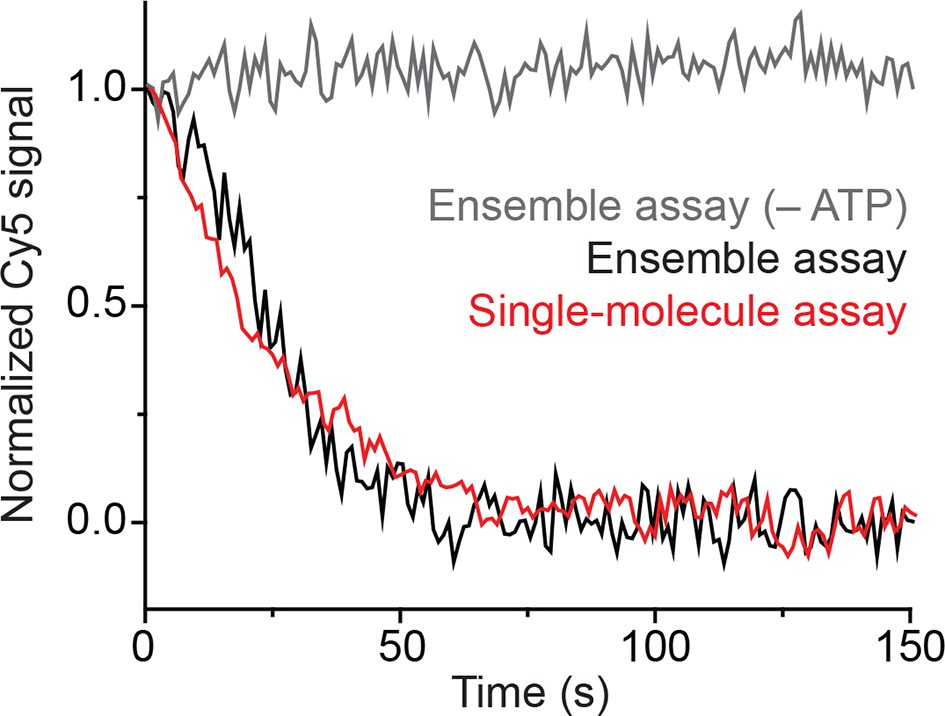
Surface anchoring of the nucleosomes does not affect the kinetics of remodeling.
Comparison of the average remodeling kinetics for freely diffusing nucleosomes in the absence (grey, ensemble assay) or presence of ATP (black, ensemble assay), and surface-tethered nucleosomes in the presence of ATP (red, single-molecule assay). The remodeling kinetics were monitored by reading the Cy5 intensity over time and normalizing the initial and steady-state values to 1 and 0, respectively. The Cy5 intensities in the single-molecule assay were determined by summing the Cy5 signals from ~2000 single-nucleosome traces. [RSC] = 6 nM, [ATP] = 20 µM.
Figure 1—figure supplement 3
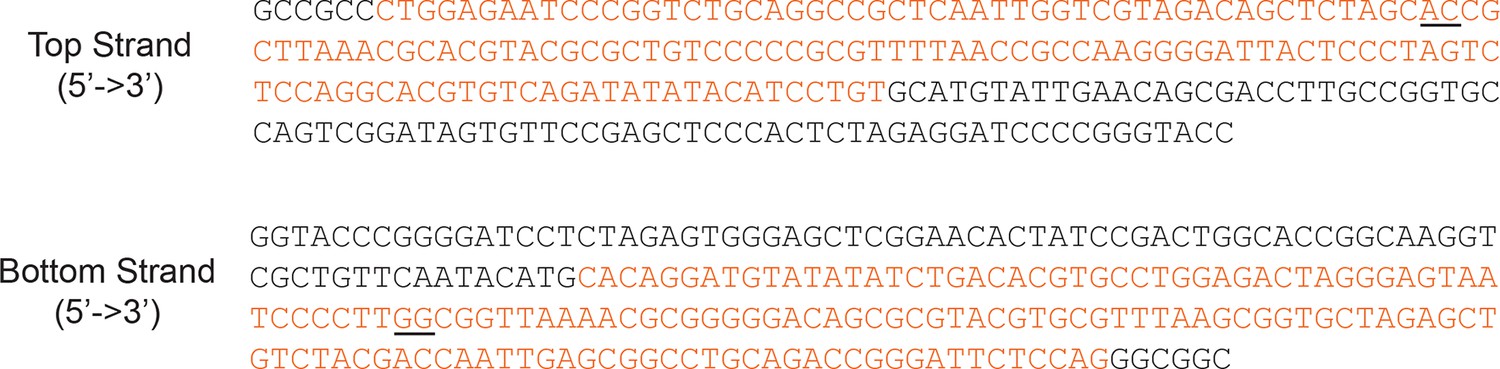
Locations of the 2-nt ssDNA gaps in the DNA sequence.
The sequence of the DNA used for the top and bottom strands of the H2A/[end,+6] and H3/[end,+6] nucleosomes is shown with the 601 positioning sequence colored orange. To create a gap at the SHL–2 site, the underlined nucleotides in the top strand were replaced with a 2-nt gap. To create a gap at the SHL+2 site, the underlined nucleotides in the bottom strand were replaced with a 2-nt gap. RSC translocates on DNA with a 3’→5’ polarity (Saha et al., 2005), and the gaps are positioned to prevent translocation in that direction. However, it has been previously shown that gaps in either strand prevent DNA translocation by RSC (Saha et al., 2005).
Figure 1—figure supplement 4
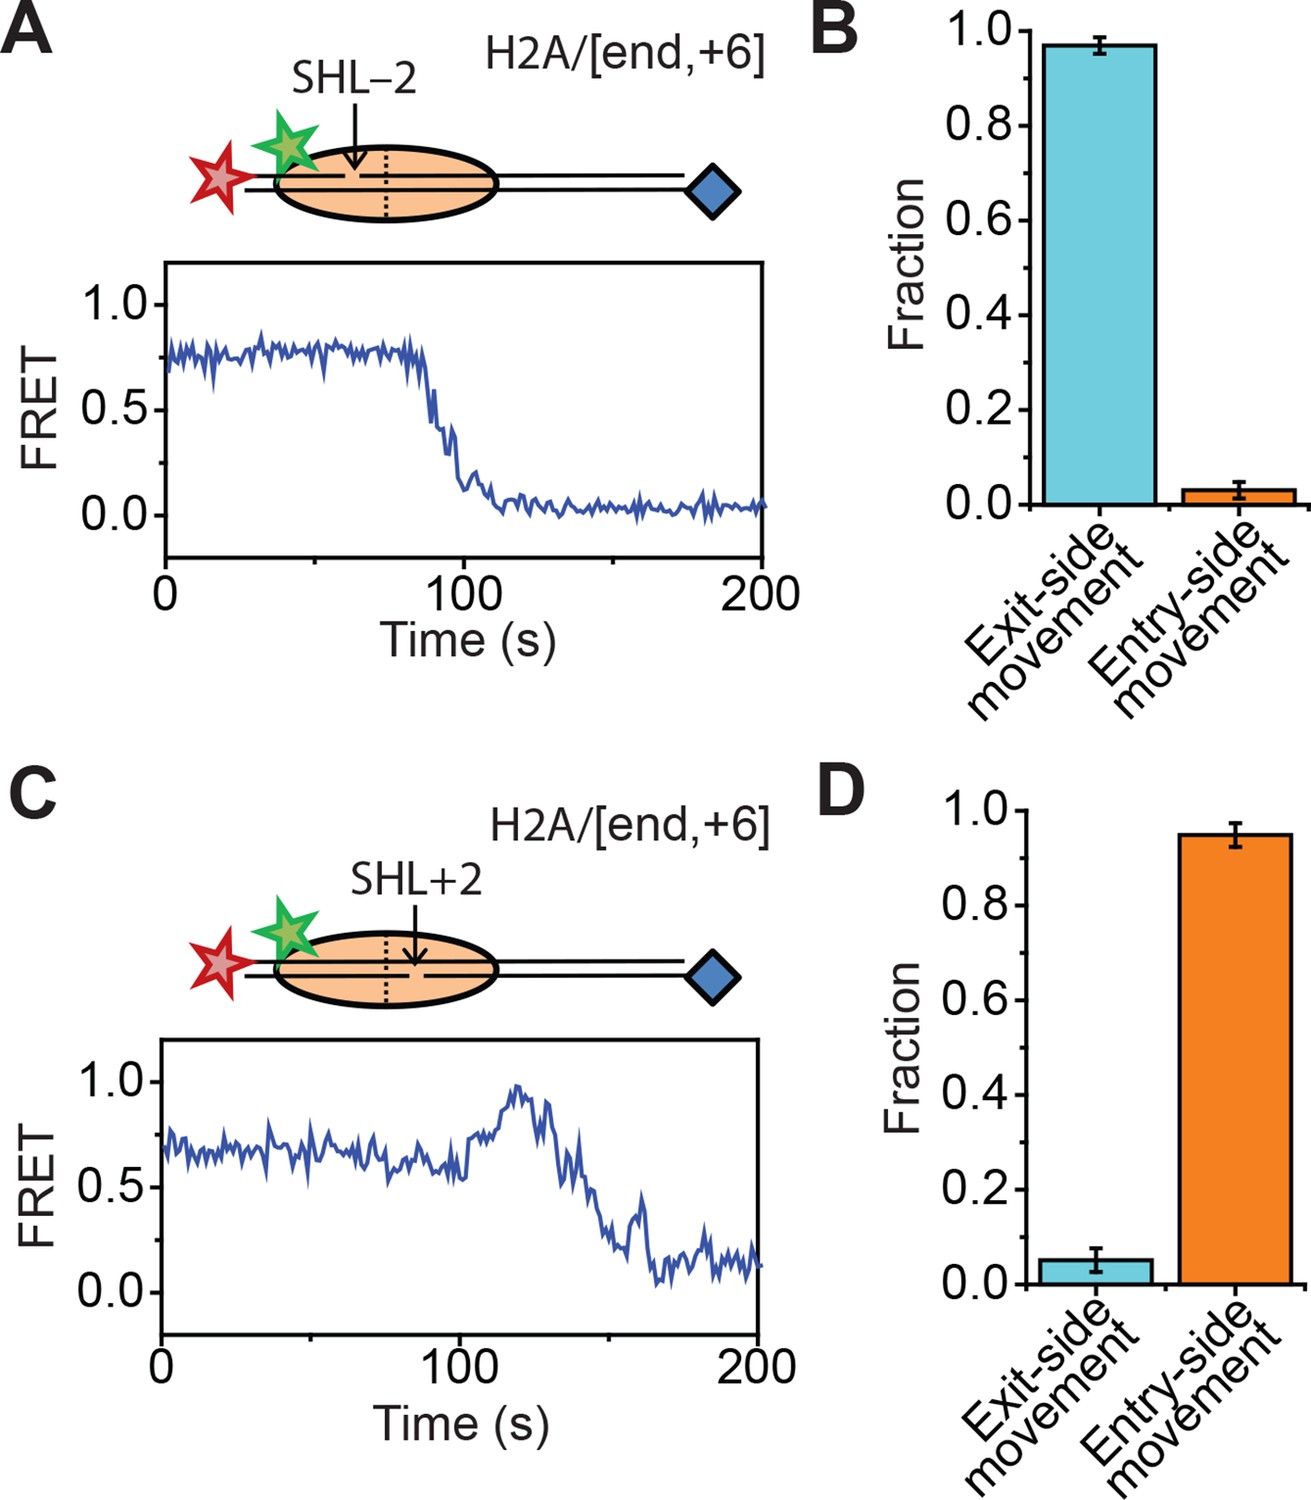
Effects of 2-nt ssDNA gaps at the SHL ± 2 sites on the direction of nucleosome translocation.
(A and C) Top: cartoon of the H2A/[end+6] nucleosome with a 2-nt ssDNA gap at the SHL–2 site (A) or SHL+2 site (C). Bottom: Representative FRET traces from the remodeling of constructs with a gap at the SHL–2 site (A) and SHL+2 site (C). [RSC] = 1 nM, [ATP] = 5 µM. (B and D) The fraction of traces showing exit-side movement (cyan) and entry-side movement (orange) observed during the remodeling of constructs with a gap at the SHL–2 (B) or SHL+2 (D) sites. Error bars represent the standard error from > 100 nucleosomes per construct. [RSC] = 1nM, [ATP] = 20µM.
Figure 2 with 2 supplements
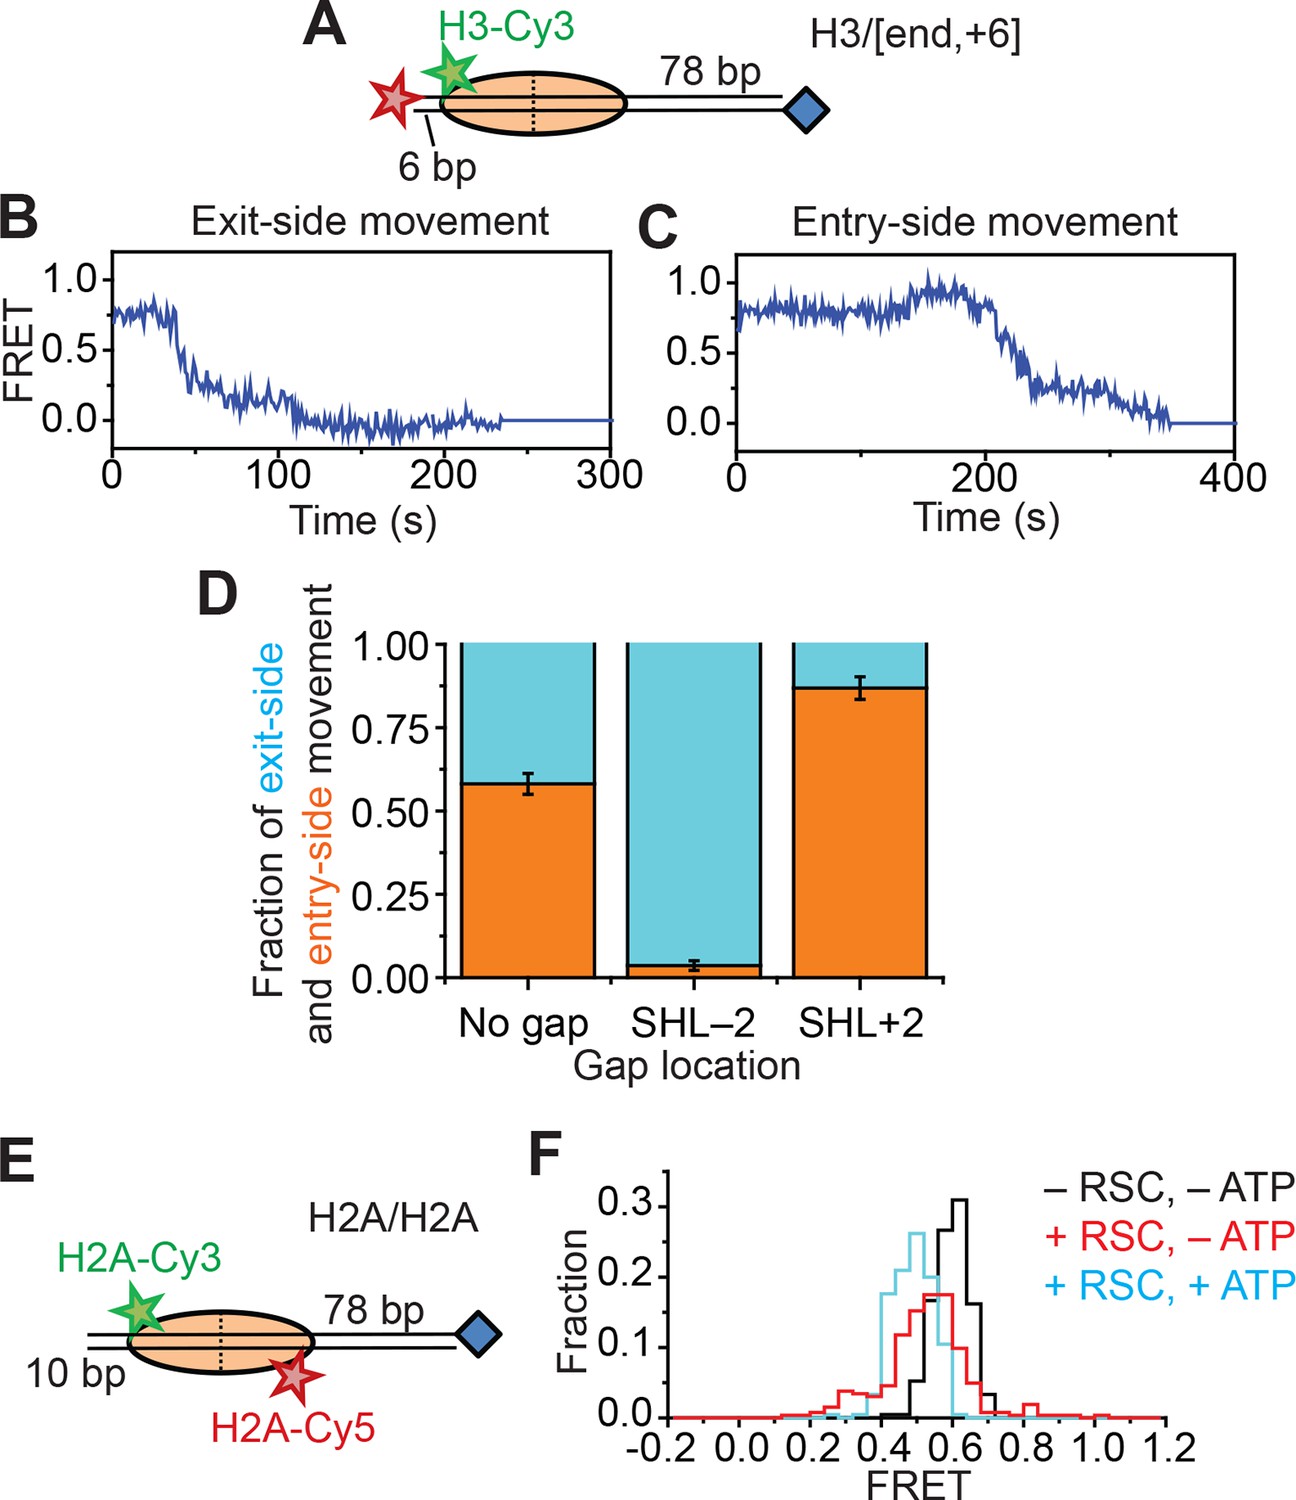
Single-molecule FRET assay for probing the displacement of the H2A-H2B dimer during RSC-mediated nucleosome remodeling.
(A) Diagram of the H3/[end,+6] nucleosome. (B and C) Representative FRET traces reflecting the exit-side movement (B) and entry-side movement (C) of the H3/[end,+6] nucleosomes. [RSC] = 1 nM, [ATP] = 2 µM. (D) Fraction of traces showing entry-side movement (orange) and exit-side movement (cyan) observed with 1 nM RSC and 20 µM ATP for nucleosomes lacking any ssDNA gap, nucleosomes with a 2-nt ssDNA gap at the SHL–2 site, and nucleosomes with a 2-nt ssDNA gap at the SHL+2 site. Error bars represent the standard error from > 100 nucleosomes per construct. (E) Diagram of the H2A/H2A nucleosomes. (F) Histogram of the FRET values from the H2A/H2A nucleosomes in the absence of RSC (black), after the addition of 6 nM RSC (red), or after the addition of 6 nM RSC and 5 µM ATP (cyan). Histograms were constructed from >200 nucleosomes per condition.
Figure 2—figure supplement 1
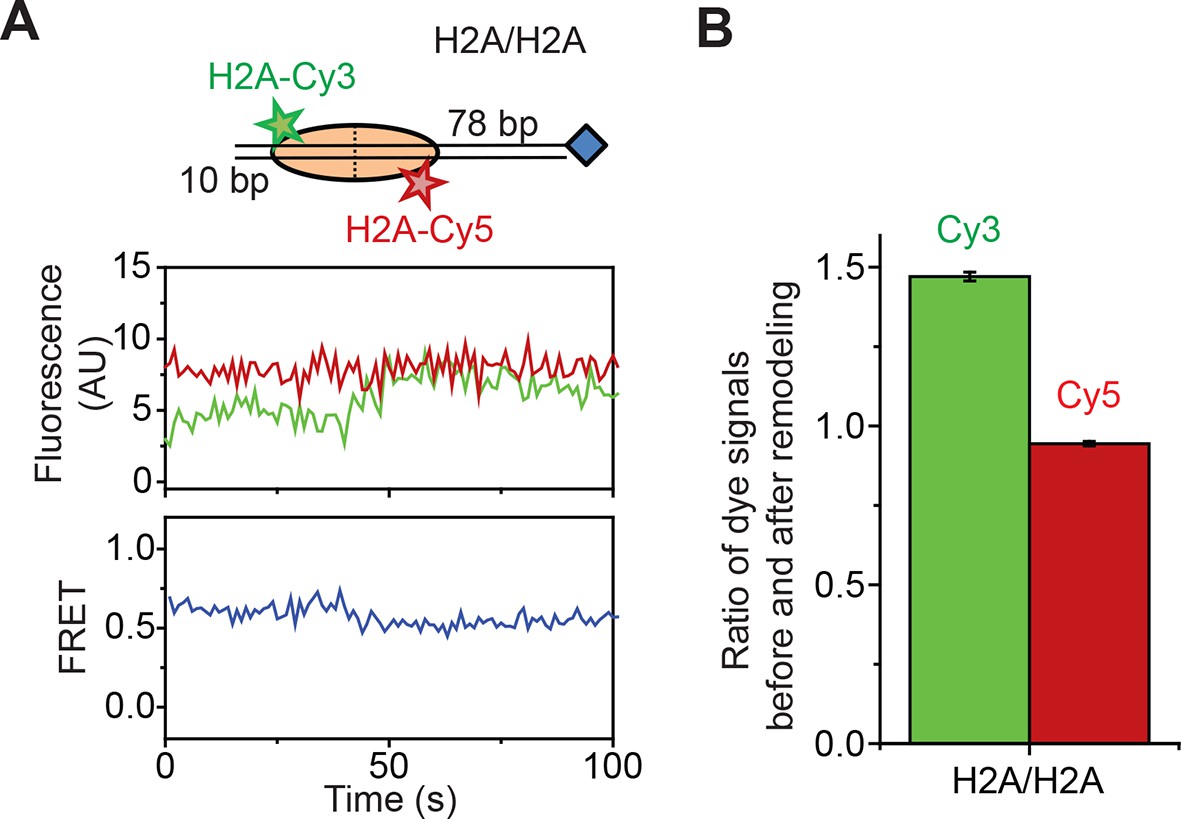
Remodeling of the H2A/H2A construct by RSC.
(A) Top: Cartoon of the H2A/H2A nucleosome construct. Bottom: Representative Cy3 intensity, Cy5 intensity, and FRET traces when H2A/H2A nucleosomes are incubated with 6 nM RSC and 5 µM ATP. (B) The mean ratio of the Cy3 signals before and after remodeling (green) and the mean ratio of the Cy5 signals before and after remodeling (red). Error bars represent the SEM from >100 nucleosomes.
Figure 2—figure supplement 2
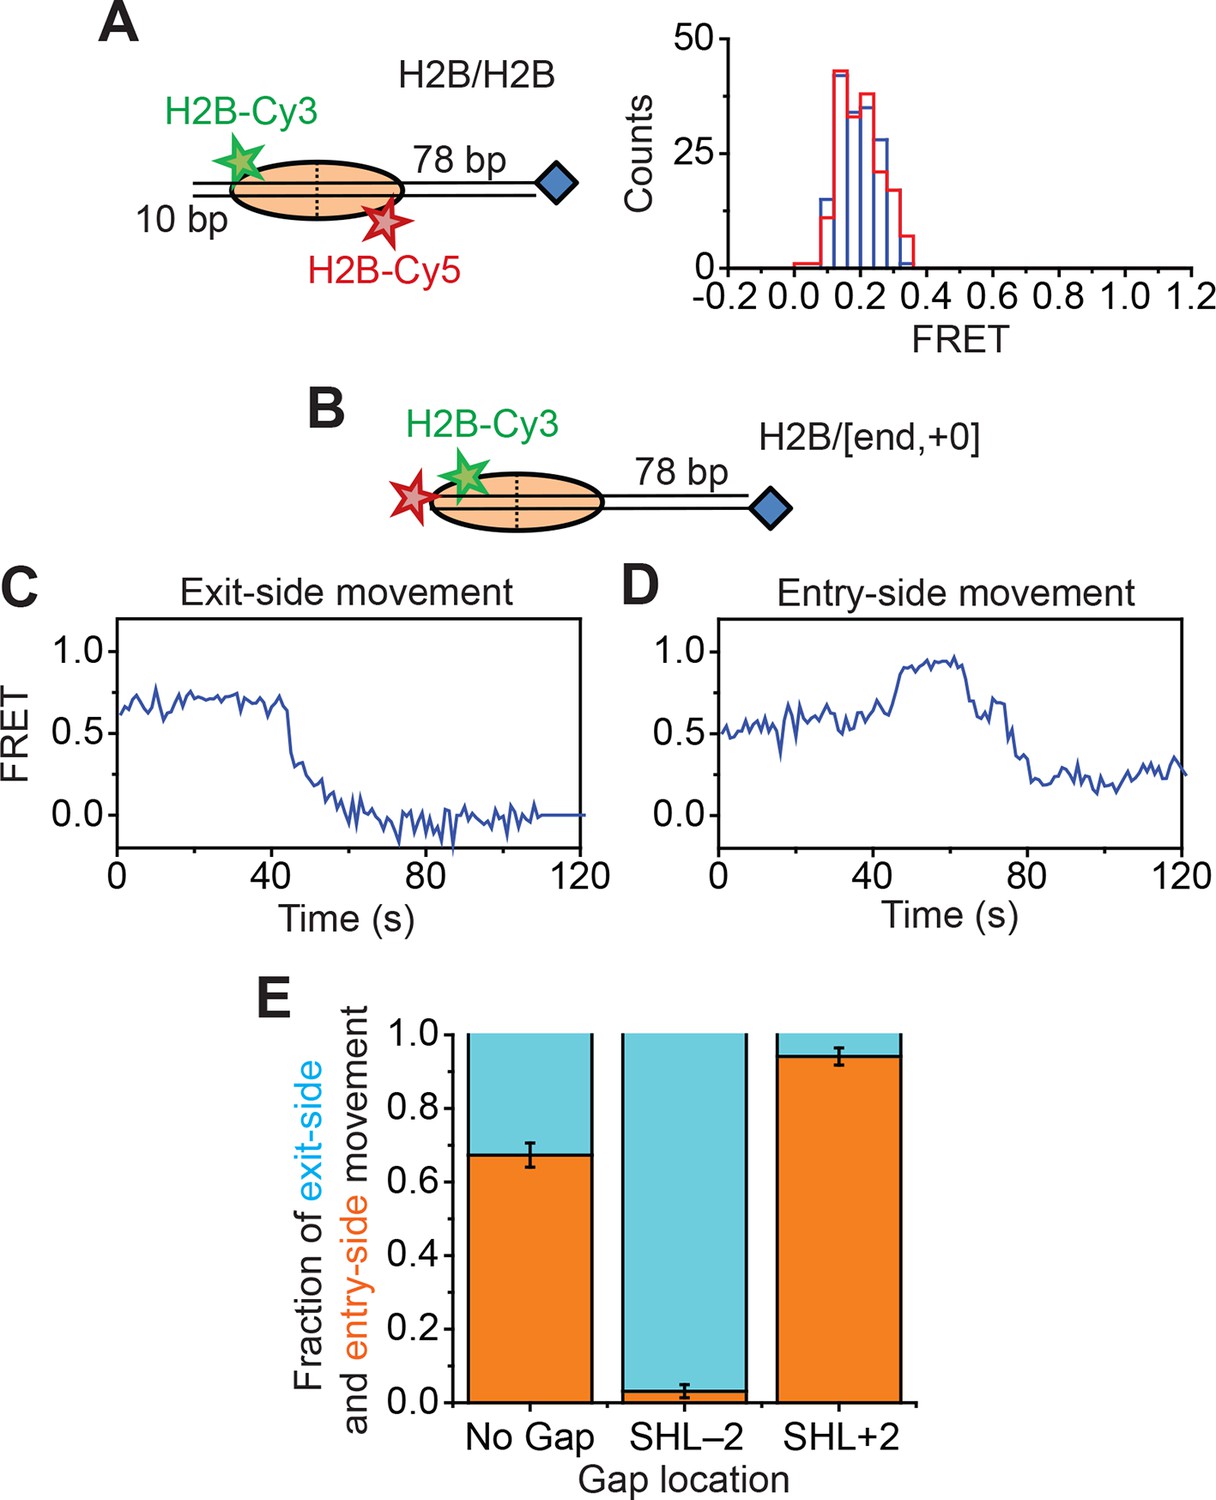
Remodeling of nucleosomes labeled in the globular domain of histone H2B.
(A) Left: diagram of the H2B/H2B nucleosomes. Right: histogram of the FRET values from H2B/H2B nucleosomes before (blue) and after (red) the addition of 6 nM RSC and 5 µM ATP. (B) Cartoon of the H2B/[end,+0] nucleosome construct. (C and D) Representative FRET traces showing H2B/[end,+0] nucleosomes undergoing exit-side movement (C) and entry-side movement (D). [RSC] = 1 nM, [ATP] = 5 µM. (E) Fraction of traces showing entry-side and exit-side movement observed with 1 nM RSC, and 20 µM ATP for nucleosomes lacking any ssDNA gap, nucleosomes with a 2-nt ssDNA gap at the SHL–2 site, and nucleosomes with a 2-nt ssDNA gap at the SHL+2 site. Error bars represent the standard error from > 90 nucleosomes per condition.
Figure 3 with 1 supplement
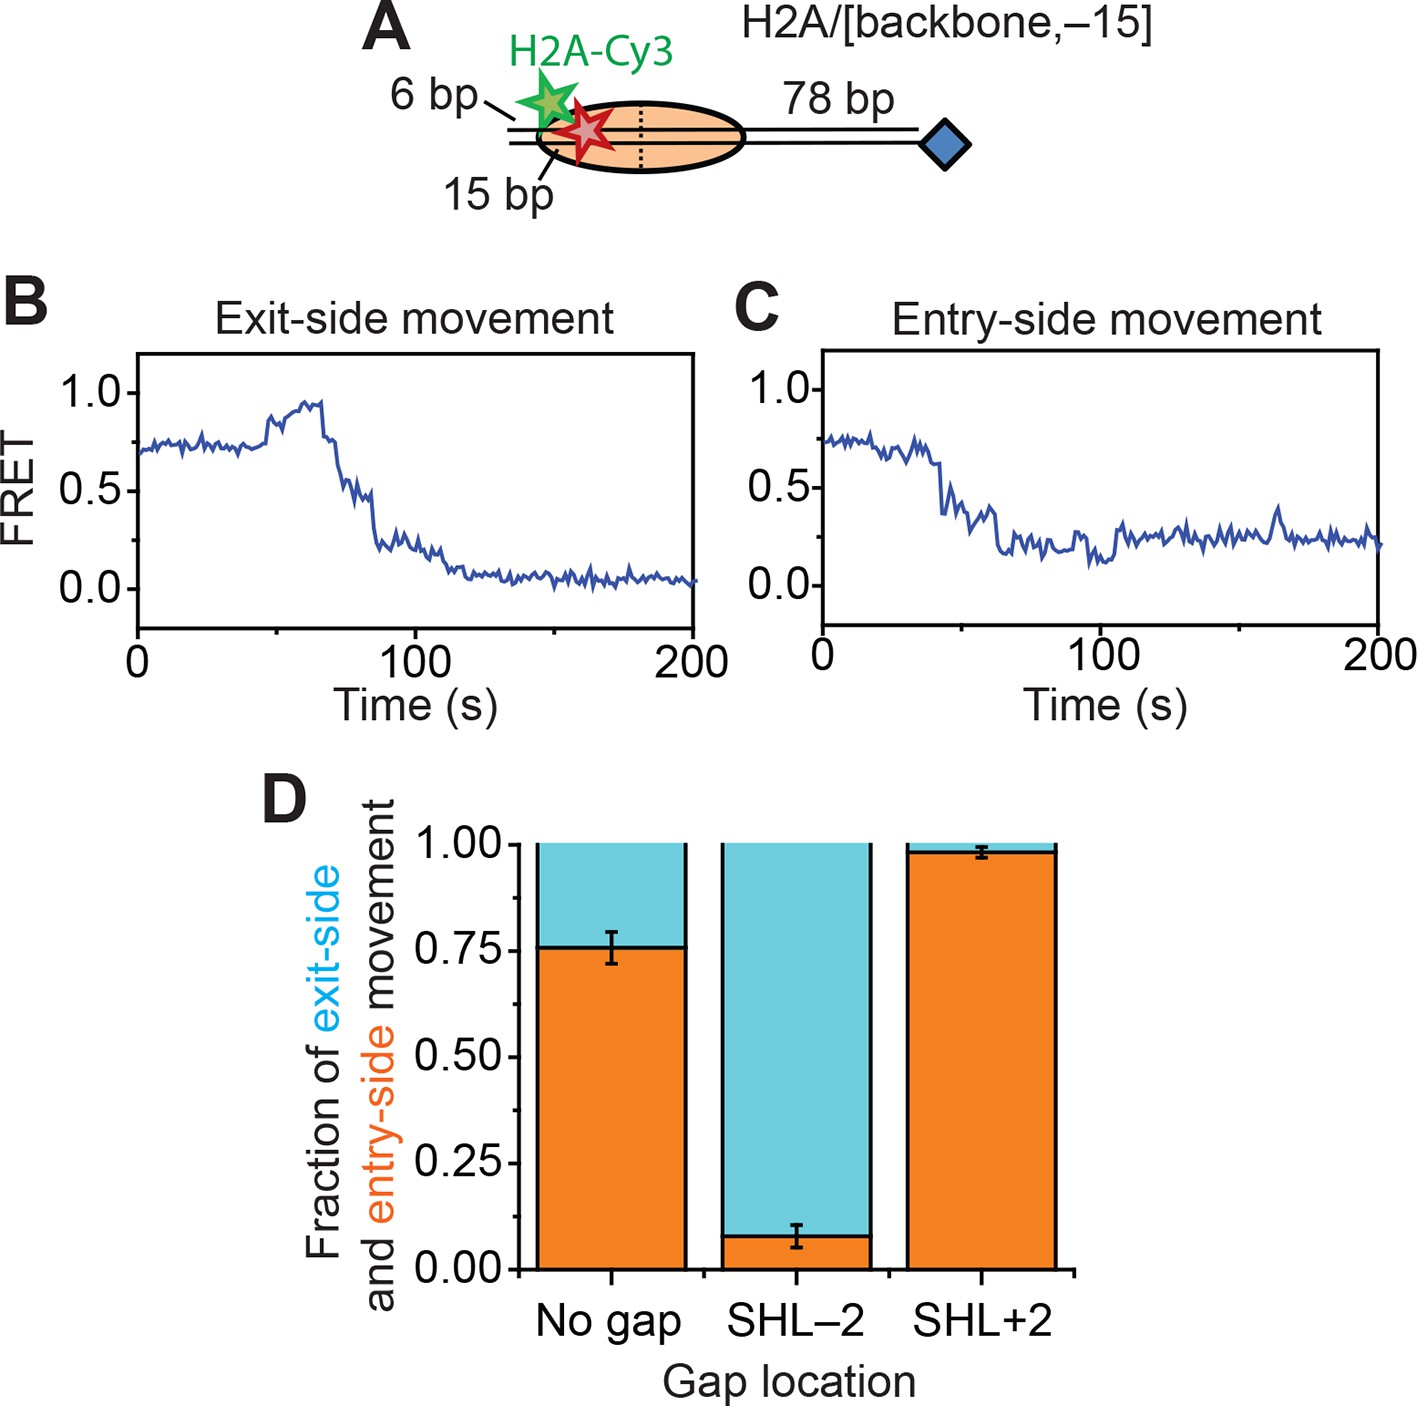
Assay for probing DNA unwrapping at the nucleosomal edge where DNA exits the nucleosome.
(A) Diagram of the H2A/[backbone,–15] nucleosome construct. (B and C) Representative FRET traces showing exit-side movement (B) and entry-side movement (C). [RSC] = 1 nM, [ATP] = 5 µM. (D) The fraction of entry-side movement (orange) and exit-side movement (cyan) traces observed with 1 nM RSC and 20 µM ATP for nucleosomes lacking any ssDNA gap, nucleosomes with a 2-nt ssDNA gap at the SHL–2 site, and nucleosomes with a 2-nt ssDNA gap at the SHL+2 site. Error bars represent the standard error from >100 nucleosomes per construct.
Figure 3—figure supplement 1
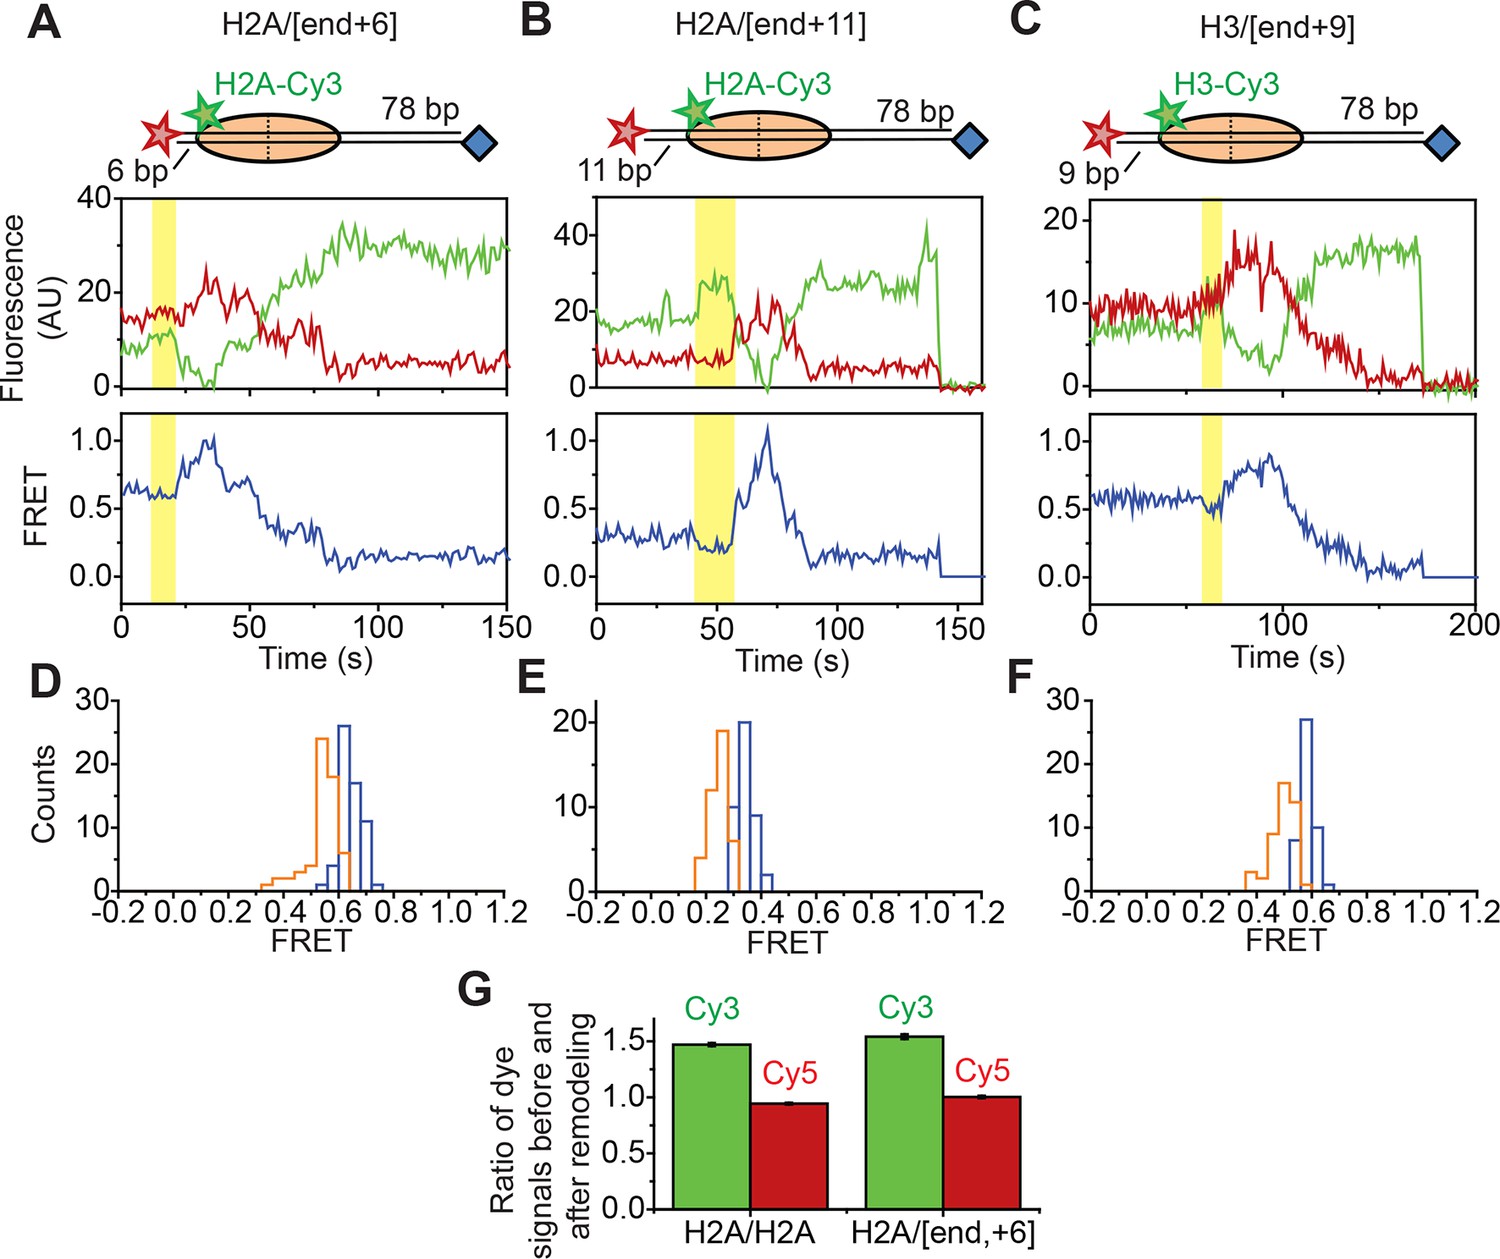
Assays for probing DNA unwrapping at the nucleosomal edge where DNA enters the nucleosome.
(A–C) Top: cartoons representing the H2A/[end,+6] (A), H2A/[end,+11] (B), and H3/[end,+9] (C) constructs used in each experiment. Bottom: Representative Cy3 intensity, Cy5 intensity, and FRET time traces showing entry-side movement. The region showing the transient FRET decrease is highlighted in yellow. [RSC] = 1 nM, [ATP] = 5 µM. (D–F) Histograms showing the starting FRET (blue) and FRET during the transient FRET decrease (orange) for the H2A/[end,+6] (D), H2A/[end,+11] (E), and H3/[end,+9] (F) constructs. (G) The mean ratio of the Cy3 signals before and after the transient FRET decrease (green) and the mean ratio of the Cy5 signals before and after the transient FRET decrease (red) for the H2A/[end,+6] construct. The data for the H2A/H2A constructs from Figure 2—figure supplement 1B are replotted for comparison. Error bars represent the SEM from >100 nucleosomes per construct.
Figure 4 with 4 supplements
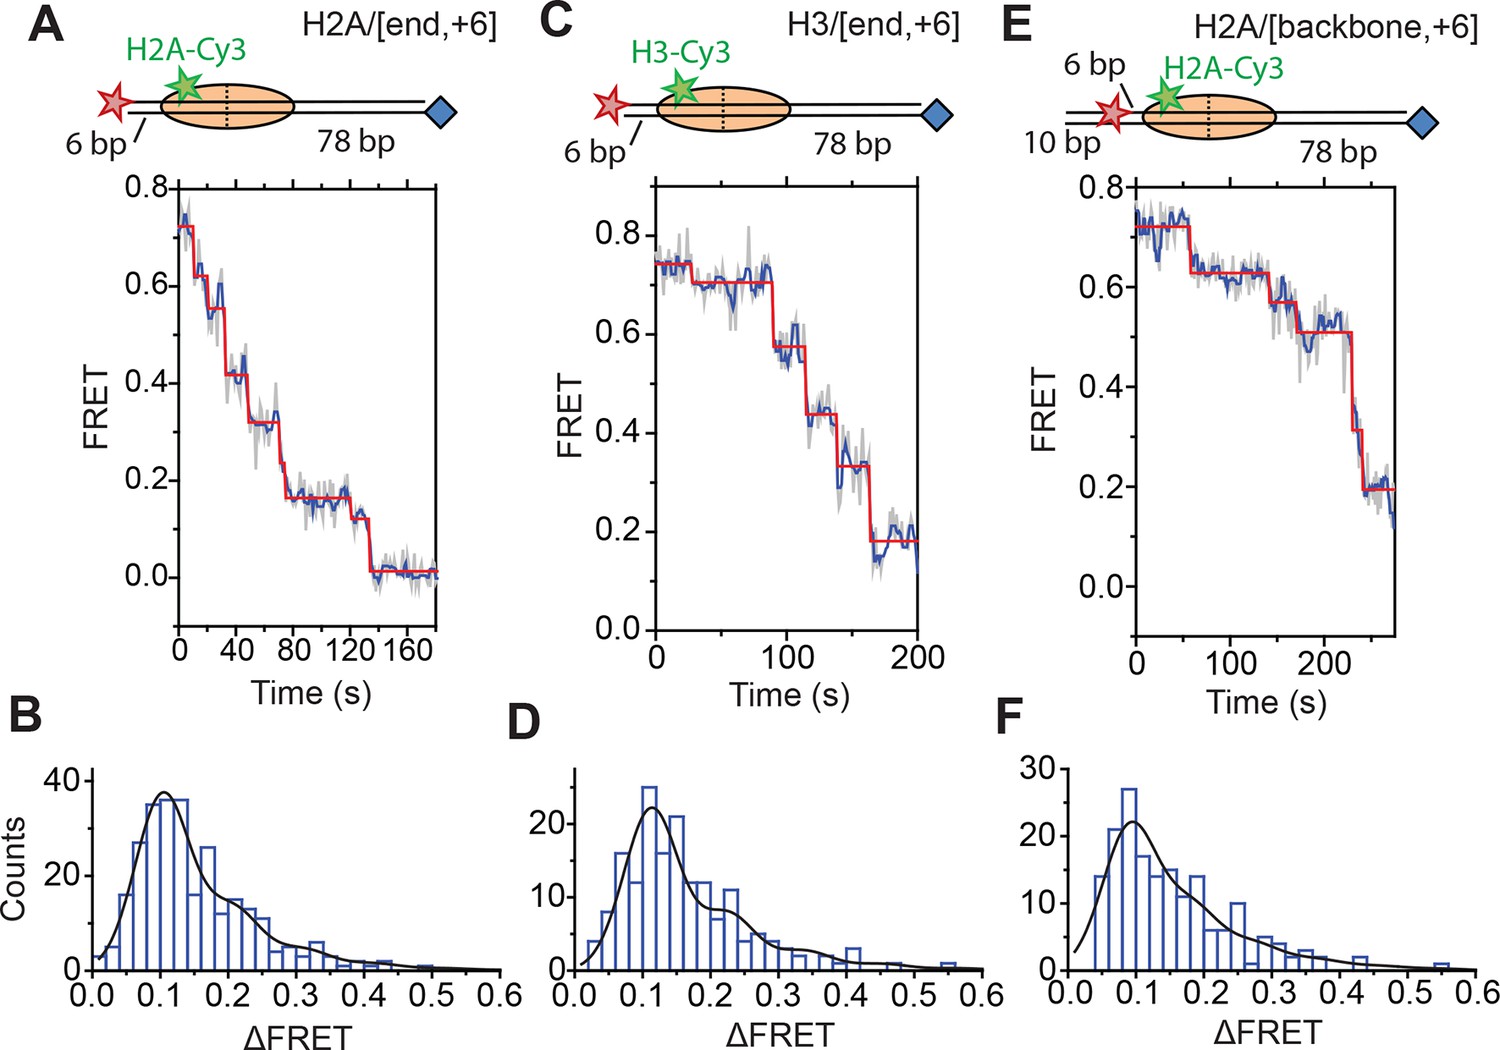
DNA exits the nucleosome in a stepwise manner, exhibiting a step size distribution peaked at ~1–2 bp during RSC-mediated remodeling.
Remodeling was monitored for H2A/[end,+6] (A and B), H3/[end,+6] (C and D), and H2A/[backbone,+6] (E and F) nucleosome constructs. (A, C, and E) Top: diagram of the nucleosome construct used. Bottom: Representative exit-side movement traces in the presence of 5 nM RSC and 2 µM ATP at 20°C. Light grey, raw FRET data; blue, 5-point median-filtered data; red, fit by a step-finding algorithm based on Chi-square minimization. (B, D, and F) Histograms of the measured step sizes in FRET change (blue bars) and the fit to the modeled step size distribution shown in Equation 1 (black line).
Figure 4—figure supplement 1
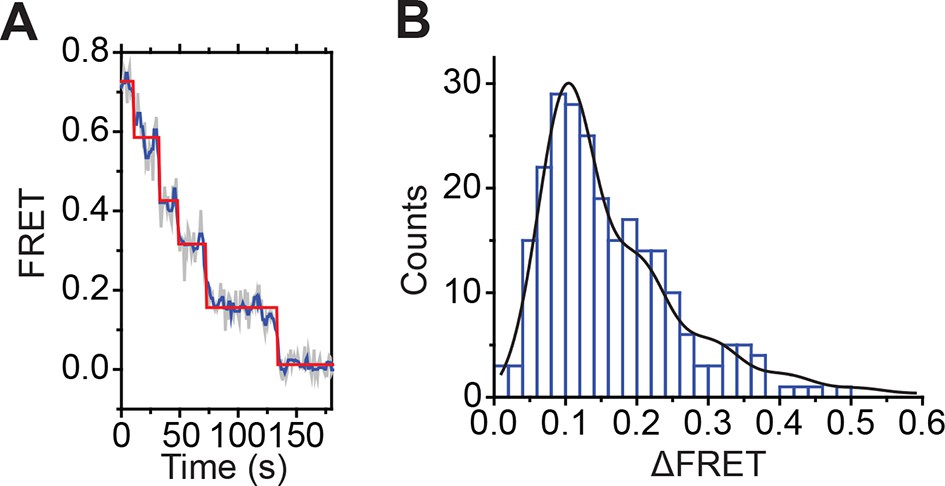
Step size determination using a hidden Markov model (HMM)-based step-finding algorithm.
(A) The exit-side movement trace from Figure 4A is reproduced showing the steps identified by the HMM-based step-finding algorithm. Light grey, raw FRET data; blue, 5-point median-filtered data; Red, HMM fit. (B) Histogram of the measured step sizes in FRET change (blue bars) identified by the HMM algorithm and the fit to the modeled step size distribution shown in Equation 1 (black line).
Figure 4—figure supplement 2
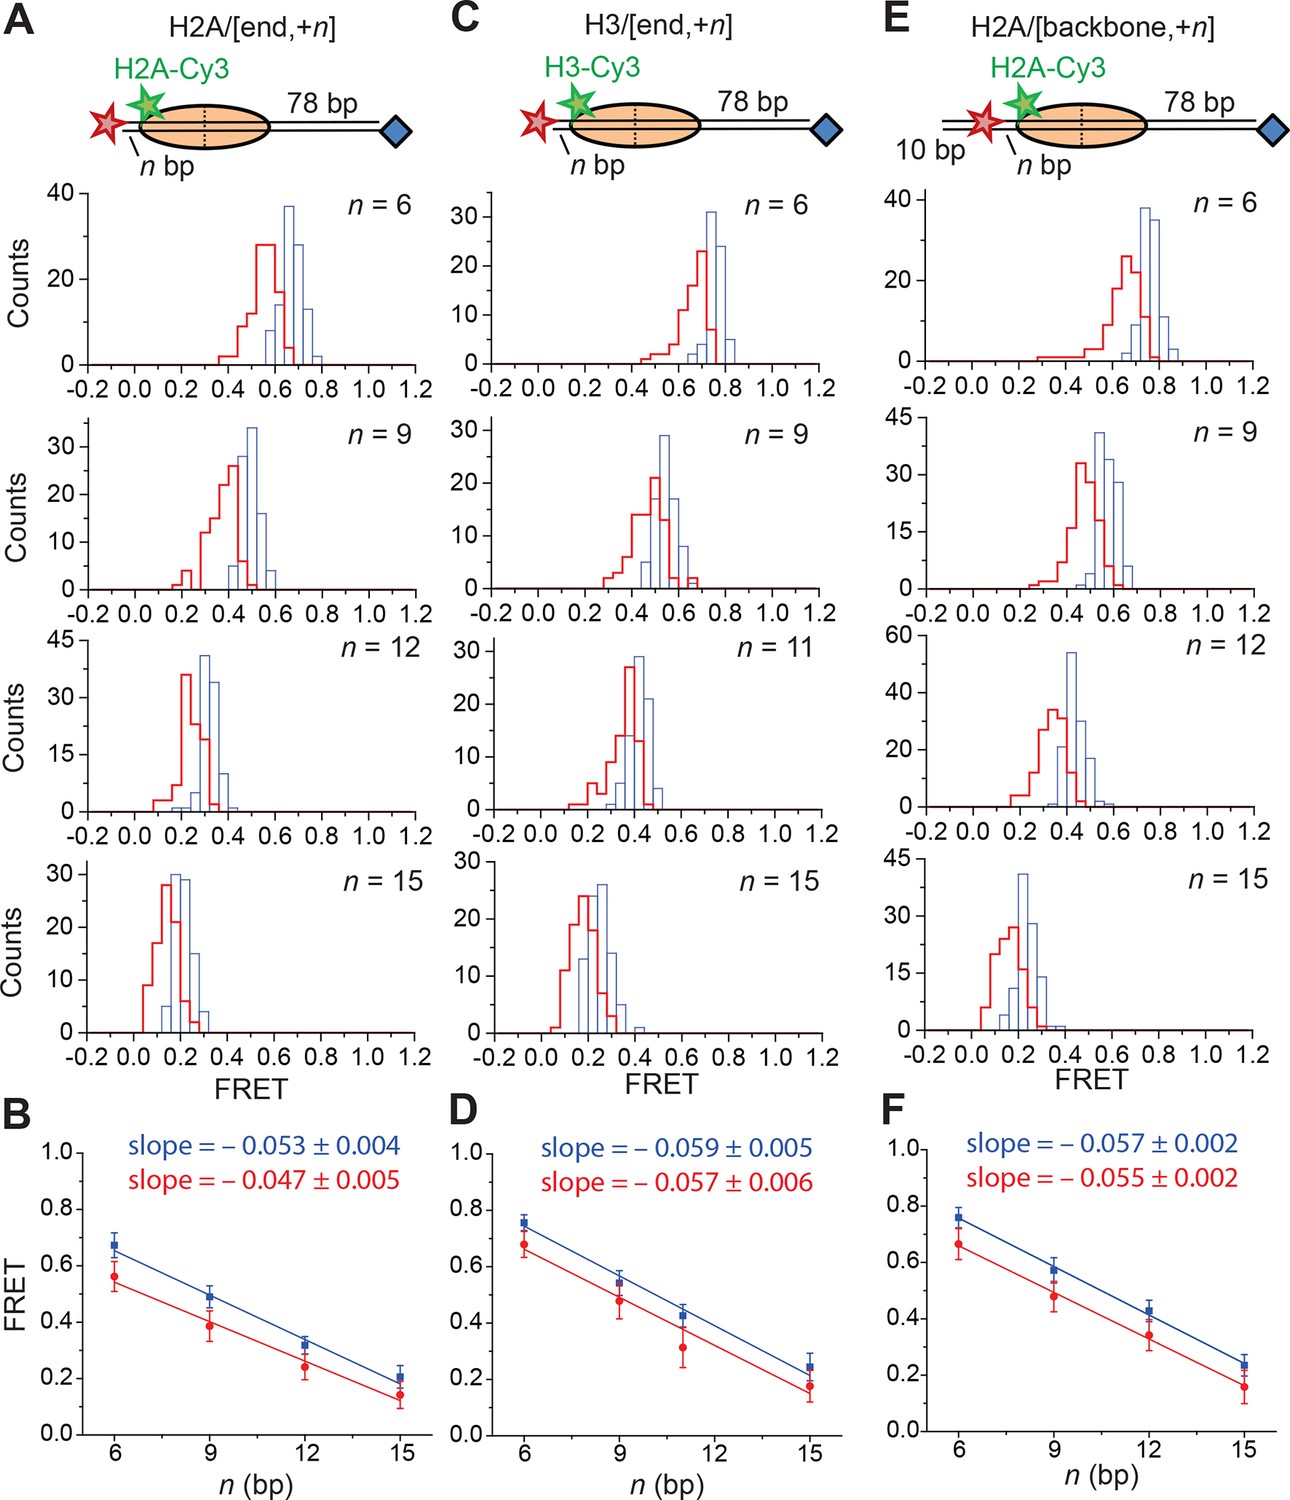
Calibration of FRET values as a function of the linker DNA length for constructs monitoring exit-side movement.
(A, C, and E) Distribution of FRET values measured with 5 nM RSC and 2 µM ATP at 20°C for the H2A/[end,+n] (A), H3/[end,+n] (C), and H2A/[backbone,+n] (E) constructs before (blue) and after (red) the first observed step of FRET change. (B, D, and F) Plots of the mean FRET value versus linker DNA length (n) for the H2A/[end,+n] (B), H3/[end,+n] (D), and H2A/[backbone,+n] (F) constructs before (blue) and after (red) the first observed step of FRET change. The mean and standard deviation of each point were obtained by fitting the FRET distributions to a Gaussian curve. The slopes were obtained by linear regression and the error is the standard error.
Figure 4—figure supplement 3
Analysis of DNA translocation step sizes of exit-side movement.
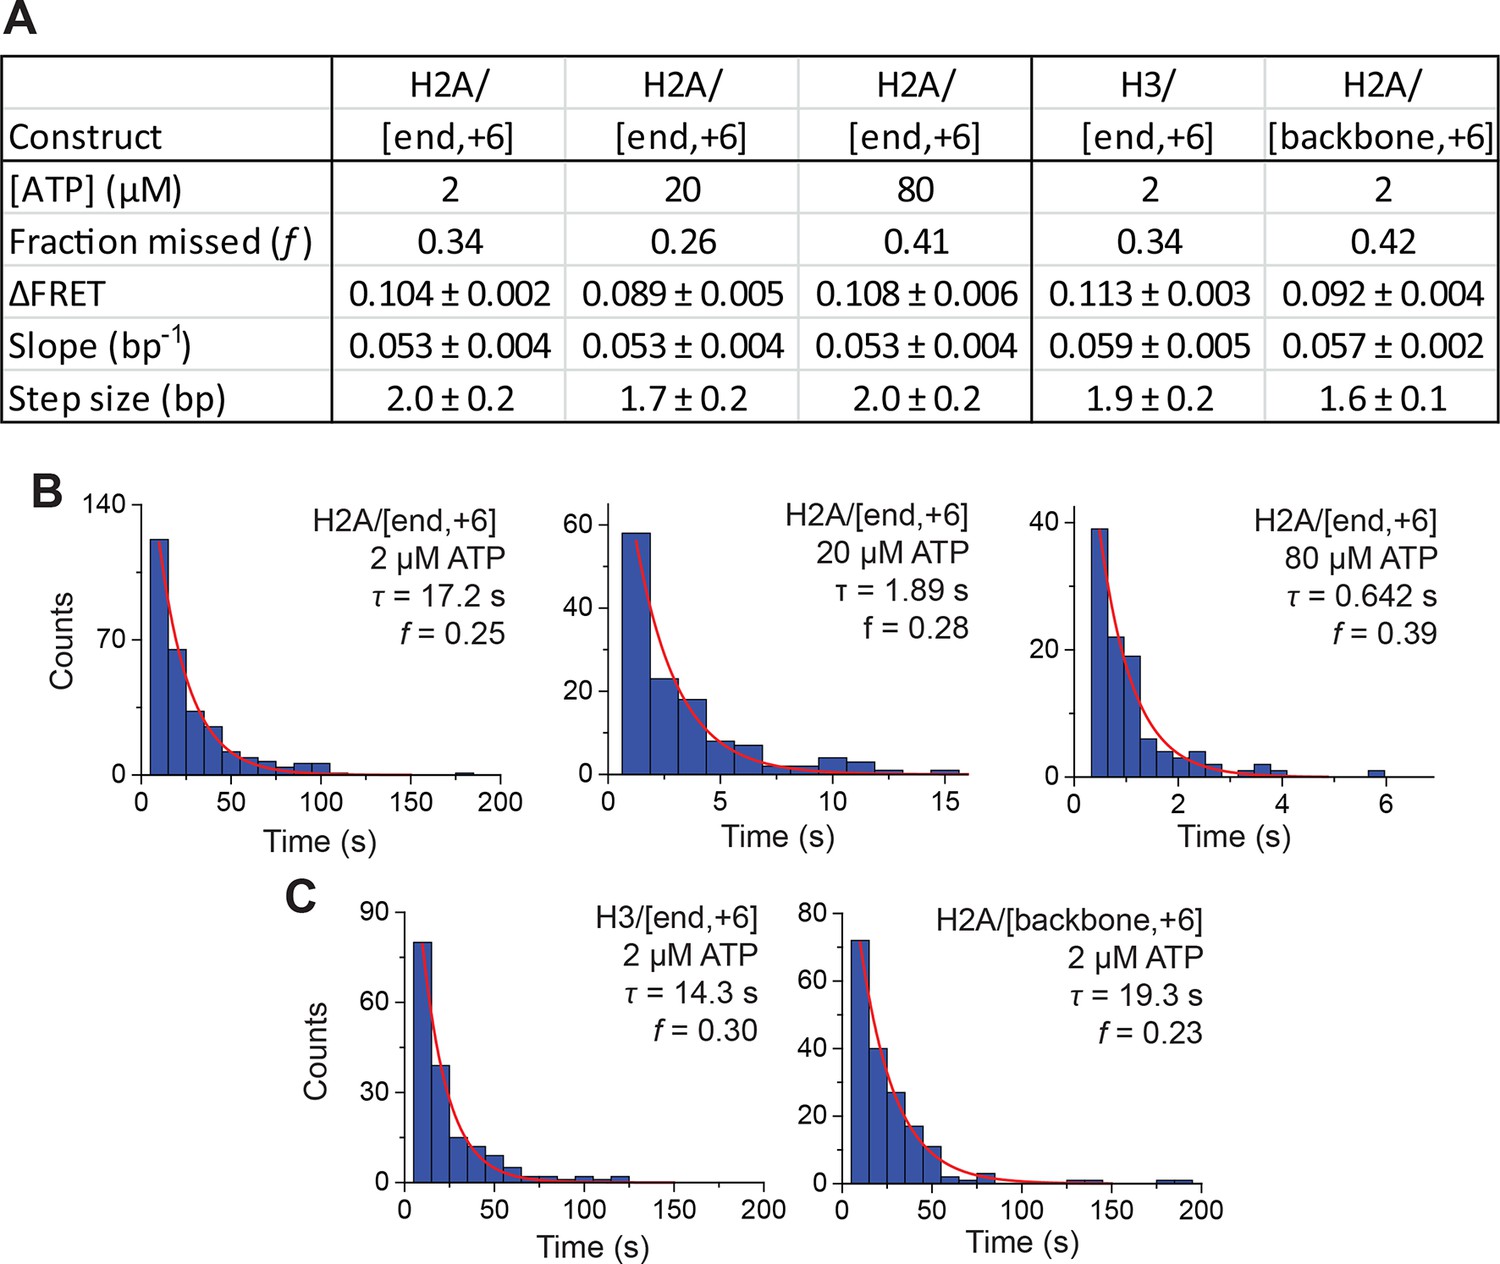
(A) Table showing the estimated step size ( ± standard error) and fraction of steps missed (f) from fits of the ΔFRET step size histograms in Figure 4 and Figure 4—figure supplement 4 to the stepping model in Equation 1. These ΔFRET values are converted to step sizes in bp by dividing the FRET step sizes by the slopes of the calibration curves in Figure 4—figure supplement 2. (B) Histograms of the observed pause lifetimes for the H2A/[end, +6] construct during RSC-induced remodeling at 2 µM, 20 µM and 80 µM ATP, collected with camera frame rates of 1 Hz, 8 Hz, and 16 Hz, respectively. (C) Histograms of the observed pause lifetimes identified for the H3/[end, +6] and H2A/[backbone, +6] constructs during RSC-induced remodeling at 2 µM ATP. The mean pause lifetime (τ) is estimated by fitting the distribution to an exponential, and the expected fraction of missed events (f) is the fraction of pauses expected to have a pause lifetime < 5 frames (the threshold for detecting a step in the step-size analysis).
Figure 4—figure supplement 4
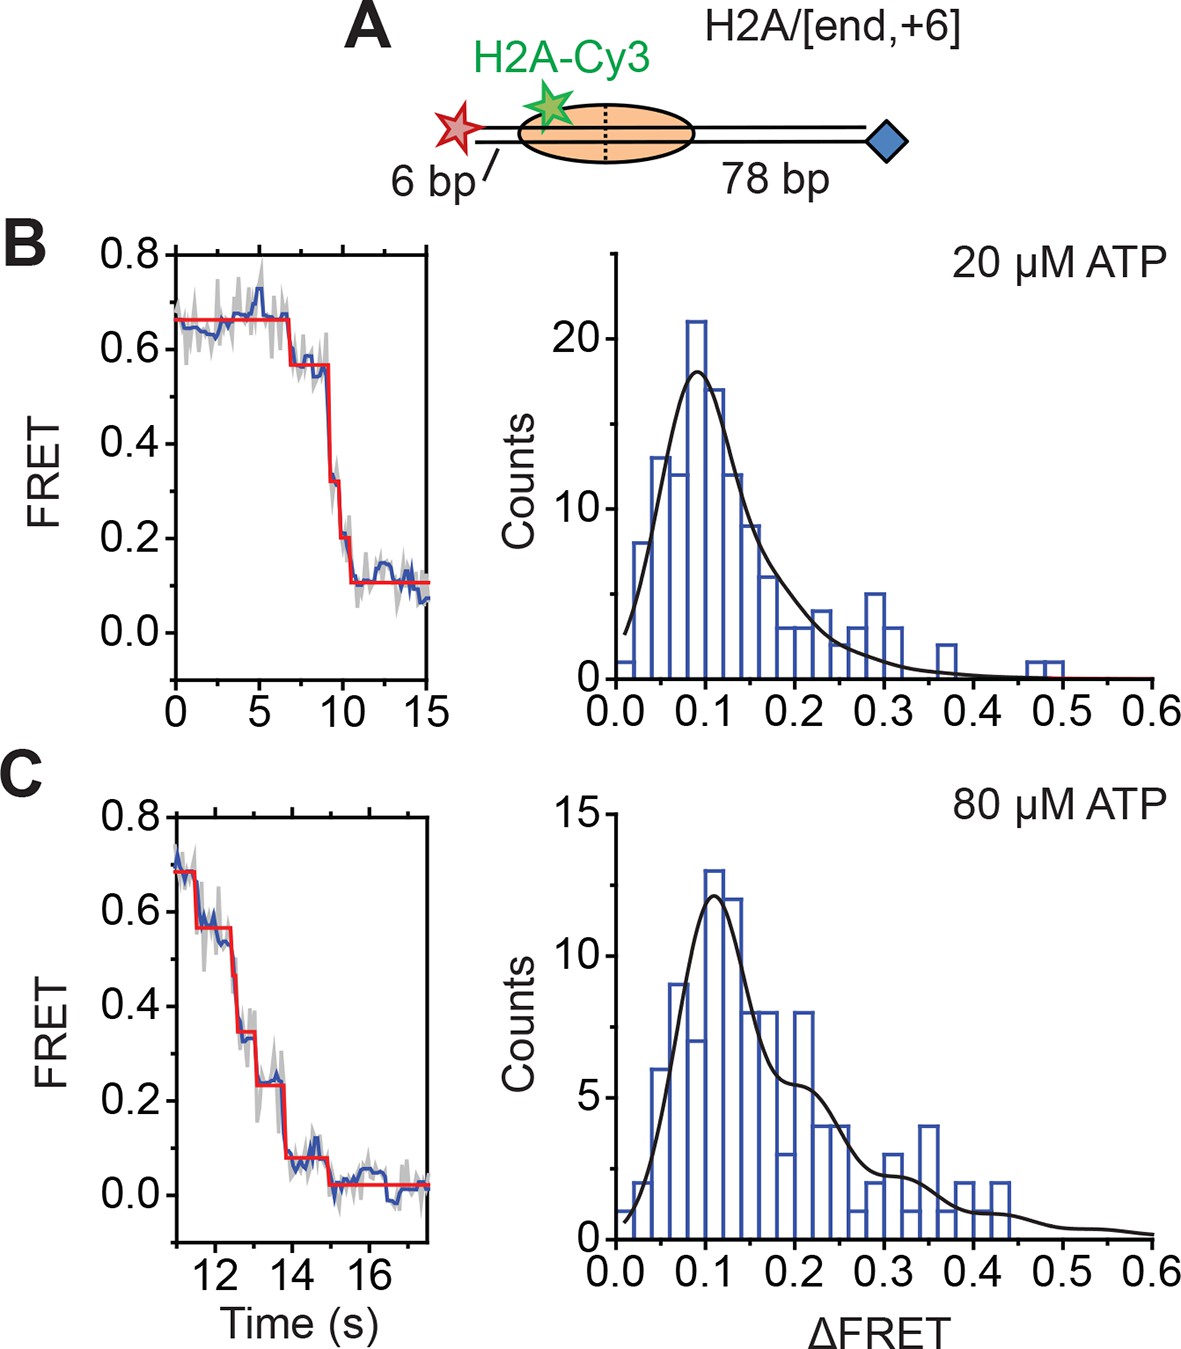
Monitoring exit-side DNA motion at higher ATP concentrations.
(A) Cartoon of the H2A/[end,+6] construct used in the experiments. (B and C) Analysis of exit-side movement from remodeling of H2A/[end,+6] nucleosomes. Reactions were performed at 20°C in the presence of 5 nM RSC and 20 µM ATP (B) or 5 nM RSC and 80 µM ATP (C). Data were collected at 8 Hz (B) or 16 Hz (C), as opposed to the 1 Hz rate used in the 2 µM ATP experiments. Left: Representative FRET traces. Light grey, raw FRET data; blue, 5-point median-filtered data; red, fit by the step-finding algorithm. Right: Histograms of the measured step sizes in FRET change (blue bars) and the fit to the modeled step size distribution in Equation 1 (black line).
Figure 5 with 3 supplements

DNA enters the nucleosome in a stepwise manner, exhibiting a step size distribution peaked at ~1–2 bp during RSC-mediated remodeling.
Remodeling was monitored for H2A/[end,+12] (A and C), and H3/[end,+9] (B and D) constructs. (A and B) Top: diagram of the nucleosome constructs used. Bottom: Representative entry-side movement traces in the presence of 5 nM RSC and 2 µM ATP at 20°C. Light grey, raw FRET data; blue, 5-point median-filtered data; red, fit by the step-finding algorithm. (C and D) Histograms of the measured step sizes in FRET change (blue bars) and the fit to the modeled step size distribution shown in Equation 1 (black line).
Figure 5—figure supplement 1
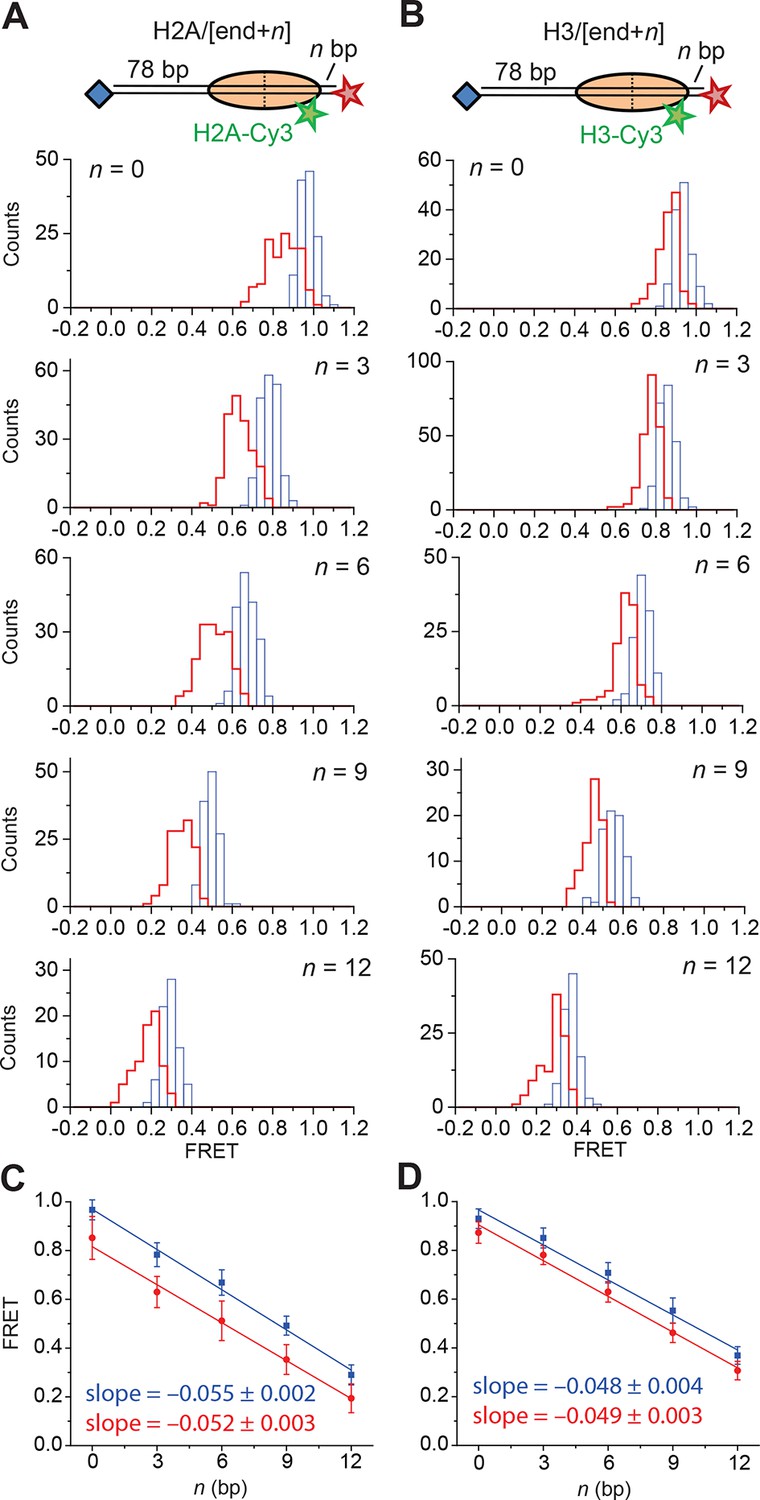
Calibration of FRET values as a function of the linker DNA length for constructs monitoring entry-side movement.
(A and B) Distribution of FRET values before (blue) and after (red) the first observed step of FRET change in the presence of 5 nM RSC and 2µM ATP at 20°C for the H2A/[end,+n] (A) and H3/[end,+n] (B) constructs. (C and D) Plots of the mean FRET versus linker DNA length (n) for the H2A/[end,+n] (C) and H3/[end,+n] (D) constructs before (blue) and after (red) the first observed step of FRET change. The mean and standard deviation for each point were obtained by fitting the FRET distributions to a Gaussian curve. The slopes were obtained by linear regression and the error is the standard error.
Figure 5—figure supplement 2
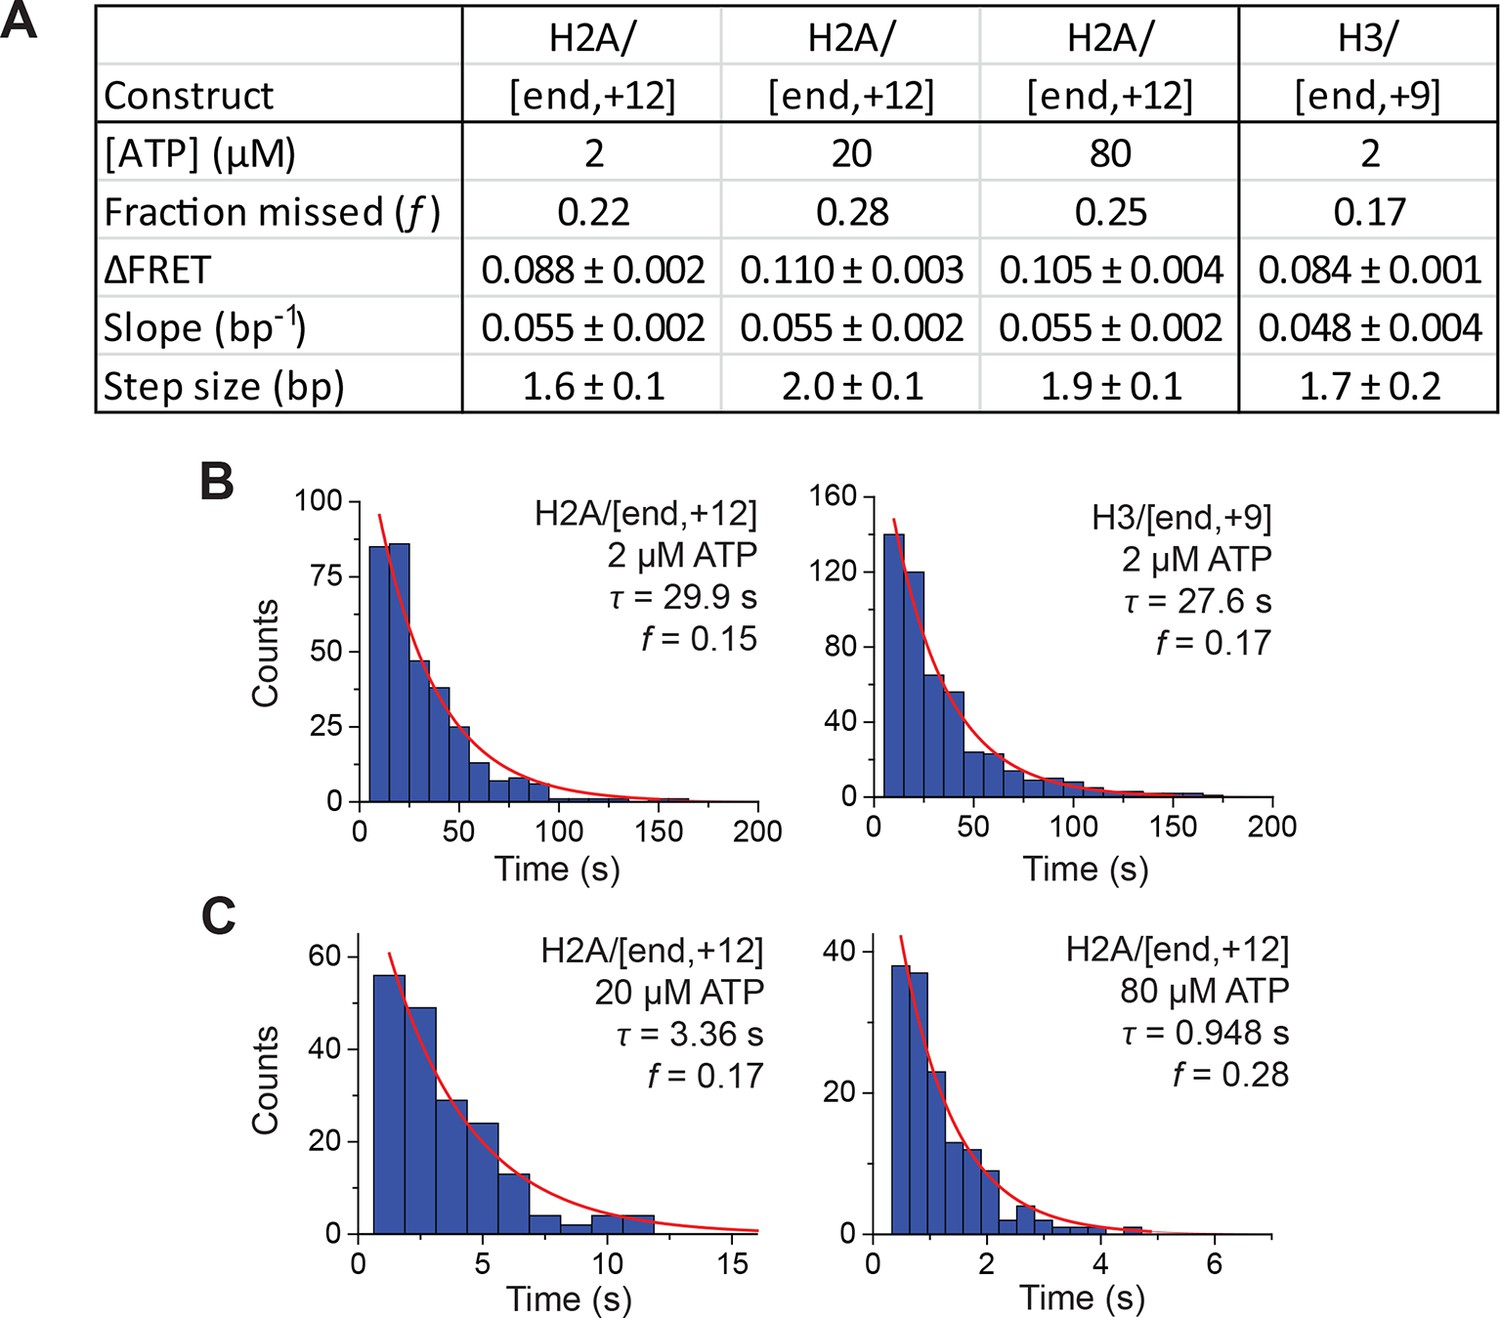
Analysis of DNA translocation step sizes of entry-side movement.
(A) Table showing the estimated step size ( ± standard error) and fraction of steps missed (f) from fits of the ΔFRET step size histograms in Figure 5 and Figure 5—figure supplement 3 to the stepping model in Equation 1. These ΔFRET values are converted to step sizes in bp by dividing the FRET step sizes by the slopes of the calibration curves in Figure 5—figure supplement 1. (B) Histograms of the observed pause lifetimes identified by the step-finding algorithm for the H2A/[end, +12] and H3/[end,+9] constructs during RSC-induced remodeling at 2 µM ATP. (C) Histograms of the observed pause lifetimes identified for the H2A/[end, +12] construct during RSC-induced remodeling at 20 and 80 µM ATP. Experiments with 2, 20, and 80 µM ATP were collected with camera frame rates of 1 Hz, 8 Hz, or 16 Hz, respectively. The mean pause lifetime (τ) is estimated by fitting the distribution to an exponential, and the expected fraction of missed events (f) is the fraction of pauses expected to have a pause lifetime < 5 frames (the threshold for detecting a step in the step-size analysis).
Figure 5—figure supplement 3
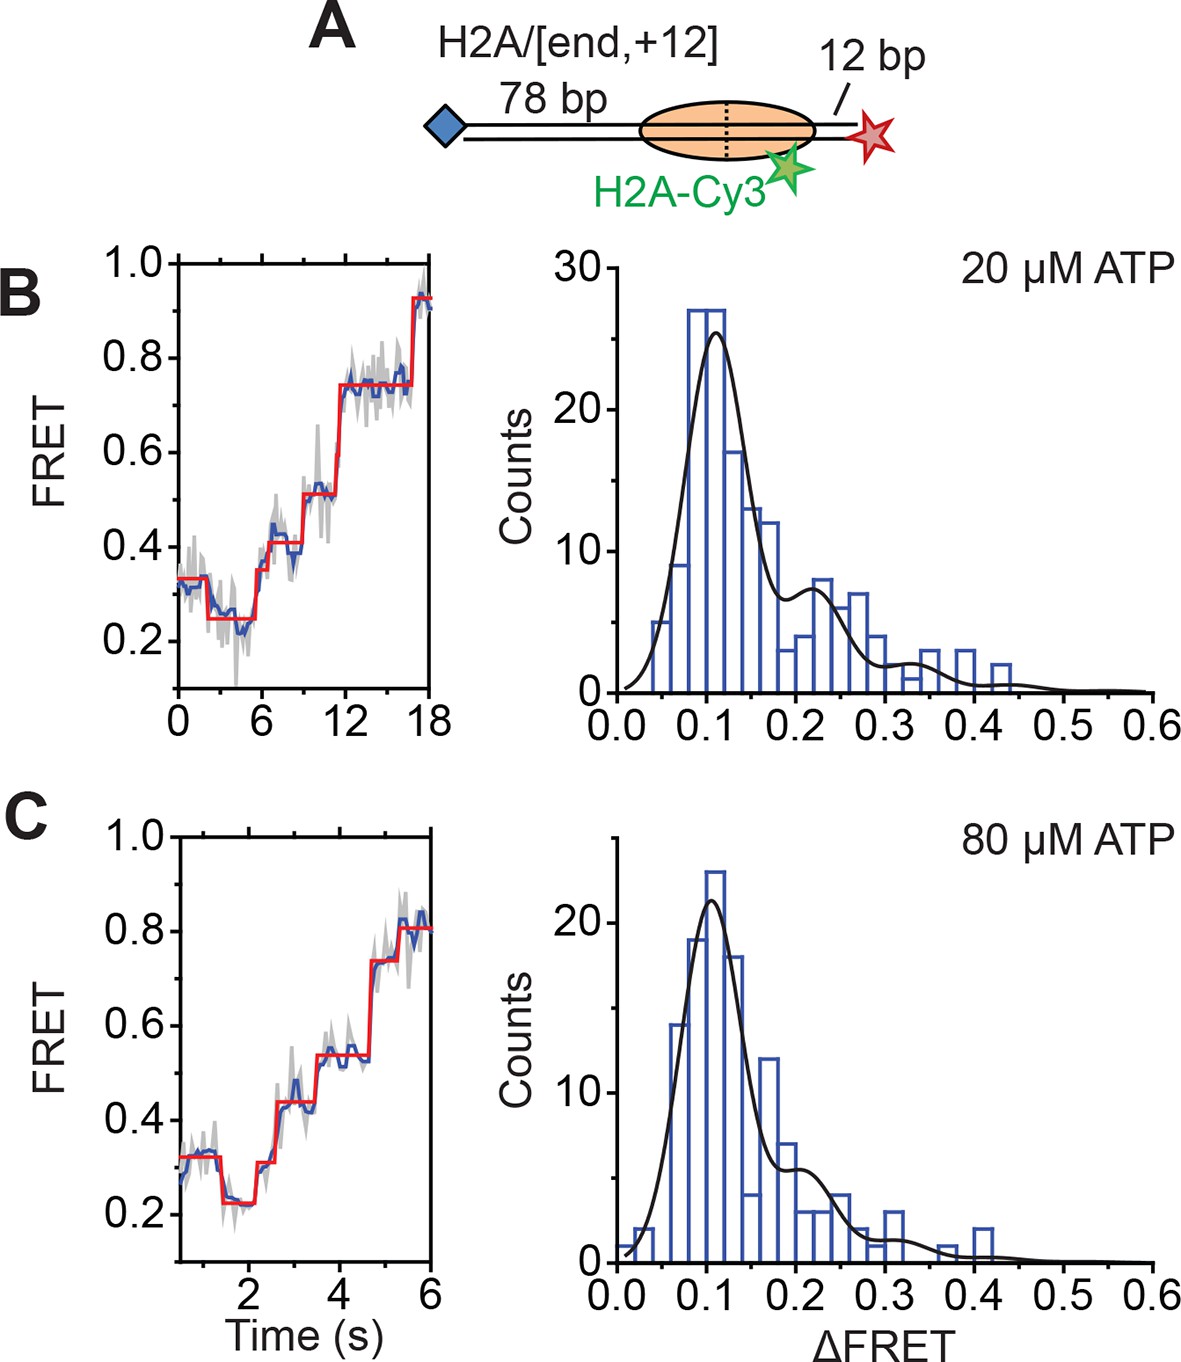
Monitoring entry-side DNA motion at higher ATP concentrations.
(A) Cartoon of the H2A/[end,+12] nucleosomes used in the experiments. (B and C) Analysis of entry-side movement from remodeling of H2A/[end,+12] nucleosomes. Reactions were performed at 20°C in the presence of 5 nM RSC and 20 µM ATP (B) or 80 µM ATP (C). Data were collected at 8 Hz (B) or 16 Hz (C), as opposed to the 1 Hz rate used in the 2 µM ATP experiments. Left: Representative FRET traces. Light grey, raw FRET data; blue, 5-point median-filtered data; red, fit by the step-finding algorithm. Right: Histograms of the measured step sizes in FRET change (blue bars) and the fit to the modeled step size distribution in Equation 1 (black line).
Author response image 1. Comparison of remodeling at 5 and 20 µM ATP
(A) Histogram showing the distribution of FRET values before (blue) and after (red) addition of 1 nM RSC and 5 µM ATP (top) or 1 nM RSC and 20 µM ATP (bottom). The data in the bottom panel are reproduced from Figure 1E for comparison. (B) The fraction of exit-side movement (cyan) and entry-side movement (orange) traces observed with 1 nM RSC and the indicated concentration of ATP on H2A/[end, +6] nucleosomes. Error bars represent the standard error from >100 nucleosomes per construct. The data for the 20 µM ATP condition are reproduced from Figure 1D for comparison.
Download links
A two-part list of links to download the article, or parts of the article, in various formats.
Downloads (link to download the article as PDF)
Open citations (links to open the citations from this article in various online reference manager services)
Cite this article (links to download the citations from this article in formats compatible with various reference manager tools)
Stepwise nucleosome translocation by RSC remodeling complexes
eLife 5:e10051.
https://doi.org/10.7554/eLife.10051


