Re-focusing visual working memory during expected and unexpected memory tests
- Institute for Brain and Behavior Amsterdam, Department of Experimental and Applied Psychology, Vrije Universiteit Amsterdam, Netherlands
Figures
Figure 1
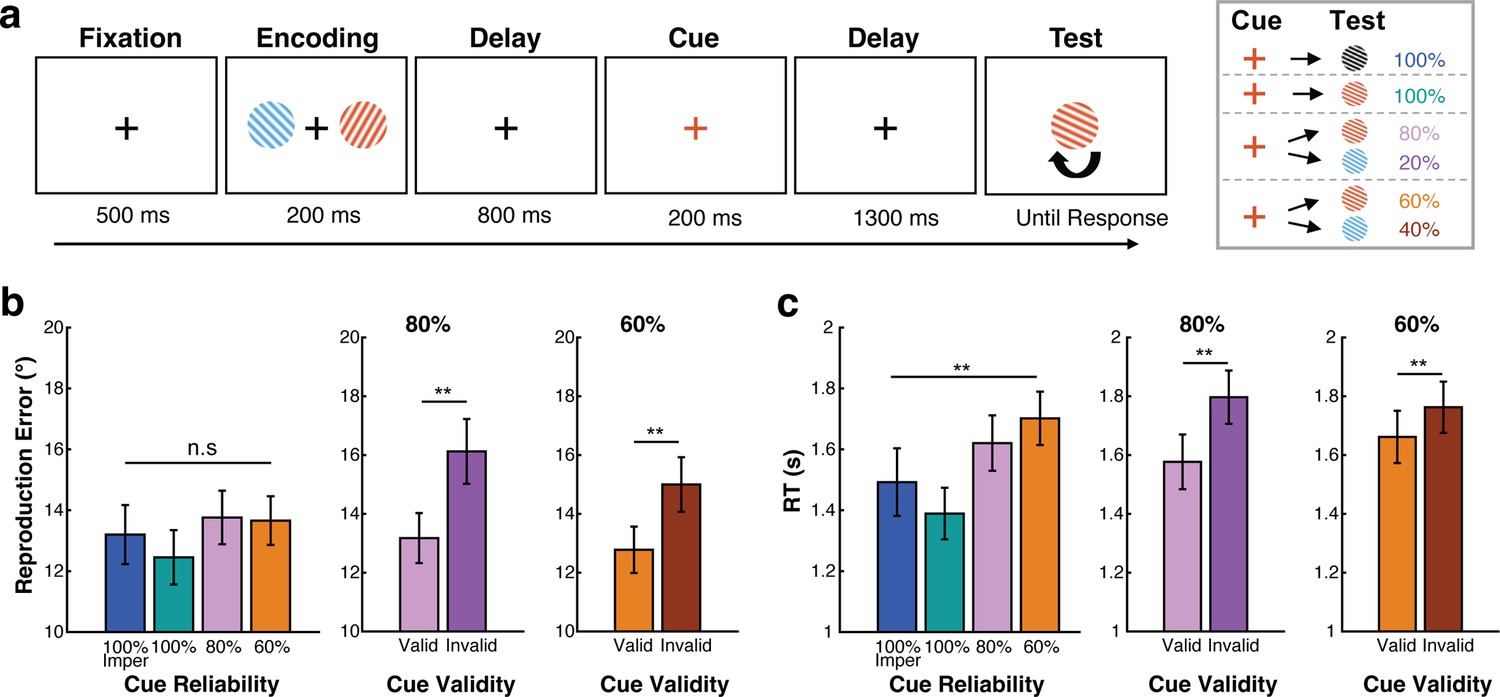
Better performance for expected vs. unexpected working memory tests.
(a) Task schematic. Participants (n=24) memorized two visual items, of which one would become tested for orientation reproduction. During the delay, a retrocue would indicate which memory item would most likely be tested. Across blocks, the retrocue was either 100%, 80%, or 60% reliable, or 100% reliable and imperative (no repeat of color at test) as illustrated in the right panel. (b) Continuous reproduction error across four cue-reliability conditions (left panel), and for valid and invalid-cue trials in the 80% and 60% cue-reliability blocks (right panels). (c) Response time across conditions. Error bars represent ± 1 SEM. *, **, n.s represent significance level p<0.05, p<0.01, and non-significant after Bonferroni correction.
Figure 2 with 1 supplement

Attentional orienting after the cue shows graded spatial modulations in both EEG-alpha activity and in gaze.
(a) Top: time-frequency spectrum (contralateral minus ipsilateral) across frequency bands (2–40 Hz) following the cue (n=23). Bottom: topographic distribution of 8–12 Hz EEG-alpha lateralization across conditions (averaged across 400–800 ms after the cue). (b) Left panel: time-series of alpha lateralization across conditions. Right panel: averages of alpha lateralization in a pre-defined time window (400–800 ms after cue, as in van Ede et al., 2019a) across conditions. (c) Top: saccade rates separately for toward and away saccades across cue conditions relative to cue onset (n=22), colored lines represent saccades toward the memorized location of the cued item while gray lines represent saccades away from the memorized location of the cued item. Bottom: spatial saccade bias (toward minus away, color-coded) as a function of saccade size. The difference between toward and away saccades (with red colors denoting more toward saccades) was predominantly driven by saccades in the micro-saccade range (<2° visual degree) rather than looking back to the original location of the items that were centered at 6 degrees during encoding. (d) Left panel: spatial saccade bias (toward minus away) across conditions. Right panel: averages of saccade bias in a pre-defined time window (200–600 ms after cue as in Liu et al., 2022) across conditions. Colored horizontal lines above the x-axes in b,d indicate significant clusters (p<0.05). Shading and error bars represent ± 1 SEM. *, **, *** represent significance level p<0.05, p<0.01, and p<0.001.
Figure 2—figure supplement 1

Spatial saccade biases associated with initial orienting after the retrocue and re-orienting after the memory test are preserved when exclusively considering fixational ‘micro’ saccades <2 degrees.
(a) Spatial saccade bias (toward minus away, calculated by exclusively considering saccades within 2 visual degrees) across conditions following the cue. (b) Same plots as in (a) but following the memory test. Colored horizontal lines above x-axis indicate significant clusters. The black horizontal lines above the x-axis in panel (b) indicate significant difference clusters (p<0.05) between validly cued (expected) and invalidly cued (unexpected) memory tests. Shading and error bars represent ± 1 SEM.
Figure 3 with 3 supplements
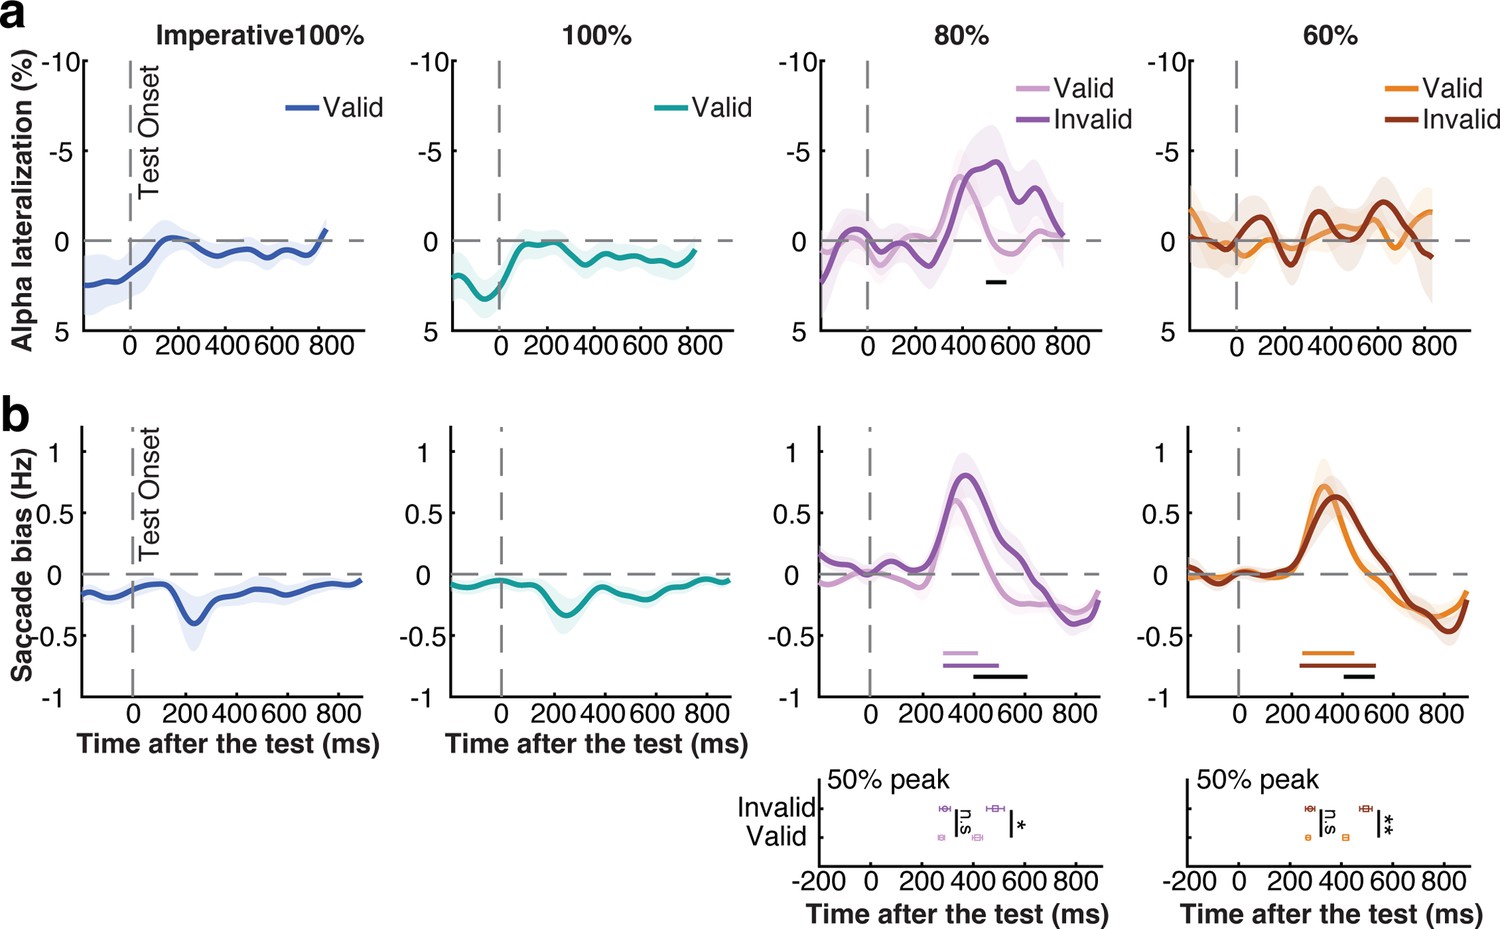
Attentional re-orienting after the memory test.
(a) Alpha lateralization towards the memorized location of the tested item across conditions, here relative to after the onset of the memory test instead of the cue. From left to right panels, the alpha lateralization across imperative 100%, informative 100%, 80%, and 60% reliable-cue conditions. (b) Saccade bias towards the memorized location of the tested item across conditions after the onset of the memory test. Colored horizontal lines above x-axis indicate significant clusters (p<0.05). The black horizontal lines indicate significant clusters (p<0.05) comparing validly and invalidly cued tests. Plots at the bottom of panel b: onset and offset latency defined by the 50% of the peak of the spatial saccade bias following validly- and invalidly-cued memory tests in the 80% and 60% cue-reliability conditions. Circles and squares represent onset and offset latency, the light and dark colors represent validly- and invalidly-cued memory tests. Shading and error bars indicate ± 1 SEM. *, **, n.s represent significance level p<0.05, p<0.01, and not significant, respectively.
Figure 3—figure supplement 1
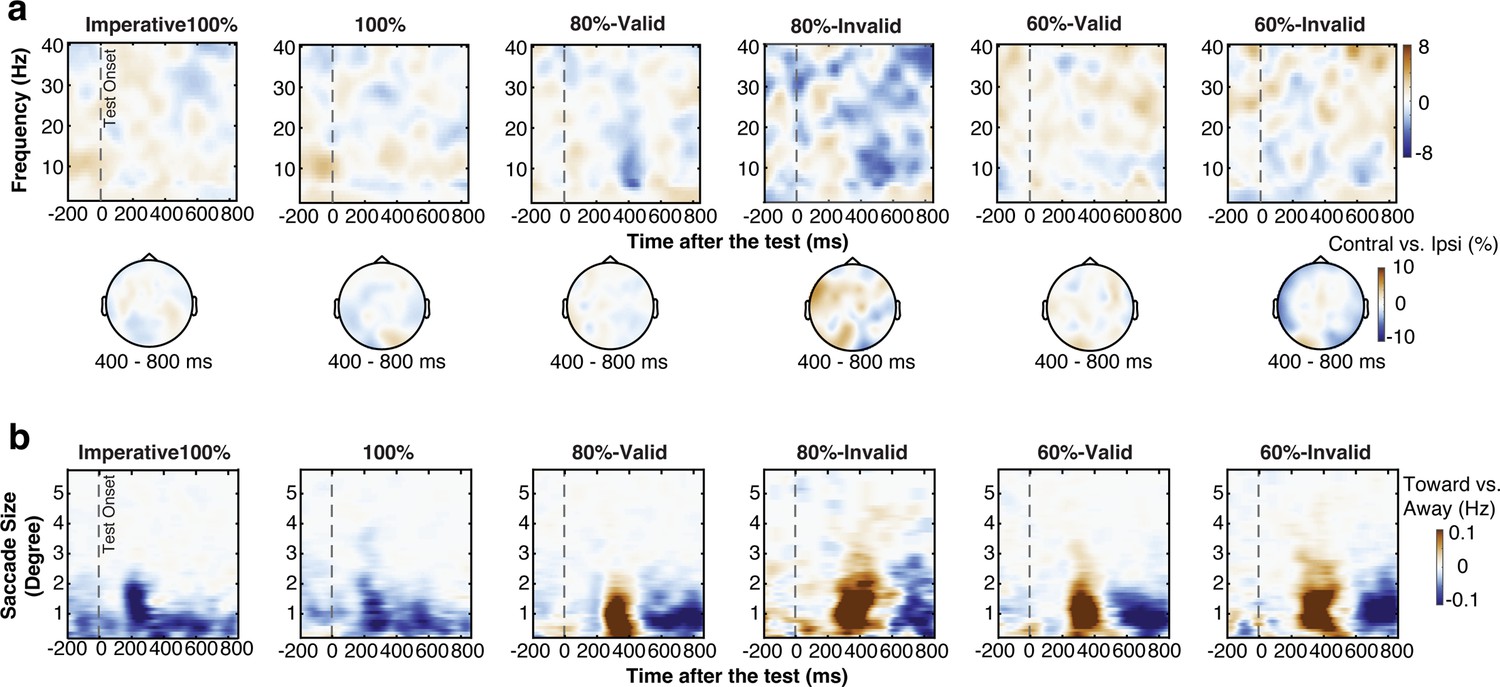
Time-frequency and saccadic activities after the memory test.
a) Top: time-frequency spectrum (contralateral minus ipsilateral) across frequency bands (2–40 Hz) across conditions following the memory test. Bottom: topographic distribution of 8–12 Hz EEG-alpha lateralization across conditions (averaged across 400–800 ms after the test). (b) Spatial saccade bias (toward minus away, color-coded) as a function of saccade size. The difference between toward and away saccades (with red colors denoting more toward saccades) was predominantly driven by saccades in the micro-saccades range (<2°) rather than looking back to the original location of the items that were centered at 6 degrees during encoding.
Figure 3—figure supplement 2
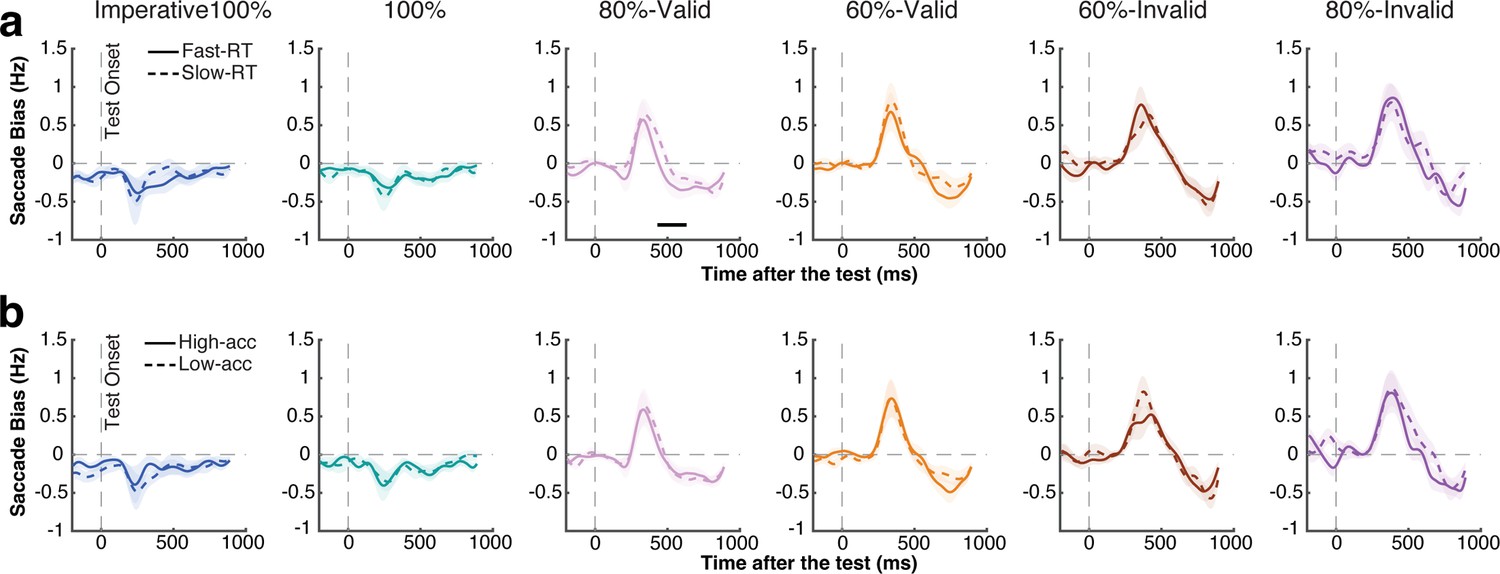
Saccade biases associated with attentional re-orienting after the memory test as a function of behavioral performance.
(a) Memory test-locked saccade bias comparison between fast- and slow-reaction time (RT) trials (median split) across cue-reliability conditions (color-coded). Solid and dashed time courses represent fast- and slow- RT trials, respectively. (b) Similar comparison as in (a) between high- and low-accuracy trials (median split). Solid and dashed time courses represent high- and low- accuracy trials, respectively. The black horizontal line above the x-axis represents a significant difference cluster after permuation testing (p<0.05). Shading and error bars indicate ± 1 SEM.
Figure 3—figure supplement 3

Differences between the gaze bias following expected and unexpected memory tests hold robust in subsampling analysis.
Top panel: Saccade bias towards the memorized location of the tested item across conditions after the onset of the memory test in the subsampling analysis. Colored horizontal lines above the x-axes indicate significant clusters (cluster ps=0.021,<0.001, 0.008,<0.001, for 80%-valid, 80%-invalid, 60%-valid, 60%-invalid conditions, respectively). The black horizontal lines indicate significant clusters comparing validly and invalidly cued tests (cluster ps=0.002, 0.015, for 80% and 60% conditions, respectively). Bottom panel: onset and offset latency (defined by the 50% of the peak) of the spatial saccade bias following validly- and invalidly-cued memory tests in the 80% and 60% cue-reliability conditions in the subsampling analysis. Circles and squares represent onset and offset latency, the light and dark colors represent validly- and invalidly-cued memory tests. Shading and error bars indicate ± 1 SEM. *, **, n.s represent significance level p<0.05 (0.041 for 80% cue-reliability condition), p<0.01 (0.003 for 60% cue-reliability condition), and not significant, respectively.
Figure 4
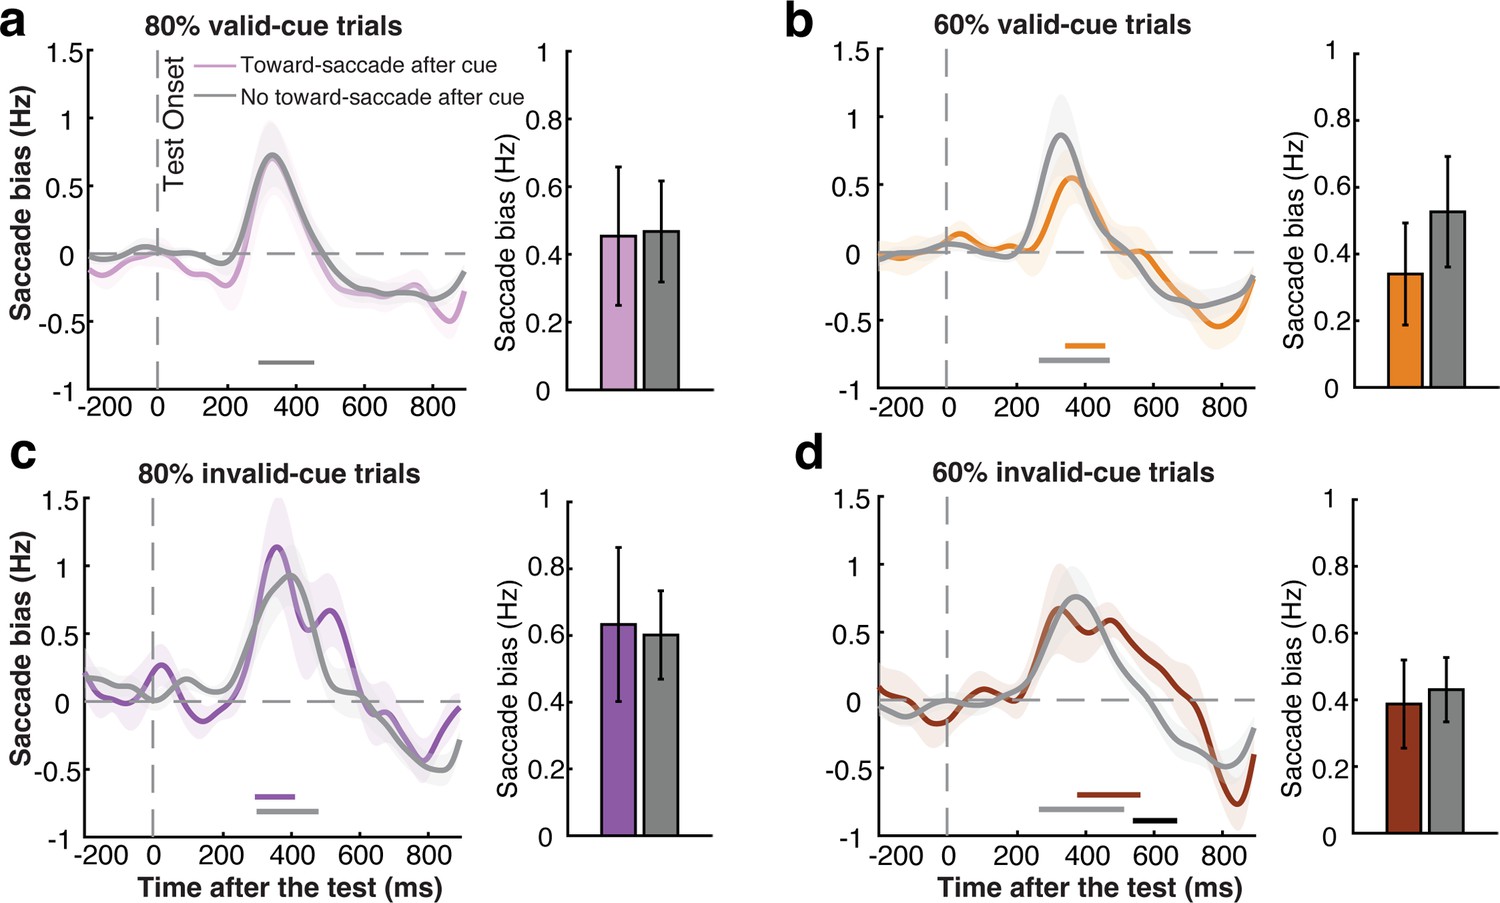
Re-orienting of attention after the memory test is not contingent on initial orienting after the cue.
(a) Left panel: saccade bias towards the memorized location of the test item after memory test in trials with and without a toward saccade after the cue for validly cued trials in 80% cue-reliability block. Right panel: size of the test-locked saccade bias for the trials split by the preceding cue-locked saccades, averaged over the time window in which we observed the respective test-locked gaze bias in this condition. (b) As per panel a, but for 60% valid-cue trials. (c) and (d), as per panels a and b, but for invalidly cued trials. Colored horizontal lines above the x-axis indicate significant clusters (p<0.05). The black horizontal line above the x-axis in panel (d) indicates the significant difference cluster (p<0.05) between trials with and without a toward-saccade after the cue. Shading indicates ± 1 SEM.
Figure 5
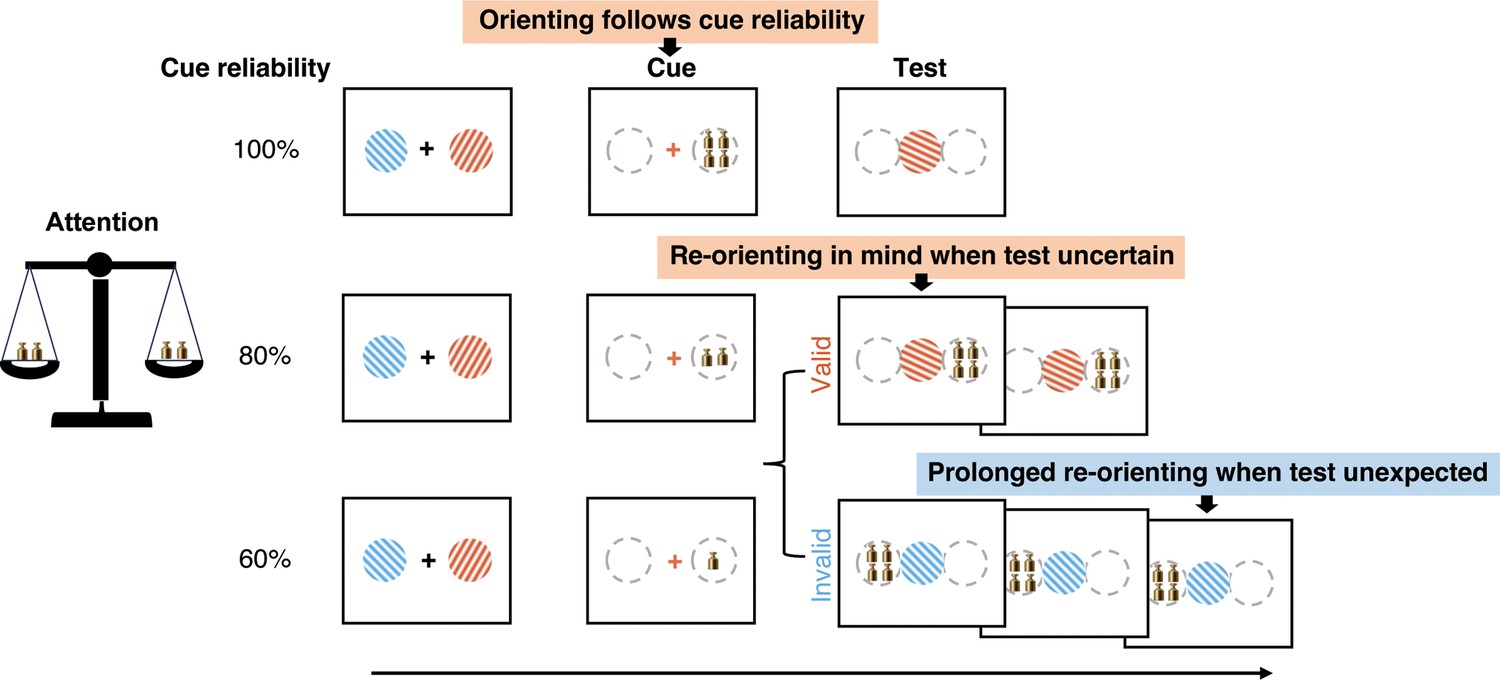
Schematic summary of the main findings.
Schematic summary of our central findings regarding dynamic attentional orienting and re-orienting after the cue and the memory test, as a function of cue reliability and test expectations.
Additional files
Download links
A two-part list of links to download the article, or parts of the article, in various formats.
Downloads (link to download the article as PDF)
Open citations (links to open the citations from this article in various online reference manager services)
Cite this article (links to download the citations from this article in formats compatible with various reference manager tools)
Re-focusing visual working memory during expected and unexpected memory tests
eLife 13:RP100532.
https://doi.org/10.7554/eLife.100532.3


