Deuterium metabolic imaging phenotypes mouse glioblastoma heterogeneity through glucose turnover kinetics
- Preclinical MRI, Champalimaud Research, Champalimaud Foundation, Portugal
- Neuroengineering and Computational Neuroscience, Institute for Research and Innovation in Health (i3S), Portugal
- Center of Functionally Integrative Neuroscience (CFIN) and MINDLab, Department of Clinical Medicine, Aarhus University, Aarhus, Denmark; Department of Physics and Astronomy, Aarhus University, Denmark
- Histopathology Platform, Champalimaud Research, Champalimaud Foundation, Portugal
Figures
Figure 1 with 9 supplements
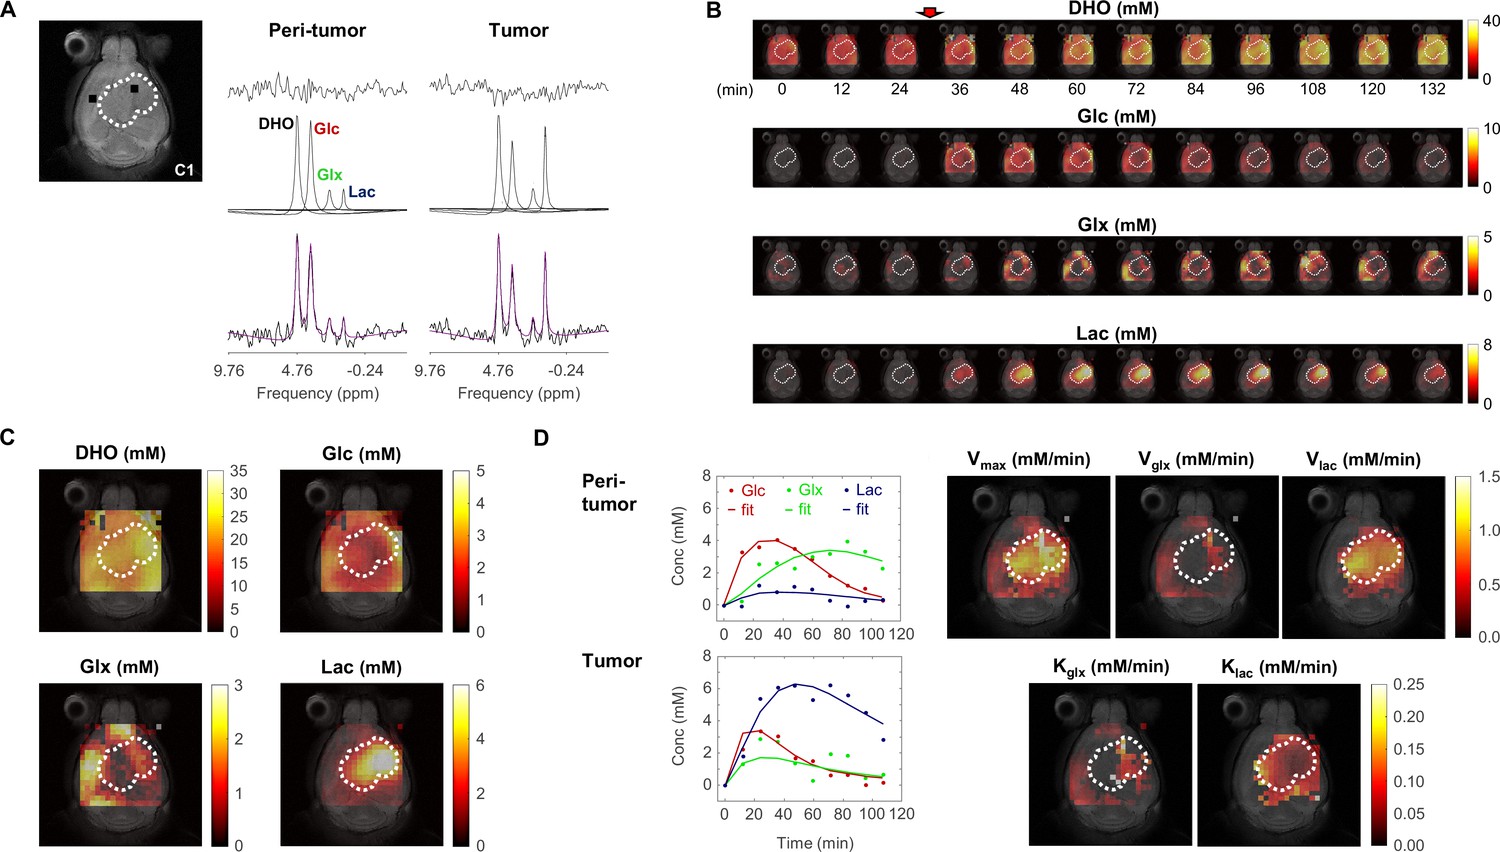
Metabolic concentration and flux maps from DGE-DMI in mouse glioblastoma (GBM).
Example of a CT2A tumor (C1). (A) T2-weighted reference image (top-left) displaying the tumor region (dashed lines) and representative peritumor and tumor voxels (back dots), and respective spectral quantifications (right-side): bottom, raw spectrum (black) with overlaid estimation (purple); center, individual components for each metabolite peak (black - semi-heavy water, DHO (black); deuterated glucose, Glc (red); and glucose-derived glutamate-glutamine and lactate, Glx (green) and Lac (blue)); top, residual. (B) Time-course de novo concentration maps for each metabolite (mM) following Glc i.v. injection (red arrow). (C) Average concentration maps for each metabolite after Glc injection. (D) Time-course concentration plots for each metabolite (dots) and respective kinetic fitting (straight lines), displayed for the peritumor and tumor voxels shown in A (same color codes) and applied to all the voxels to generate glucose flux maps: maximum consumption rate (Vmax); and respective individual rates for lactate synthesis (Vlac) and elimination (klac), and glutamate-glutamine synthesis (Vglx) and elimination (kglx).
Figure 1—figure supplement 1
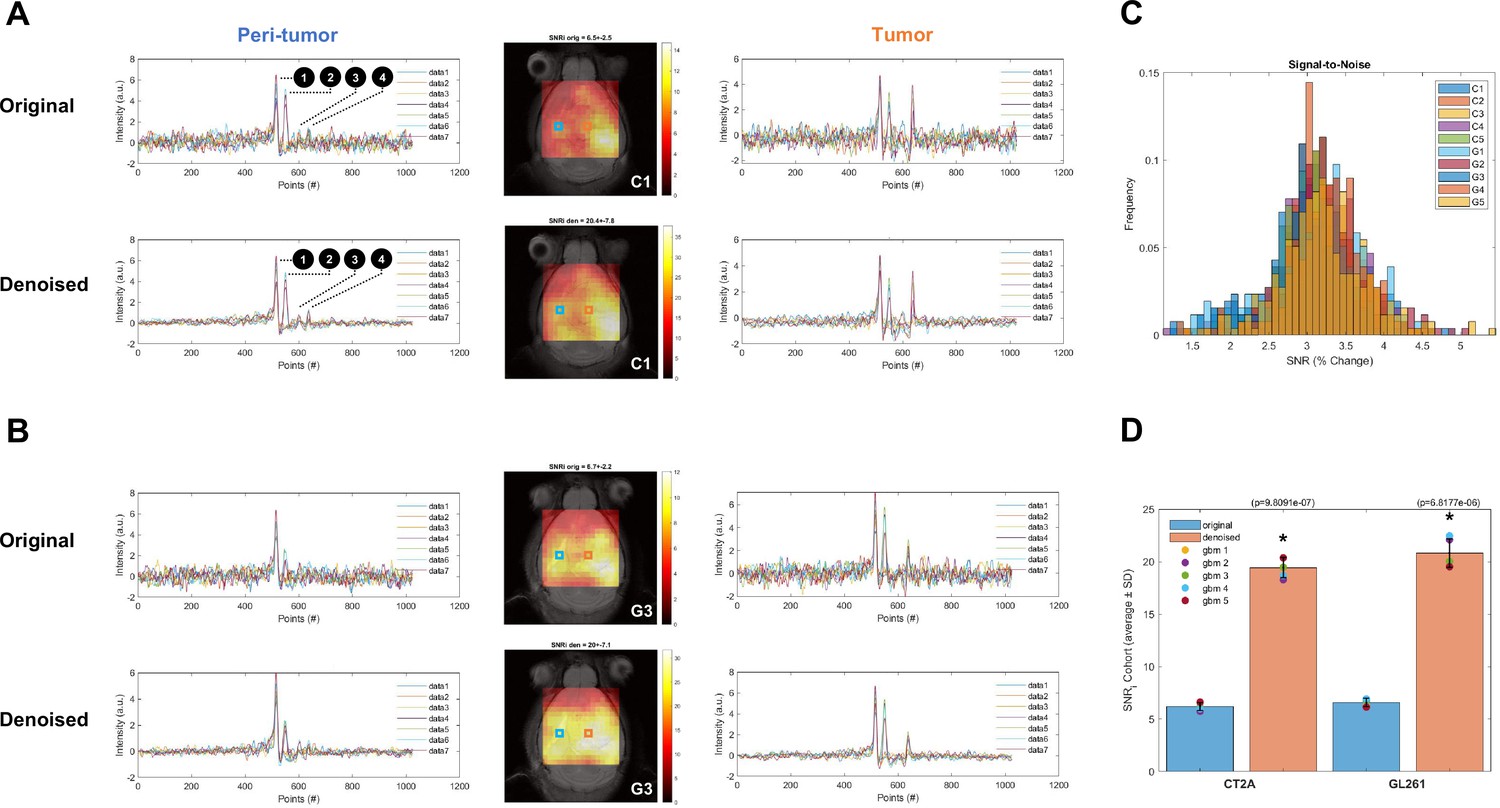
Tensor principal component analysis (PCA) denoising improves DGE-DMI SNR in mouse glioblastoma (GBM).
Examples of CT2A (C1, A) and GL261 (G3, B) subjects, showing the signal-to-noise-ratio (SNR) maps (center) from the original data and after tensor PCA denoising, as well as examples of time-course spectra from tumor (right-side) and peri-tumoral regions (left-side) in each condition – voxel positions overlaid on the SNR maps (orange and blue, respectively). (C) Histograms of pixel-wise SNR fold-changes after tensor PCA denoising for each subject (color-coded). (D) Significant SNR increase in CT2A and GL261 cohorts after tensor PCA denoising (unpaired t-test: * p<0.001.). 1, semi-heavy water signal (DHO); 2, 6,6′ -2H2-glucose (Glc); 3, 4,4′ -2H-glutamate-glutamine (Glx); 4, 3,3′ -2H-lactate (Lac).
Figure 1—figure supplement 2
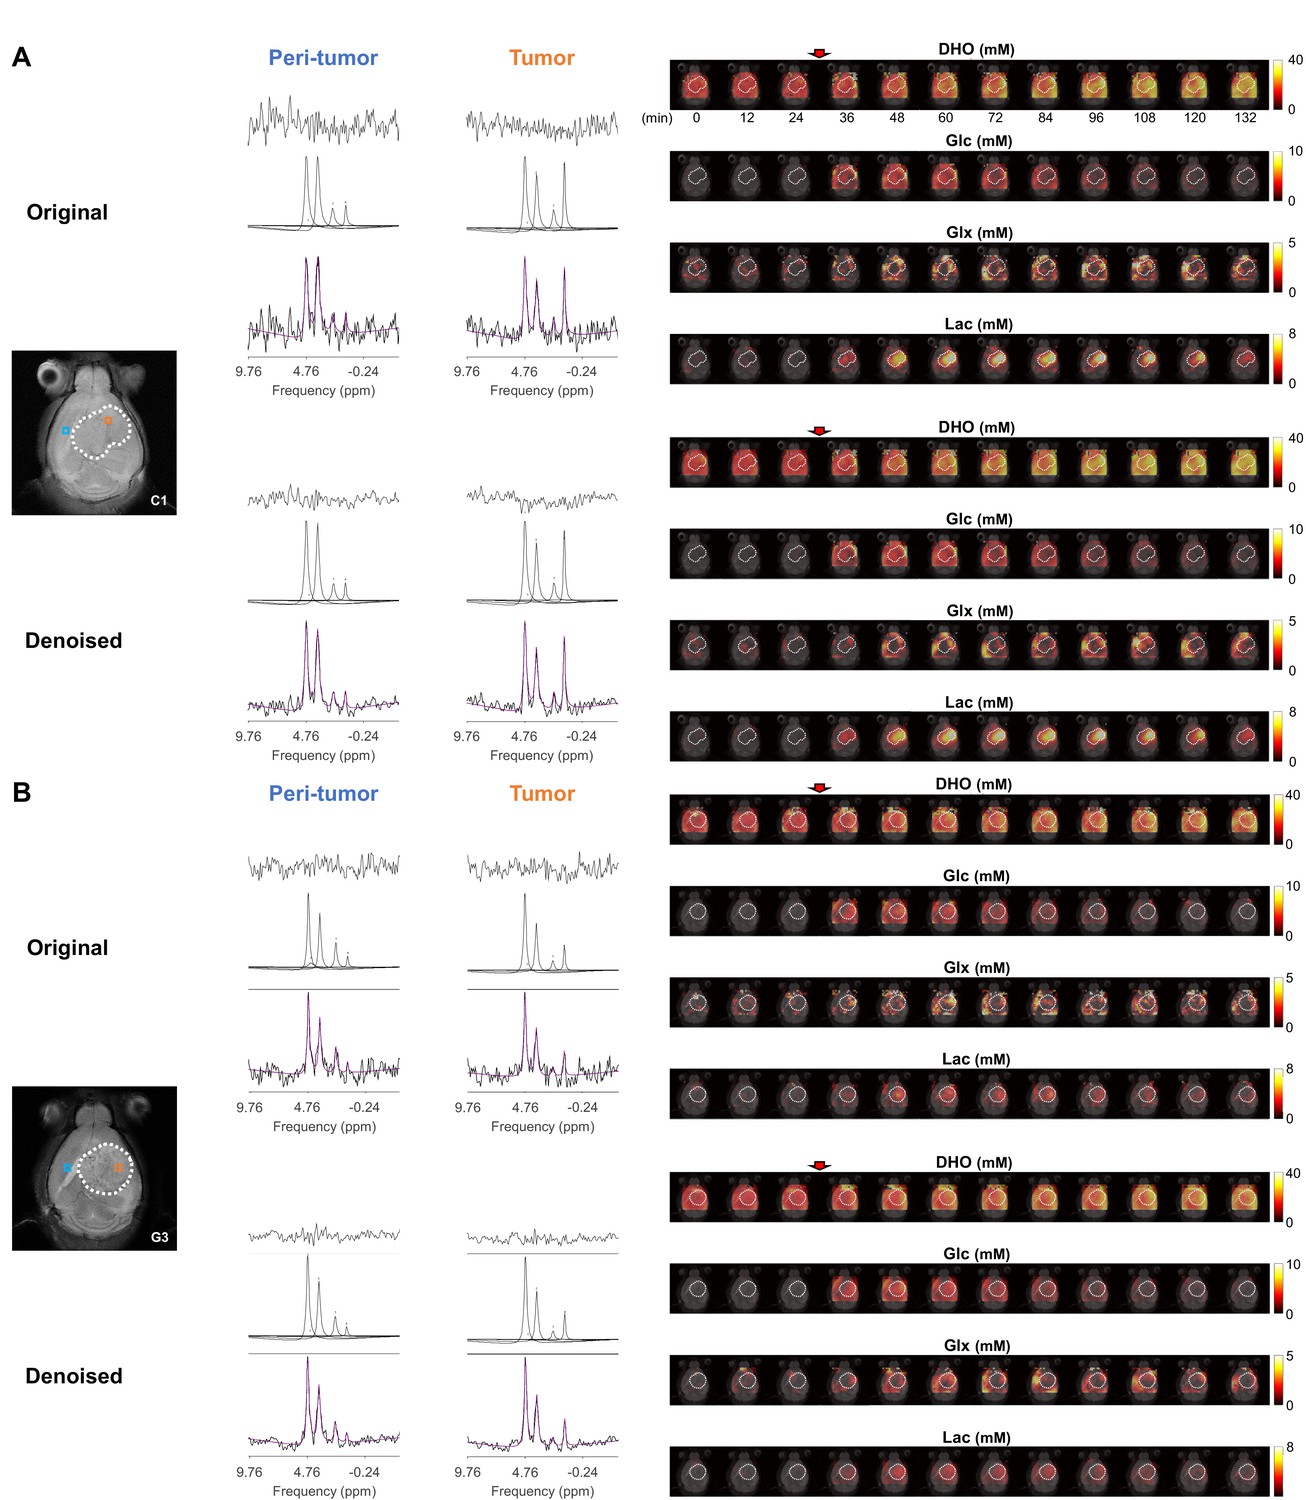
Quantification of DGE-DMI data.
Examples of CT2A (C1, A) and GL261 (G3, B) subjects, and respective tumor regions (dashed lines), showing: on left-side, the improved spectral quality and respective quantification in tumor and peritumor regions (bottom, raw spectrum with overlaid estimation in purple; center, individual components; top, residual); and on the right-side, time-course metabolic concentration maps of (top-to-bottom) DHO, Glc, Glx, and Lac, following Glc i.v. injection.
Figure 1—figure supplement 3
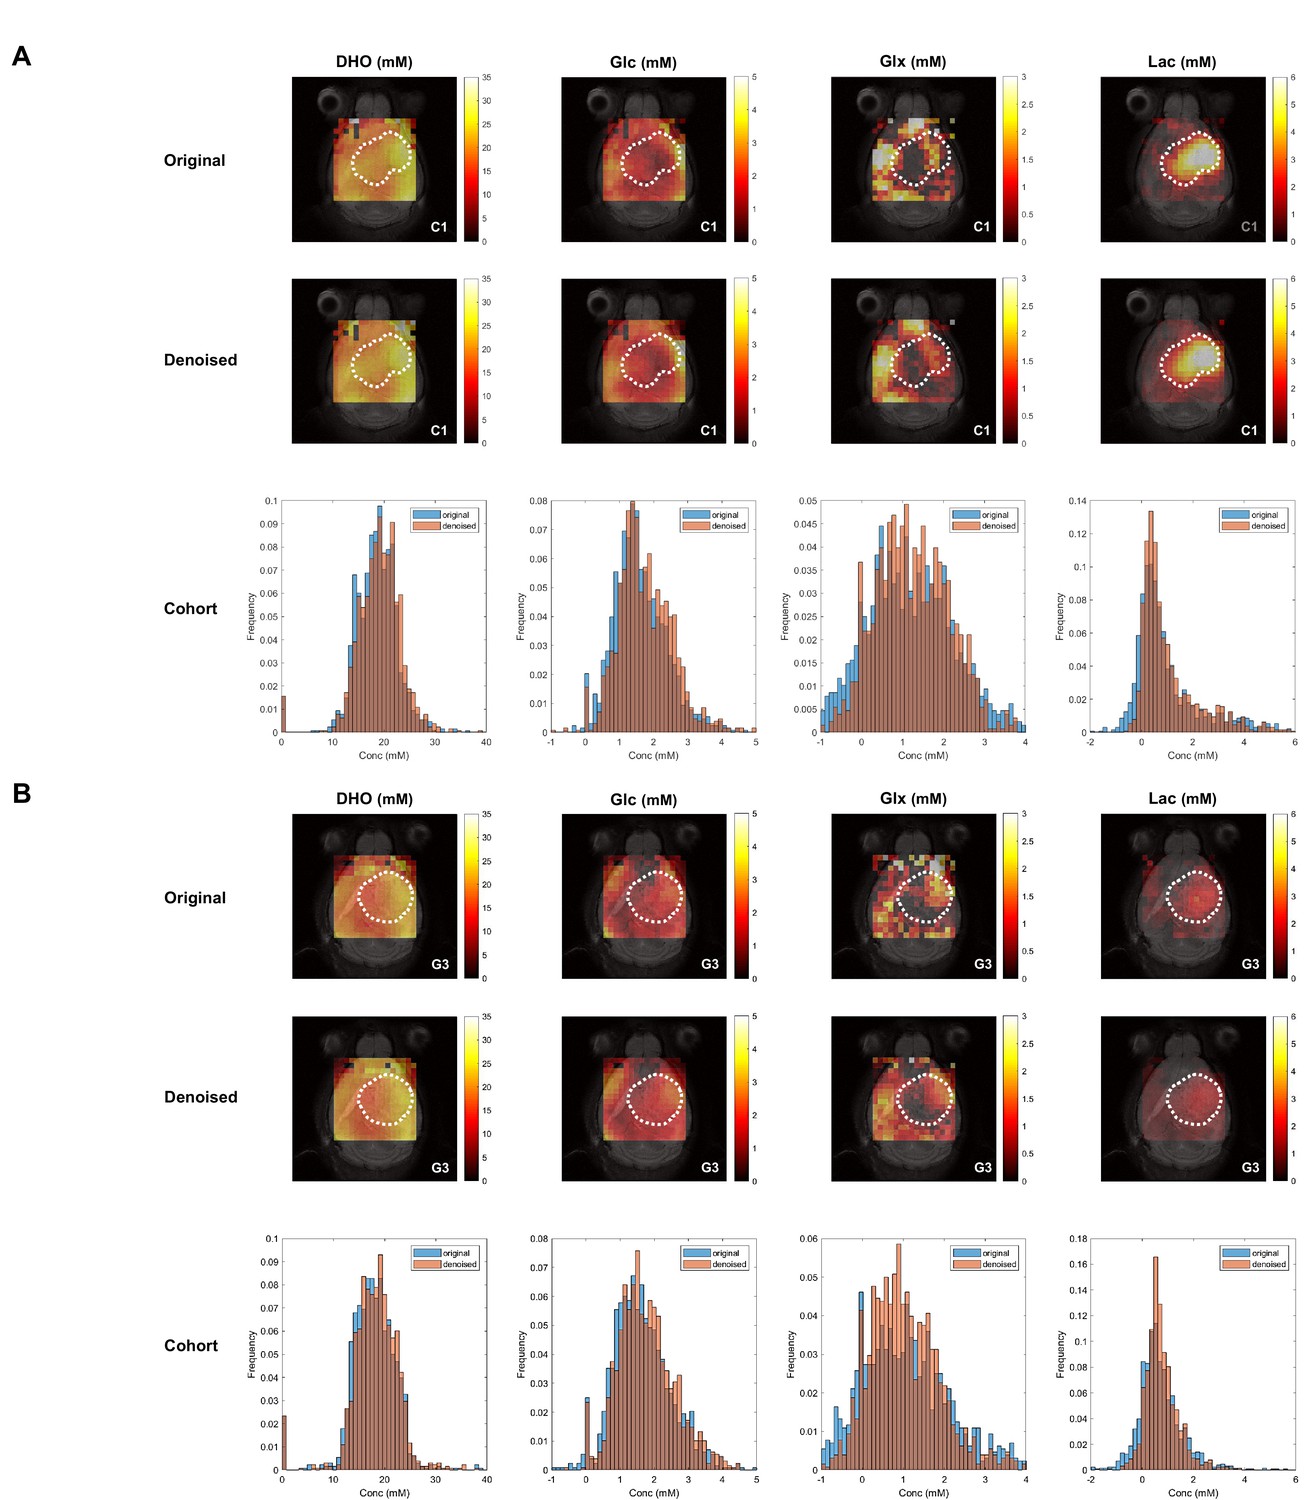
Tensor principal component analysis (PCA) denoising has no overall effect on pixel distributions of DGE-DMI metabolic concentration maps in pooled glioblastoma (GBM) cohorts.
CT2A (A) and GL261 (B) cohorts, showing examples (subjects C1 and G3, respectively) of de novo concentration maps generated from original data (first row) and tensor PCA denoised data (second row): DHO, glucose (Glc), glucose-derived glutamine-glutamate (Glx) and lactate (Lac) (top, left-to-right). Total pixel distributions of the total cohorts (n=5 each) are also displayed for each map (bottom).
Figure 1—figure supplement 4
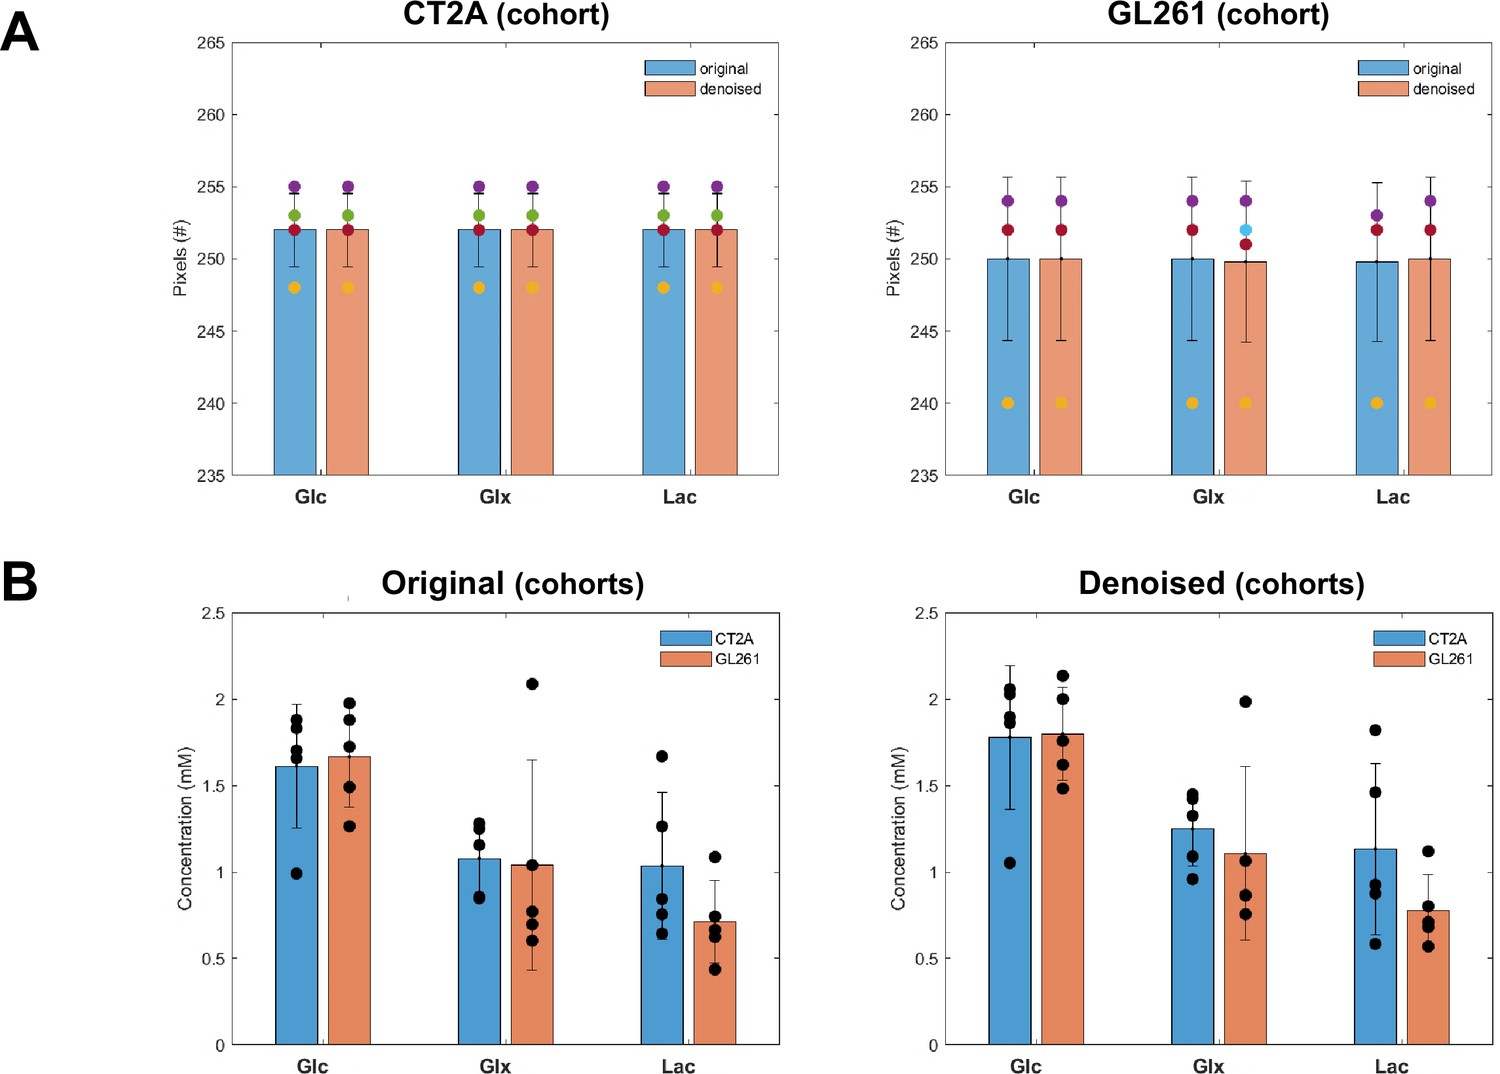
Tensor principal component analysis (PCA) denoising has no effect on pixel detectability or glioblastoma (GBM) cohort differences of DGE-DMI time-course average metabolic concentration maps.
Time-course average of pixel detected in CT2A (left-side, n=5) and GL261 (right-side, n=5) cohorts, comparing tensor PCA denoising (n=5) vs original (n=5) for each one: no significant differences detected (paired t-test). (B) Cohort differences of original (left-side) and tensor PCA denoised data (right-side), comparing CT2A (n=5) vs GL261 (n=5) for each one: no significant differences detected (unpaired t-test). Error bars: standard deviation.
Figure 1—figure supplement 5
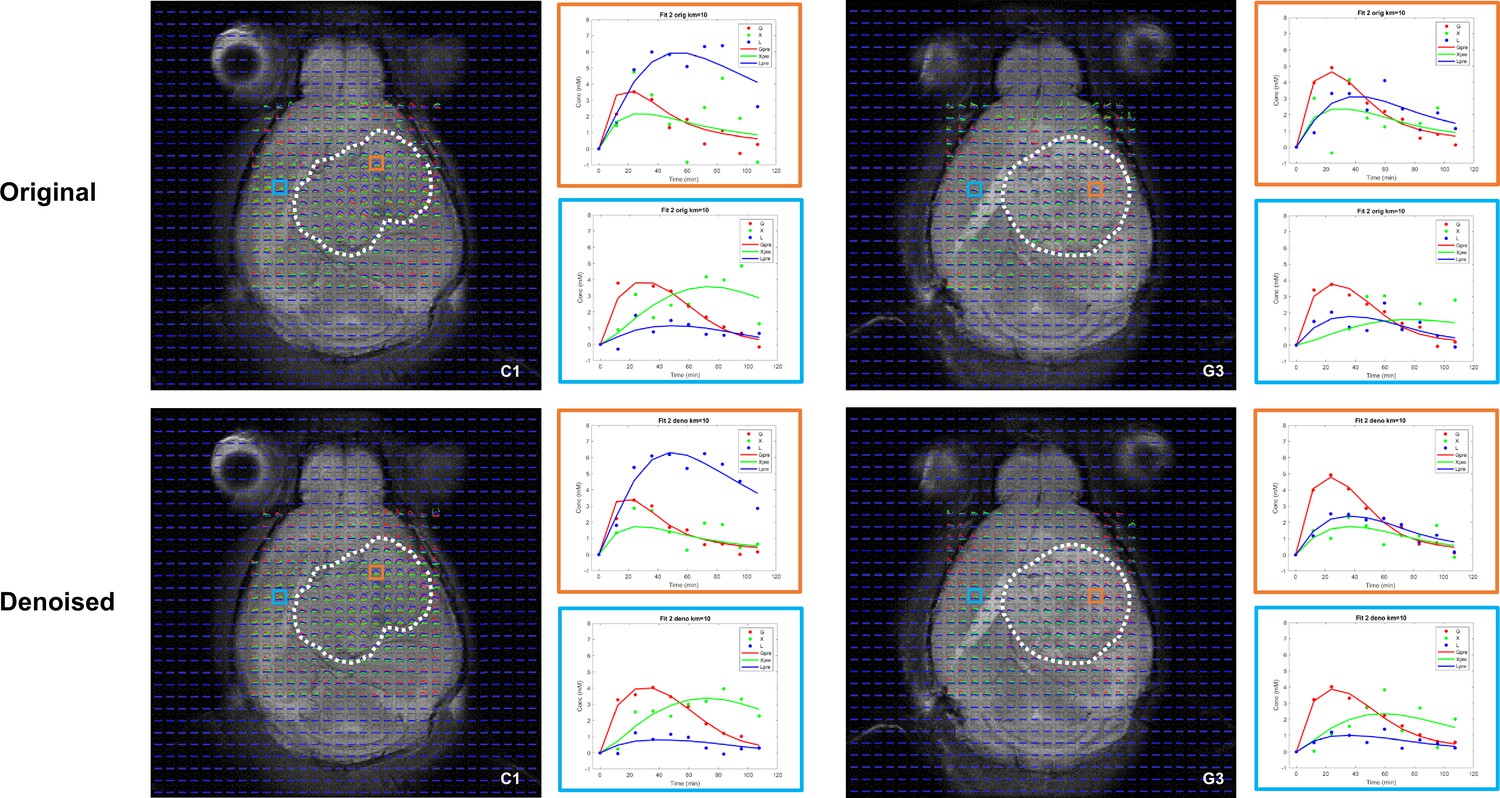
Kinetic modeling of DGE-DMI time-course concentration maps data.
Examples of CT2A (C1, left-side) and GL261 (G3, right-side) subjects and respective tumor regions (dashed lines), with overlaid time-course concentration plots for each metabolite – Glc (red), Glx (green), and Lac (blue) – and respective kinetic fitting (straight lines, same color codes). Voxels from tumor (orange) and peritumoral (light blue) regions are shown enlarged, displaying original data (top) and tensor principal component analysis (PCA) denoised data (bottom).
Figure 1—figure supplement 6
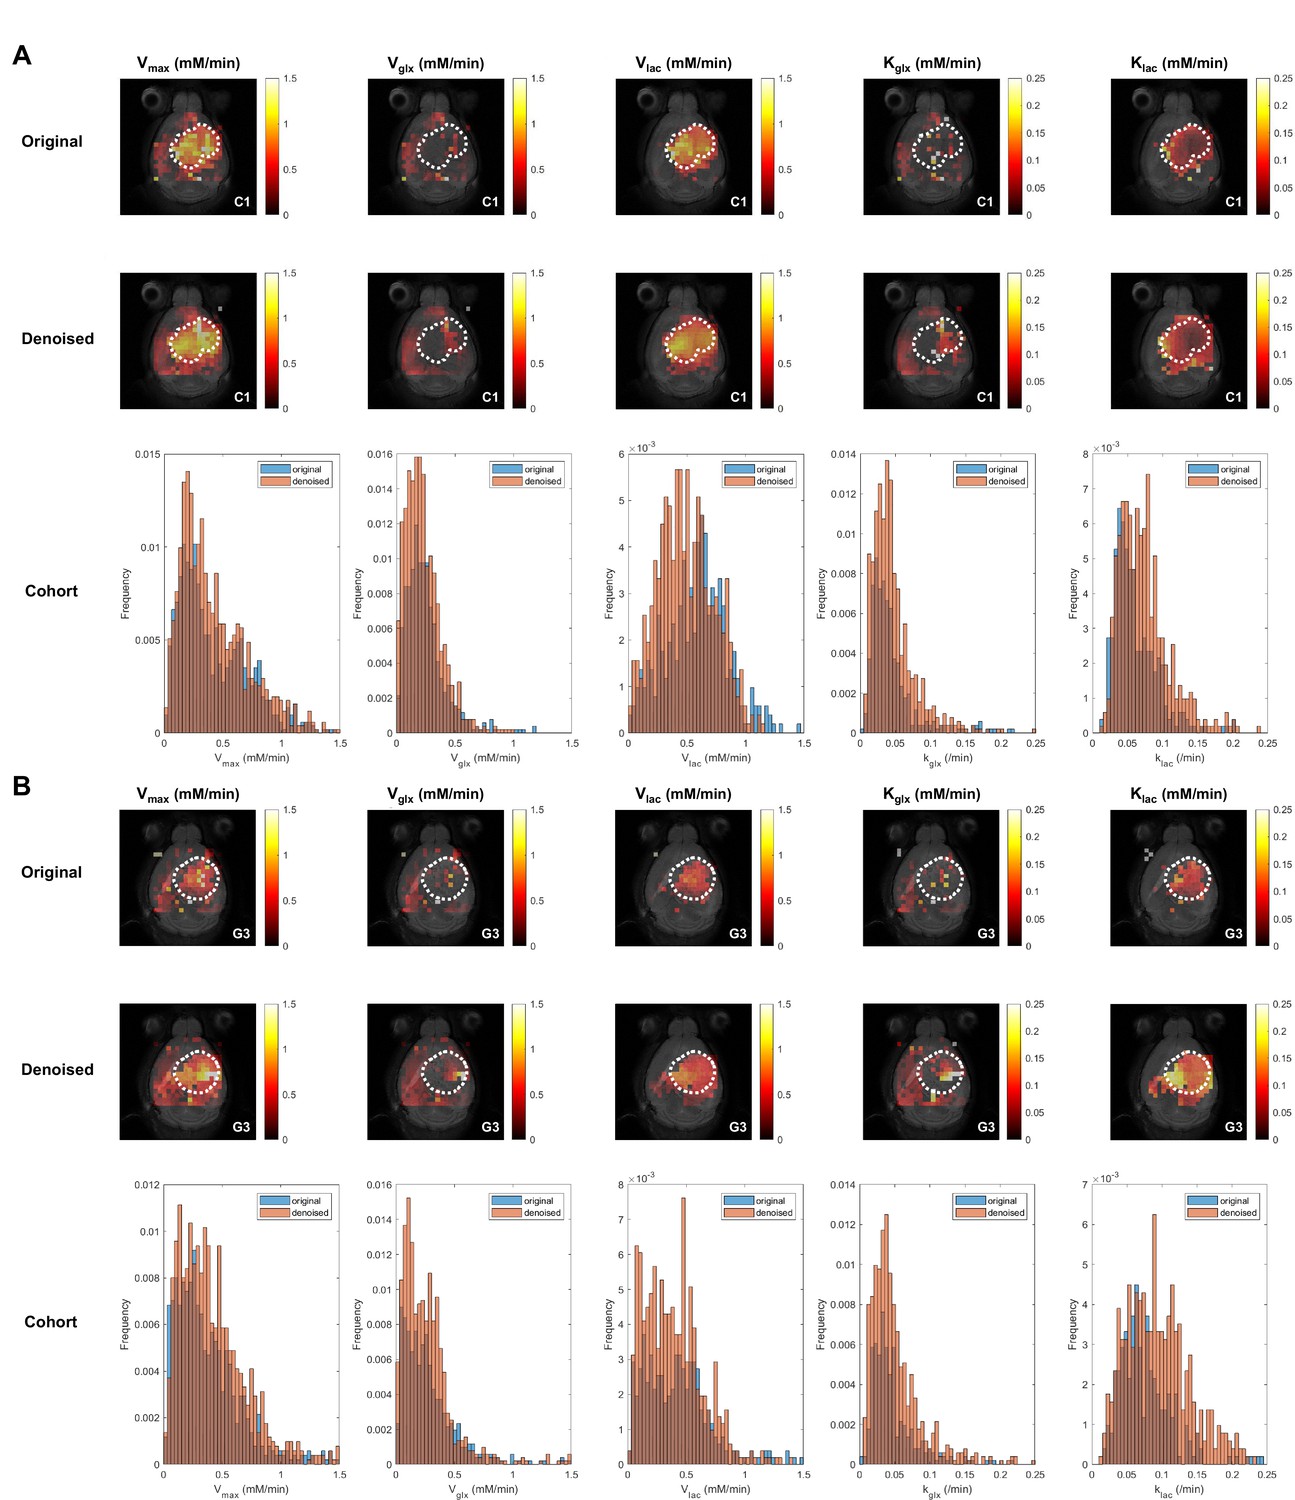
Tensor principal component analysis (PCA) denoising increases pixel densities of DGE-DMI metabolic flux maps in pooled glioblastoma (GBM) cohorts.
CT2A (A) and GL261 (B) cohorts, showing examples (subjects C1 and G3, respectively) of glucose flux maps (top) generated from original data (first row) and tensor PCA denoised data (second row): maximum consumption rate (Vmax) and respective consumption rates for lactate synthesis (Vlac) and elimination (klac), and glutamate-glutamine synthesis (Vglx) and elimination (kglx). Total pixel distributions of the total cohorts (n=5 each) are also displayed for each map (bottom).
Figure 1—figure supplement 7
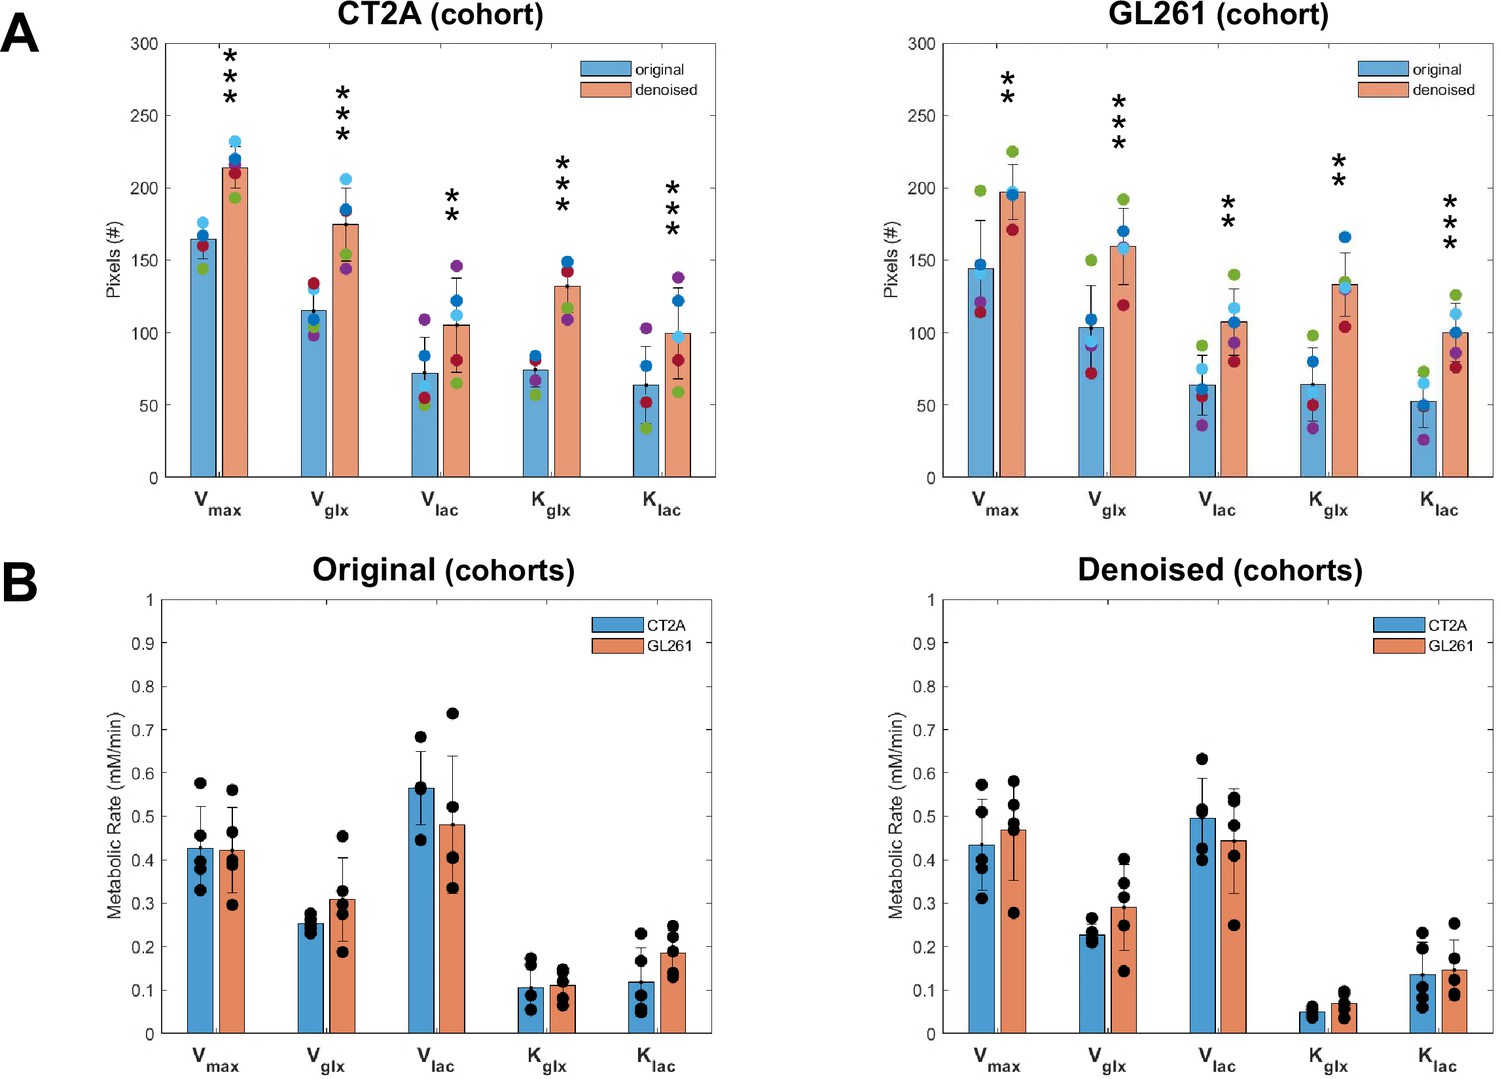
Tensor principal component analysis (PCA) denoising improves pixel detectability without affecting glioblastoma (GBM) cohort differences of DGE-DMI metabolic flux maps.
(A) Time-course average of pixels detected in CT2A (left-side) and GL261 (right-side) cohorts, comparing tensor PCA denoising (n=5) vs original (n=5) for each one (paired t-test: **p<0.01, ***p<0.001) – overall pixel detectability: CT2A, +53±18%; GL261, +73±30%. (B) Cohort differences of original (left-side) and tensor PCA denoised data (right-side), comparing CT2A (n=5) vs GL261 (n=5) for each one: no significant differences detected (unpaired t-test). Error bars: standard deviation.
Figure 1—figure supplement 8
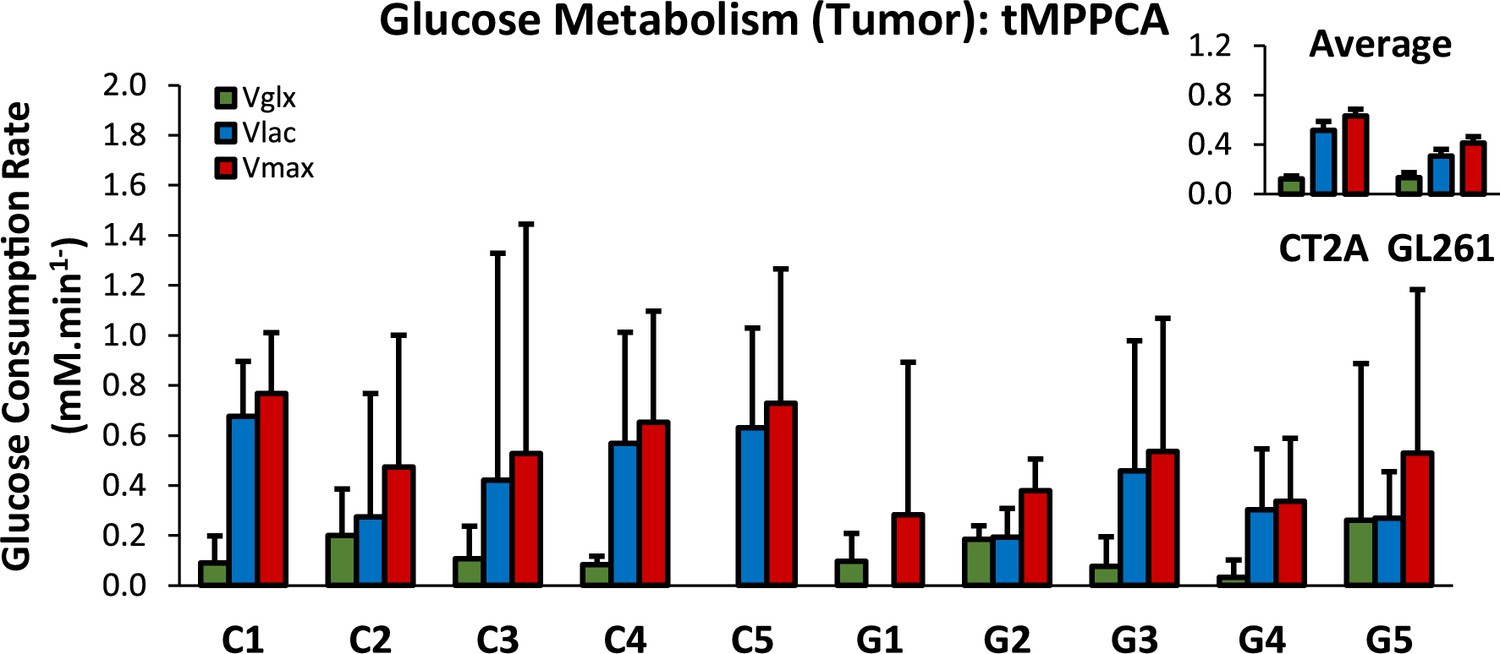
Glucose consumption rates in mouse glioblastoma (GBM) tumors following ROI averaged raw data.
Free induction decay (FID) averaging within each tumor ROI (CT2A, C1-5; and GL261, G1-5) was followed by Fourier Transform, tensor principal component analysis (PCA) spectral denoising, spectral quantification, and kinetic modeling, to derive the metrics displayed: synthesis rates of glucose-derived glutamate-glutamine (Vglx, green) and lactate (Vlac, blue), and maximum consumption rate of glucose (Vmax, red). Upper-right box displaying cohort averages (n=5 each). Plots: estimates ± SE (mM/min).
Figure 1—figure supplement 9
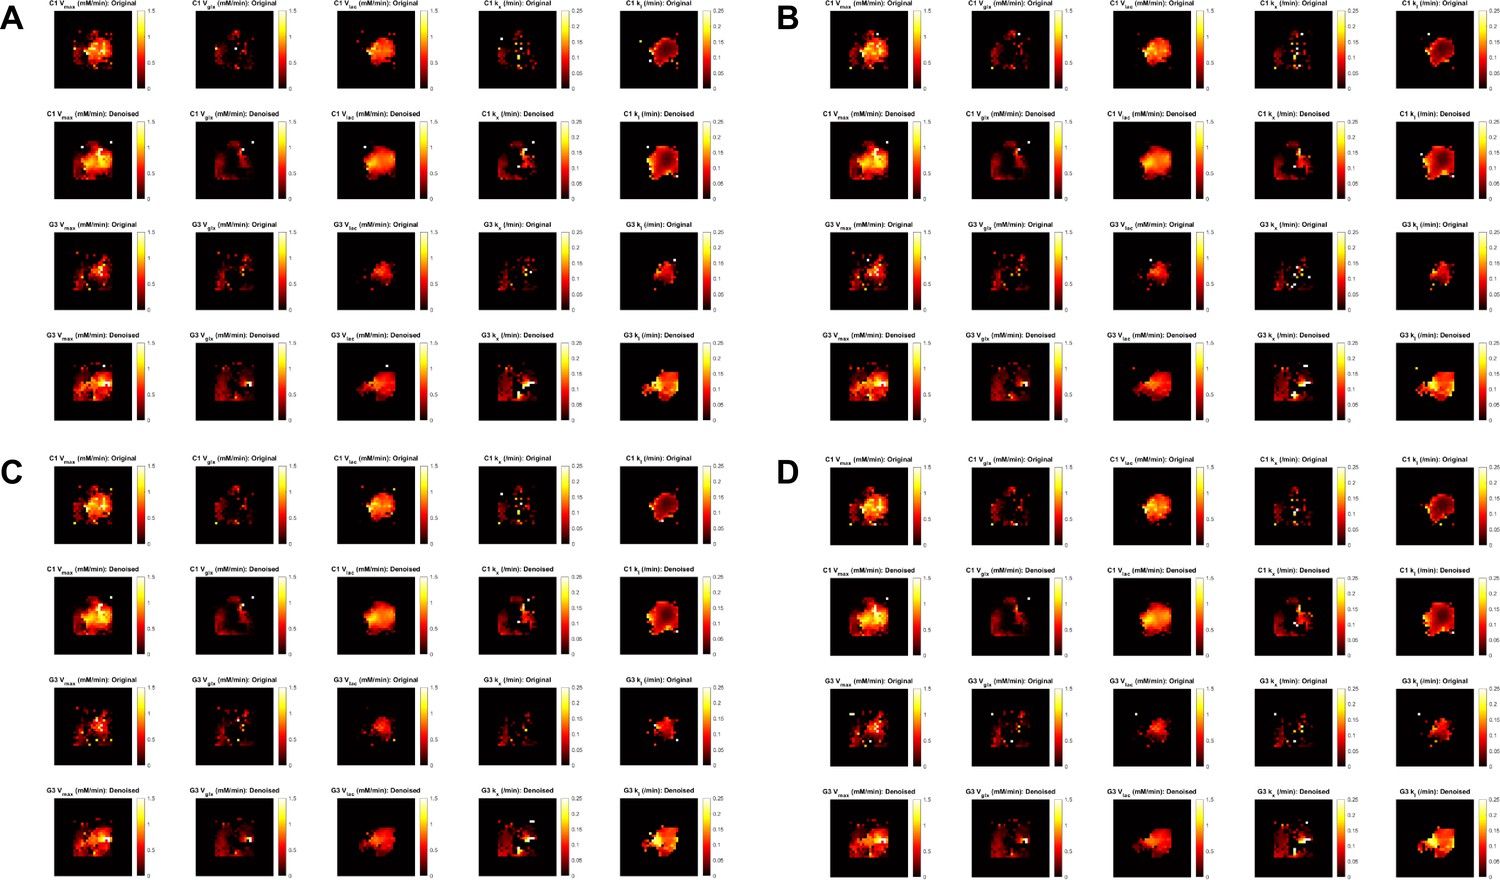
Effect of changing ve on the metabolic maps derived from kinetic modeling.
Fixing the extracellular volume fraction to: (A) cohort minima (CT2A, 0.14; GL261, 0.21); (B) cohort means (CT2A, 0.18; GL261, 0.26); (C) average of (A–C) values (pooled cohorts, 0.19); (D) pooled cohort average (0.22). Each panel displays CT2A (C1, rows 1–2) and GL261 (G3, rows 3–4) subjects, showing results from original data (rows 1 and 3) and tensor PCA denoised data (rows 2 and 4) for the metabolic maps (left-to-right): maximum glucose consumption rate (Vmax), glucose consumption for synthesis of glutamate-glutamine (Vglx) and lactate (Vlac), and their respective consumption rates (kglx and klac).
Figure 2 with 1 supplement
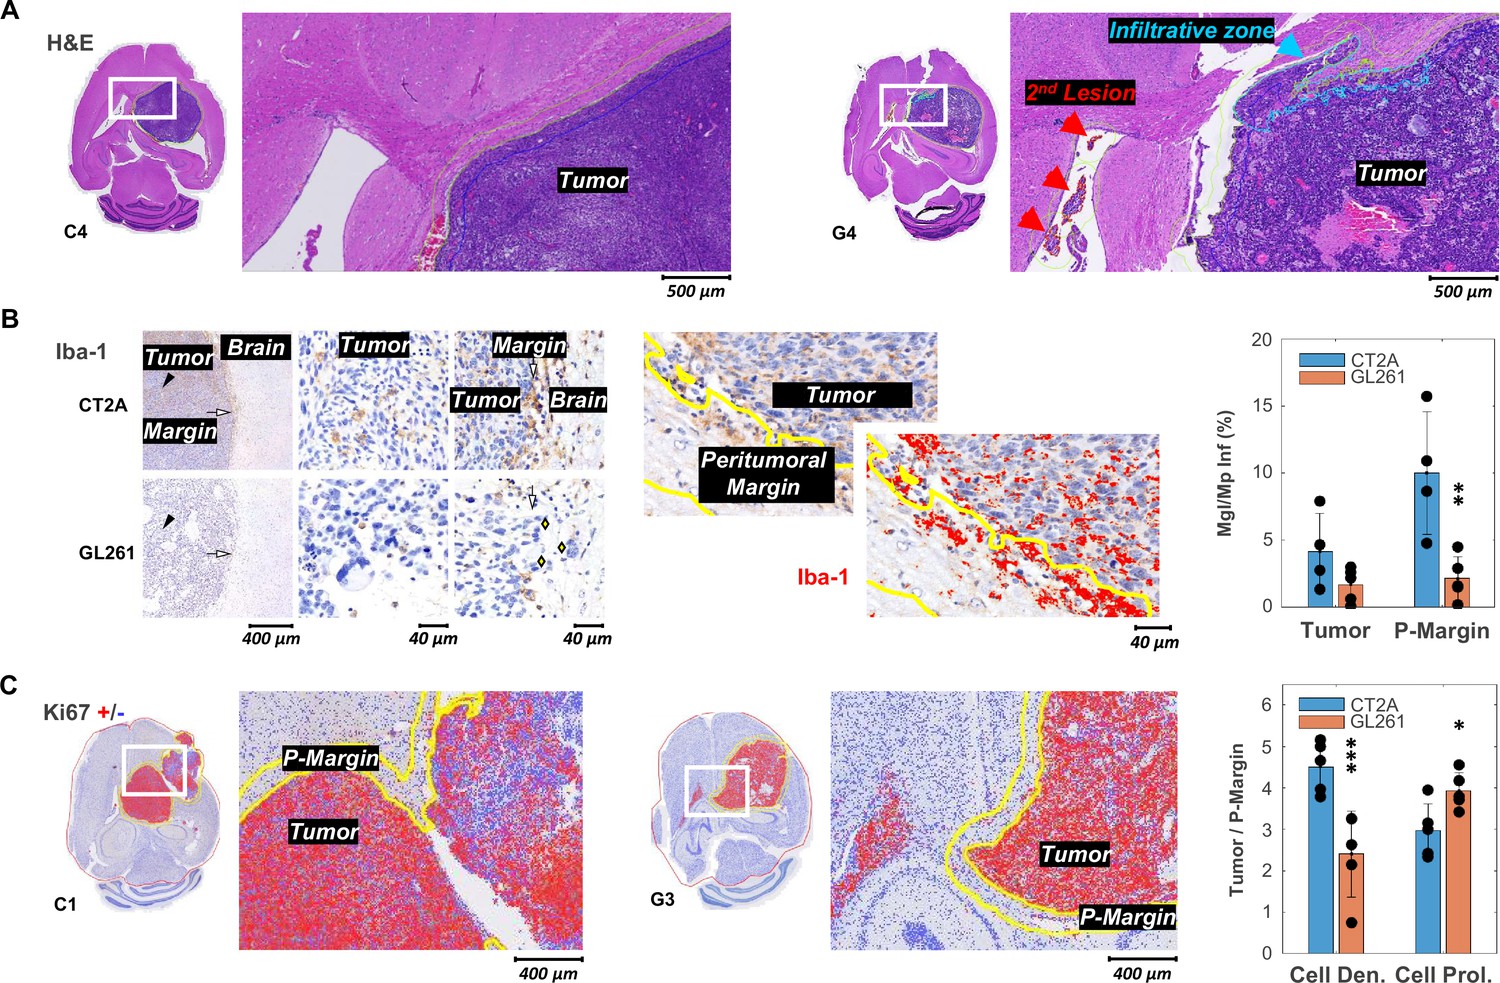
Histopathologic and immunohistochemical assessment in two mouse models of glioblastoma (GBM).
(A) H&E-stained sections with high magnification to highlight annotations of tumor, infiltrative zones in the tumor margin (blue), and secondary lesion (red), in CT2A and GL261 tumors (subjects C4 and G4, respectively). (B) Iba-1 immunostained sections showing microglia/macrophage (Mgl/Mp) infiltration in CT2A and GL261 tumors: left panels, tumor core (black arrowhead) and tumor margin (white arrow) relative to the adjacent brain parenchyma; middle and right panels, depicting more infiltration by microglial/macrophage in CT2A tumors, also with clearer well-demarcated margin where IBA-1-positive cells are more densely concentrated compared to the more diffuse and irregular infiltration seen in the GL261 model; GL261 show poorly demarcated tumor border where tumor cells infiltrate the brain parenchyma (yellow diamonds); center panels, Iba-1 ROI quantification in tumor and peritumoral margin (P-Margin, yellow lines), and with red mask overlay of Iba-1 positive cells; right panel, quantification of mean Iba-1 positive area in Tumor and P-Margin regions from each cohort: GL261 (n=5) and CT2A (n=4; C2 sample excluded due to peritumoral hemorrhage/vascular ectasia, which distorted the peritumoral area and impaired proper assessment of peritumoral infiltration). (C) Ki67 immuno-stained sections with overlaid detection of positive (red) and negative (blue) cells; and high magnification to highlight annotations of tumor and peritumor border (P-Margin, yellow lines), in CT2A and GL261 tumors (subjects C1 and G3, respectively); and GBM cohort differences in tumor/P-Margin ratios of cell density and cell proliferation from GL261 (n=5) and CT2A (n=5) cohorts. Dots representative of average values for each subject. CT2A vs GL261: *p<0.05; **p<0.01; ***p<0.001; unpaired t-test. Error bars: standard deviation.
Figure 2—figure supplement 1
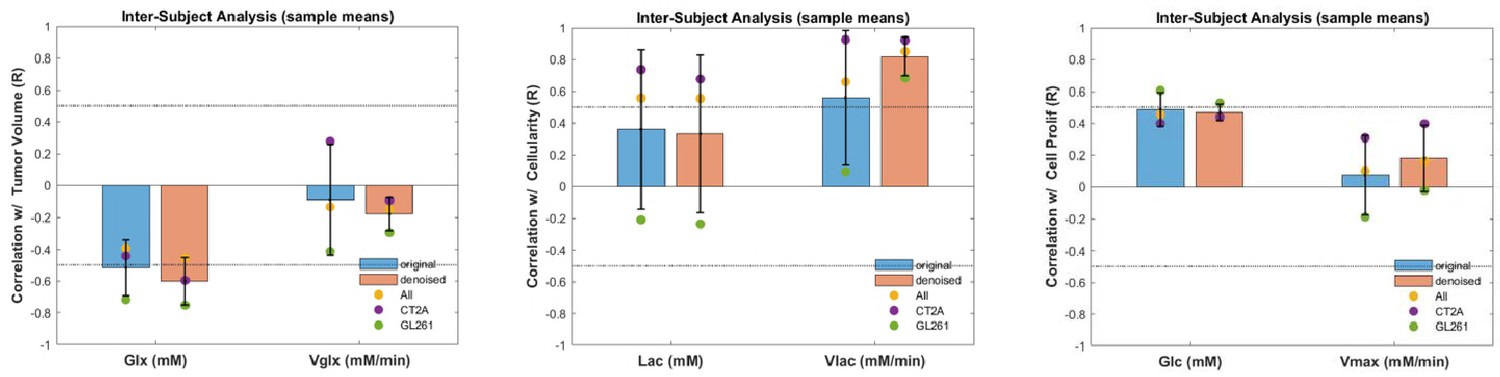
Gross inter-subject correlations of averaged metabolic maps.
Correlation coefficients (Pearson R) are displayed for CT2A (purple), GL261 (green), and pooled cohorts (CT2A+GL261, yellow), contrasting results from original data (blue) and tensor principal component analysis (PCA) denoised data (orange). Left-side, glutamate-glutamine accumulation (Glx) and glucose consumption rate for its synthesis (Vglx) vs tumor volume. Center, lactate accumulation (Lac) and glucose consumption rate for its synthesis (Vlac) vs cellularity. Right-side, glucose accumulation (Glc) and maximum consumption rate (Vmax) vs cell proliferation.
Figure 3 with 1 supplement
Mouse glioblastoma (GBM) models with different histopathologic phenotypes underlied by regional differences in lactate metabolism.
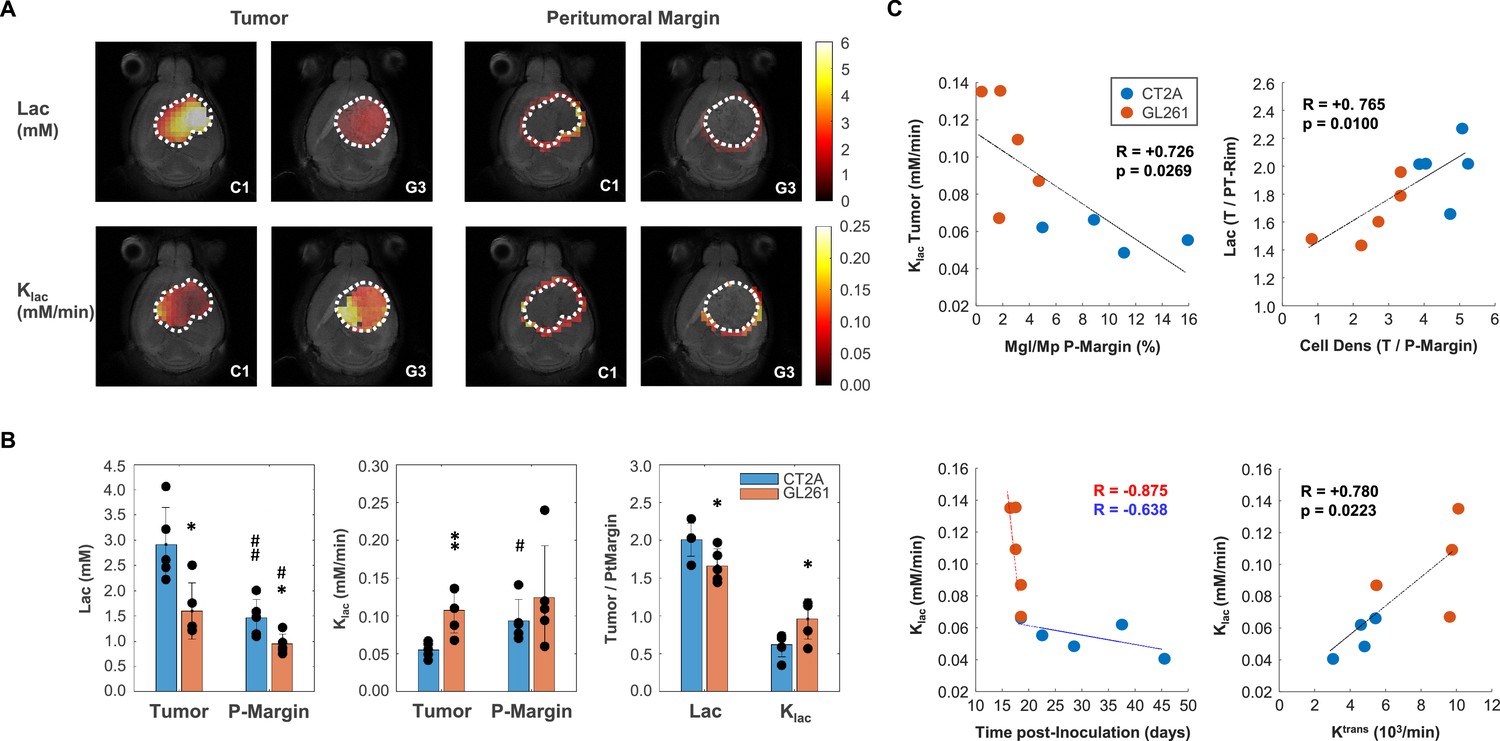
(A) Metabolic maps of de novo lactate accumulation (mM) and respective consumption/elimination rates (mM/min), in tumor and peritumor border regions (P-Margin, delineated by dashed lines) of CT2A and GL261 tumors (subjects C1 and G3, respectively). (B) GBM cohort differences in de novo lactate accumulation (Lac) and consumption/elimination rates (klac). (C) Strong linear correlations indicated by the Person correlation coefficient, (R) of: top-left, Tumor lactate consumption/elimination rates with P-Margin infiltration of microglia/macrophages in pooled cohorts; top-right, Tumor-to-P-Margin ratios of lactate accumulation and cell density in pooled cohorts; bottom, lactate consumption/elimination rates with (left-side) time post-tumor inoculation in each cohort, and (right-side) tumor vascular permeability in pooled cohorts. CT2A (n=5) vs GL261 (n=5): *p<0.05; **p<0.01; unpaired t-test. Tumor (n=5, each cohort) vs P-Margin (n=5, each cohort): #p<0.05; ##p<0.01; paired t-test. Error bars: standard deviation. Bar plot dots are representative of average pixel values for each subject.
Figure 3—figure supplement 1
Intra-tumor pixel-wise correlations between metabolic and permeability metrics.
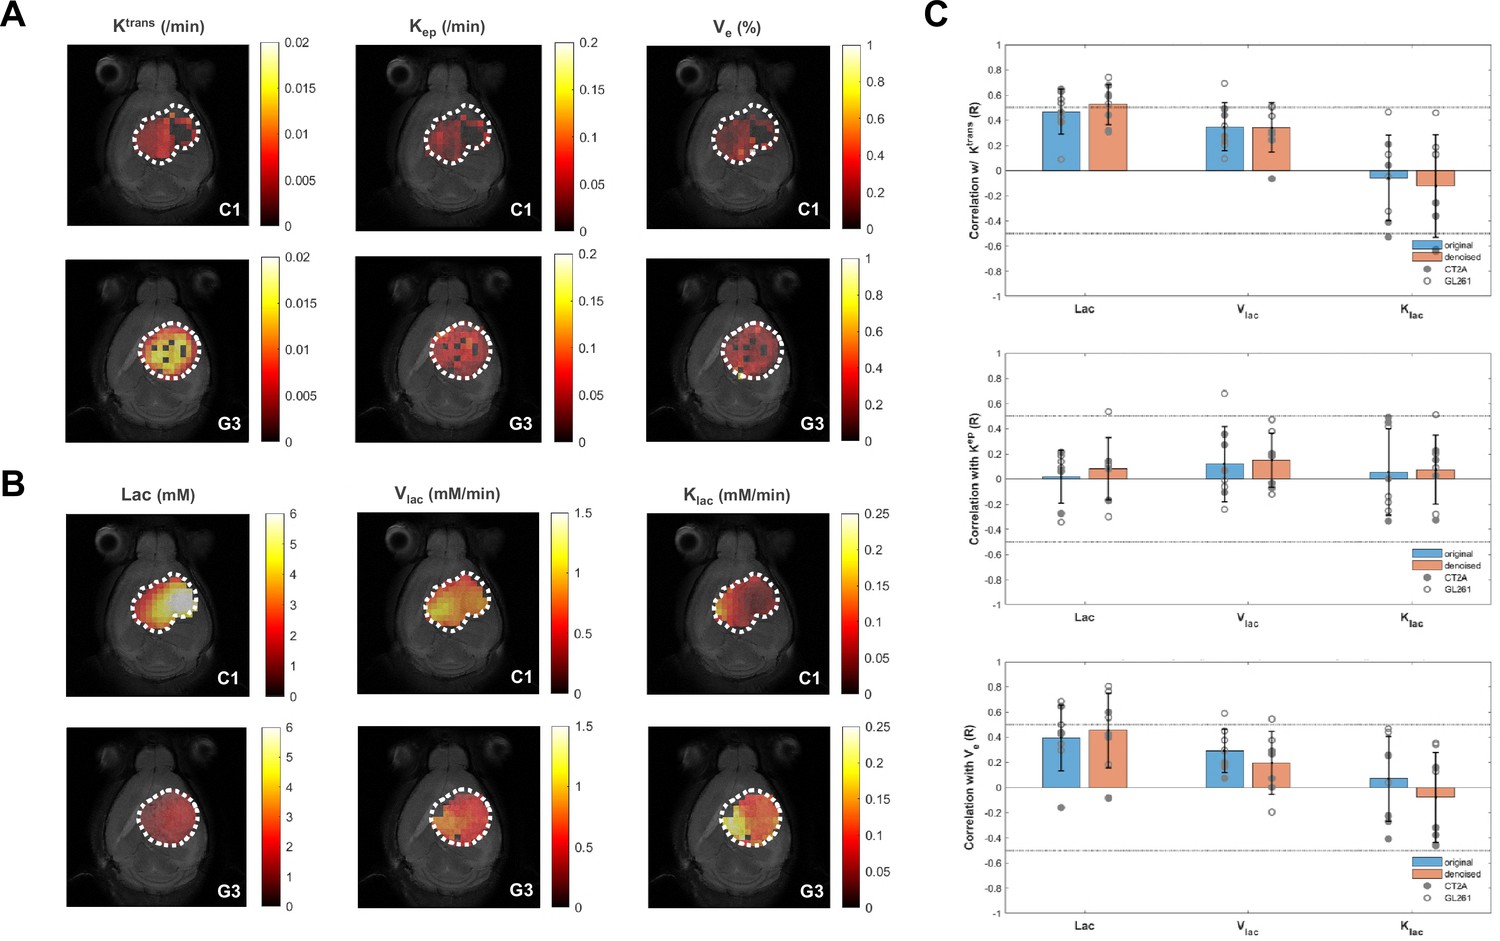
Examples of CT2A (C1) and GL261 (G3) subjects, display DCE-T1 permeability maps (A) and glucose-derived lactate maps derived from DGE-DMI after tensor principal component analysis (PCA) denoising (B, C) Correlations coefficients (Pearson R) displayed for each tumor in CT2A and GL261 cohorts (closed and open circles, respectively), contrasting results from original data (blue) and tensor PCA denoised data (orange).
Figure 4 with 1 supplement
Peritumoral metabolic changes consistent with recycling of the glutamate-glutamine pool mirror glioblastoma (GBM) infiltration and migration leading to secondary brain lesions.
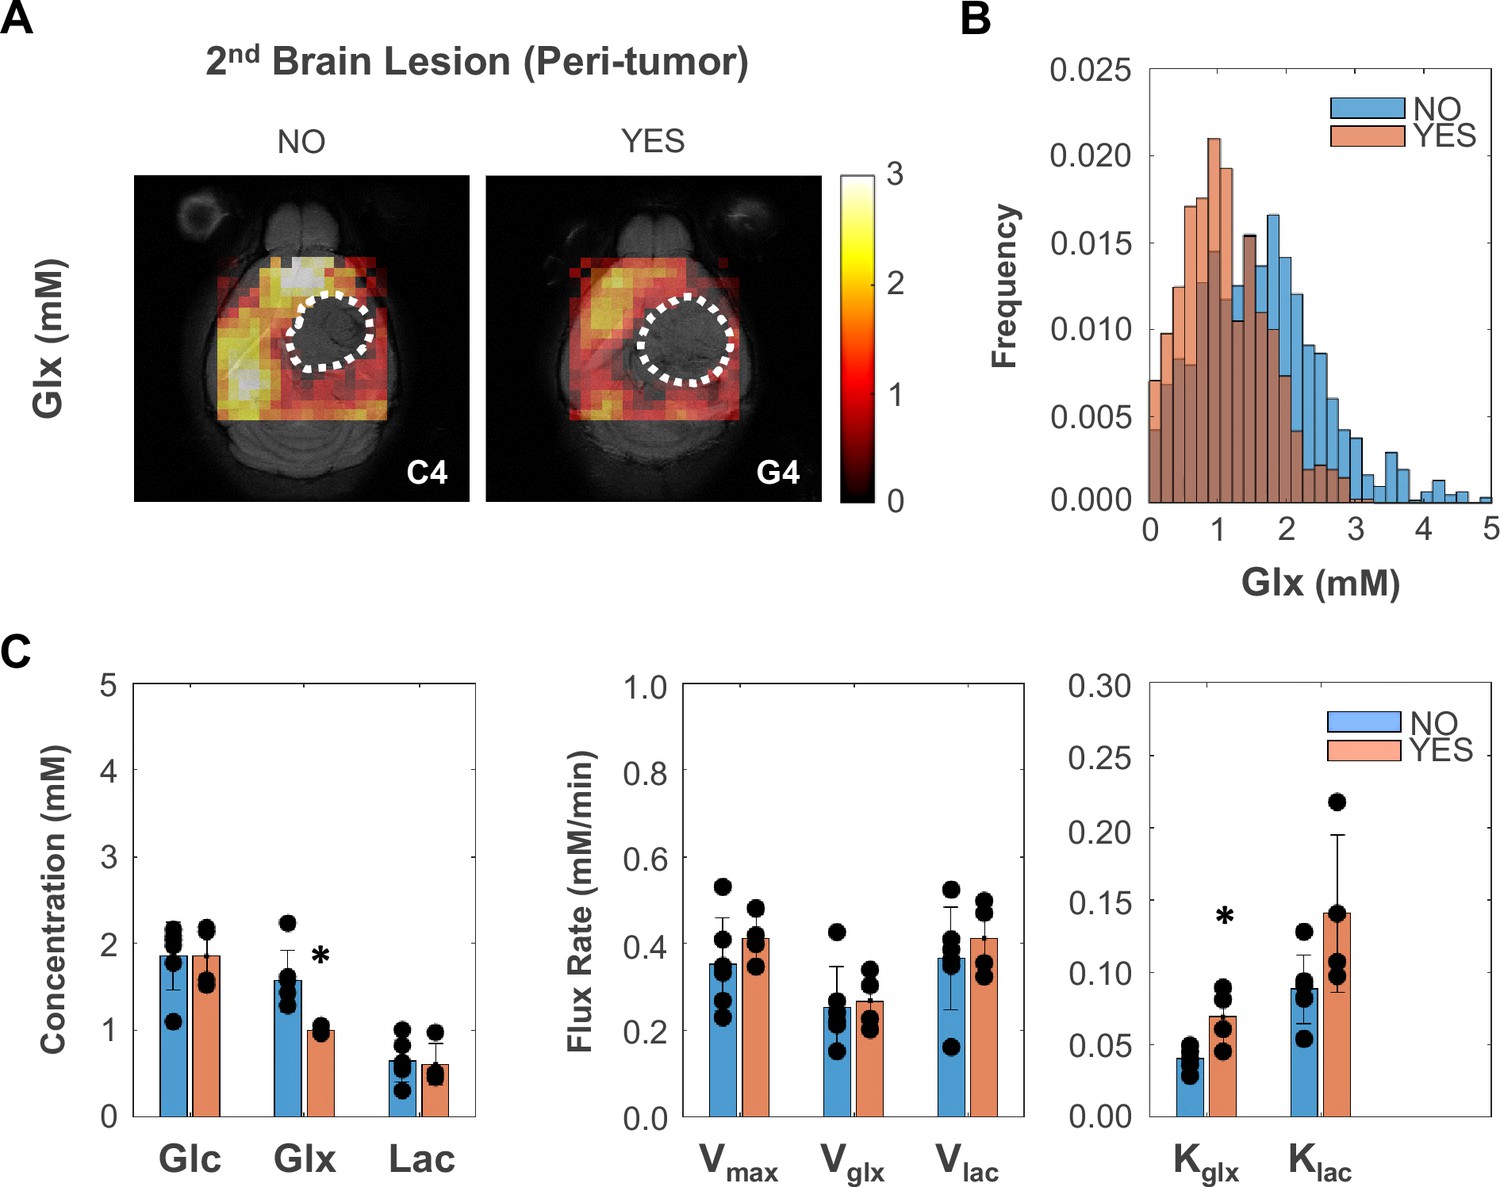
(A) Metabolic maps (Glx) of peritumoral regions without and with secondary brain lesions (C4 and G4 tumors, respectively). (B) Histogram distributions of peritumoral Glx accumulation in pooled GL261 and CT2A cohorts displaying secondary brain lesions (n=4) vs without (n=6). (C) Bar plot comparison of mean values, showing significant decreases in peritumoral glutamate-glutamine accumulation (Glx) and increases in its consumption/elimination (kglx) in pooled GL261 and CT2A cohorts displaying secondary brain lesions (n=4; vs n=6 without): *p<0.05; unpaired t-test. Bar plot dots representative of average pixel values for each subject. Error bars: standard deviation.
Figure 4—figure supplement 1
Tumor metabolic changes mirror glioblastoma (GBM) infiltration and migration leading to secondary brain lesions.
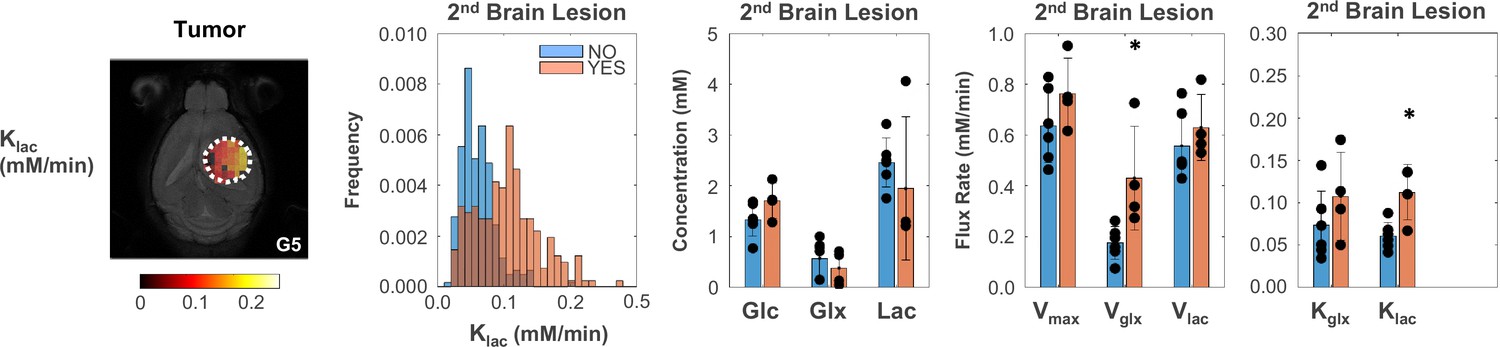
Metabolic map (left-side: C5 tumor), histogram distributions (center: pooled GL261 and CT2A cohorts), and group comparison of mean values (right-side: bar plots), indicating significantly higher rates of glutamate-glutamine synthesis and lactate consumption/elimination in primary tumors displaying secondary brain lesions. Secondary lesion, with (n=4) vs without (n=6): *p<0.05 (klac +84%, p=0.010; and Vglx +146%, p=0.019); unpaired t-test. Bar plot dots representative of average pixel values for each subject. Error bars: standard deviation.
Additional files
-
Supplementary file 1
Supplementary tables.
- https://cdn.elifesciences.org/articles/100570/elife-100570-supp1-v1.docx
-
MDAR checklist
- https://cdn.elifesciences.org/articles/100570/elife-100570-mdarchecklist1-v1.docx
Download links
A two-part list of links to download the article, or parts of the article, in various formats.
Downloads (link to download the article as PDF)
Open citations (links to open the citations from this article in various online reference manager services)
Cite this article (links to download the citations from this article in formats compatible with various reference manager tools)
Deuterium metabolic imaging phenotypes mouse glioblastoma heterogeneity through glucose turnover kinetics
eLife 13:RP100570.
https://doi.org/10.7554/eLife.100570.3


