Glycolytic flux controls retinal progenitor cell differentiation via regulating Wnt signaling
- Biological Sciences, Sunnybrook Research Institute, Canada
- Department of Laboratory Medicine and Pathobiology, University of Toronto, Canada
- Department of Ophthalmology and Vision Sciences, University of Toronto, Canada
- Department of Biochemistry, University of Toronto, Canada
- Department of Medical Genetics, Hotchkiss Brain Institute, Alberta Children's Hospital Research Institute, University of Calgary, Canada
- Department of Biological Sciences, University of Lethbridge, Canada
- Pittsburgh Heart, Lung, and Blood Vascular Medicine Institute, University of Pittsburgh School of Medicine, United States
- Department of Computational and Systems Biology, University of Pittsburgh School of Medicine, United States
- McGowan Institute for Regenerative Medicine, University of Pittsburgh School of Medicine, United States
- Computational Biology Group, Luxembourg Centre for Systems Biomedicine, U of Luxembourg, Luxembourg
- CIC bioGUNE, Bizkaia Technology Park, Spain
- IKERBASQUE, Basque Foundation for Science, Spain
Figures
Figure 1 with 1 supplement
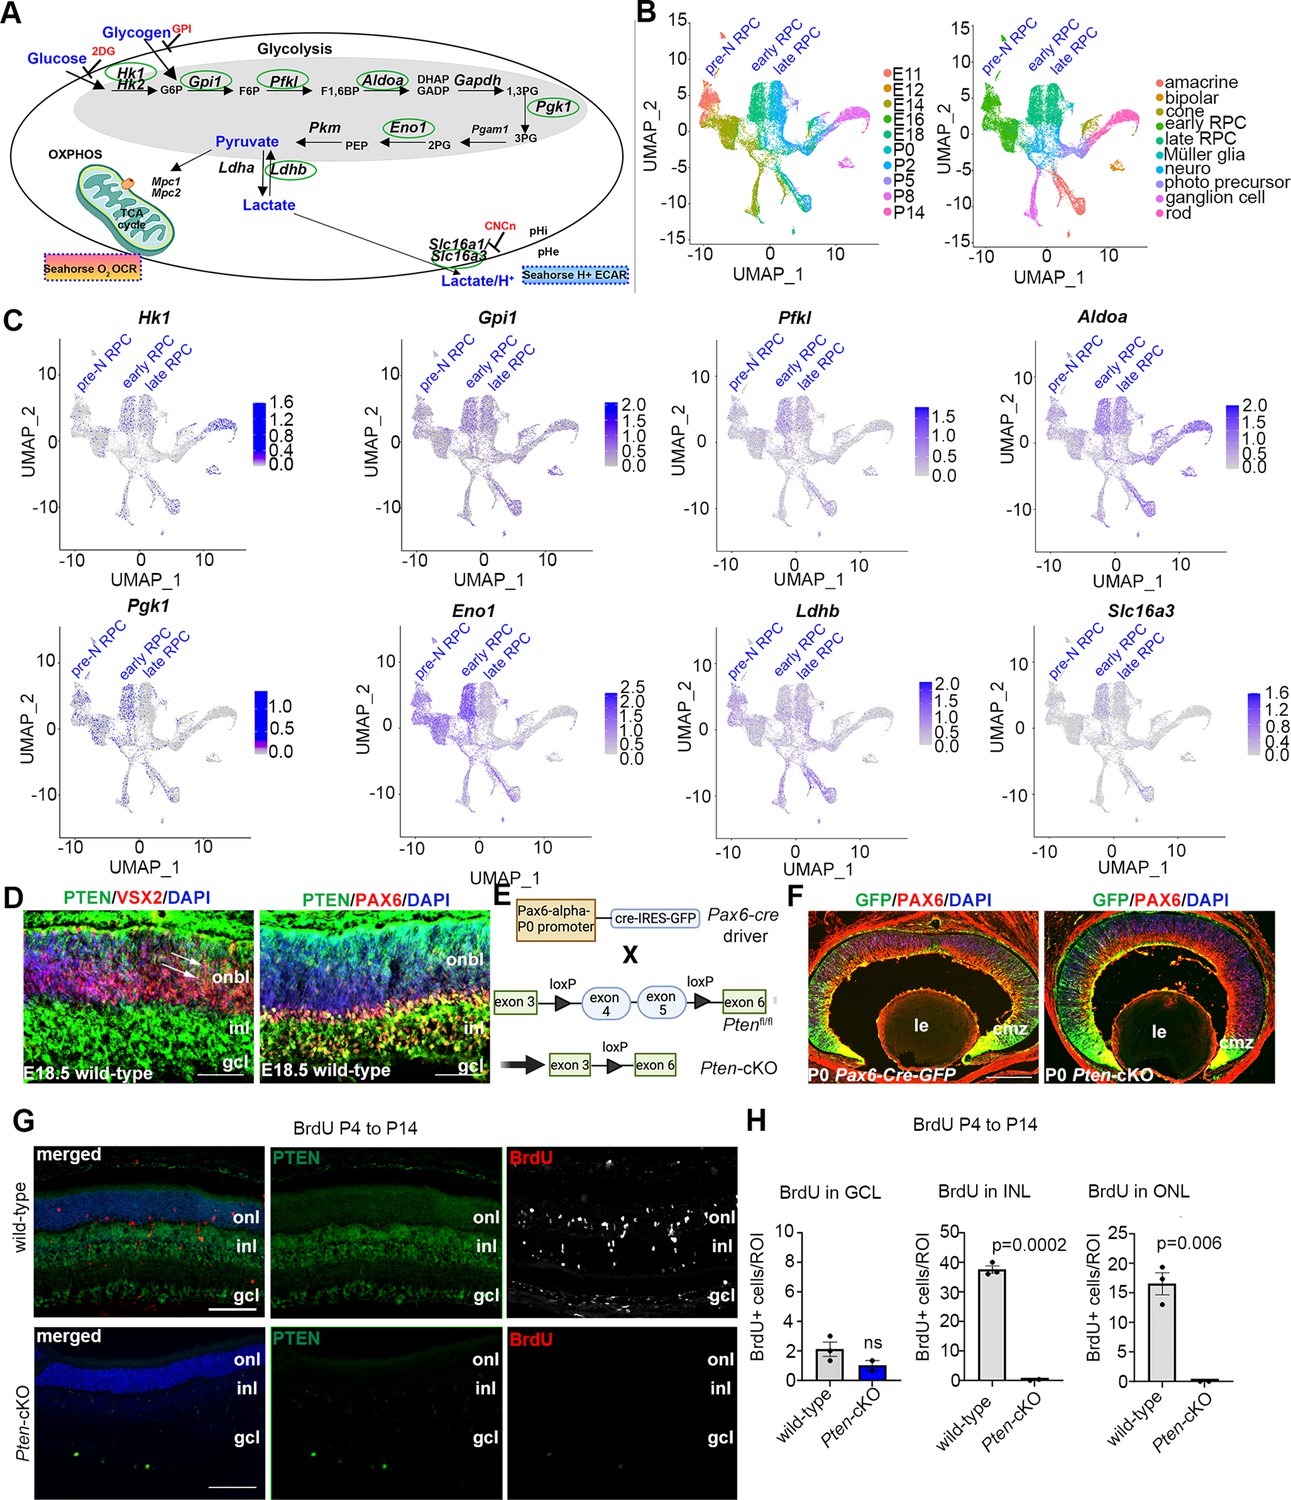
Glycolysis expression during development and accelerated development in Pten-cKO retinas.
(A) Schematic of the key enzymatic steps in glycolysis. (B) Uniform manifold approximation and projection (UMAP) plot of scRNA-seq data collected from wild-type retinas between E11 and P14 (Clark et al., 2019). Stages of data collection are color-coded in the first panel, and cell type annotation is color coded in the second panel. Pre-neurogenic (N)-retinal progenitor cell (RPC), early-RPC, and late-RPC clusters are labeled. (C) Feature plots showing the transcript distribution of glycolytic genes, including Pgk1, Eno1, Gpi1, Hk1, Pfkl, Slc16a3, Aldoa, and Ldhb, showing enriched Pgk1, Eno1, and Hk1 expression in earlier-staged RPCs. Pre-neurogenic (N)-, early-, and late-RPC clusters are labeled. (D) E18.5 retinal cross sections immunostained with PAX6, PTEN, and VSX2. (E) Schematic of the strategy used to generate Pten-cKO animals. (F) Immunostaining of P0 Pax6-Cre-GFP and Pten-cKO retinas, showing GFP expression in RPCs throughout the retina, with higher levels in the periphery in the ciliary marginal zone (CMZ). Created in BioRender.com. (G) Retinal cross sections of wild-type and Pten-cKO animals at P14 injected with BrdU at P4, showing immunostaining with PTEN (green) and BrdU (red) in wild-type and Pten-cKO retinas. (H) Quantification of the number of BrdU cells in the gcl, inl, and onl. Plots show means ± SEM. N = 3 biological replicates/genotype, all with 3 technical replicates. p-value calculated with unpaired t-test. onl, outer nuclear layer; inl, inner nuclear layer; gcl, ganglion cell layer; onbl, outer neuroblast layer; inl, inner nuclear layer; gcl, ganglion cell layer; le, lens; cmz, ciliary marginal zone. Scale bar 50 μM in C, 400 μM in E and 100 μM in F.
Figure 1—figure supplement 1
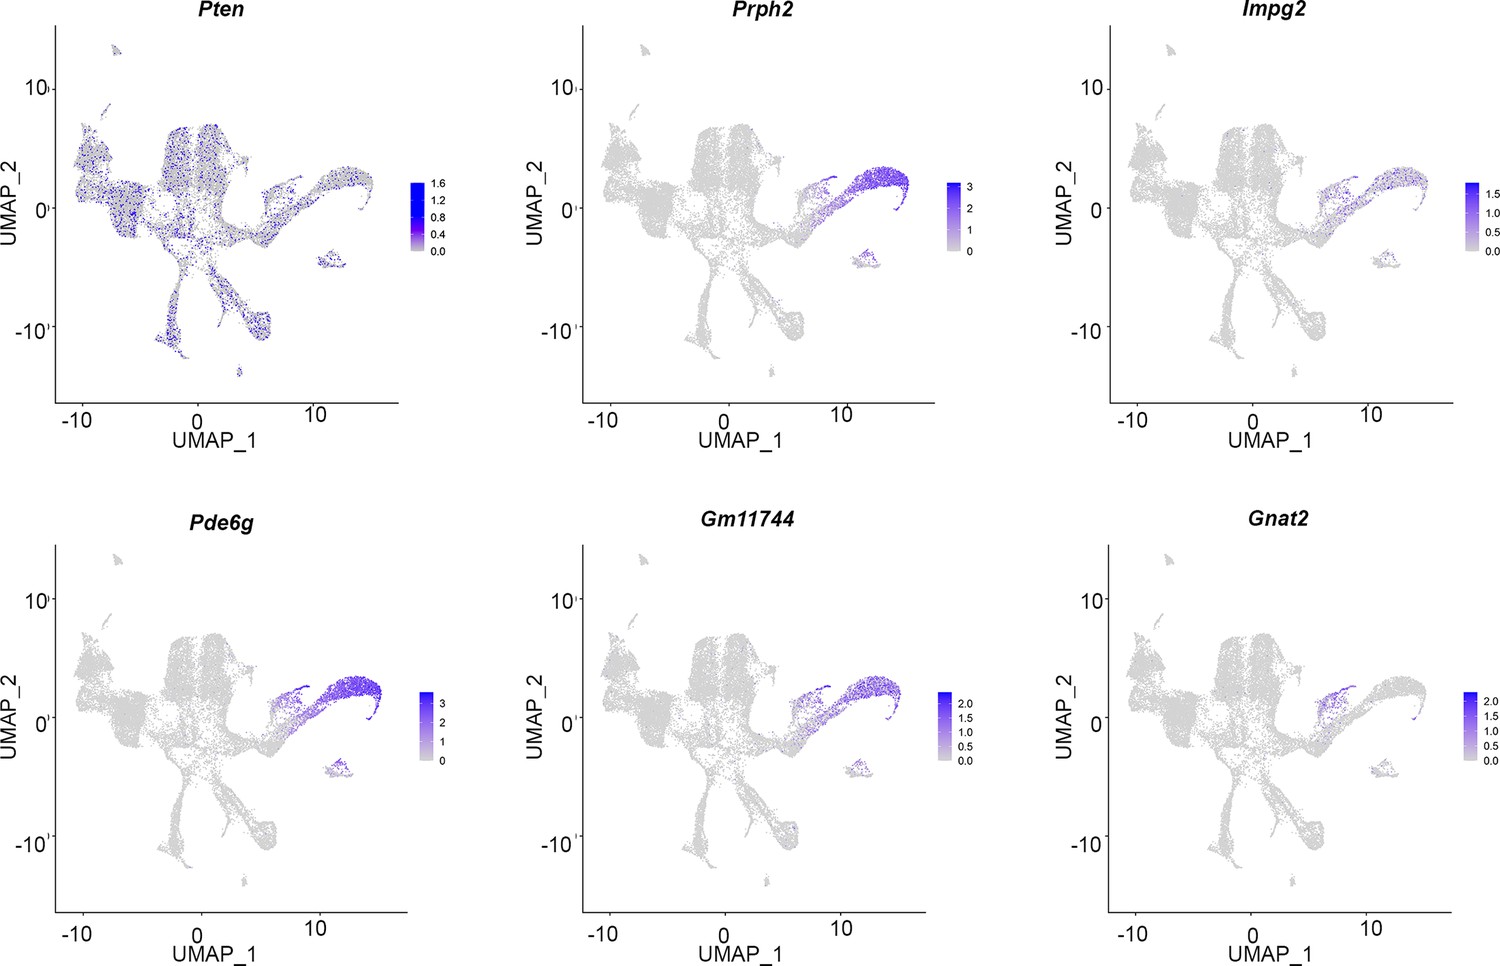
Expression of Pten and mature photoreceptor markers during murine retinal development.
Uniform manifold approximation and projection (UMAP) plot of scRNA-seq data collected from wild-type retinas between E11 and P14 (Clark et al., 2019). Transcript distribution of Pten and mature photoreceptor markers (Prph2, Impg2, Pde6g, Gm11744, and Gnat2) at different stages of retinal development.
Figure 2
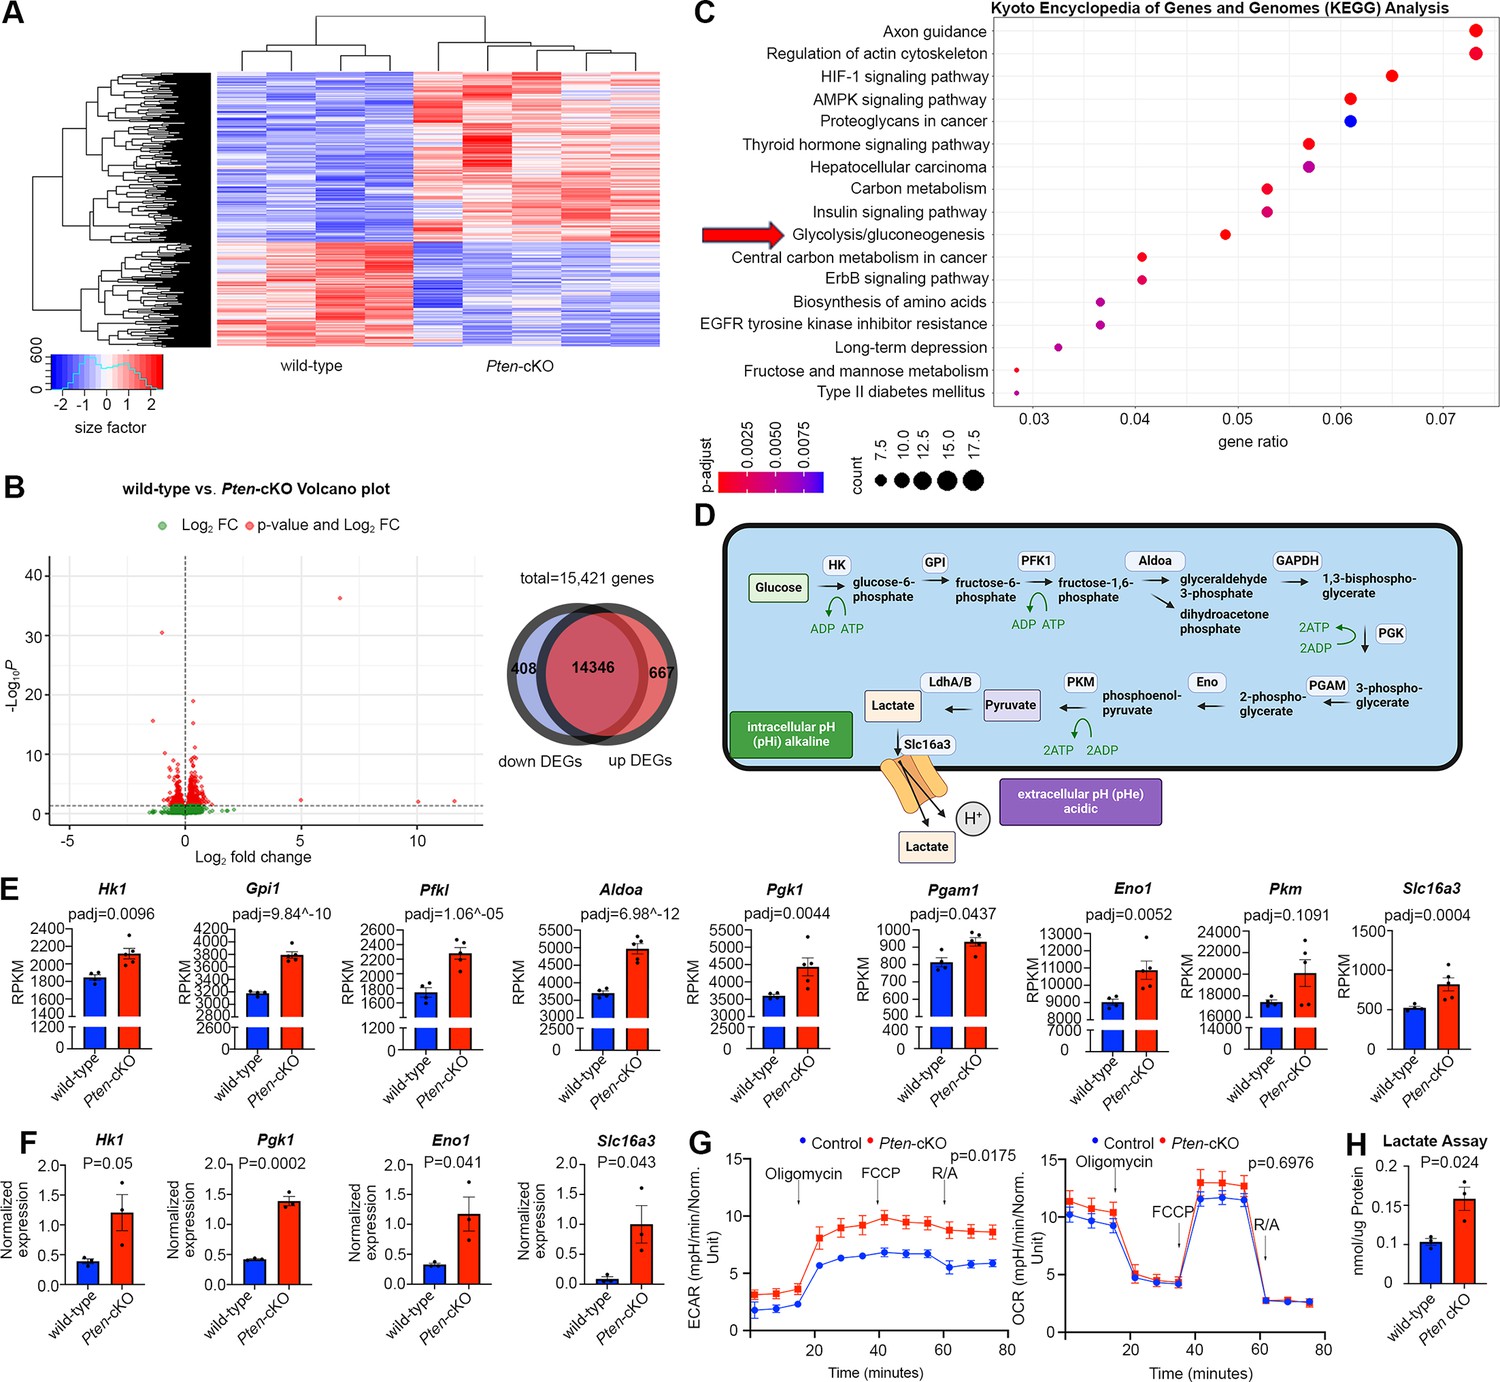
Glycolytic gene expression and activity are elevated in P0 Pten-cKO retinas.
(A) Heatmap of bulk RNA-seq data comparing gene expression in P0 Pten-cKO (N = 5) and wild-type (N = 4) retinas. (B) Volcano plot of differentially expressed genes (DEGs) with log2FC = 2, showing both downregulated (to the left) and upregulated (to the right) genes. A Venn diagram shows 667 upregulated genes and 408 downregulated genes in P0 Pten-cKO retinas. (C) Kyoto Encyclopedia of Genes and Genomes (KEGG) pathway enrichment related to DEGs, showing an enrichment of upregulated glycolytic pathway genes in P0 Pten-cKO retinas (arrow). (D) Schematic of glycolysis pathway, showing the intracellular enzymes involved in metabolizing glucose into lactate. Also shown is the Slc16a3 symporter, which extrudes lactate and H+ to increase intracellular pHi. Created in BioRender.com. (E) Normalized RPKM (reads per kilobase million) values for glycolytic gene expression in P0 wild-type and Pten-cKO retinas. Plots show means ± SEM. N = 4 biological replicates for wild-type and N = 5 for Pten-cKO retinas. p-values calculated with Wald test, with a Benjamini–Hochberg correction for multiple comparisons. (F) Normalized glycolytic gene expression from qPCR of P0 Pten-cKO (N = 3) and wild-type control (N = 3) retinas. Plots show means ± SEM. N = 3 biological replicates/genotype, all with 3 technical replicates. p-values calculated with unpaired t-test. (G) Seahorse assay on P0 wild-type and Pten-cKO retinal progenitor cells (RPCs) cultured in vitro. Points of treatment with oligomycin (O), FCCP (F), and Rotenone/Antimycin A (R/A) are indicated. Left plot shows elevated extracellular acidification rate (ECAR) in Pten-cKO RPCs, while plot to the right shows no significant effect on oxygen consumption rate (OCR). Plots show means ± SEM. N = 3 biological replicates for Pten-cKO and N = 8 biological replicates for wild-type, all with 3 technical replicates. p-values calculated with unpaired t-test (GraphPad Prism, USA). (H) Lactate assay on P0 wild-type and Pten-cKO retinas. Plots show means ± SEM. N = 3 biological replicates/genotype, all with 3 technical replicates. p-value calculated with unpaired t-test.
-
Figure 2—source data 1
Identification of differentially expressed genes in P0 Pten-cKO retinas.
Bulk RNA-seq data were performed on P0 wild-type (N = 4) and Pten-cKO (N = 5) retinas. The source data show the normalized RPKM (Reads Per Kilobase of transcript per Million reads) values, as a normalization method to quantify the abundance of transcripts, considering both the total number of reads and the length of the gene. Differentially expressed genes were identified using a DESeq1 1.28.1 package. Genes were considered to be differentially expressed if a comparison between wild-type and Pten-cKO retinas had an adjusted p-values (padj) less than 0.05 (Wald test, Benjamini–Hochberg correction for multiple comparisons).
- https://cdn.elifesciences.org/articles/100604/elife-100604-fig2-data1-v1.xls
Figure 3
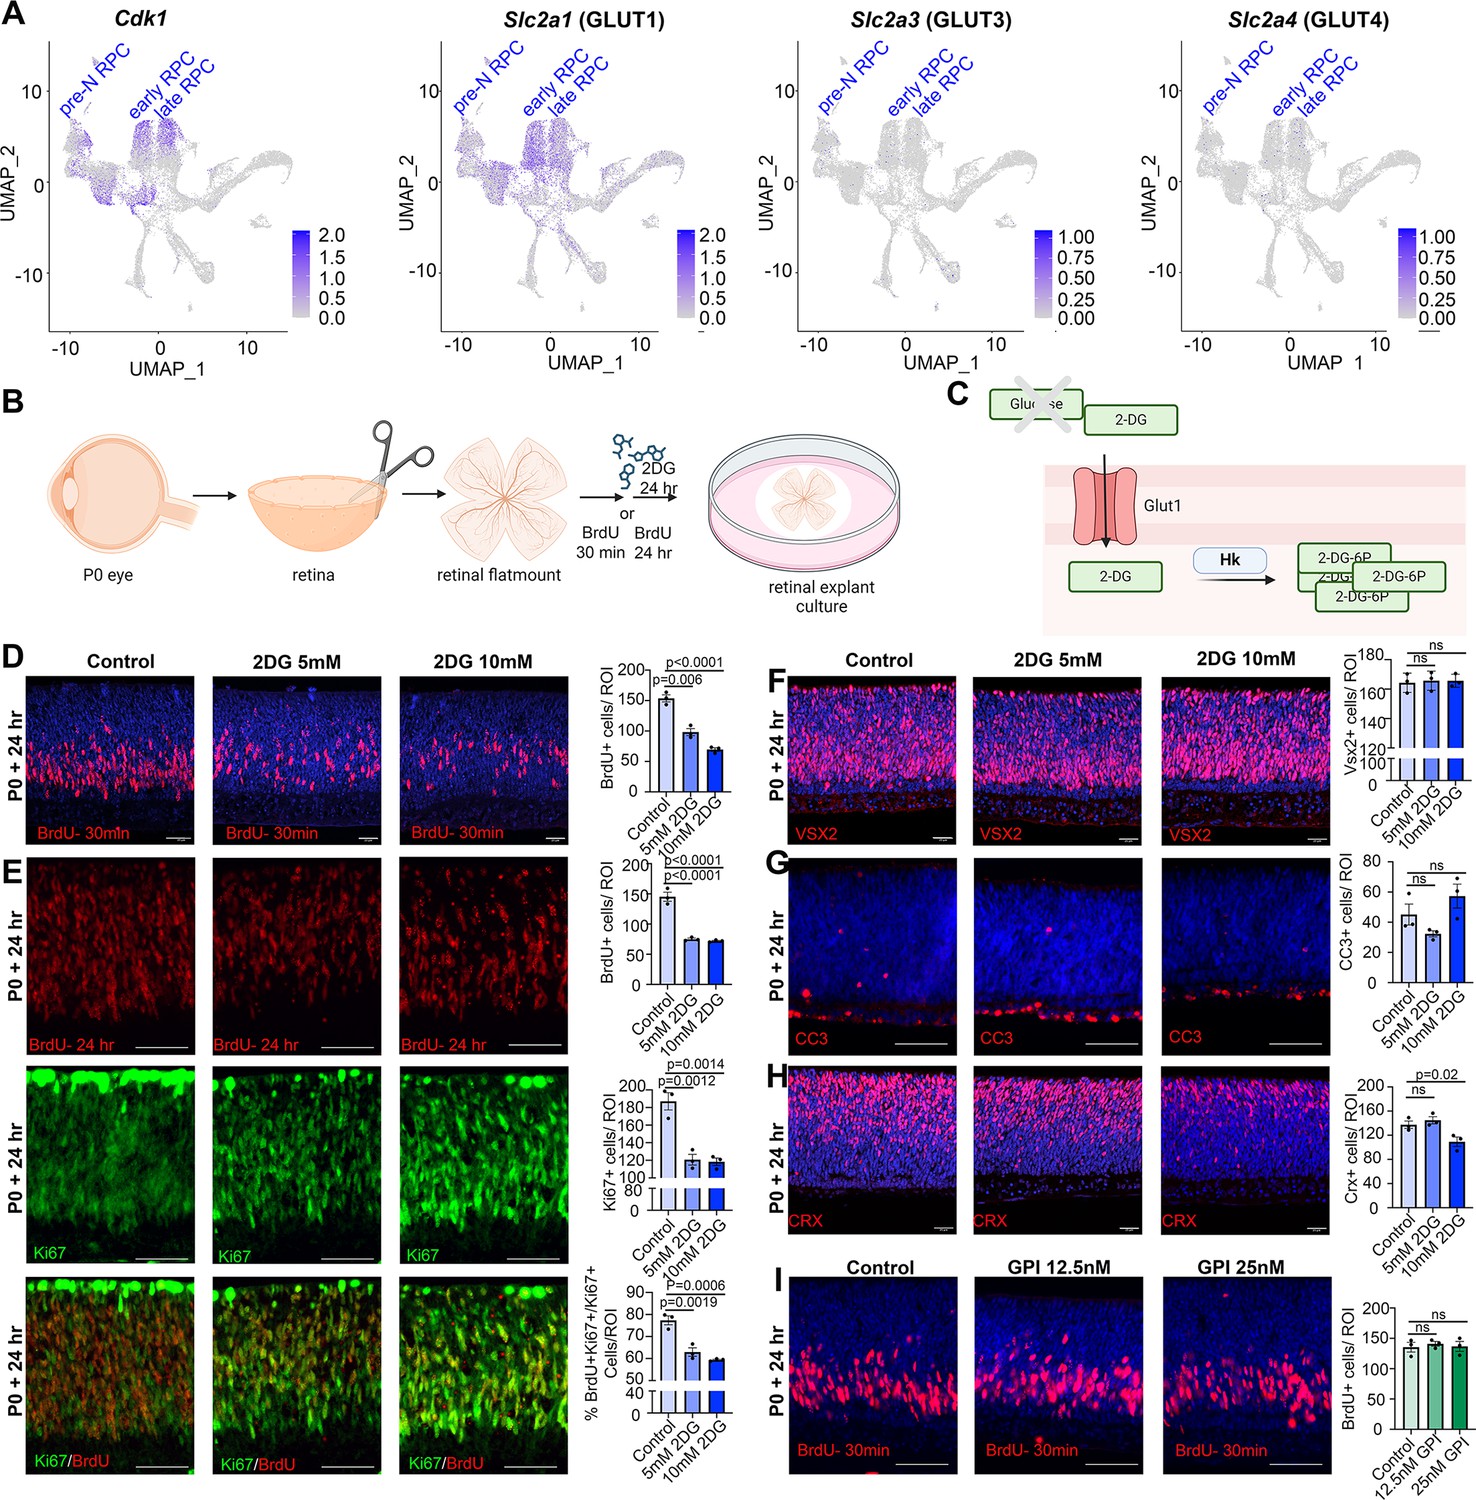
Glycolytic inhibition reduces proliferation and photoreceptor differentiation in P0 retinal explants.
(A) Feature plots showing the transcript distribution of Cdk1, a marker of proliferating retinal progenitor cells (RPCs), and the genes encoding the major glucose transporters, Slc2a1 (GLUT1), Slc2a3 (GLUT3), and Slc2a4 (GLUT4). (B) Schematic of retinal explant experiments, showing treatment with pharmacological inhibitors (2DG or GPI), and the labeling of proliferating RPCs (30 min BrdU) or birthdating of newborn retinal cells (24 hr BrdU). Created in BioRender.com. (C) Schematic of glucose uptake replaced by 2DG, which leads to the accumulation of 2-DG-6P that cannot be further metabolized by the glycolytic pathway. Created in BioRender.com. (D) P0 retinal explants treated with 5 or 10 mM 2DG for 1 day in vitro (DIV), showing BrdU immunolabeling and the number of BrdU+ cells after a 30 min labeling with BrdU. (E) P0 retinal explants treated with 5 or 10 mM 2DG for 1 DIV, showing BrdU immunolabeling and the number of BrdU+ cells after a 24 hr labeling with BrdU, including co-labeling with Ki67 to calculate the p-fraction (%BrdU+Ki67+ cells/total Ki67+ cells). (F–H) P0 retinal explants treated with 5 or 10 mM 2DG for 1 DIV and immunostained for VSX2 (E), CC3 (F), or CRX (G). (I) P0 retinal explants treated with glycogen phosphorylase inhibitor (GPI) at 12.5 and 25 μM for 24 hr and immunostained for BrdU after a 30-min incubation at the end of the treatment period. Plots in D–I show means ± SEM. N = 3 biological replicates/treatment, all with 3 technical replicates. p-values calculated with one-way ANOVA with Tukey post hoc test. Scale bars = 25 μM in D, F, H and 50 μM in E, G, I.
Figure 4
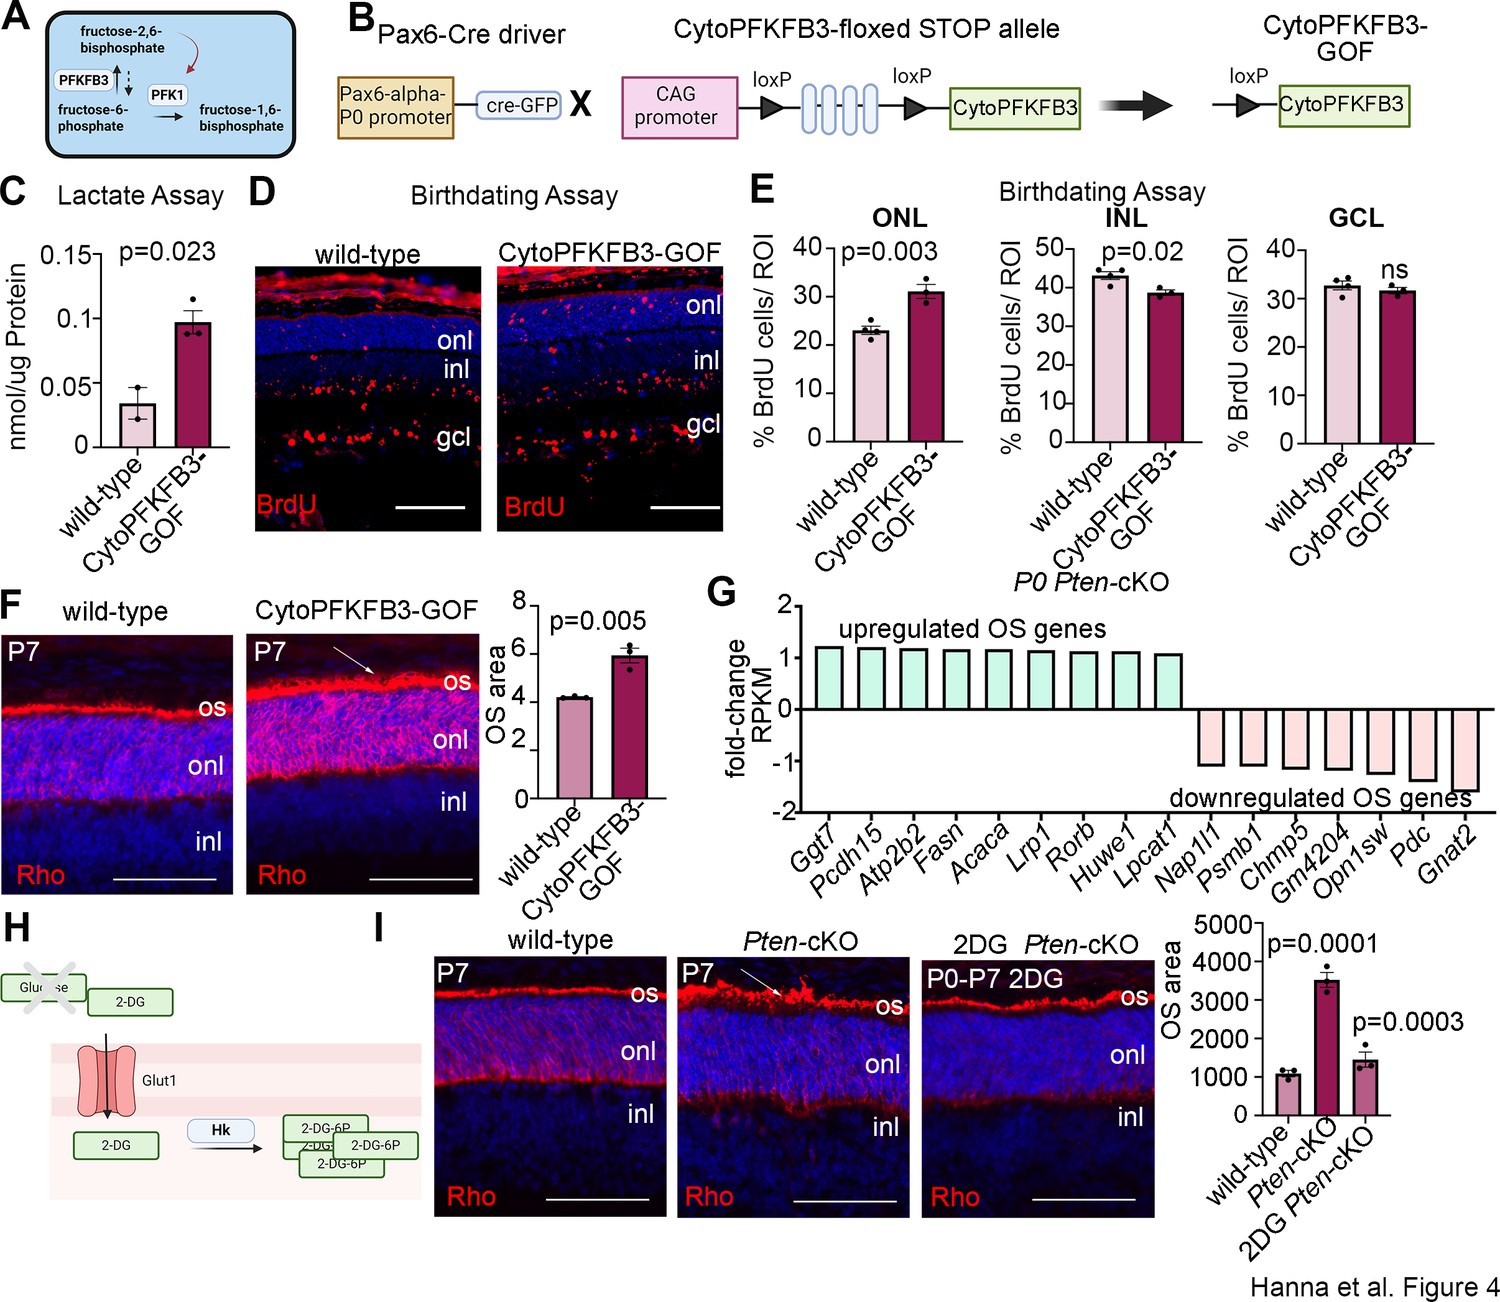
Promotion of glycolytic flux with a cytoPFKFB3-GOF mouse model accelerates photoreceptor differentiation and outer segment (OS) maturation.
(A) Schematic showing function of PFKFB3 as an activator of PFK1 through the conversion of fructose-6-phosphate to fructose-2,6-bisphosphate. Created in BioRender.com. (B) Schematic showing generation of a retinal progenitor cell (RPC)-specific cytoPFKFB3-GOF mouse model. Created in BioRender.com. (C) Lactate assay performed on P0 wild-type and cytoPFKFB3-GOF retinas. (D, E) Birthdating experiments performed by injecting BrdU into pregnant females at E12.5 and harvesting retinas at P7. BrdU immunostaining of P7 wild-type and cytoPFKFB3-GOF retinas (D) and quantification of the %BrdU+ cells in each of the nuclear layers (E). (F) Rhodopsin immunostaining of P7 wild-type and cytoPFKFB3-GOF retinas. An expansion of OS area is indicated by the arrow and quantified in the graph. (G) Bulk RNA-seq mining of photoreceptor OS genes de-regulated in P0 Pten-cKO retinas. (H) Schematic of mode of action of 2DG. Created in BioRender.com. (I) Rhodopsin immunostaining of P7 wild-type and Pten-cKO retinas, either without treatment or following the administration of 2DG between P0 and P7. The expanded OS area in Pten-cKO retinas is indicated with an arrow. Quantifications of photoreceptor OS areas are shown in the graph. Plots show means ± SEM. N = 3 biological replicates/treatment group except C, with cytoPFKFB3-GOF (N = 3) and wild-type (N = 2), all with 3 technical replicates. p-values calculated with t-tests in C and F, and one-way ANOVA with Tukey post hoc test in E and G. Scale bars 100 μM in E and 50 μM in F and G. gcl, ganglion cell layer; inl, inner nuclear layer; onl, outer nuclear layer; os, OSs.
Figure 5

Reducing intracellular pH (pHi) inhibits retinal progenitor cell (RPC) proliferation and differentiation.
(A) Schematic showing function of Slc16a1/3 symporters in extruding lactate and H+ out of the cell to increase pHi during elevated glycolysis. Also depicted is the impact of acidic pH and oligomerizing PKM to prevent its activity. Created in BioRender.com. (B) Schematic of retinal explant experiments, showing treatment with a pharmacological inhibitor (CNCn) of Slc16a symporters or growth in different pH media, and the labeling of proliferating RPCs (30 min BrdU) or birthdating of newborn retinal cells (24 hr BrdU). Created in BioRender.com. (C) P0 retinal explants treated with 5 mM CNCn for 1 day in vitro (DIV), followed by a 30 min BrdU pulse, showing immunolabeling and the quantification of BrdU+ RPCs. (D) P0 retinal explants incubated in media buffered to pH 6.5, pH 7.4, or pH 8.0 for 1 DIV, showing BrdU immunolabeling and the number of BrdU+ cells after a 30 min labeling with BrdU. (E) P0 retinal explants incubated in media buffered to pH 6.5, pH 7.4, or pH8.0 for 1 DIV, showing BrdU immunolabeling and the number of BrdU+ cells after a 24 hr labeling with BrdU, including co-labeling with Ki67 to calculate the p-fraction (%BrdU+Ki67+ cells/total Ki67+ cells). (F–H) P0 retinal explants incubated in media buffered to pH 6.5, pH 7.4, or pH 8.0 for 1 DIV and immunostained for VSX2 (E), CC3 (F), or CRX (G). (I) P3 retinal explant electroporated with pHluorin-tdTomato, imaged after 2 DIV to show electroporated cells (tdTomato+) have varying levels of 488 nm emission from pHLuorin (green). Plots show means ± SEM. N = 3 biological replicates/treatment group, all with 3 technical replicates. p-values calculated with t-tests in C, and one-way ANOVA with Tukey post hoc test in D–H. Scale bars = 25 μM in C, D, F, H, and 50 μM in E, G, I.
Figure 6 with 1 supplement
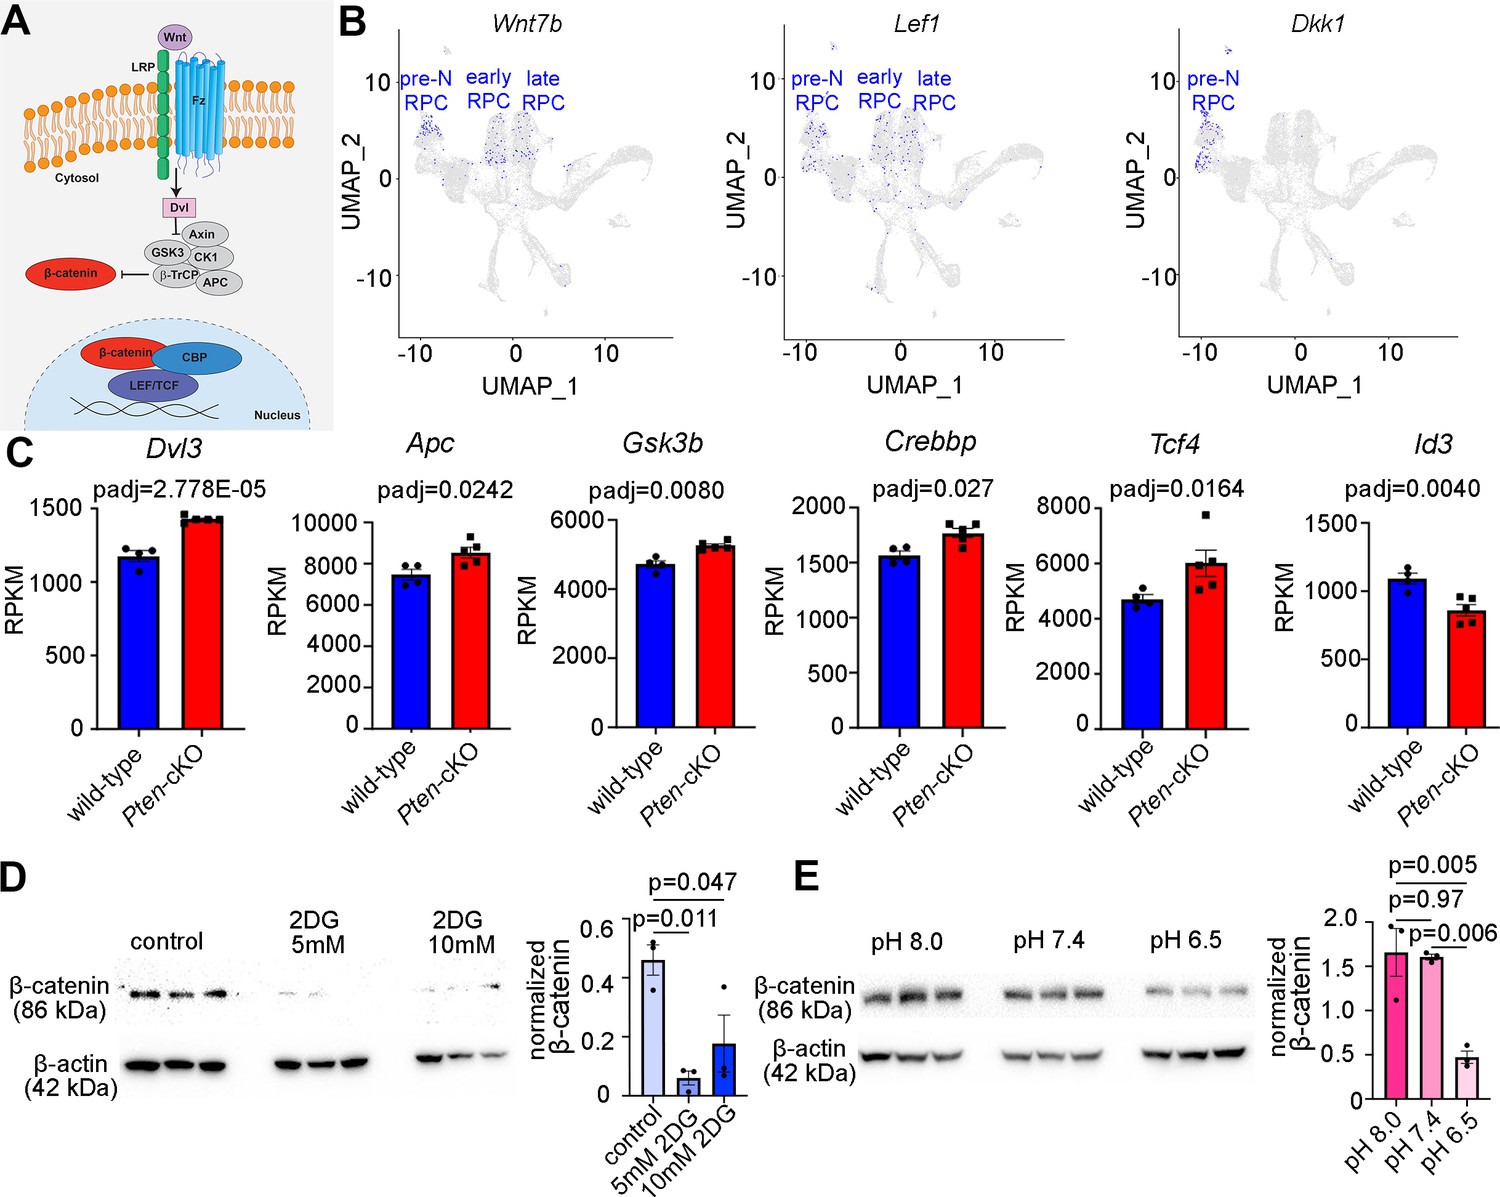
Wnt signaling is a downstream mediator of Pten and glycolysis.
(A) Schematic illustration of canonical Wnt signaling pathway. (B) Uniform manifold approximation and projection (UMAP) plot of scRNA-seq data collected from wild-type retinas between E11 and P14 (Clark et al., 2019). Transcript distribution of Wnt7b, Lef1, and Dkk1 Wnt genes. (C) Normalized RPKM (reads per kilobase million) values for Wnt pathway-associated genes in P0 wild-type (N = 4) and Pten-cKO (N = 5) retinas. (D) Western blot of β-catenin expression, normalized to β-actin levels, in P0 retinal explants treated with 5 and 10 mM 2DG or in P0 retinal explants cultured in media buffered to pH 8.0, pH 7.4, or pH 6.5 (E), all for 24 hr. Plots show means ± SEM. N = 3 biological replicates/treatment group, all with 3 technical replicates. p-values calculated with t-tests in C, and one-way ANOVA with Tukey post hoc test in D, E.
-
Figure 6—source data 1
PDF composite file containing western blots for Figure 6D, E, indicating the treatments and the molecular weights of the relevant proteins.
- https://cdn.elifesciences.org/articles/100604/elife-100604-fig6-data1-v1.zip
-
Figure 6—source data 2
Original tiff files for the western blots in Figure 6D, E.
- https://cdn.elifesciences.org/articles/100604/elife-100604-fig6-data2-v1.zip
Figure 6—figure supplement 1
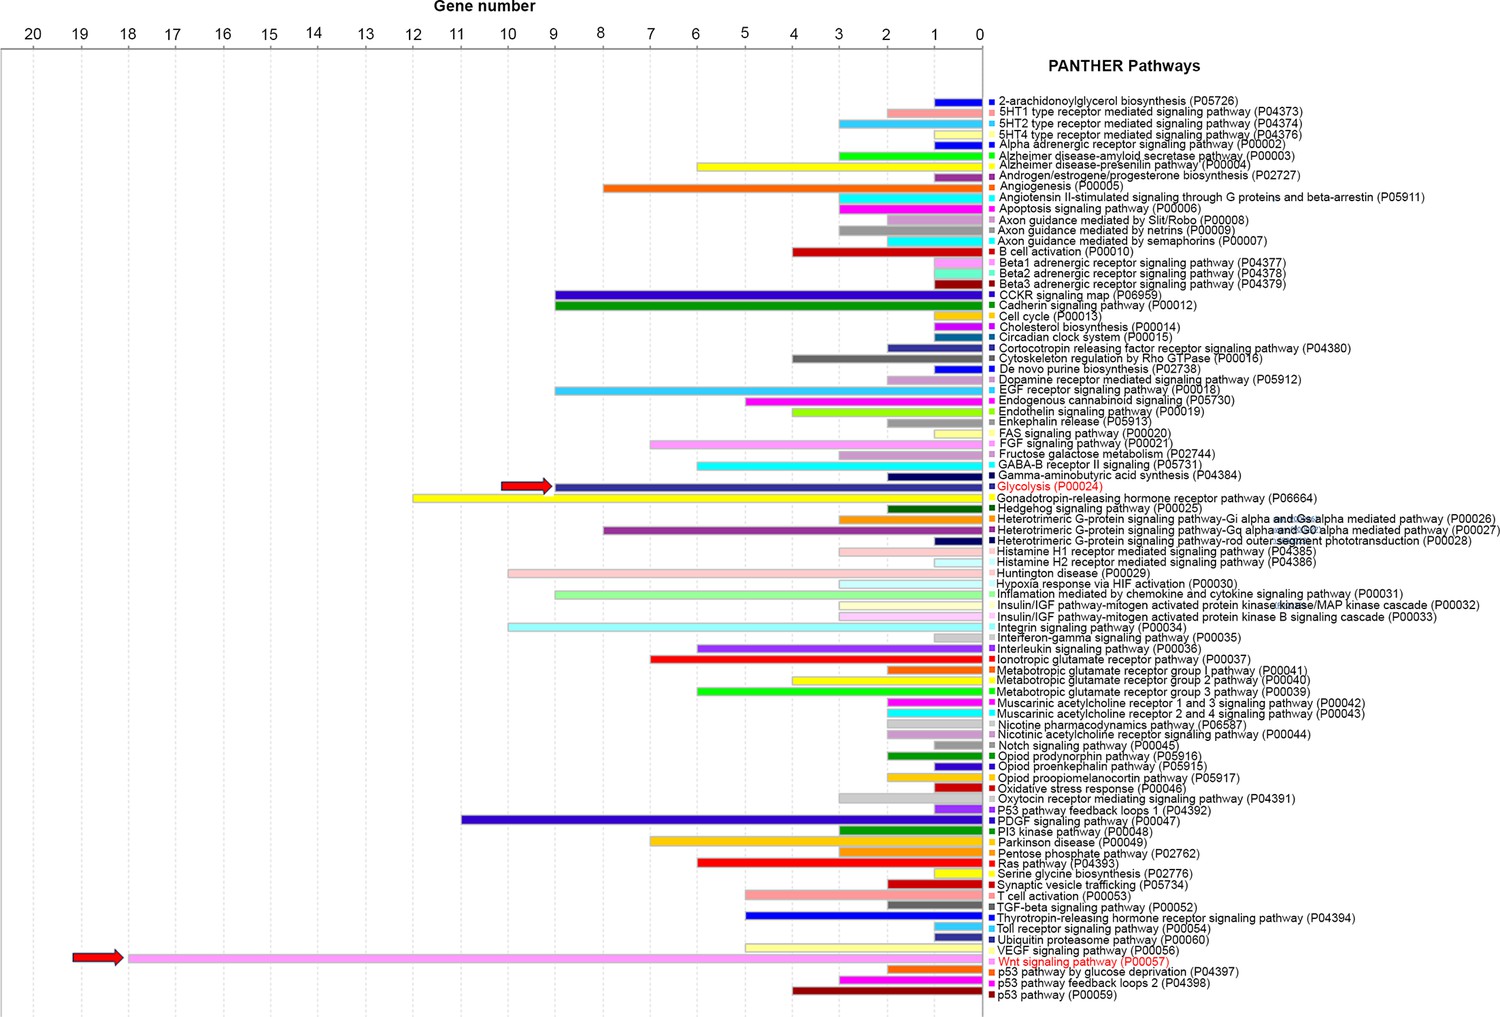
Upregulation of Wnt-associated genes in Pten-cKO retinas.
PANTHER (protein analysis through evolutionary relationships) classification analysis of differentially expressed genes (DEGs) of P0 bulk RNA-seq showing upregulation of Wnt signaling and glycolysis (arrows).
Figure 7
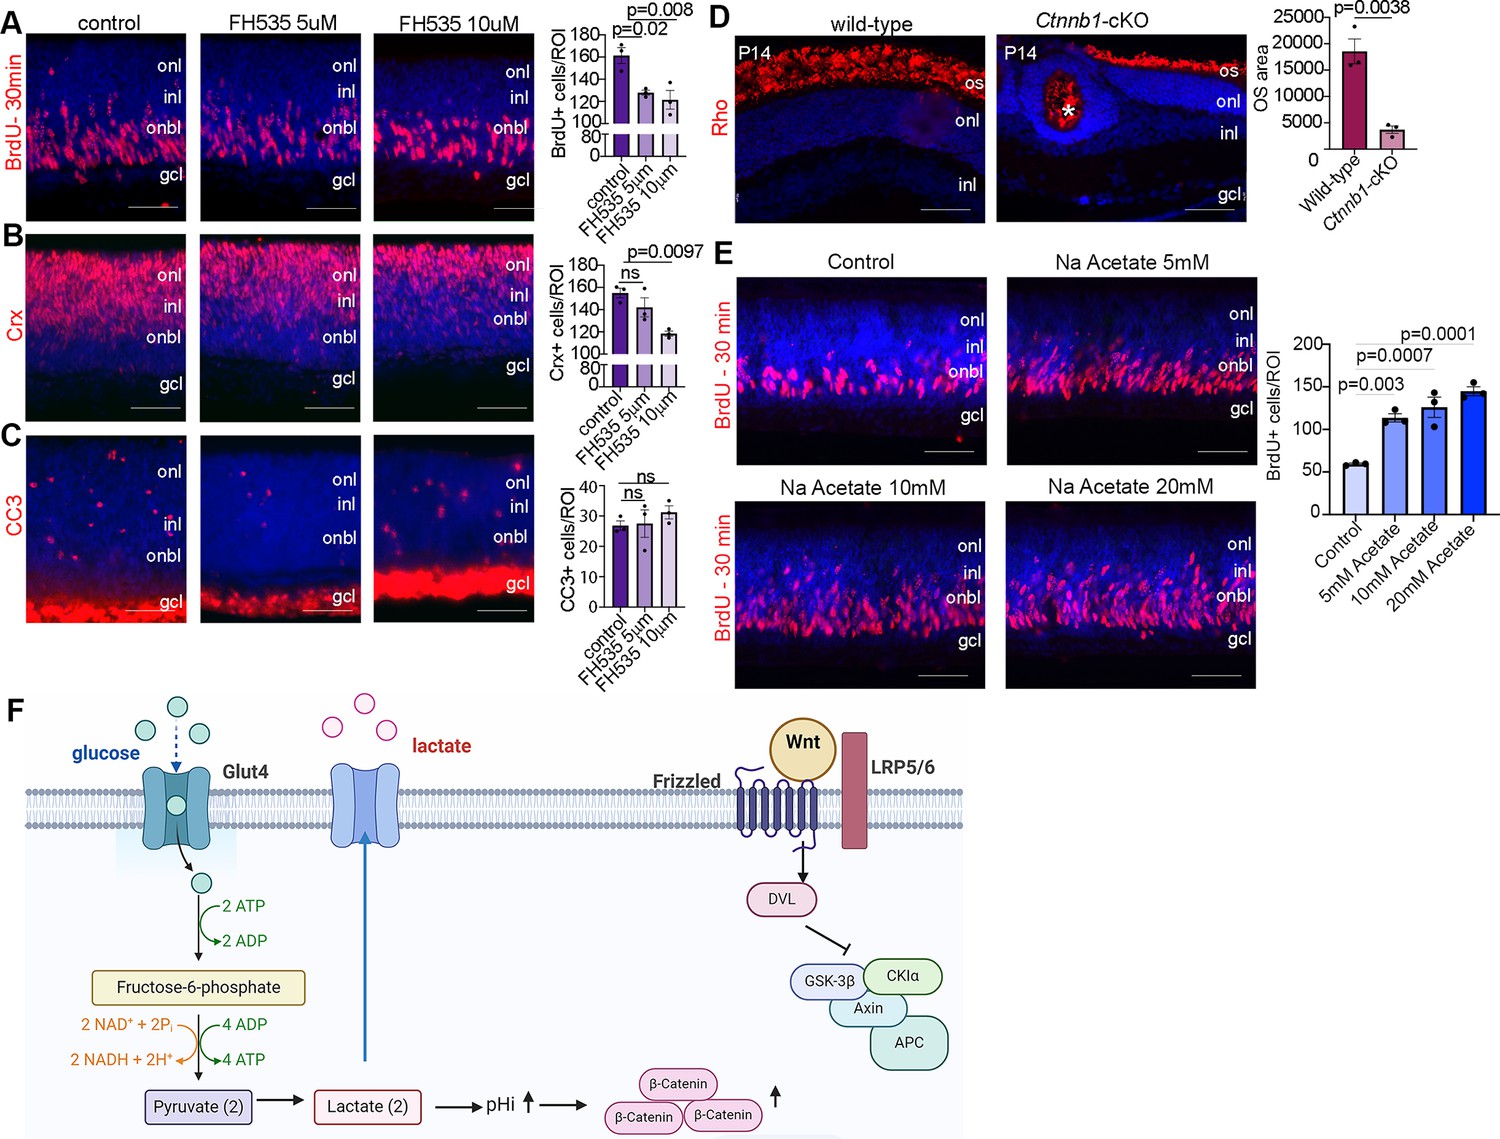
Wnt signaling modulates retinal proliferation and differentiation.
(A–C) P0 retinal explants treated with 5 or 10 μM FH535 to block Wnt signaling for 1 day in vitro (DIV), followed by immunostaining for BrdU after a 30-min pulse (A), CRX (B), or CC3 (C). (D) Immunostaining P14 wild-type and Ctnnb1-cKO retinas with rhodopsin. Asterisk points to ONL rosette in Ctnnb1-cKO retina. Graph showing quantification of OS area. (E) Retinal cross sections of P0 wild-type explants treated with 5, 10, and 20 mM sodium acetate for 1 DIV, along with vehicle controls, and pulsed with BrdU 30 min before harvesting. The number of BrdU+ retinal progenitor cells (RPCs) increased in sodium acetate treated explants. (F) Summary schematic of the impact of glucose-driven glycolysis on intracellular pH and canonical Wnt signaling. Created in BioRender.com. All experiments included three biological replicates for each group. Statistical analysis was done using one-way ANOVA with Tukey post hoc test used in A–C and unpaired t-test in D. Scale bars = 50 μM in A–D. gcl, ganglion cell layer; inl, inner nuclear layer; onl, outer nuclear layer; os, outer segments.
Additional files
Download links
A two-part list of links to download the article, or parts of the article, in various formats.
Downloads (link to download the article as PDF)
Open citations (links to open the citations from this article in various online reference manager services)
Cite this article (links to download the citations from this article in formats compatible with various reference manager tools)
Glycolytic flux controls retinal progenitor cell differentiation via regulating Wnt signaling
eLife 13:RP100604.
https://doi.org/10.7554/eLife.100604.3


