Protein absorption in the zebrafish gut is regulated by interactions between lysosome rich enterocytes and the microbiome
- Department of Cell Biology, Duke University, Durham, United States
- Neuroscience Center, University of North Carolina, United States
- Carolina Institute of Developmental Disabilities, United States
- Department of Biology, University of Alabama at Birmingham, United States
- Department of Molecular Genetics and Genomics, Duke University, United States
Figures
Figure 1 with 1 supplement
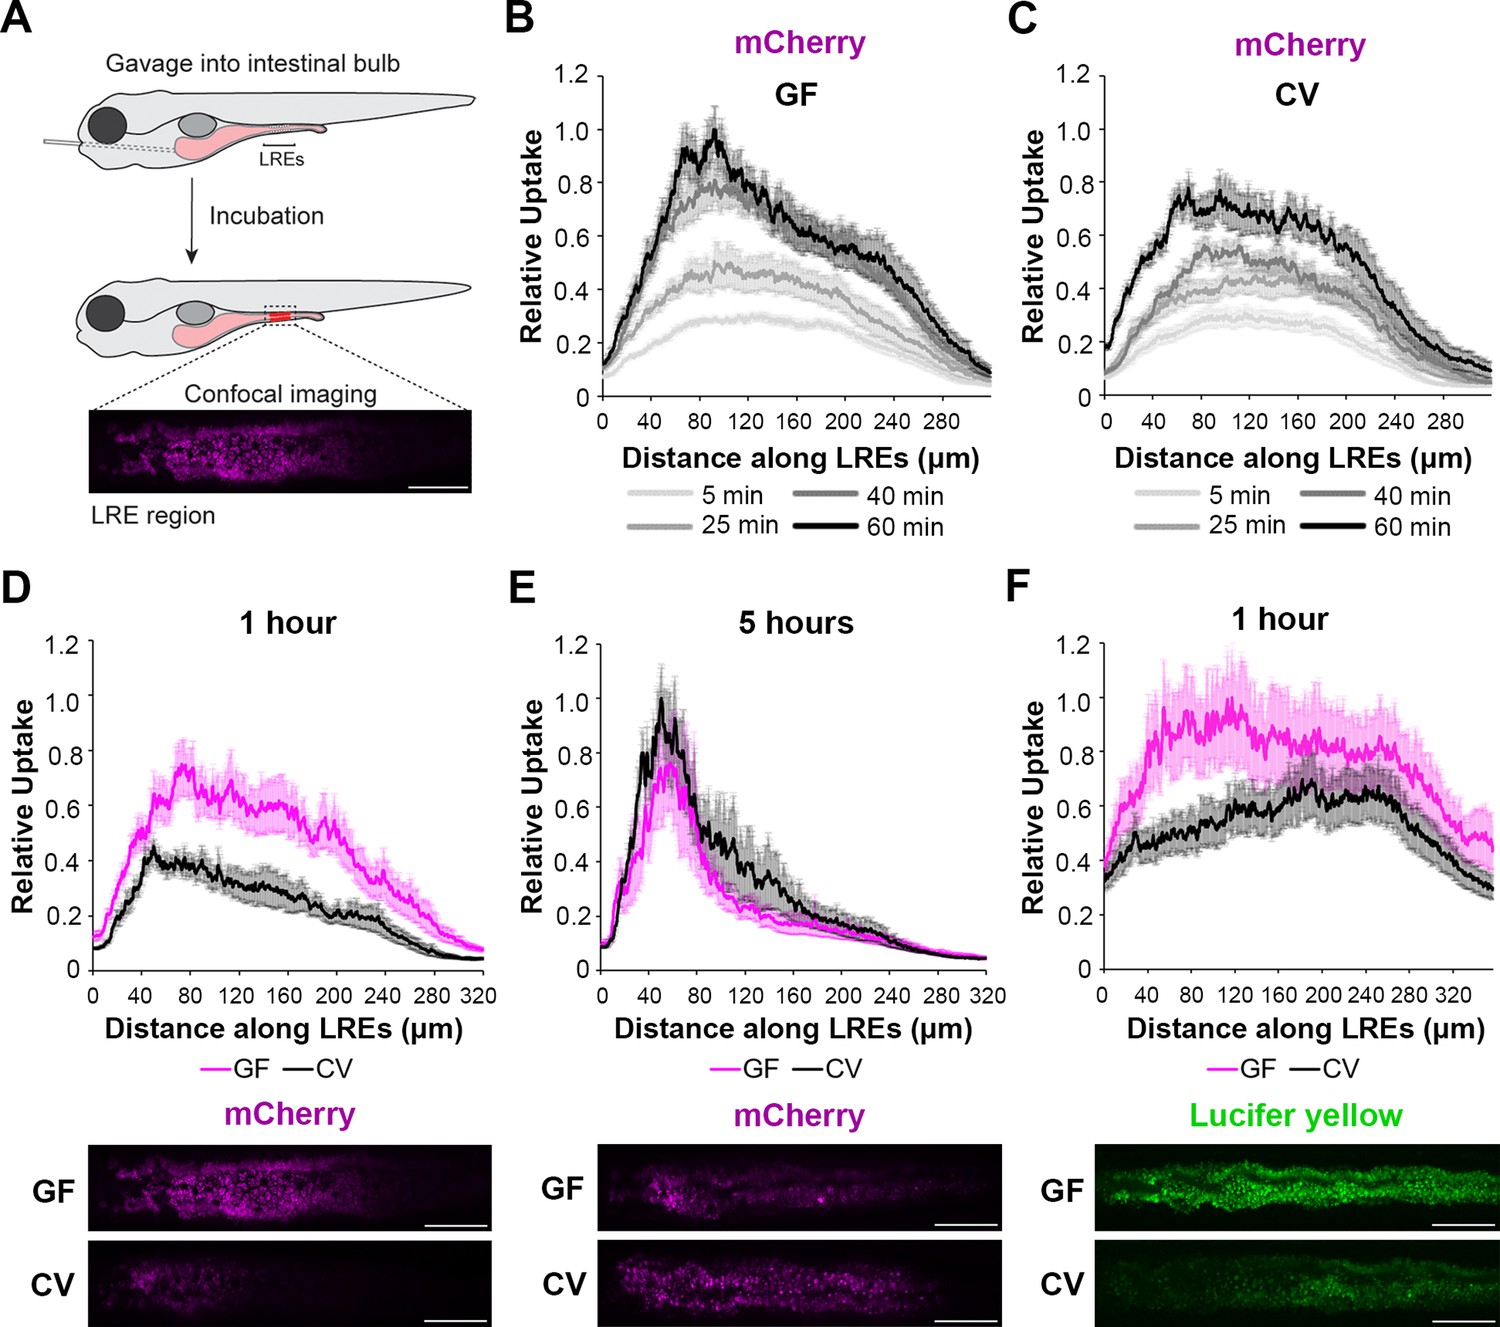
Microbes slow the rate of soluble cargo uptake in lysosome-rich enterocytes (LREs).
(A) Cartoon depicting experimental design of the gavage assay in GF and CV larvae. Following derivation under conventional (CV) or germ-free (GF) conditions, 6 dpf larvae were gavaged, and uptake of luminal cargoes by LREs was measured by confocal microscopy in the LRE region (approximately 300 μm in length). (B, C) Plots of normalized mCherry fluorescence intensity along the LRE region over time in 6 dpf GF (B) and CV (C) larvae. Minutes after gavage, LREs rapidly took up and quickly accumulate mCherry in GF larvae. The anterior LREs approached full saturation by 40 min post gavage. Cargo uptake was slower in CV larvae, and anterior LREs did not reach saturation by 40 min post gavage. (D, E) Top: Plots of normalized mCherry fluorescence intensity along the LRE region of GF and CV larvae at 1 (D) and 5 (E) hr PG. GF larvae internalized significantly more mCherry than CV larvae (2-way ANOVA, p<0.0001, n=8–10) 1 hr PG, and CV larvae reached a similar level of mCherry accumulation to GF larvae by 5 hr PG (two-way ANOVA, p=0.137, n=8–11). Bottom: Representative confocal images showing mCherry signal in the LRE region (scale bars = 50 µm). (F) Top: Plot of normalized lucifer yellow fluorescence intensity along the LRE region of GF and CV larvae at 1 hr post gavage. LREs in GF larvae internalized significantly more Lucifer yellow than CV larvae by 1 hr post gavage (two-way ANOVA, p<0.0001, n=8).
Figure 1—figure supplement 1
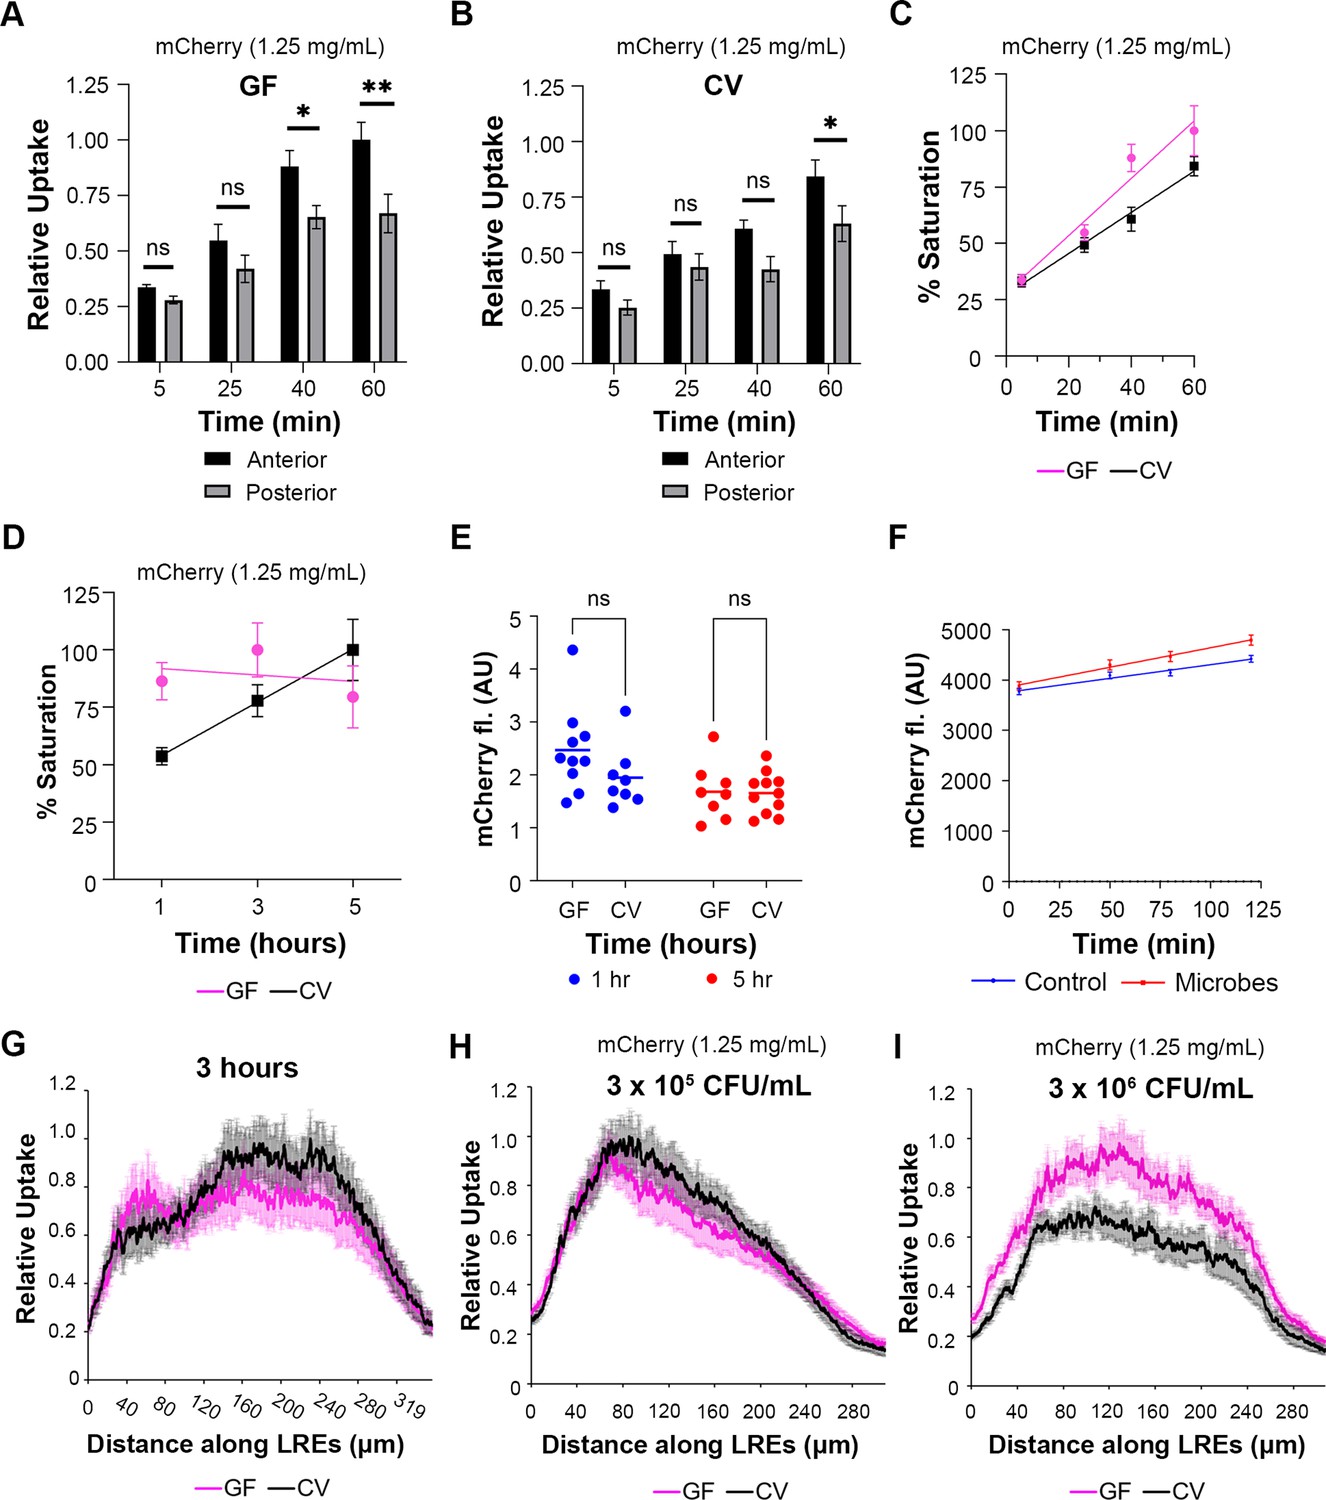
Regional differences and impacts of microbial density on cargo uptake by lysosome-rich enterocytes (LREs).
(A, B) Plots comparing normalized cargo uptake by anterior (50–150 μm) and posterior (150–250 μm) LRE regions in 6 dpf germ-free (GF) (A) and conventional (CV) (B) larvae. The anterior LREs took up significantly more mCherry than posterior LREs at 40 min (two-way ANOVA, padj = 0.047, n=9–11) and 60 min PG in GF larvae (two-way ANOVA, padj = 0.0013, n=11). The anterior LREs took up significantly more mCherry than posterior LREs by 60 min post gavage in CV larvae (two-way ANOVA, padj = 0.043, n=9–10). (C) Plot showing % of maximal uptake (saturation) over time from 5 to 60 min post gavage. The anterior LREs of GF larvae (50–150 µm) took up mCherry at a significantly faster rate than CV larvae from 5 to 60 min post gavage (Simple linear regression, p<0.0001, n=9–11). (D) Plot showing % of maximal uptake (saturation) over time. Between 1–5 hr post gavage, mCherry saturation remained constant in the anterior LREs (0–100 μm) GF larvae (Simple linear regression, p=0.74, n=8–10) but increased in CV larvae (Simple linear regression, p=0.026, n=8–11). The rate of mCherry accumulation was significantly different between GF and CV larvae (Simple linear regression, p=0.0187, n=8–11). (E) Plot showing luminal mCherry fluorescence at 1 and 5 hr post gavage in GF and CV larvae. There was no difference in luminal fluorescence between conditions (two-way ANOVA, padj = 0.17, n=8–11). (F) Plot showing mCherry fluorescence (AU) over time in media containing zebrafish larva microbes or vehicle control. The change in mCherry fluorescence over time was not significantly different between zebrafish microbe and control media (Simple linear regression, p=0.103, n=8–10), showing the zebrafish microbiome did not degrade mCherry. (G) Plot showing Lucifer Yellow (LY) uptake in GF and CV larvae at 3 hr post gavage. There was no difference in LY fluorescence between GF and CV larvae (two-way ANOVA, p=0.98, n=9–11). (H, I) Plots of normalized mCherry fluorescence intensity along the LRE region over time in 6 dpf GF and CV larvae. The LREs in GF and CV larvae took up the same amount of mCherry by 1 hr post gavage when the microbial density was 3×10⁵ CFU/mL (two-way ANOVA, p=0.18, n=10) (H). GF larvae took up significantly more mCherry than CV larvae when the microbial density was 3×10⁶ CFU/mL (two-way ANOVA, p<0.0001, n=10) (I).
Figure 2 with 1 supplement
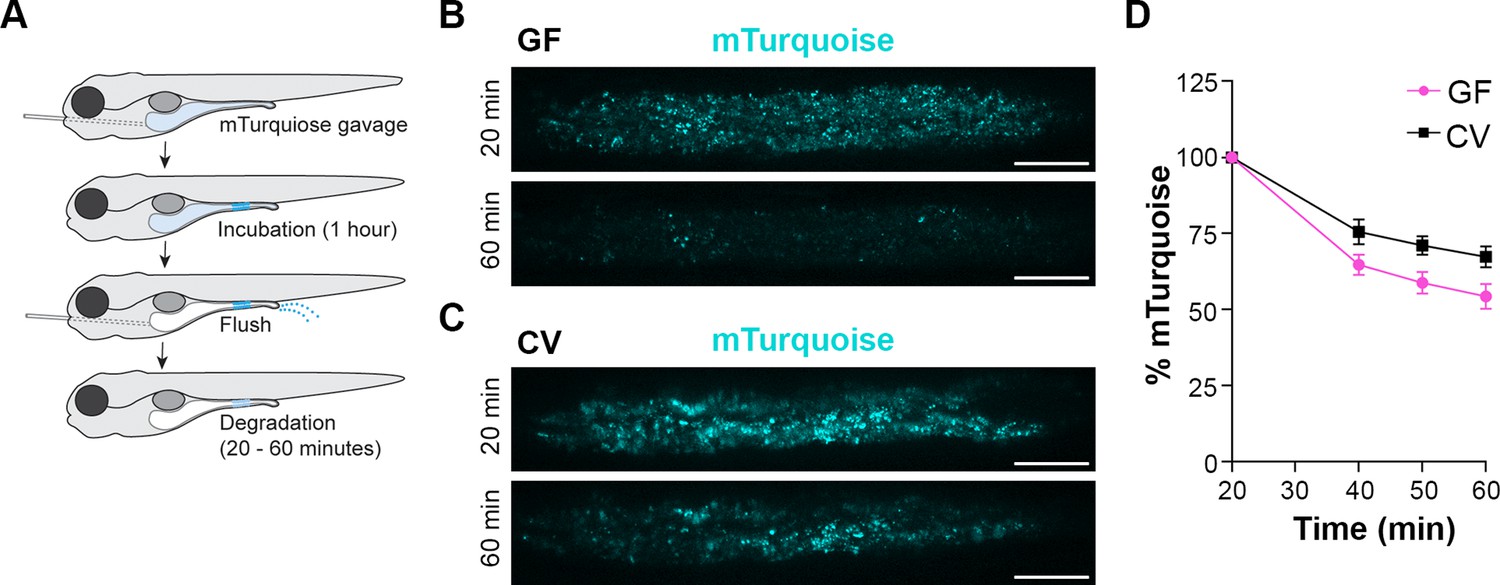
Lysosome-rich enterocyte (LRE) protein degradation activity is reduced by microbes.
(A) Cartoon depicting the experimental design of pulse-chase protein uptake and degradation assay. At 6 dpf, germ-free (GF) and conventional (CV) larvae were gavaged with mTurquoise (25 mg/mL), incubated for 1 hr, and then flushed with PBS to remove luminal mTurquoise. LRE degradation of mTurquoise was measured by confocal microscopy over time. (B, C) Confocal images of mTurquoise fluorescence in the LRE region after flushing in GF (B) and CV (C) larvae (scale bars = 50 µm). (D) Plot showing the degradation of mTurquoise fluorescence (%) in the LRE region over time. Degradation occurred at a significantly faster rate in GF than CV larvae from 20 to 60 min post gavage (Simple linear regression, p=0.0167, n=6).
Figure 2—figure supplement 1

mTurquoise degradation kinetics in lysosome-rich enterocytes (LREs).
Plot showing mTurquoise degradation kinetics in LREs from 6 dpf, conventional (CV) larvae over time. Over 75% was degraded within 2 hr.
Figure 3 with 1 supplement
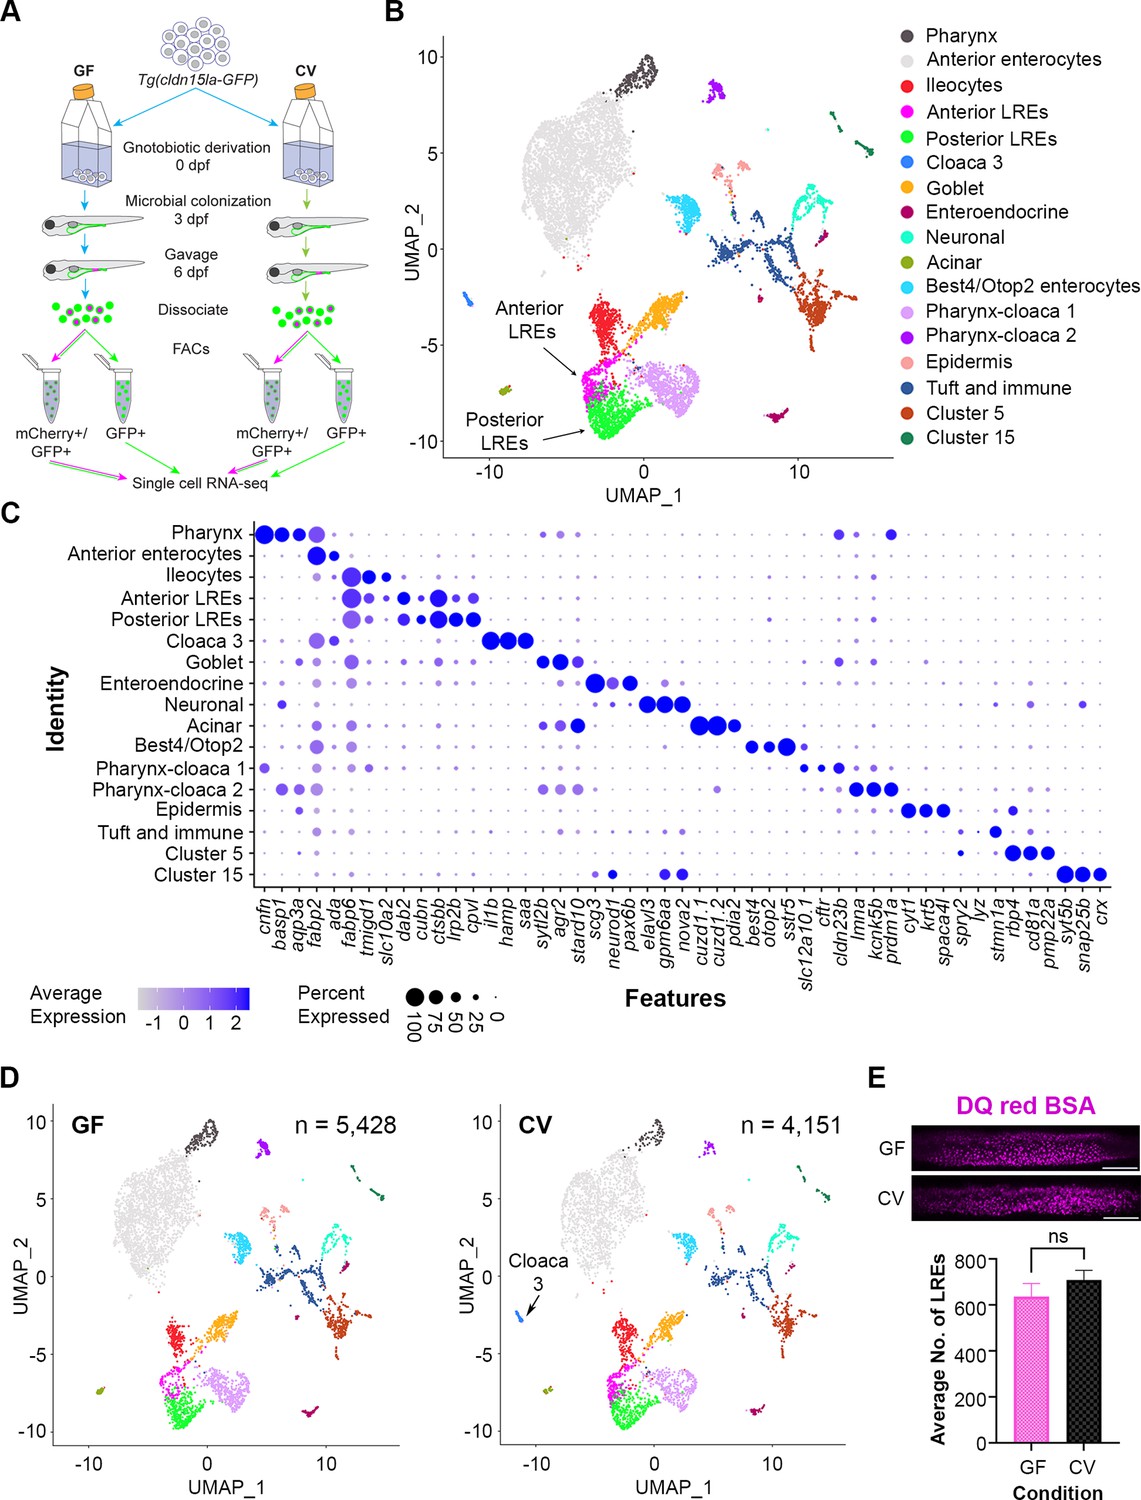
Single-cell clustering reveals anterior and posterior lysosome-rich enterocytes (LREs), microbially-responsive cloaca cells.
(A) Cartoon depicting experimental design for transcriptomic profiling of intestinal cells in germ-free (GF) and conventional (CV) larvae. GF and CV larvae expressing Tg(cldn15la-GFP) to label all intestinal epithelial cells (IECs) were raised to 6 dpf in gnotobiotic conditions and then gavaged with mCherry (1.25 mg/mL). Cells from dissociated larvae were fluorescent-activated cell sorting (FACs) sorted to isolate GFP-positive/mCherry-positive from GFP-positive/mCherry-negative populations prior to single cell sequencing. (B) UMAP projection of cells color-coded by cluster identity. (C) Dot plot of top cluster markers in each cluster. Average expression of the marker gene in each cell cluster is signified by the color gradient. Dot size indicates the percentage of cells in each cluster expressing the marker. (D) UMAP projection of cells color-coded by cluster identity in the GF (left) and CV (right) datasets. The Cloaca 3 cluster only appeared in the CV dataset. (E) Bar plot showing that the average number of LREs in the GF and CV larvae was not significantly different (two-tailed t-test, p=0.33, n=10). LREs were labeled by gavaging with DQ red BSA (50 µg/mL) in a separate experiment, then quantified. Images show DQ red BSA marking LRE lysosomal vacuoles (scale bar = 50 µm).
Figure 3—figure supplement 1
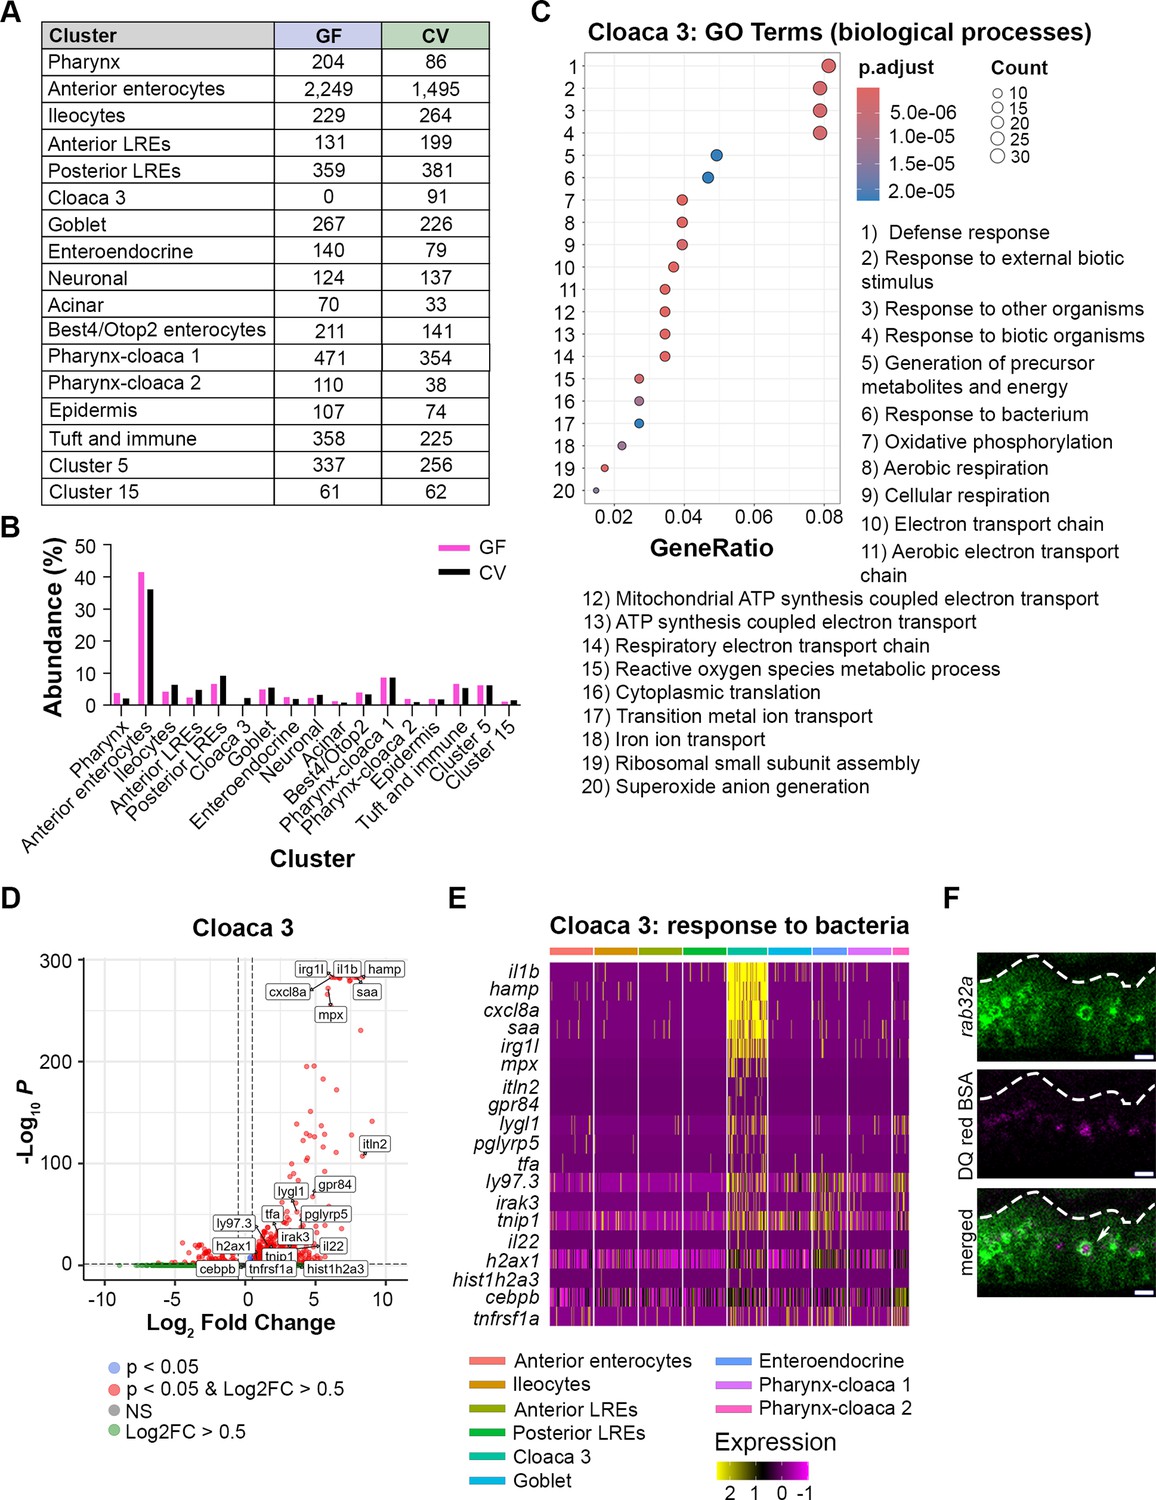
Cell counts and features of conventional (CV)-specific Cloaca 3 cells.
(A) Table showing the number of germ-free (GF) and CV cells per cluster in the single-cell RNA sequencing (scRNA-seq) dataset. (B) Bar plot showing the % abundance of cells that fell within each cluster in the GF and CV datasets. Both conditions showed comparable proportions of cells per cluster except for Cloaca 3, which only appeared in the CV dataset. (C) Dot plot displays the GO terms that were upregulated in Cloaca 3 cells. The dot color indicates the adjusted p-value for each GO term, while the dot size signifies the number of genes expressed in Cloaca 3 cells that fall into each GO term category. GeneRatio describes the proportion of genes associated with each GO term. (D) Volcano plot illustrates markers upregulated in the Cloaca 3 cluster. Red points with log2FC >0.5 are genes significantly upregulated in Cloaca 3 cells compared to other intestinal epithelial cells (IECs). Labeled genes were categorized in the GO term ‘response to bacterium.’ (E) Heatmap displays genes that were included in the ‘response to bacterium’ GO term, which was upregulated in Cloaca 3. Cluster identity is indicated by the colored bars at the top of the heatmap. Expression level is shown by a color gradient, with yellow indicating the highest expression level. (F) Live confocal microscopy images of lysosome-rich enterocytes (LREs) in 6 dpf larva expressing GFP-rab32a following gavage with DQ red BSA. DQ red BSA fluorescence was localized to the lysosome (arrow). Scale bars = 5 μm.
Figure 4 with 1 supplement
Uptake of mCherry occurs in cells enriched in lysosome-rich enterocyte (LRE) markers.
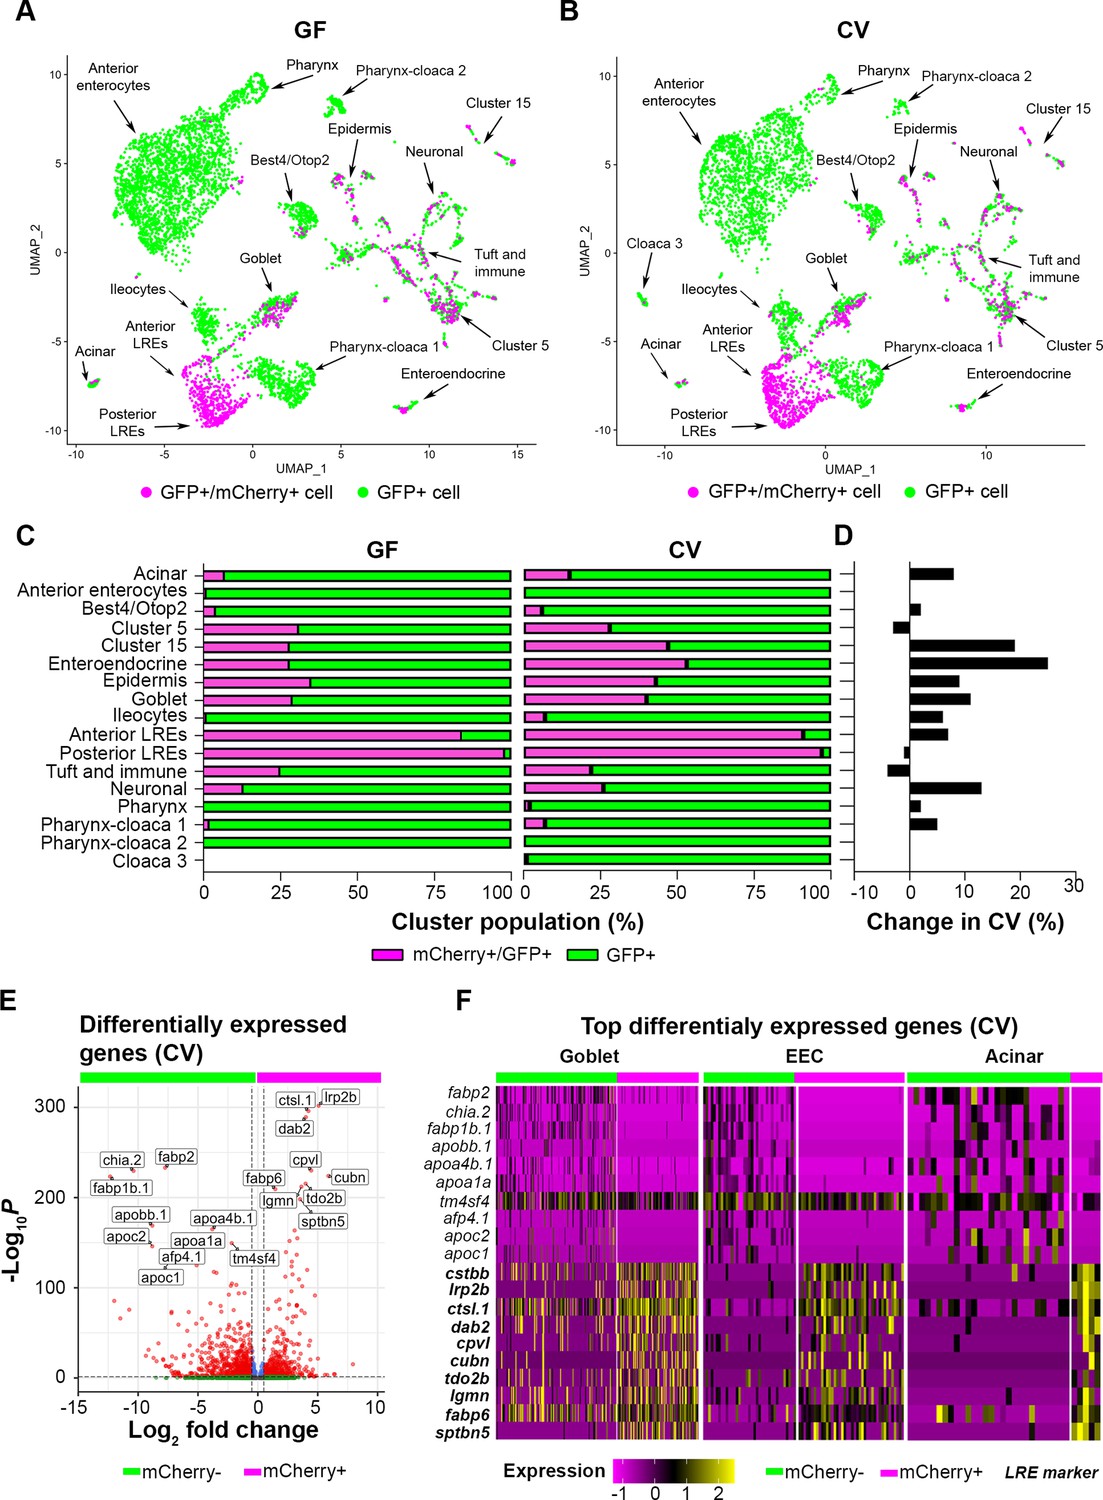
(A, B) UMAP projections highlighting mCherry-positive/GFP-positive cells (magenta) and GFP-positive cells (green) in the germ-free (GF) and conventional (CV) datasets. (C) Bar plots portray the percentage of mCherry-positive and mCherry-negative cells in the GF and CV datasets. Bar color indicates the proportion of mCherry-positive (magenta) and mCherry-negative (green) cells in each cluster. (D) Bar plot displays the difference in the proportion of mCherry-positive cells in the CV compared to the GF dataset. Positive values show that the proportion of mCherry-positive cells were higher in the CV dataset. (E) Volcano plot shows differentially expressed genes between mCherry-positive and mCherry-negative cells in the CV dataset. The x-axis displays the log fold change in expression between mCherry-positive and mCherry-negative cells, with positive values showing enhanced expression in mCherry-positive cells and negative values showing higher expression in mCherry-negative cells. Red points are genes with significantly different expression (padj <0.05) and high fold change (log2FC < - 0.05, log2FC >0.05). (F) Heatmap displays the expression of the top markers for mCherry-positive and mCherry-negative cells in goblet, EEC, and acinar clusters. The color bar at the top indicates mCherry-positive (magenta) and mCherry-negative (green) cell types. Expression level is highlighted with a color gradient. mCherry-positive cells showed higher expression of dab2 and other LRE-enriched endocytic markers (bolded), whereas mCherry-negative cells express typical anterior enterocyte markers such as fabp2.
Figure 4—figure supplement 1
Lysosome-rich enterocyte (LRE) and anterior enterocyte marker expression delineates mCherry-positive and mCherry-negative cells.
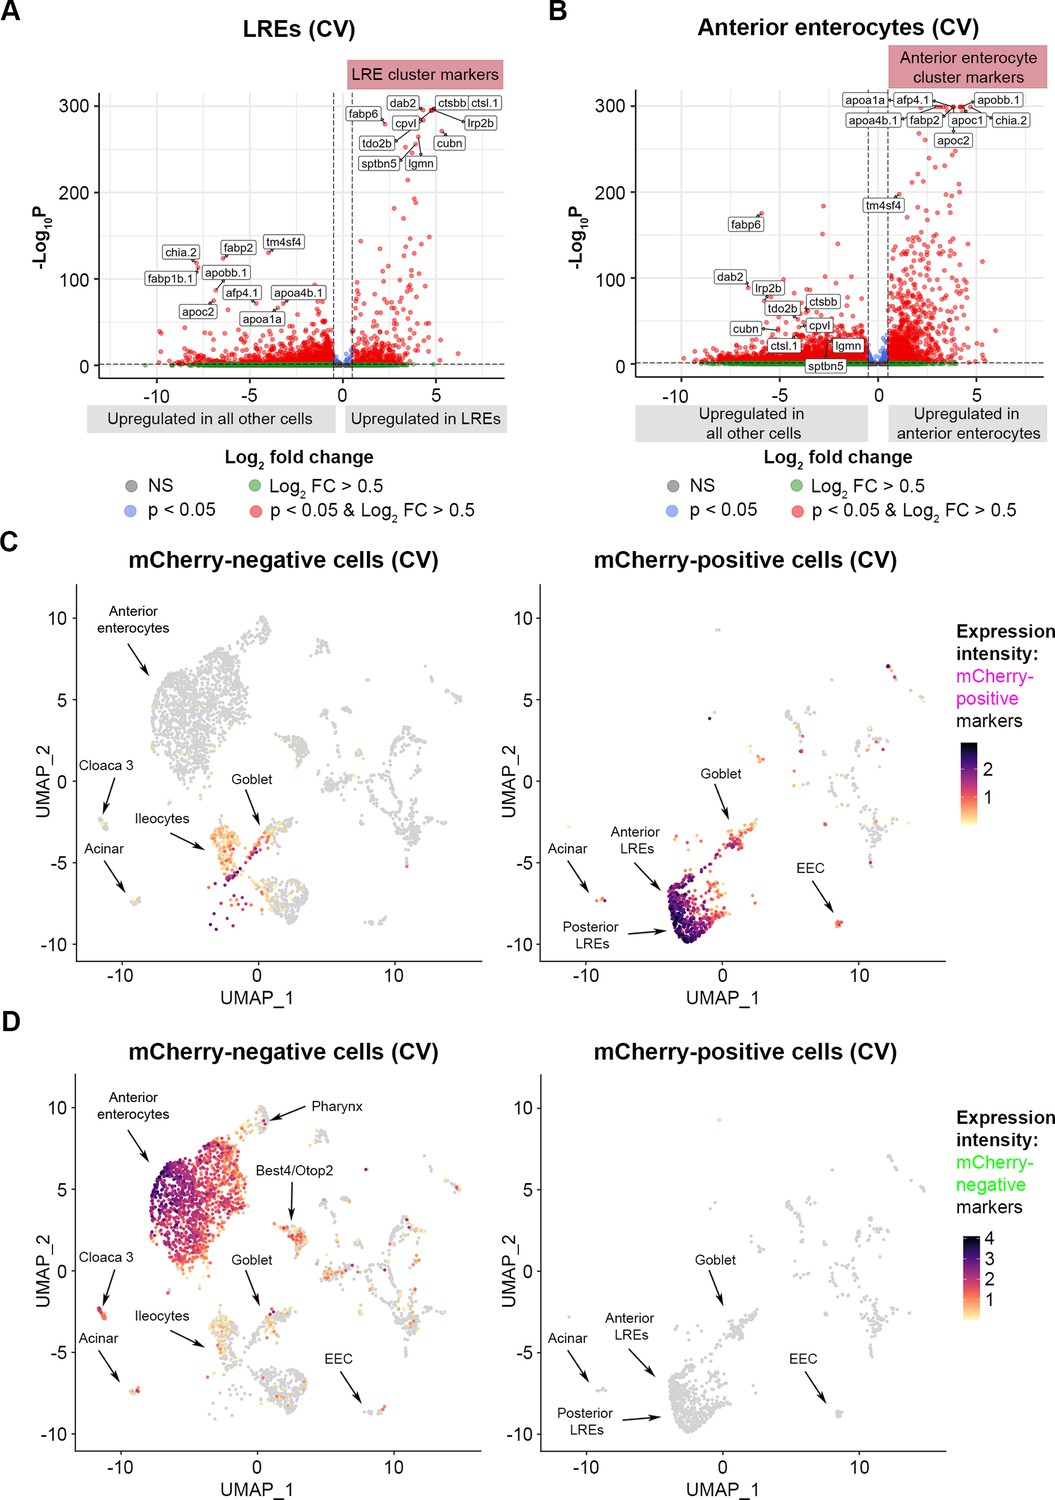
(A) Volcano plot displays LRE marker genes in all cells within the conventional (CV) dataset. The top differentially expressed genes (DEGs) between LREs and other cells are tagged. Genes with a red dot and log2FC >0.5 are significant LRE cluster markers. (B) Volcano plot displays anterior enterocyte marker genes in all cells within the CV dataset. The top DEGs between anterior enterocytes and other cells are tagged. Genes with a red dot and log2FC >0.5 are anterior enterocyte cluster markers. (C) UMAP projections show expression of the top DEGs in mCherry-positive cells compared to mCherry-negative cells (ctsbb, lrp2b, ctsl.1, dab2, cpvl, cubn, tdo2b, lgmn, fabp6, sptbn5) in the CV dataset. The cell color gradient intensity indicates the cumulative expression level of these genes. Left: UMAP projection displays all sorted mCherry-negative cells in the CV dataset. Right: UMAP projection displays sorted mCherry-positive cells in the CV dataset. (D) UMAP projections show expression of the top DEGs in mCherry-negative cells compared to mCherry-positive cells (fabp2, chia.2, fabp1b.1, apobb.1, apoa4b.1, apoa1a, tm4sf4, afp4.1, apoc2, apoc1) within the CV dataset. The cell color gradient intensity indicates the cumulative expression level of these genes. Left: UMAP projection displays all sorted mCherry-negative cells in the CV dataset. Right: UMAP projection displays all sorted mCherry-positive cells in the CV dataset.
Figure 5 with 1 supplement
Transcriptomic patterns of anterior and posterior lysosome-rich enterocytes (LREs).
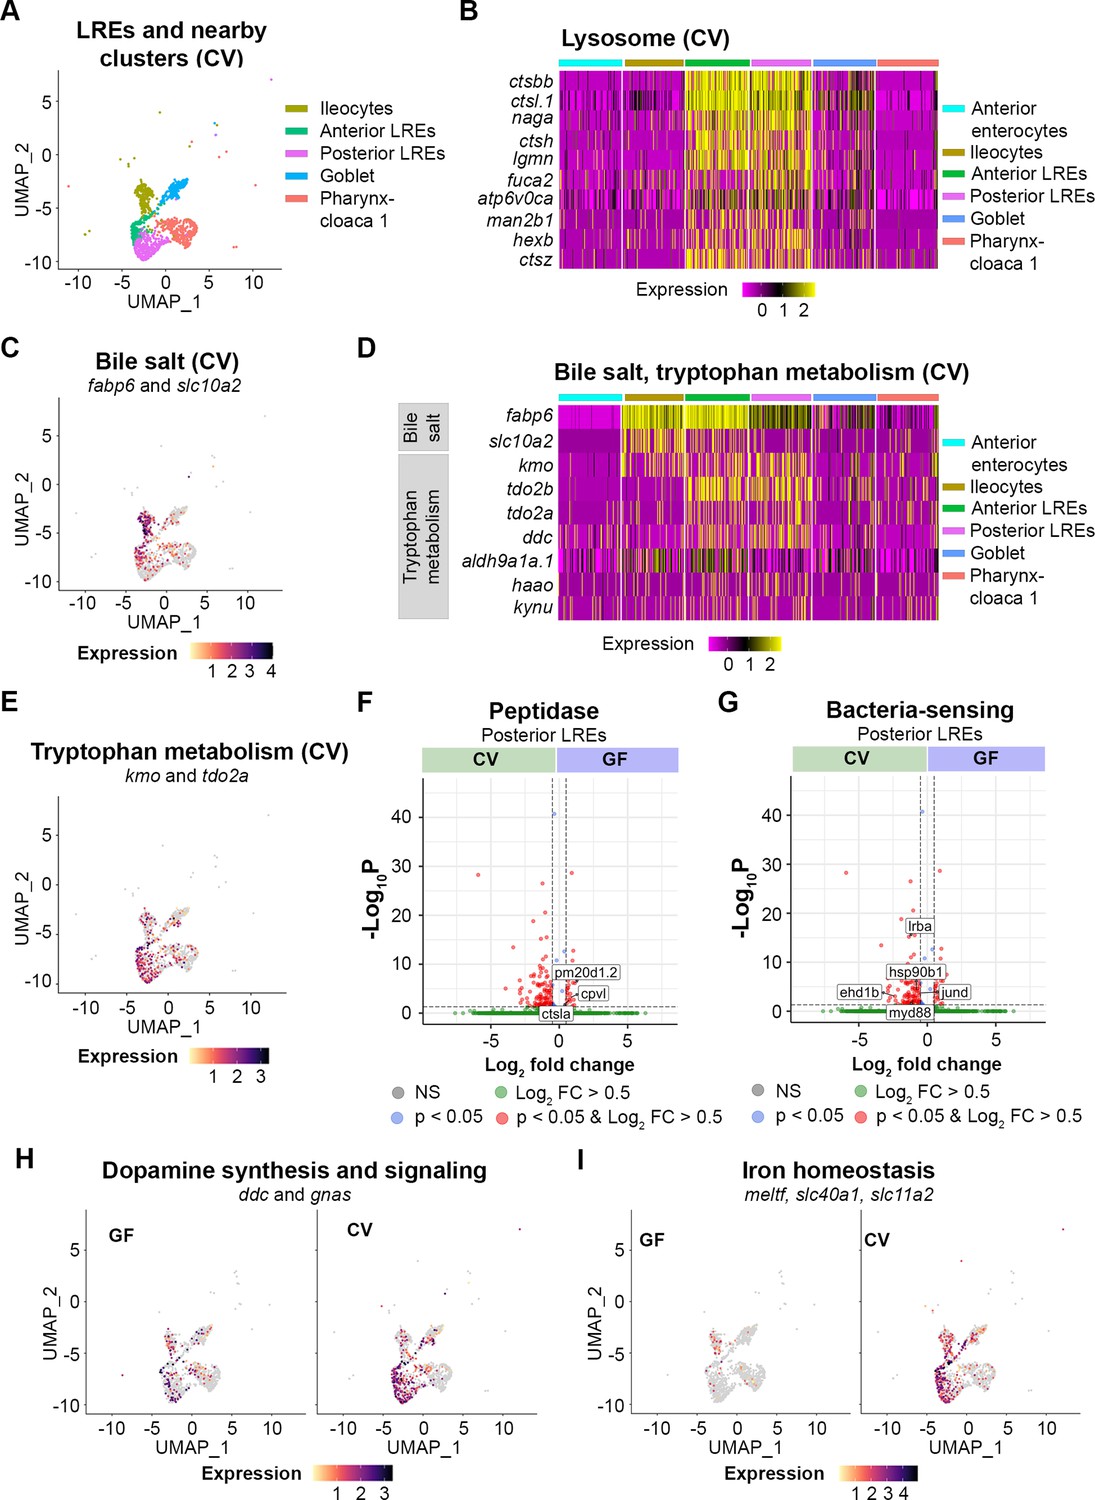
(A) UMAP projection shows anterior and posterior LREs, as well as close cell clusters in the conventional (CV) condition. Cell types are color coded. (B) Heatmap illustrates expression of lysosome KEGG pathway genes in LREs and close clusters. The colored bars at the top of the plot indicate the cluster. Heatmap color corresponds to expression intensity. (C) UMAP projection displays expression of the bile salt transport genes fabp6 and slc10a2 in the LREs, ileocytes, goblet, and pharynx-cloaca 1 cells. Cell color indicates cumulative expression intensity for fabp6 and slc10a2. (D) Heatmap highlights expression of bile salt transport and tryptophan metabolism genes in the LREs and close clusters. The colored bars at the top indicate the cell cluster. (E) UMAP projection displays expression of tryptophan metabolism genes kmo and tdo2a in the LREs and close clusters. Cell color indicates cumulative expression intensity of kmo and tdo2a. (F) Volcano plot shows differentially expressed genes (DEGs) between germ-free (GF) and CV posterior LREs. Peptidase genes are tagged. (G) Volcano plot shows DEGs between GF and CV posterior LREs. Genes involved in microbe sensing and inflammatory response are tagged. (H) UMAP projection plots show expression of dopamine synthesis (ddc) and signaling (gnas) genes in GF (left) and CV (right) cells. (I) UMAP projection plots show expression of iron homeostasis genes (meltf, slc40a1, slc11a2) in GF (left) and CV (right) cells.
Figure 5—figure supplement 1
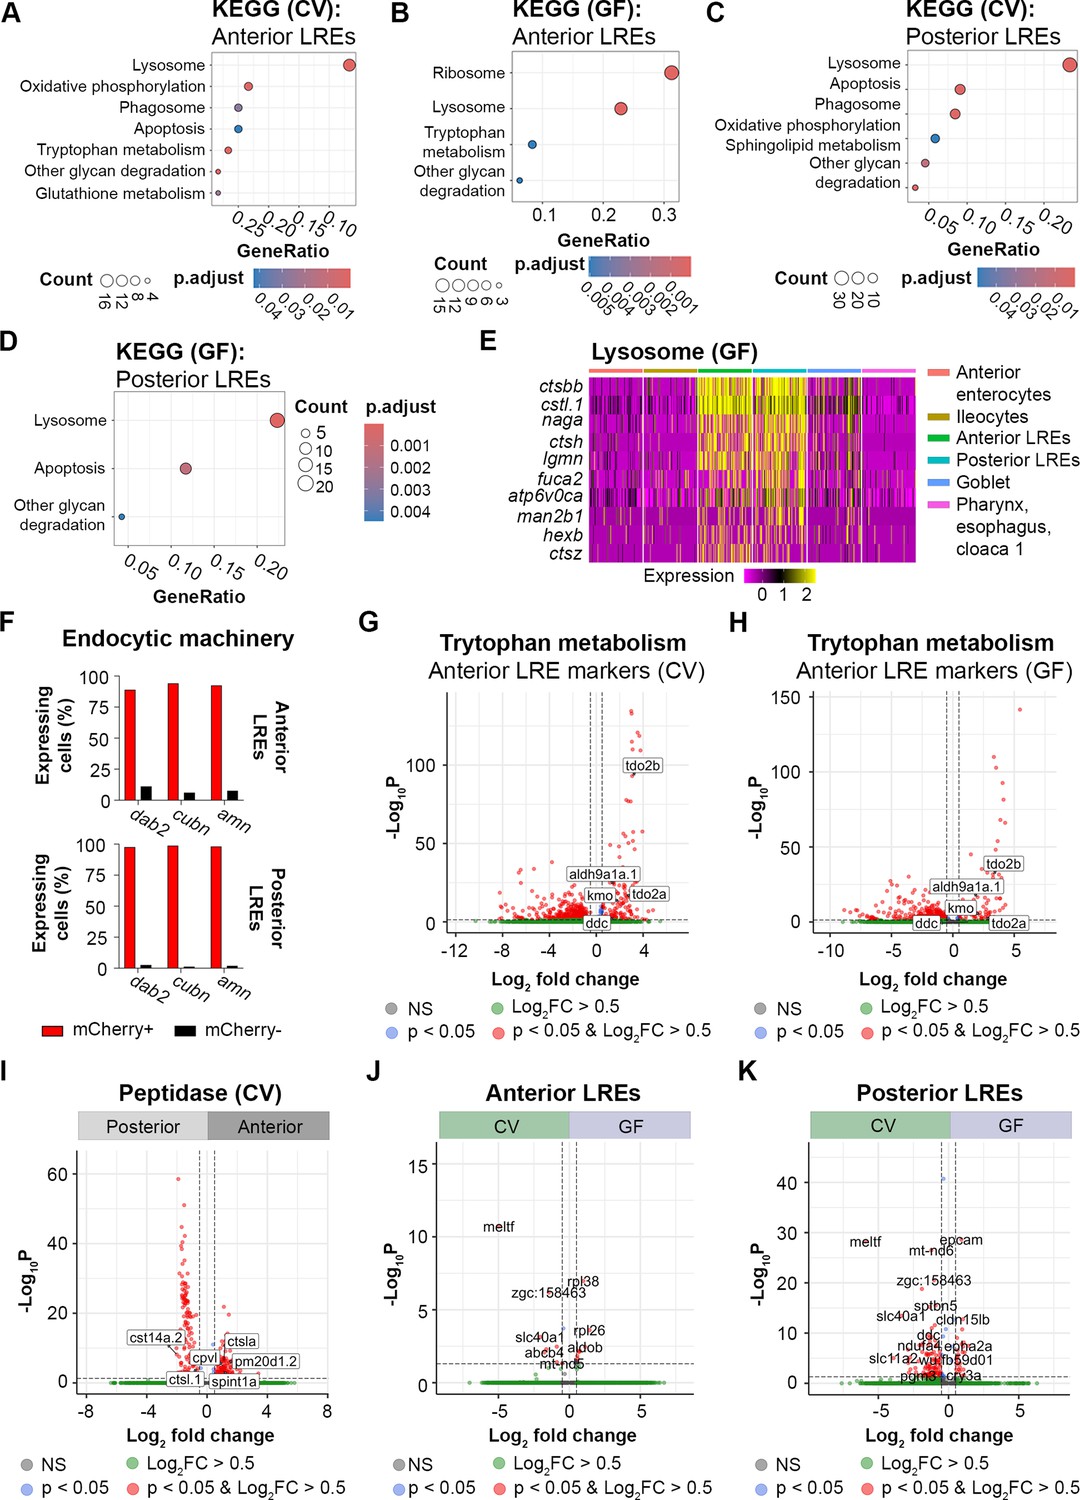
Lysosome-rich enterocytes (LREs) show regional expression patterns and responses to the gut microbiome.
(A) Dot plot shows KEGG pathways that were significantly upregulated in anterior LREs from the conventional (CV) dataset. Dot color corresponds to the adjusted p value, while dot size describes the number of pathway genes expressed in anterior LREs. (B) Dot plot of KEGG pathways that were significantly upregulated in anterior LREs of germ-free (GF) larvae. (C) Dot plot of KEGG pathways that were significantly upregulated in the posterior LREs of CV larvae. (D) Dot plot of KEGG pathways that were significantly upregulated in the posterior LREs of GF larvae. (E) Heatmap showing expression of KEGG pathway lysosome genes by LREs, midgut cell types and Pharynx, esophagus, cloaca 1 cells in the GF larvae. (F) Bar plots show the percentage of mCherry-positive and mCherry-negative cells that express components of the endocytic machinery in anterior LREs (top) and posterior LREs (bottom). (G, H) Volcano plot shows differentially expressed genes between anterior LREs and all other cell clusters in the CV (G) and GF (H) datasets. Genes that play a role in tryptophan metabolism are labeled. Red points with log2FC >0.5 are upregulated genes in anterior LREs from the CV (F) and GF (G) datasets. (I) Volcano plot shows differentially expressed genes between anterior and posterior LREs in the CV dataset. Tagged genes are peptidases. Red points with log2FC >0.5 and genes that were upregulated in anterior LREs, while red points with log2FC <–0.5 were upregulated genes in posterior LREs. (J, K) Volcano plots show differentially expressed genes between GF and CV anterior (J) and posterior LREs (K). Genes marked with red points with log2FC >0.5 were upregulated in the GF condition, while log2FC <0.5 were upregulated in the CV condition.
Figure 6 with 1 supplement
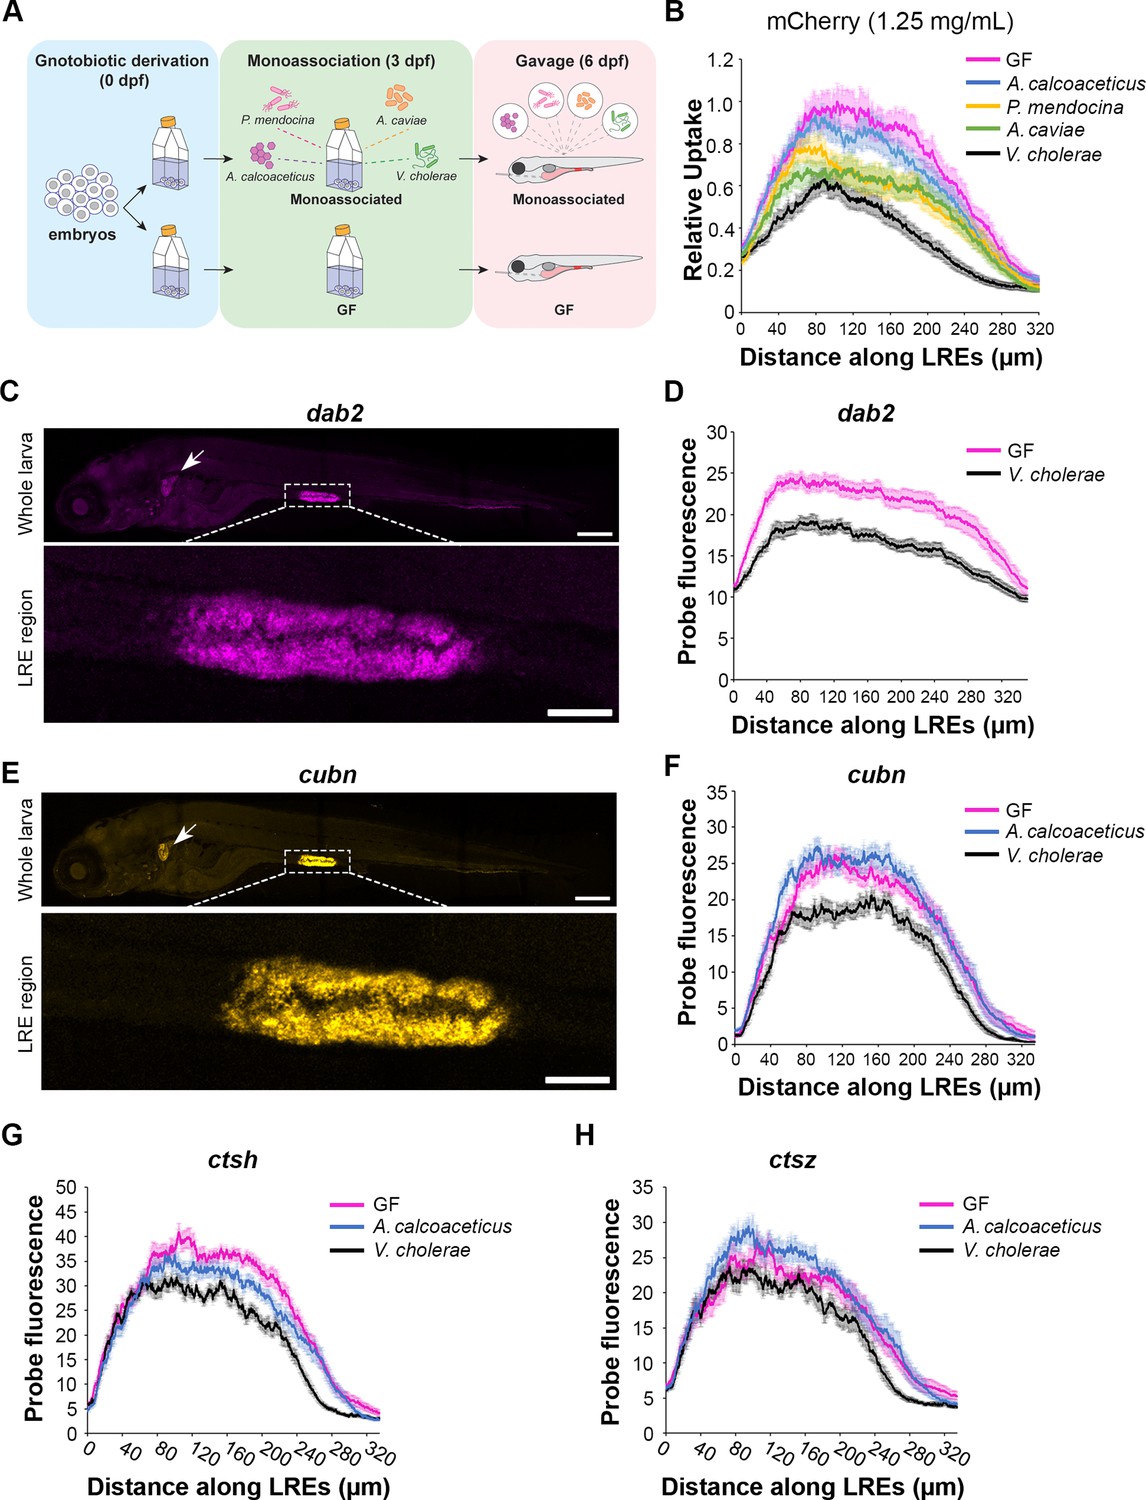
Lysosome-rich enterocyte (LRE) activity and expression of endocytic machinery are differentially affected by individual microbial strains.
(A) Cartoon of monoassociation experimental design. Following gnotobiotic derivation, monoassociated larvae are colonized with a single strain of bacteria at 3 dpf and gavaged with mCherry to measure protein uptake at 6 dpf. (B) Plot shows relative uptake of mCherry in larvae that were germ-free (GF) or monoassociated with a single bacterial strain. mCherry uptake was reduced by A. calcoaceticus (two-way ANOVA, p=0.0268, n=19–20), P. mendocina (two-way ANOVA, p=0.0033, n=20–21), A. caviae (two-way ANOVA,p<0.0001, n=19–20) and V. cholerae (two-way ANOVA, p<0.0001, n=18–20). (C) Confocal images show dab2 hybridization chain reaction (HCR) probe localization in whole zebrafish larva (top) and LRE region (bottom). Arrow points to pronephros. Whole larva scale = 200 μm. LRE region scale = 50 μm. (D) Plot shows dab2 HCR probe fluorescence in the LRE region at 6 dpf. dab2 expression was significantly greater in GF than V. cholerae-colonized larvae (two-way ANOVA, p<0.0001, n=23). (E) Confocal images show cubn HCR probe localization in whole zebrafish larva (top) and LRE region (bottom). Arrow points to pronephros. Whole larva scale = 200 μm. LRE region scale = 50 μm. (F) Plot shows cubn HCR probe fluorescence in the LRE region at 6 dpf. There was greater cubn expression in A. calcoaceticus-colonized than GF larvae (two-way ANOVA, p=0.049, n=21–23), but V. cholerae significantly reduced cubn expression (two-way ANOVA, p<0.0001, n=16–23). (G) Plot of ctsh expression in GF and monoassociated larvae. GF larvae showed greater ctsh expression than A. calcoaceticus (two-way ANOVA, p=0.0183, n=10–12) or V. cholerae-colonized larvae (two-way ANOVA, p<0.0001, n=8–12). (H) Plot of ctsz expression in GF and monoassociated larvae. A. calcoaceticus and GF larvae showed similar levels of ctsz expression in LREs (two-way ANOVA, p=0.09, n=10–12). V. cholerae colonization reduced ctsz expression compared to GF larvae (two-way ANOVA, p=0.0014, n=8–12).
Figure 6—figure supplement 1
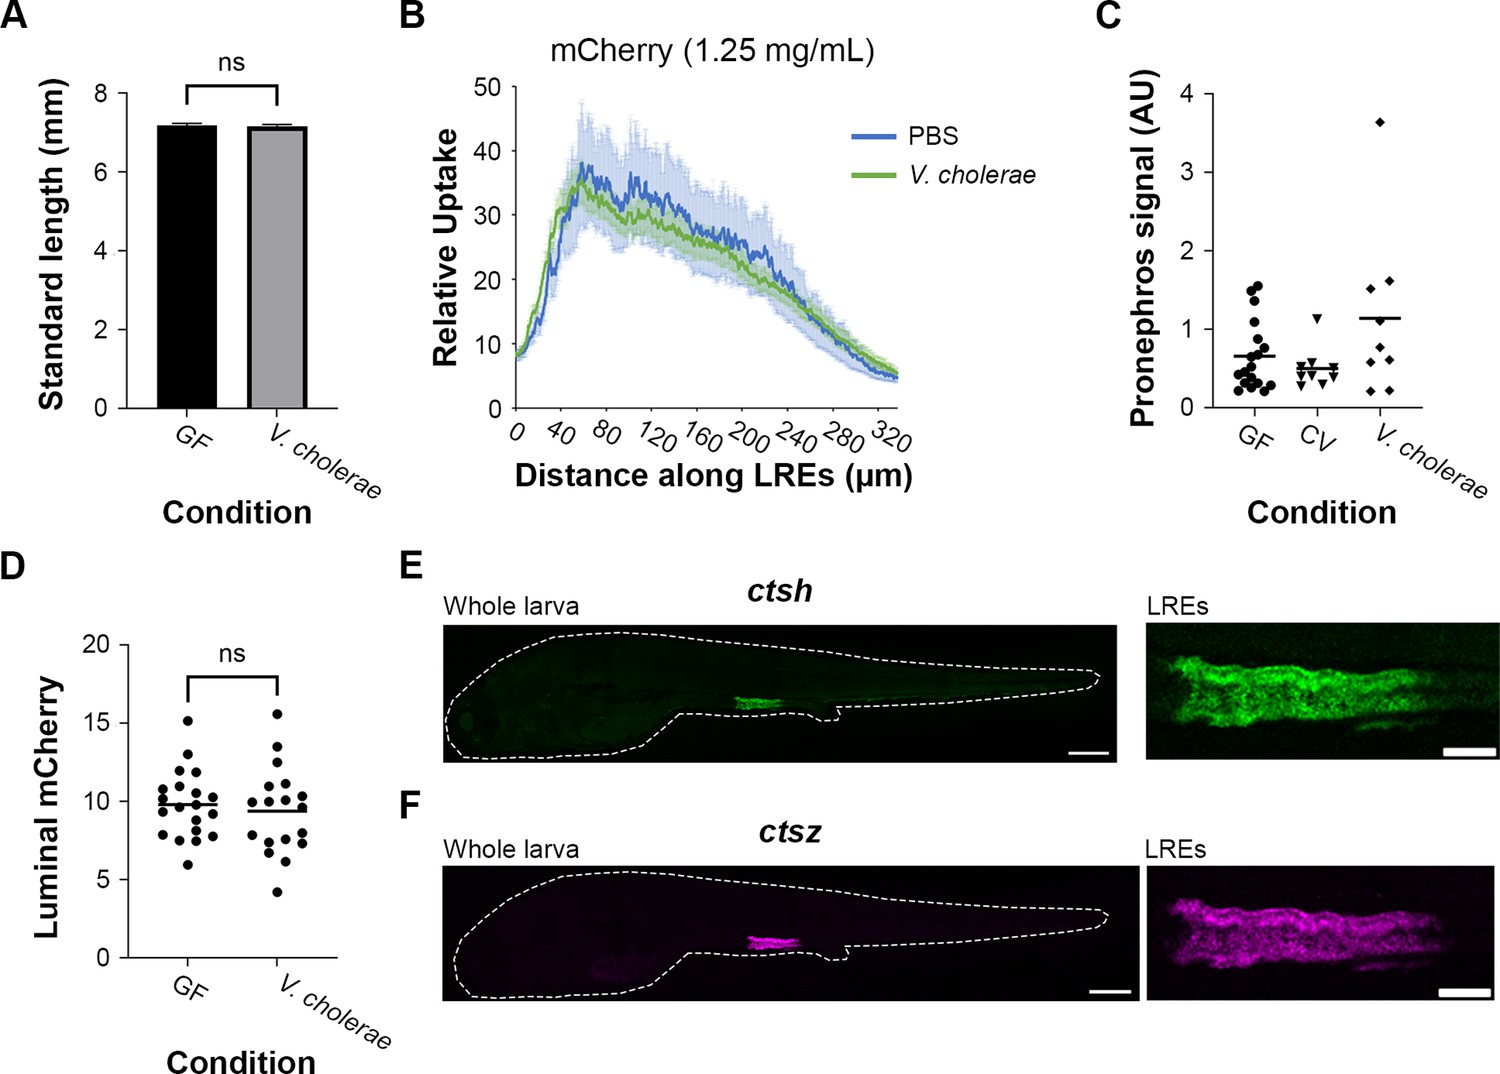
Long-term exposure to V. cholerae required to reduce protein uptake activity in lysosome-rich enterocytes (LREs) without affecting larval growth or protein availability.
(A) Plot of standard length in larvae that were germ-free (GF) or monoassociated with V. cholerae. There was not a significant difference in standard length (Two-tailed t-test, p=0.66, n=18–22). (B) Plot of mCherry uptake in larvae gavaged with PBS or live V. cholerae. There was no difference in the average mCherry uptake between the conditions (two-way ANOVA, p=0.527, n=7–16). (C) Plot of mCherry fluorescence signal in pronephros of GF, conventional (CV), and V. cholerae-colonized larvae. There was no significant difference between GF, CV, and V. cholerae (one-way ANOVA, p=0.154, n=9). (D) Plot of average luminal mCherry fluorescence in GF and V. cholerae-colonized larvae at 6 dpf by 1 hr PG. Luminal mCherry fluorescence was not significantly different (Two-tailed t-test, p=0.60, n=18–20). (E-F) Confocal images of ctsh (E) and ctsz (F) hybridization chain reaction (HCR) probe localization in whole larva and the LRE region. Larva is outlined with a dashed line. Whole larva scale = 200 μm. LRE scale = 50 μm.
Figure 7 with 1 supplement
Lysosome-rich enterocyte (LRE) activity and dietary protein impact gut microbiome.
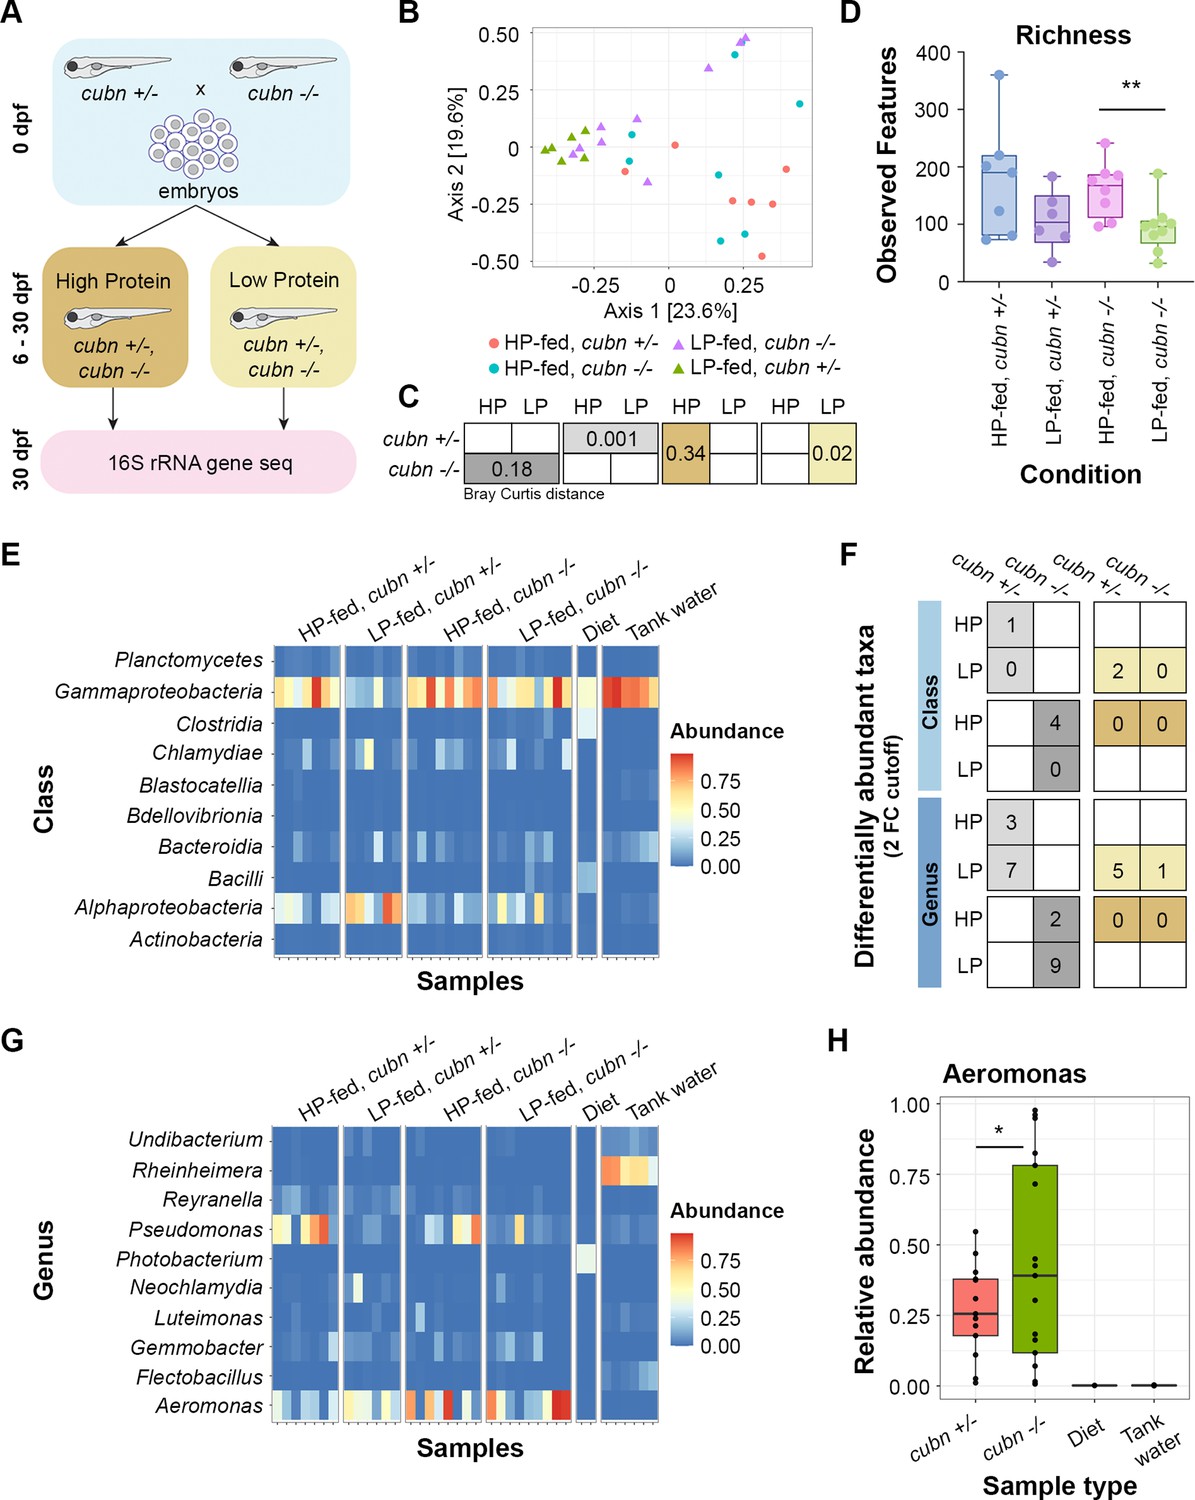
(A) Cartoon of 16 S rRNA gene sequencing experimental design. Homozygous cubn mutant and heterozygote larvae from the same clutch were fed a high-protein (HP) or low-protein (LP) diet from 6 to 30 dpf prior to whole larvae DNA extraction. (B) MDS plot of Bray Curtis distance between zebrafish samples. (C) Boxes show Bray Curtis distance p-values comparing genotype and diet effects on beta diversity. (D) Box plot of observed features between conditions. (E) Heat map of classes with the highest relative abundance across all samples. (F) Table of differentially abundant taxa counts at the class and genus levels. Boxes show the number of differentially abundant taxa per compared condition. Dietary comparisons are in the left column. Genotype comparisons are in the right column. (G) Heat map of the genera with the highest relative abundance across all samples. (H) Box plot showing relative abundance of Aeromonas spp. across genotypes and controls. The relative abundance of Aeromonas spp. was significantly higher in cubn mutants than heterozygotes (DESeq2, padj = 0.01).
Figure 7—figure supplement 1
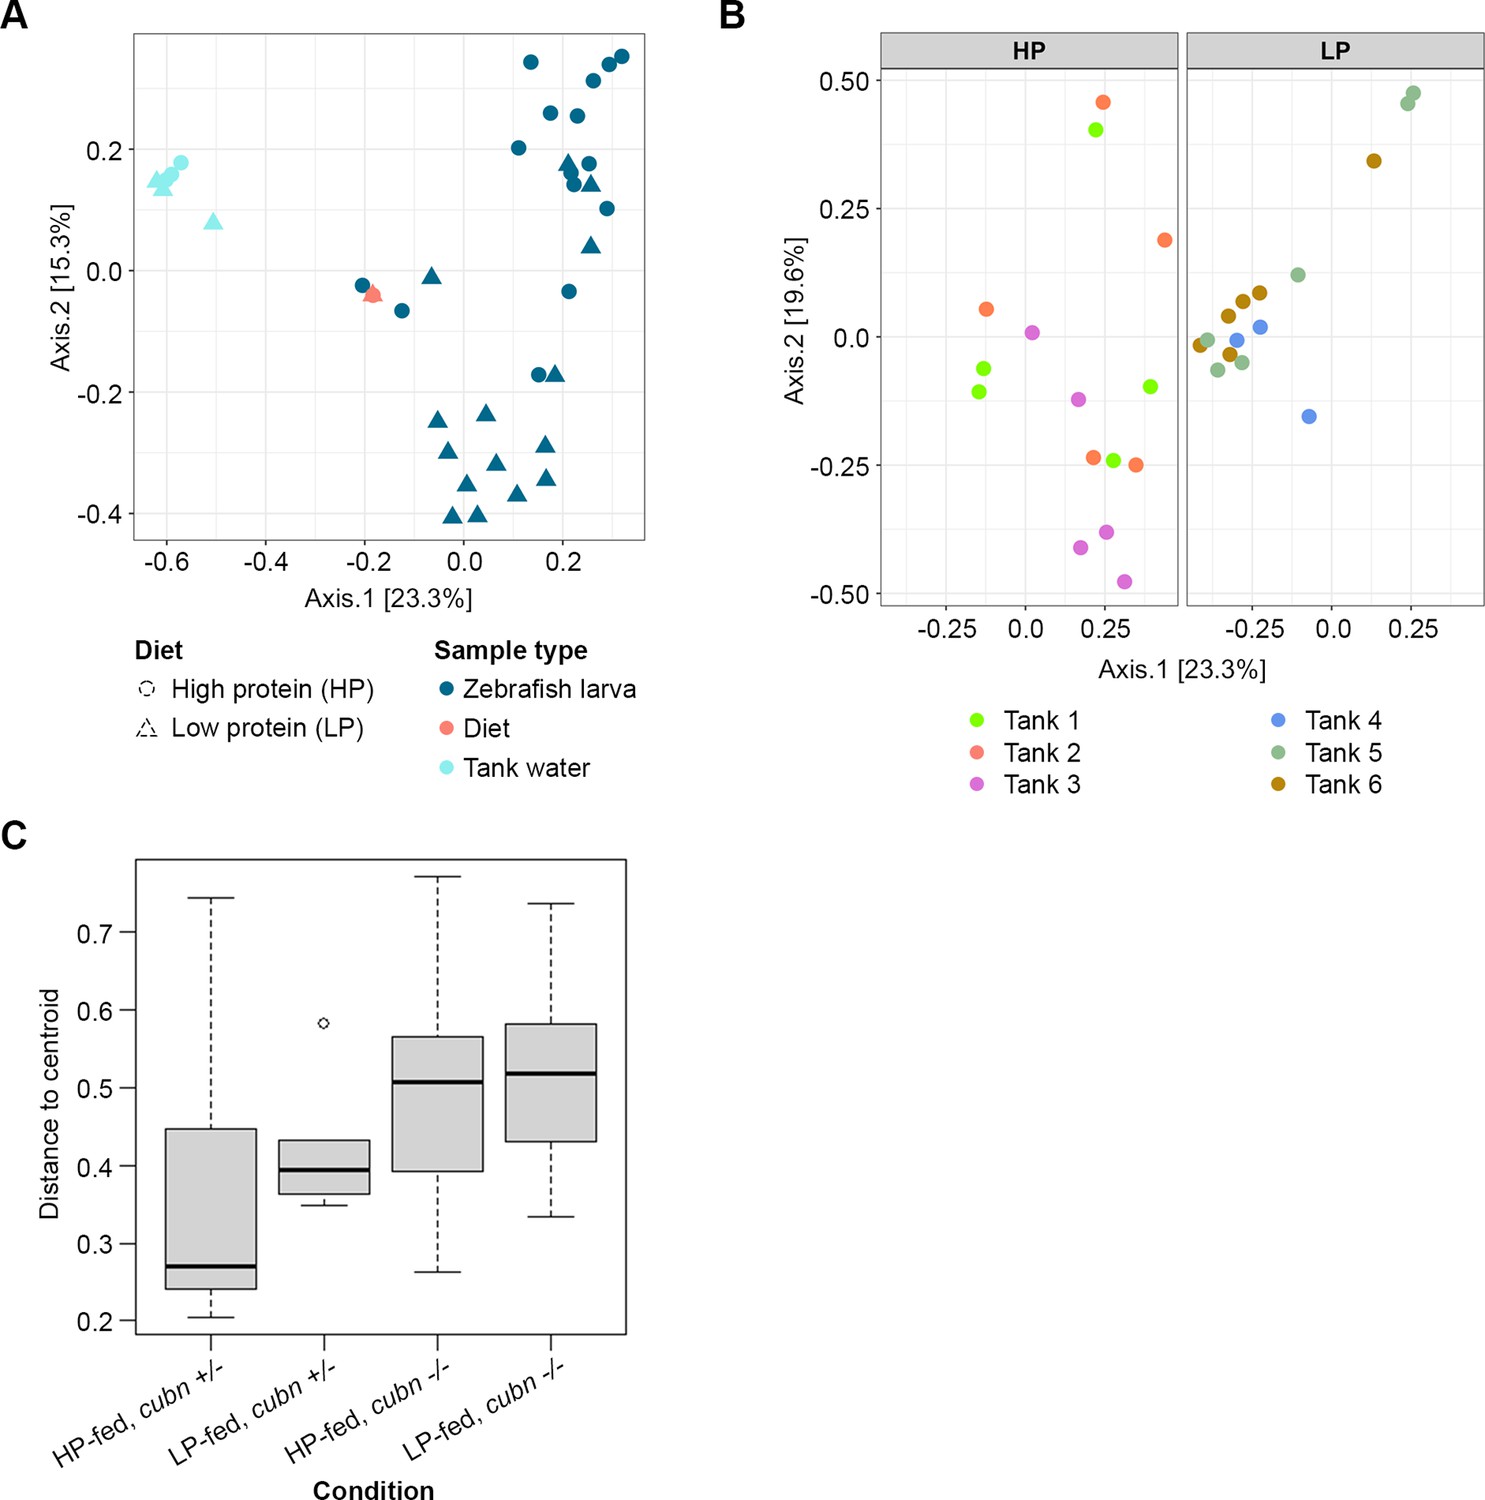
Microbiome assembly shaped by host environment.
(A) MDS plot of Bray Curtis beta distance between sample types. (B) MDS plot of Bray Curtis beta distance between zebrafish larvae fed the high-protein (HP) or low-protein (LP) diet. Point color indicates the tank that housed the zebrafish. (C) Box and whisker plot of Bray Curtis beta dispersion between zebrafish larvae from each experimental condition.
Author response image 1

Additional files
-
Supplementary file 1
Cluster markers in the GF dataset.
- https://cdn.elifesciences.org/articles/100611/elife-100611-supp1-v1.zip
-
Supplementary file 2
Cluster markers in the CV dataset.
- https://cdn.elifesciences.org/articles/100611/elife-100611-supp2-v1.zip
-
Supplementary file 3
Gene expression levels across clusters.
- https://cdn.elifesciences.org/articles/100611/elife-100611-supp3-v1.zip
-
Supplementary file 4
Differentially expressed genes between mCherry-positive and mCherry-negative cells.
- https://cdn.elifesciences.org/articles/100611/elife-100611-supp4-v1.zip
-
Supplementary file 5
Differentially expressed genes between germ-free (GF) and conventional (CV) conditions.
- https://cdn.elifesciences.org/articles/100611/elife-100611-supp5-v1.zip
-
Supplementary file 6
Differentially abundant bacteria.
- https://cdn.elifesciences.org/articles/100611/elife-100611-supp6-v1.xlsx
-
Supplementary file 7
Hybridization chain reaction (HCR) probe sequences.
- https://cdn.elifesciences.org/articles/100611/elife-100611-supp7-v1.xlsx
-
MDAR checklist
- https://cdn.elifesciences.org/articles/100611/elife-100611-mdarchecklist1-v1.pdf
Download links
A two-part list of links to download the article, or parts of the article, in various formats.
Downloads (link to download the article as PDF)
Open citations (links to open the citations from this article in various online reference manager services)
Cite this article (links to download the citations from this article in formats compatible with various reference manager tools)
Protein absorption in the zebrafish gut is regulated by interactions between lysosome rich enterocytes and the microbiome
eLife 13:RP100611.
https://doi.org/10.7554/eLife.100611.3


