ILC3 GM-CSF production and mobilisation orchestrate acute intestinal inflammation
- University of Oxford, United Kingdom
- John Radcliffe Hospital, University of Oxford, United Kingdom
- CSL Ltd., Australia
- National Institute for Medical Research, United Kingdom
Figures
Figure 1 with 2 supplements
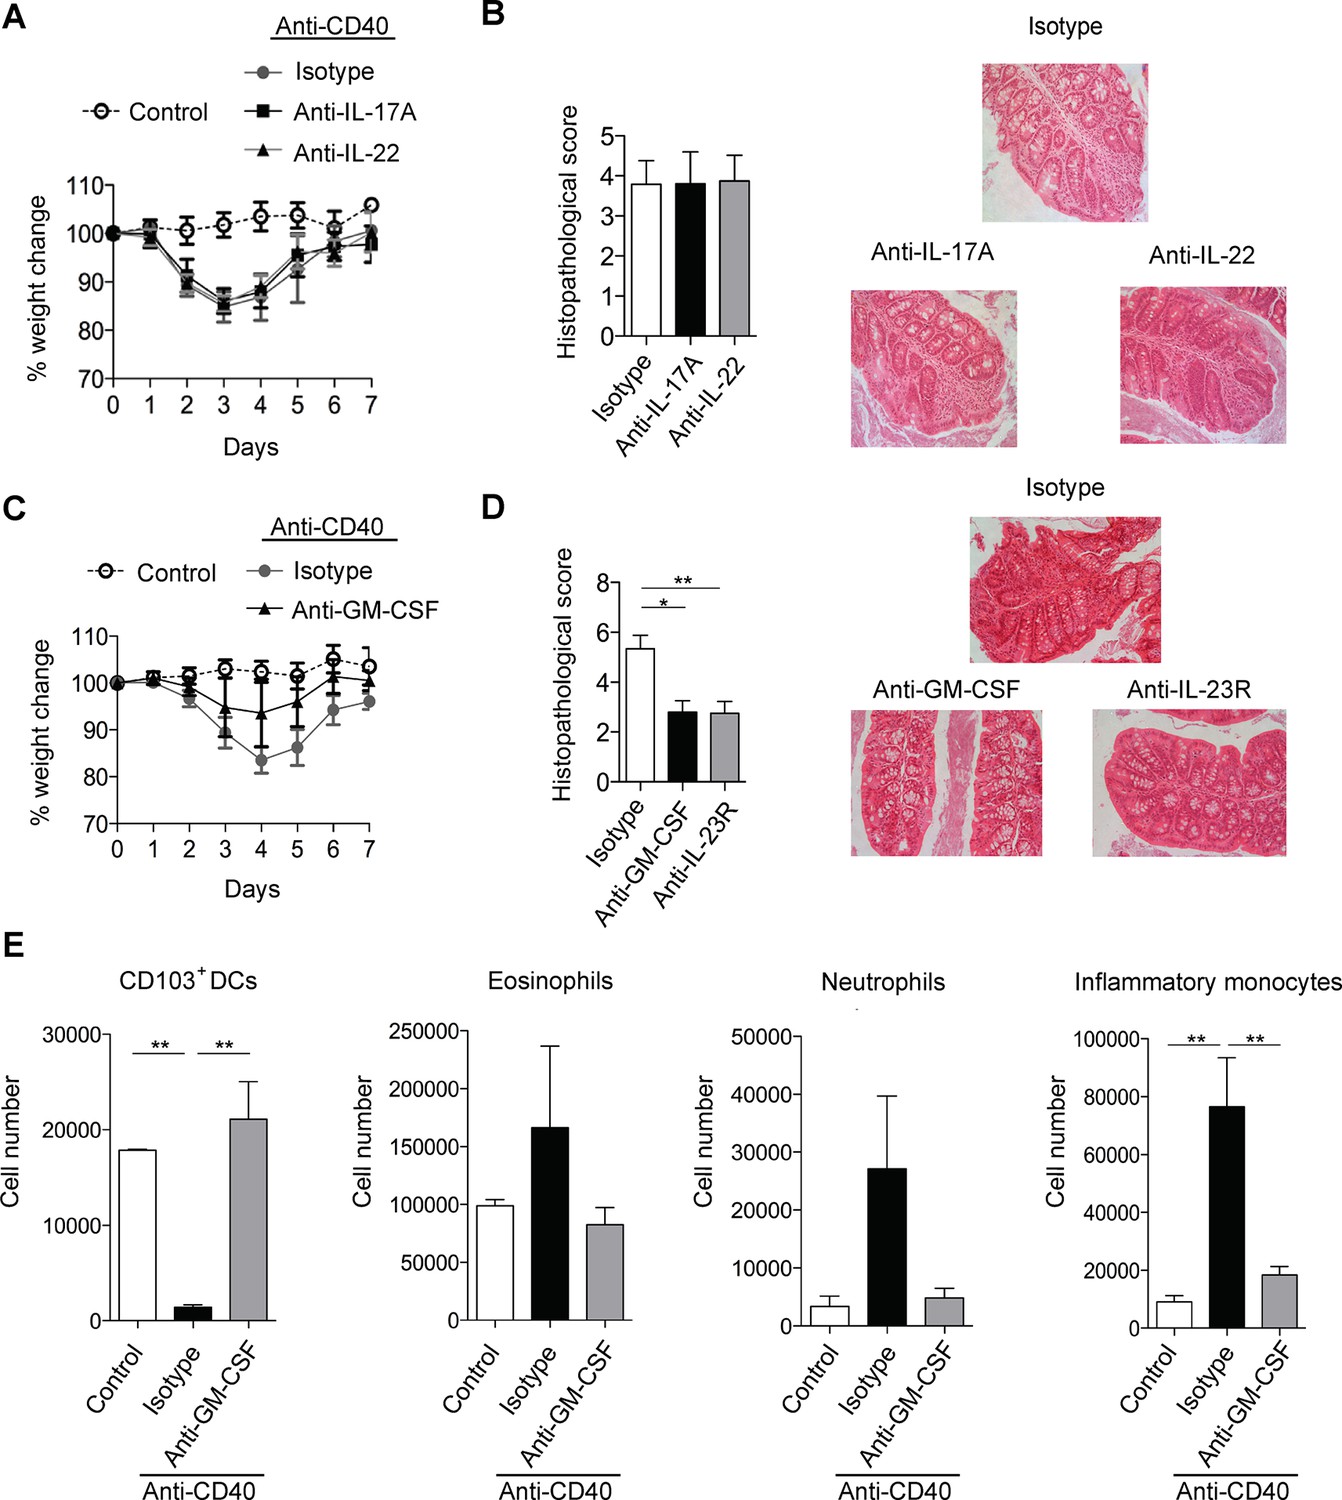
GM-CSF is a critical cytokine mediator of ILC-driven colitis.
(A) Weight loss and (B) proximal colon histopathology scores in untreated B6Rag1-/- mice (control, n=3) or mice injected with anti-CD40 and treated with blocking antibody to IL-17A (n=5), IL-22 (n=7) or isotype (n=8) for 7 days. Representative photomicrographs of H&E stained proximal colon sections are shown. (C) Weight loss and (D) proximal colon histopathology scores in untreated B6Rag1-/- mice (control, n=8) or mice injected with anti-CD40 and treated with blocking antibody to GM-CSF (n=7), blocking antibody to IL-23R (n=5) or isotype (n=6) for 7 days. Representative photomicrographs of H&E stained proximal colon sections are shown. (E) Number of innate immune cell populations in cLP at three days following anti-CD40 injection. Data are shown as means and SEM. Results are representative of n=2–5 independent experiments. *, p<0.05, **, p<0.01, One-way ANOVA with Bonferroni’s post test. (Figure 1—figure supplement 1) shows no effect of IL-17A and IL-22 double blockade and IL-17F blockade on systemic disease or colitis. (Figure 1—figure supplement 2) shows improved systemic and intestinal disease with anti-GM-CSF treatment in Helicobacter hepaticus driven innate colitis.
Figure 1—figure supplement 1
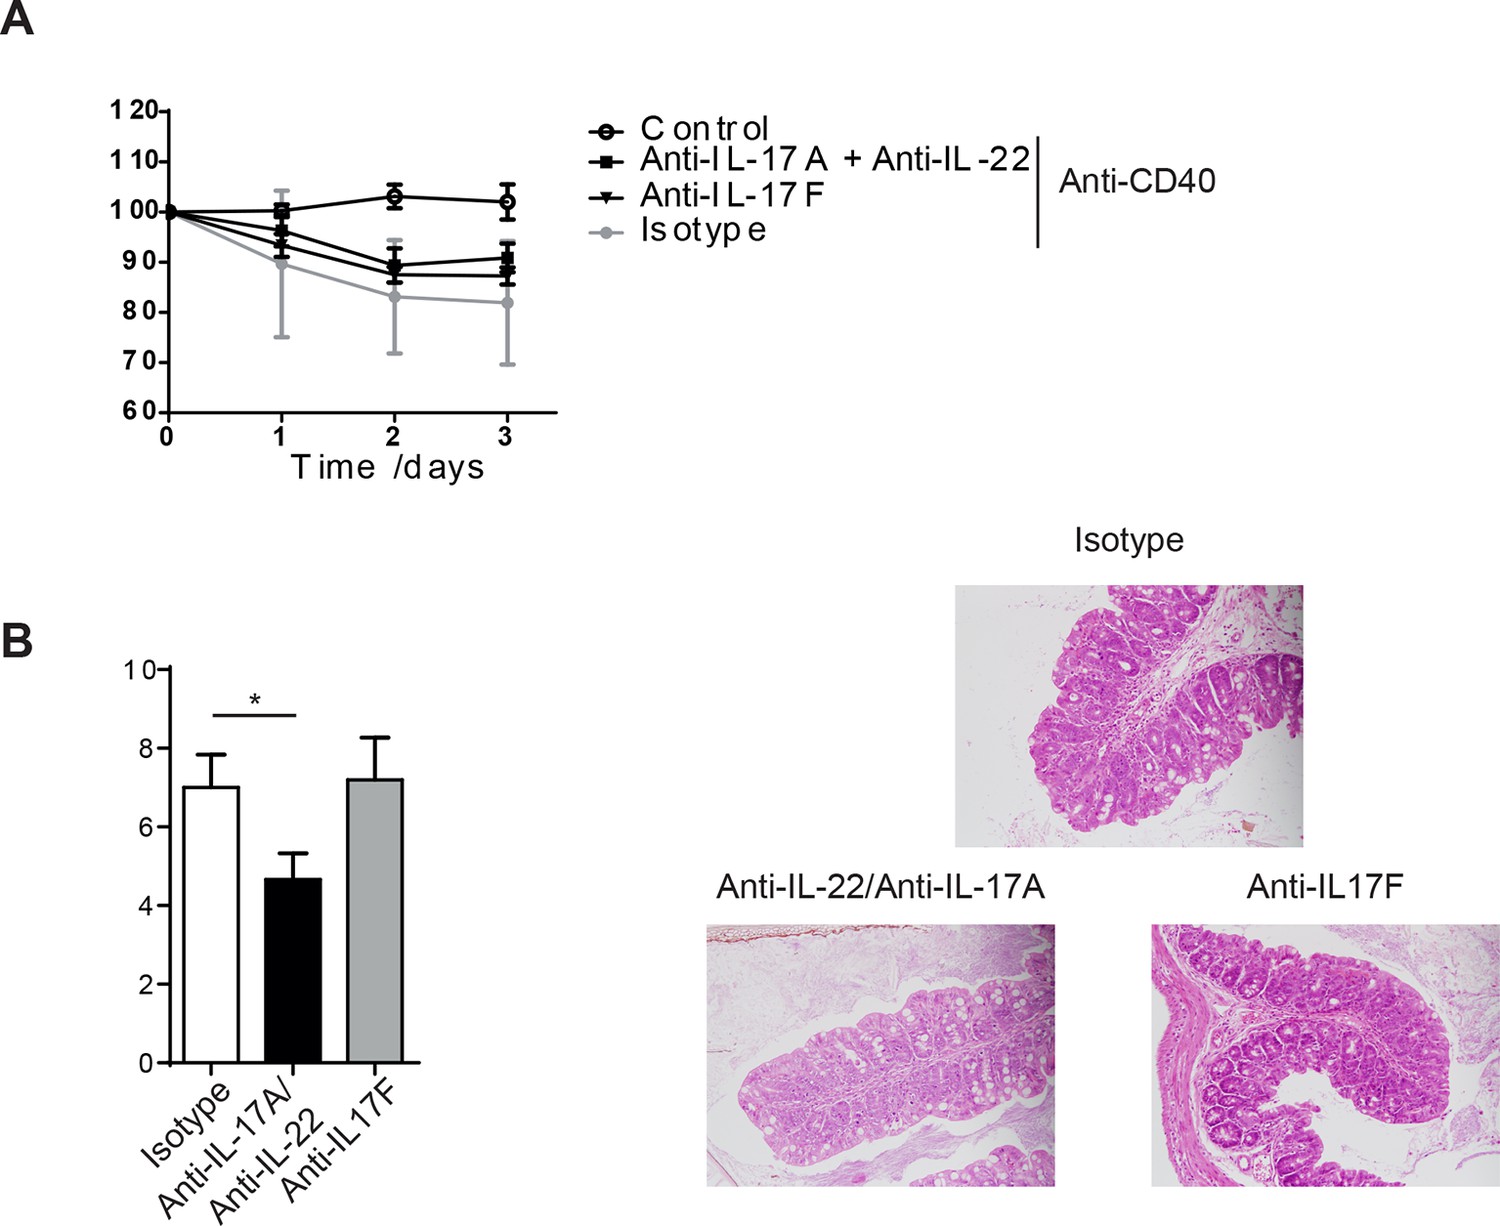
IL-17A and IL-22 combination blockade or anti-IL-17F does not protect from anti-CD40 mediated colitis.
(A) Weight loss and (B) proximal colon histopathology scores in untreated B6Rag1-/- mice (control, n=6) or mice injected with anti-CD40 and treated with blocking antibody to IL-17F (n=5), a combination of IL-17A and IL-22 blockade (n=6) or isotype (n= 6). Representative photomicrographs of H&E stained proximal colon sections are shown. Data are shown as mean and SEM. Results are a combination of 2 independent experiments. One-way ANOVA with Bonferroni’s post test.
Figure 1—figure supplement 2
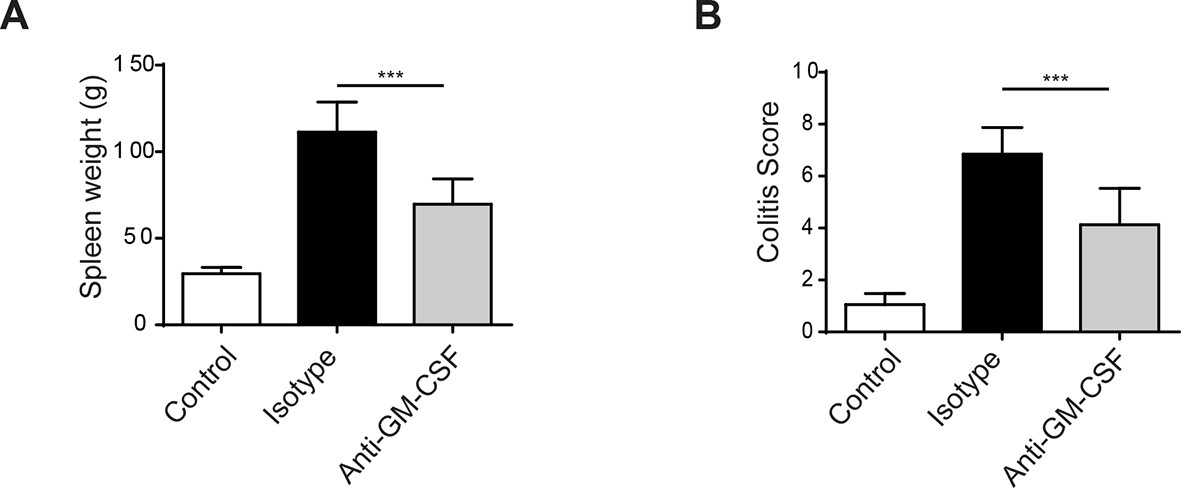
Helicobacter hepaticus driven innate colitis depends on GM-CSF.
(A) Spleen weight from uninfected (n=4), isotype treated H.h, infected (n=7), or anti-GM-CSF treated H.h, infected mice (n=7) 6 weeks after infection. (B) Colitis score of uninfected (n=4), isotype treated H.h, infected (n=6), or anti-GM-CSF treated H.h, infected mice (n=7) 6 weeks after infection. Data are shown as mean and SEM. Results are representative of 2 independent experiments. ***, p<0.001. One-way ANOVA with Bonferroni’s post test
Figure 2 with 1 supplement
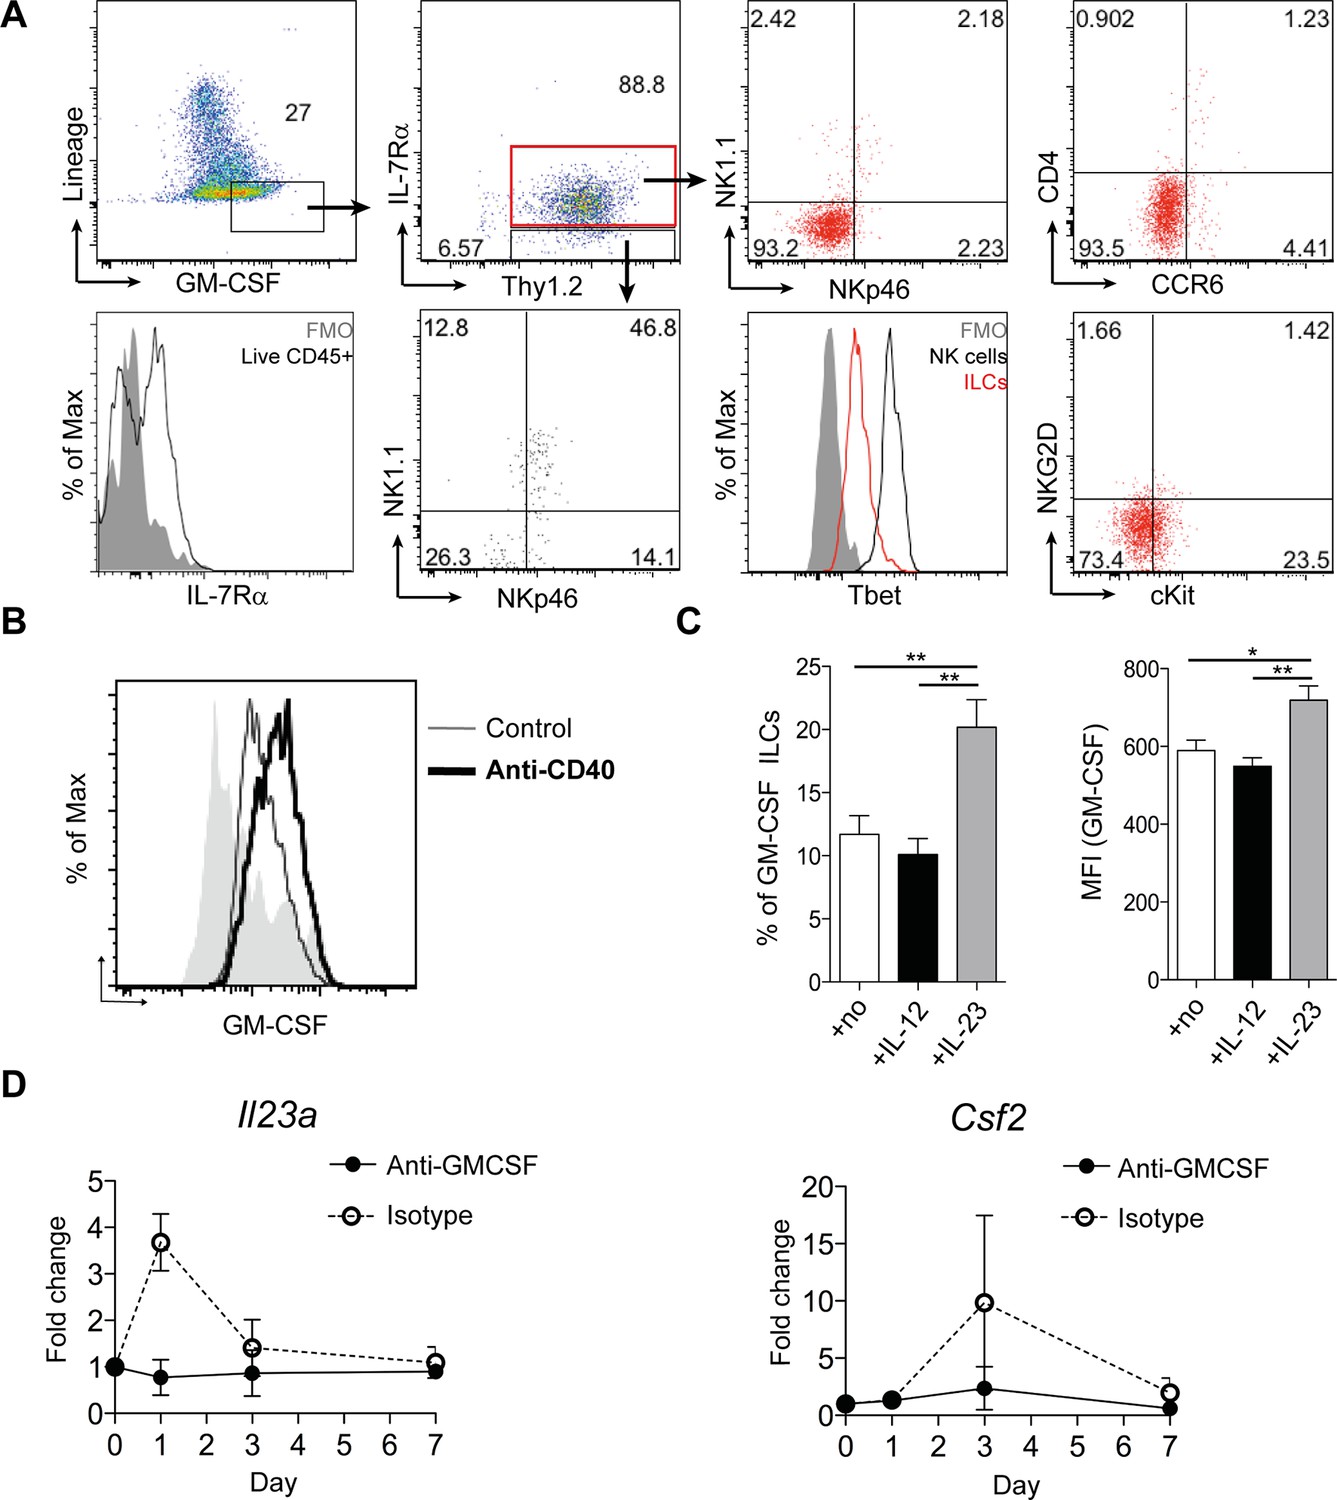
ILCs are a major source of GM-CSF.
(A) Representative flow cytometric analysis of ILC populations at day 3 following anti-CD40 treatment. Surface marker and GM-CSF expression is shown following 3 hr stimulation with PMA, ionomycin, monensin, and brefeldin A (n=6). Cells are gated on a live cell gate with doublets excluded. GM-CSF expression gating is based on an FMO control. Red marks ILCs and black marks NK cells. Lower left panel shows IL-7Rα staining in live CD45+ cells compared with FMO control. (B) Representative flow cytometric analysis showing GM-CSF production for ILC populations in untreated or anti-CD40 treated mice. The solid grey histogram represents the isotype control. Following doublet exclusion, cells are gated on a live cell gate, then gated on lineage-, CD45+ Thy1.2+ IL-7Rα+ cells. (C) Percent and median fluorescence intensity of GM-CSF expression in CD4- NKp46- ILCs isolated from mice 7d following anti-CD40 injection. Total cLP cells were stimulated over night with IL-12, IL-23 or in medium alone, followed by 3 hr stimulation with PMA, ionomycin, monensin and brefeldin A (n=7). Results are representative of 2–3 independent experiments. (D) mRNA expression of Il23a and Csf2 in proximal colonic lamina propria at various time points following anti-CD40 injection. Results are shown as fold change in target gene relative to hprt compared with day 0 uninjected control mice. Data are shown as means and SEM. Results are pooled from 2 independent experiments with n=4–6 mice per group per experiment. *, p<0.05, **, p<0.01, one-way ANOVA with Bonferroni’s post test. (Figure 2—figure supplement 1) shows analysis of lack of NK cell contribution to colitis.
Figure 2—figure supplement 1
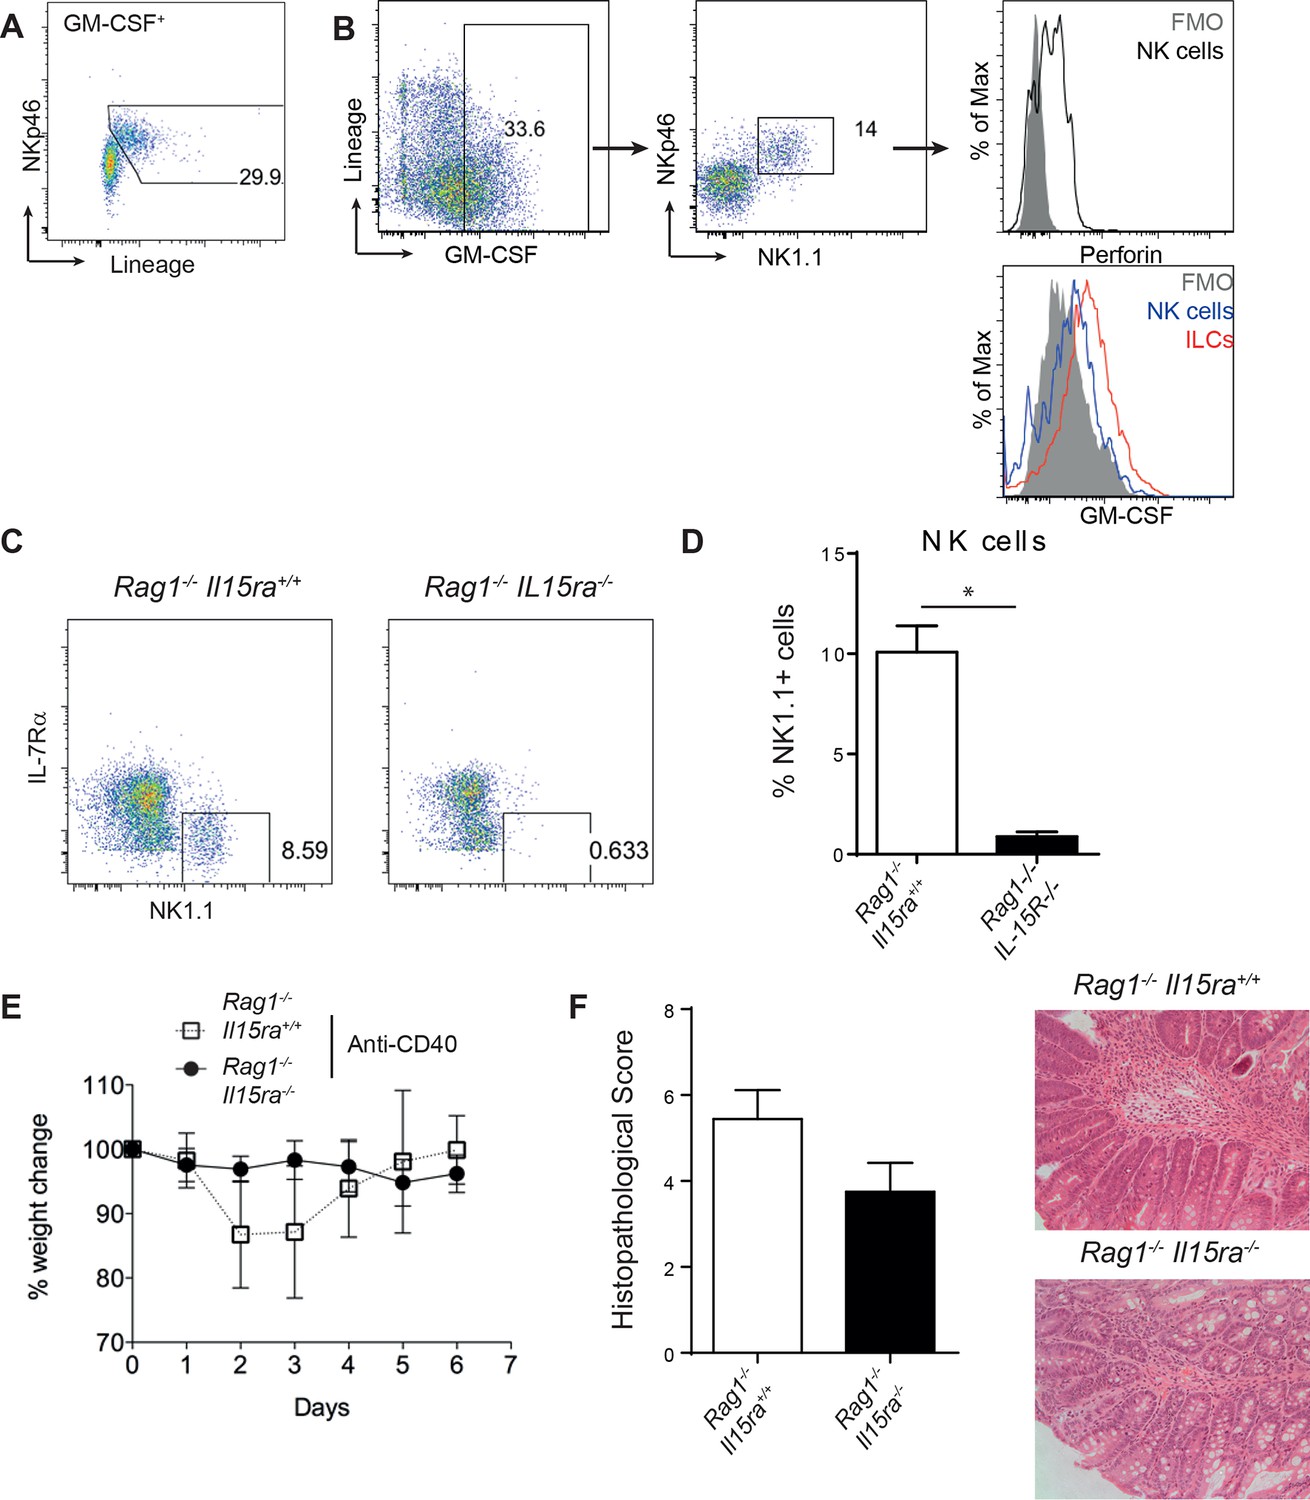
NK cells are not required for anti-CD40 induced colitis.
(A) Representative flow cytometry plot of GM-CSF+ cells showing lineage+ cells are NKp46+. (B) Representative flow cytometric analysis of GM-CSF producing cells gated on single, live, CD45+ cells showing that non-ILCs are NK cells based on perforin expression and that total NK cells produce less GM-CSF than total ILCs. (C) Representative NK cell gating from B6Rag1-/- and B6Rag1-/-Il15ra-/- mice. (D) Percent NK1.1 positive cells of live leukocytes in B6Rag1-/- and B6Rag1-/-Il15ra-/- mice. (E) Weight loss and (F) proximal colon histopathology scores in untreated B6Rag1-/- mice (n=13) or B6Rag1-/-Il15ra-/-(n=12) mice injected with anti-CD40. Representative photomicrographs of H&E stained proximal colon sections are shown. Results are a combination of 3 independent experiments. *, p<0.05 Mann Whitney.
Figure 3 with 1 supplement
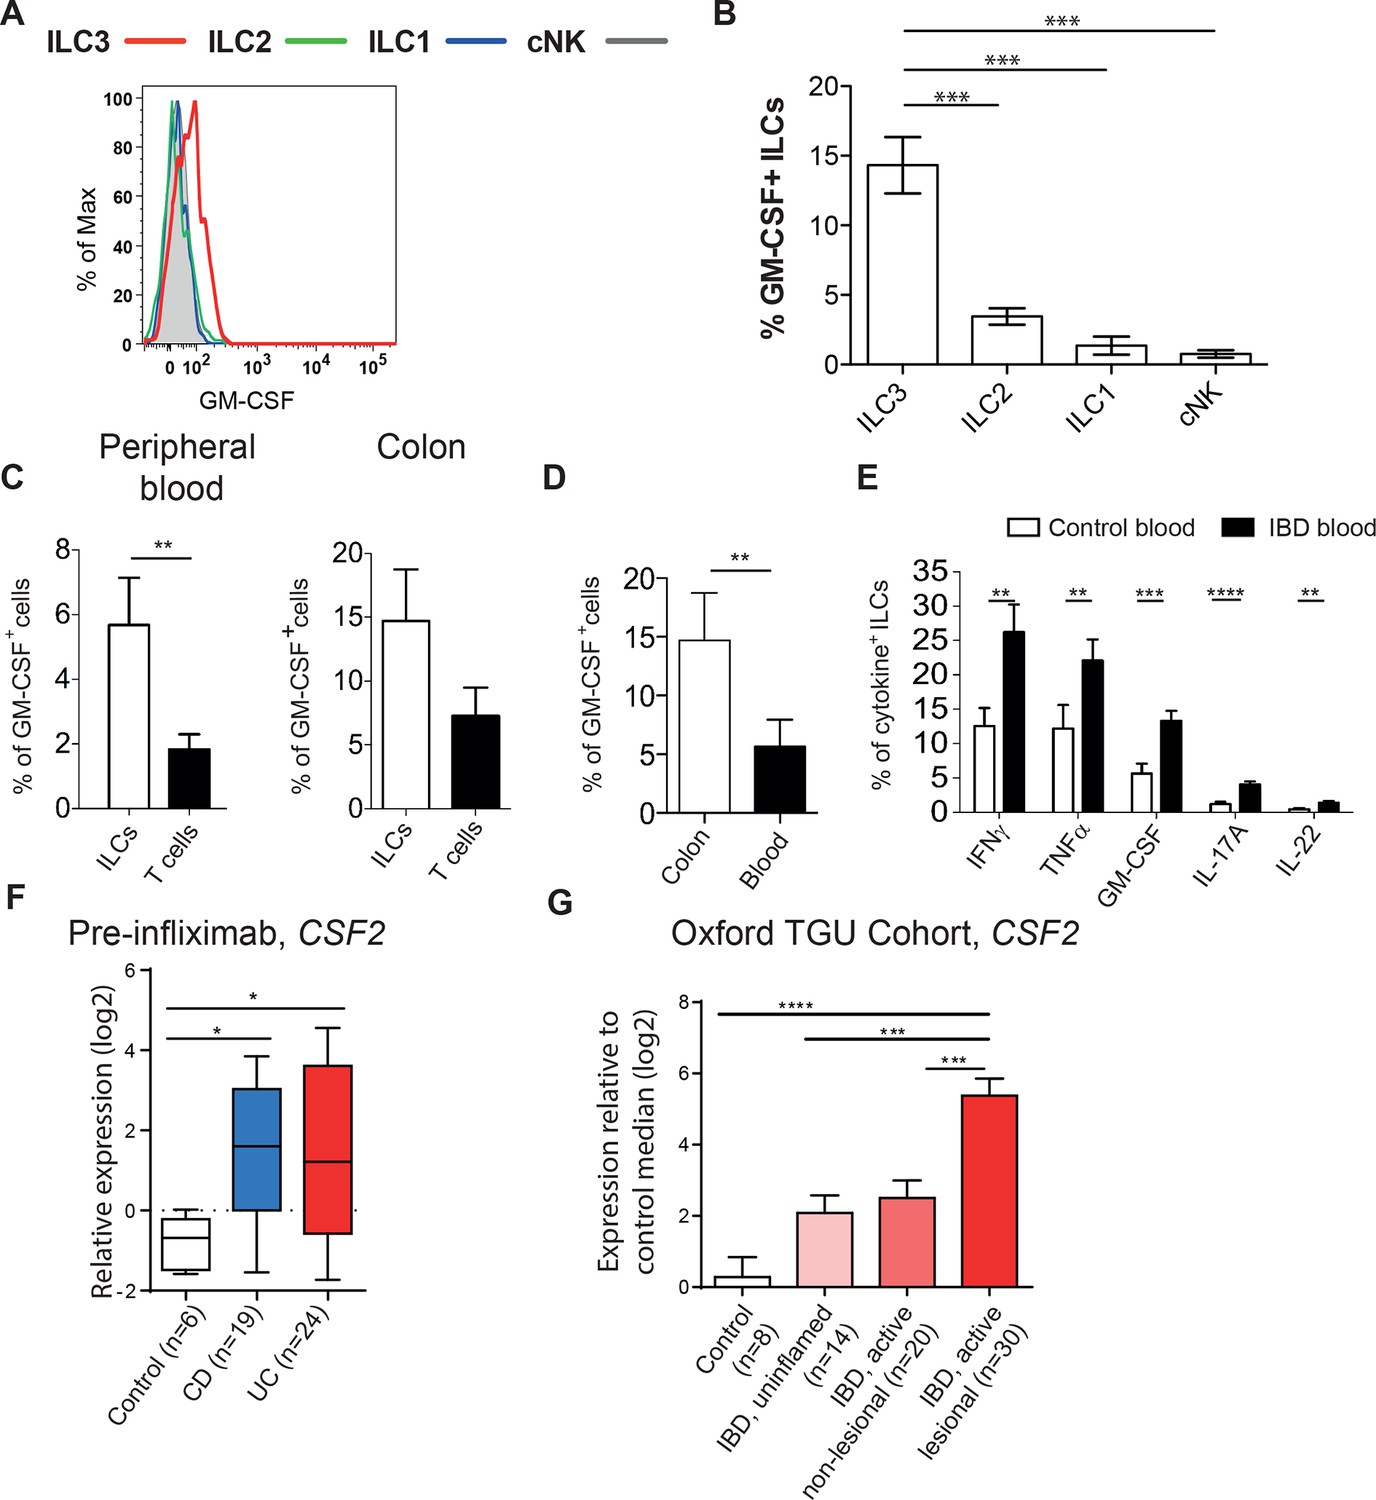
Human ILCs are a source of GM-CSF, which increases in IBD.
(A) Representative flow cytometric analysis of GM-CSF in human blood ILC subsets (following doublet exclusion and gated on live cells, ILCs are lineage-. ILC1 are IL-7Rα+ cKit- CRTH2-, ILC2 are IL-7Rα+ CRTH2+, ILC3 are IL-7Rα+ cKit+ CRTH2-. cNK cells are CD56+ IL-7Rα- CD45RO-) stimulated with PMA, ionomycin and brefeldin A for 4 hr. (B) Quantification of percent of GM-CSF+ blood ILC populations (n=3–6). (C) Percent of human blood and colon ILCs and T cells expressing GM-CSF following stimulation with PMA, ionomycin and brefeldin A for 4 hr (n=5). (D) Comparison of ILCs in blood and colon expressing GM-CSF (n=5). (E) Percent of ILCs expressing pro-inflammatory cytokines in the blood of control and IBD patients following stimulation with PMA, ionomycin and brefeldin A for 4 hr (n=10–15). Results are representative of n=2–5 independent experiments. *, p<0.05, **, p<0.01, ***, p<0.001, ***, p<0.0001 one-way ANOVA with Bonferroni’s post test. (F) Relative expression of CSF2 from the publicly available Leuven cohort (GSE16879) in control, Crohn’s disease, and ulcerative colitis patients before infliximab treatment. (G) Relative expression of CSF2 in the Oxford IBD cohort. Data for individual genes were normalized to the median value of healthy control patients, converted to log2 ratios, and analyzed by one-way ANOVA with Tukey’s multiple comparisons test (data were found to be normally distributed using the D’Agostino and Pearson omnibus normality test).
Figure 3—figure supplement 1
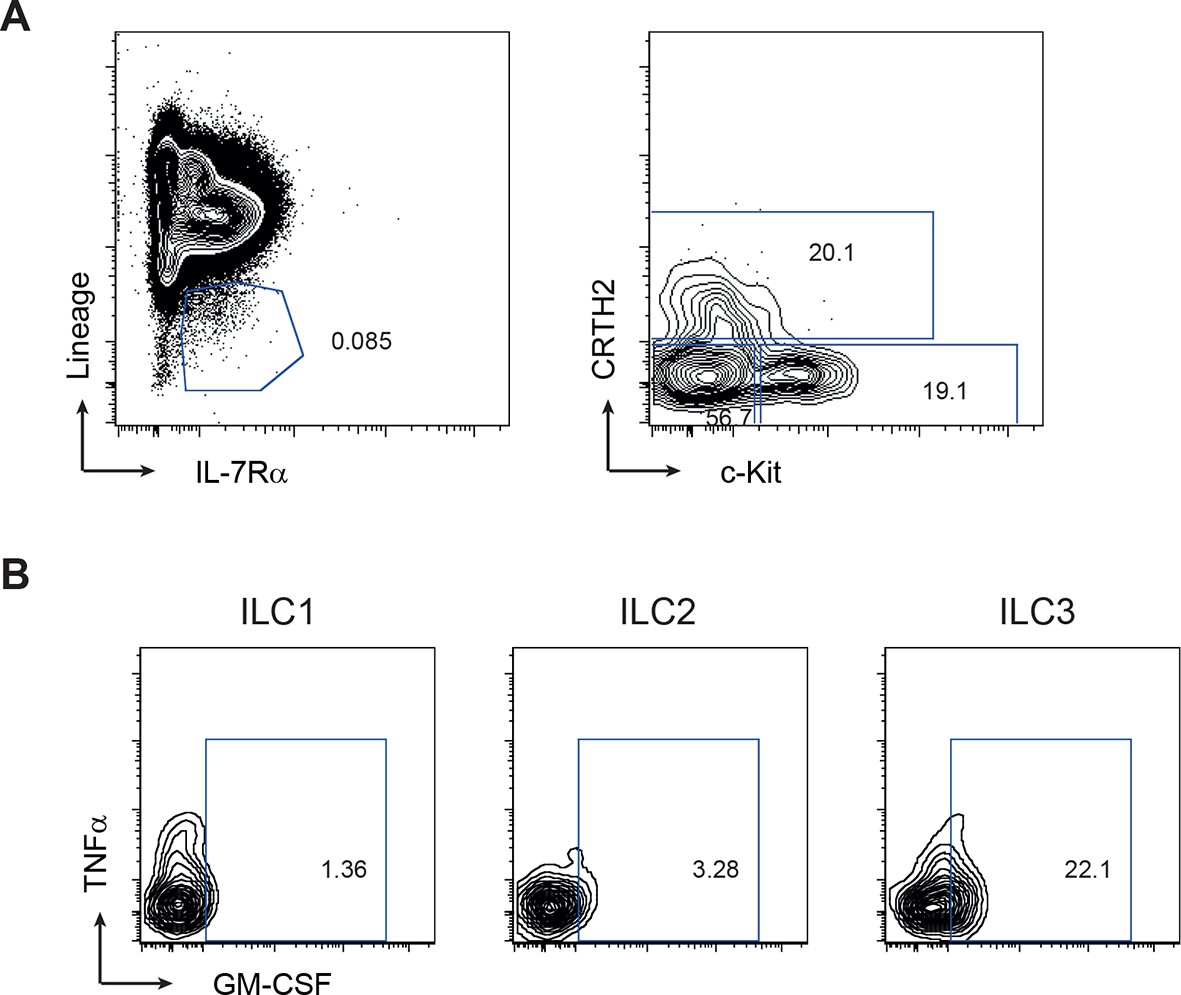
Gating strategy for human ILC subsets.
(A) Representative flow cytometric analysis of human blood ILC subsets. Doublet exclusion and live cell gate, ILCs are lineage-. ILC1 are IL-7Rα+ cKit- CRTH2-, ILC2 are IL-7Rα+ CRTH2+, ILC3 are IL-7Rα+ cKit+ CRTH2-. (B) Representative staining for GM-CSF and TNFα within ILC subsets stimulated with PMA, ionomycin and brefeldin A for 4 hr (n=3–6).
Figure 4 with 1 supplement

IL-23R marks ILCs that are present in cryptopatches within the gut.
(A) Representative H&E and immunofluorescence staining of cryptopatches in transverse proximal colon sections in B6Rag1-/- mice from the steady state at 2.5x and 20x magnification. (B) Flow cytometry staining of Thy1.2 in the colon LPLs of steady-state Il23rgfp/+ Rag1-/-. (C) Representative image of intact tissue explant of proximal colon from Il23rgfp/+ Rag1-/- mice from the steady state. Left and middle panels show IL-23R (green) and collagen (blue). Right panel shows IL-23R alone (top) and collagen alone (bottom). (D) Quantification of steady-state Il23rgfp/+ Rag1-/- ILCs in clusters within the proximal colon from explant imaging. (Figure 4—figure supplement 1) shows modulation of RORγt and IL-23R after anti-CD40 treatment. Results are representative of 3-4 independent experiments.
Figure 4—figure supplement 1
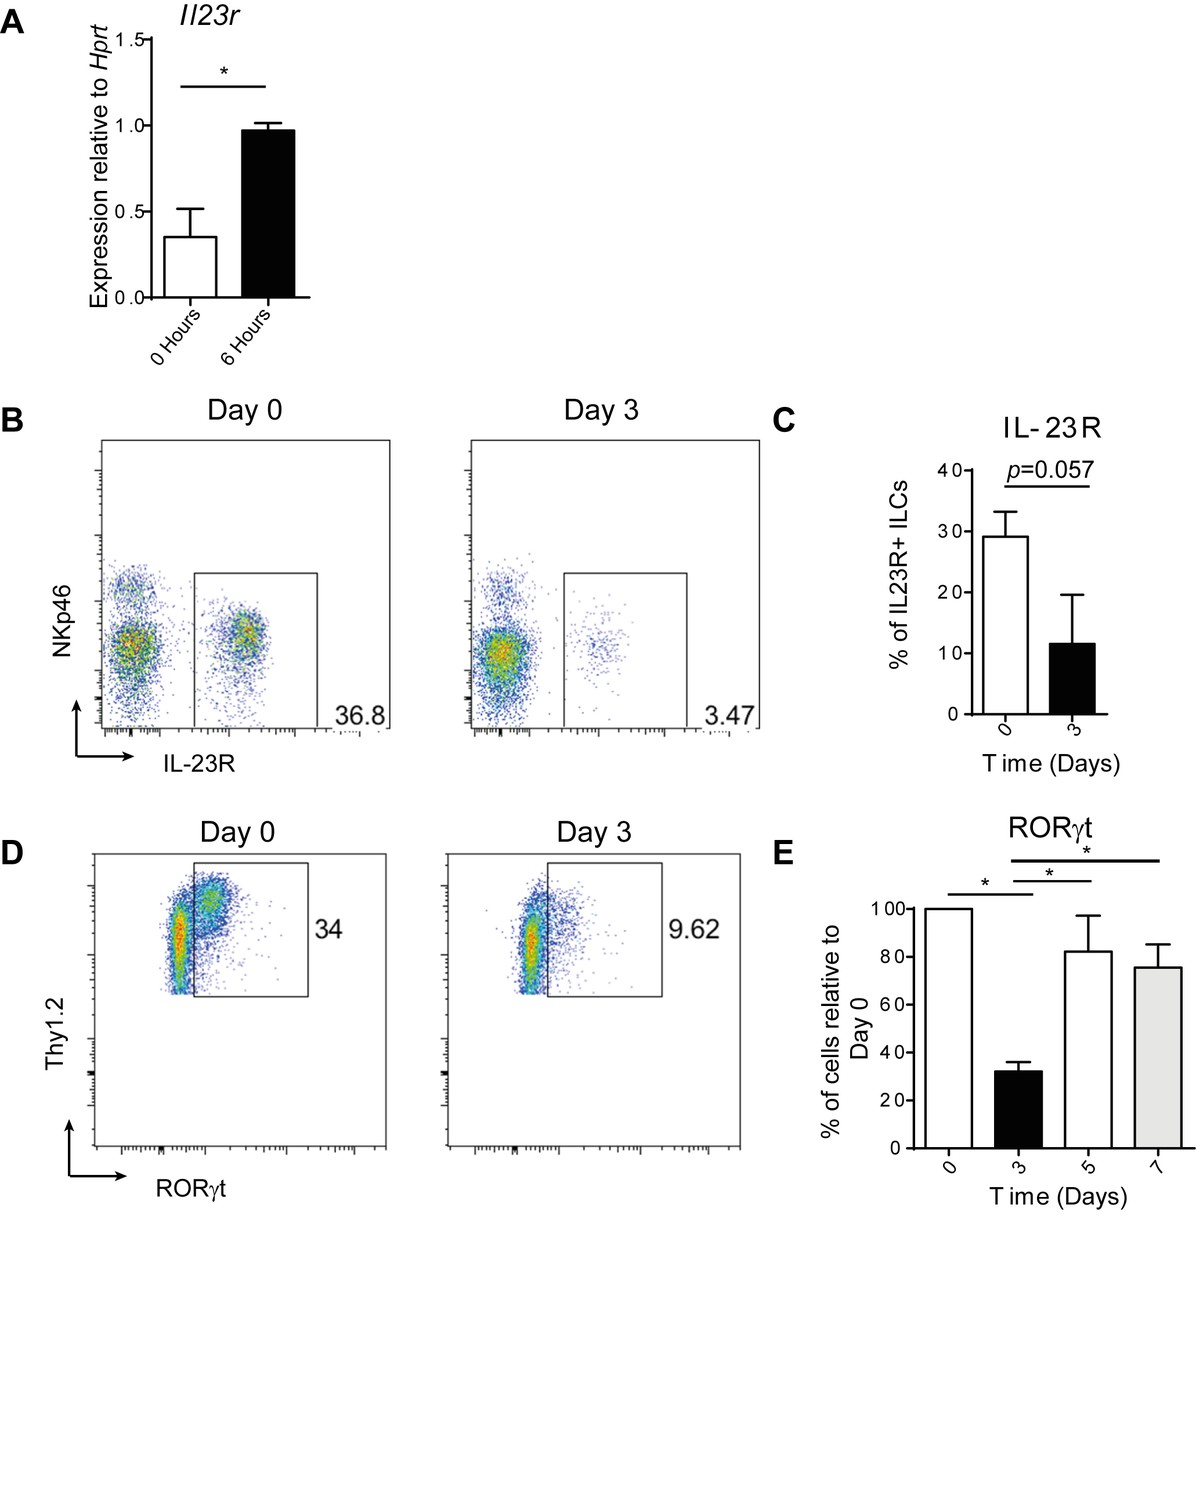
RORγt and IL23R expression are affected by anti-CD40 treatment.
(A) Tissue Il23r expression relative to Hprt (n=6). This is a combination of 2 independent experiments. (B) Representative flow cytometric analysis of IL-23R (using Il23rgfp/+ Rag1-/- mice) on cells gated on live cells, CD45+, IL-7Rα+, and Thy1.2+ 0 and 3 days after anti-CD40 treatment. (C) Quantification of IL-23R+ cells as a percent of single, live, CD45+, IL-7Rα+, Thy1.2+ cells (n=4). This is representative of 2 independent experiments. (D) Representative flow cytometric analysis of RORγt staining in cells gated on live, single, CD45+, IL-7Rα+, and Thy1.2+ 0 and 3 days after anti-CD40 treatment. (E) Quantification of the percent of RORγt+ cells relative to Day 0 (n=8–12). This is a combination of 3 independent experiments.
Figure 5

ILC3s are dynamic and mobilize after anti-CD40 treatment.
(A) Tracks of motile ILCs in the centre (left) and superficial (right) 15 μm of a representative cryptopatch. (B) Track speed average of ILCs combined from 5 independent experiments before and 4-–6 hr after anti-CD40 treatment. Mean steady-state 8.9 μm/min anti-CD40 7.5 mm/min, p=0.01. (C) Displacement vectors of ILCs moving into and out of representative cryptopatches from steady state (left), 4–6 hr anti-CD40 treated mice (middle), and 4–6 hr anti-CD40 treated mice given anti-GM-CSF 24 hr before imaging (right). (D) Quantification of displacement of motile ILCs from control, anti-CD40 treated, and anti-GM-CSF/anti-CD40 treated mice. (E) Ratio of entering to exiting ILCs from control, anti-CD40, and anti-GM-CSF/anti-CD40 treated mice. Motile ILCs are defined as cells with tracks lasting more than 5 min, within 75 µm of a cryptopatch, and displacing more than 14 µm (approximately two cell lengths). *, p<0.05 One-way ANOVA with Tukey’s post test. Data are combined (n=3–5) from at least 3 independent experiments. (F) Representative image of blood vessels (red) and ILCs (green) showing ILCs present adjacent to but outside blood vessels.
Figure 6
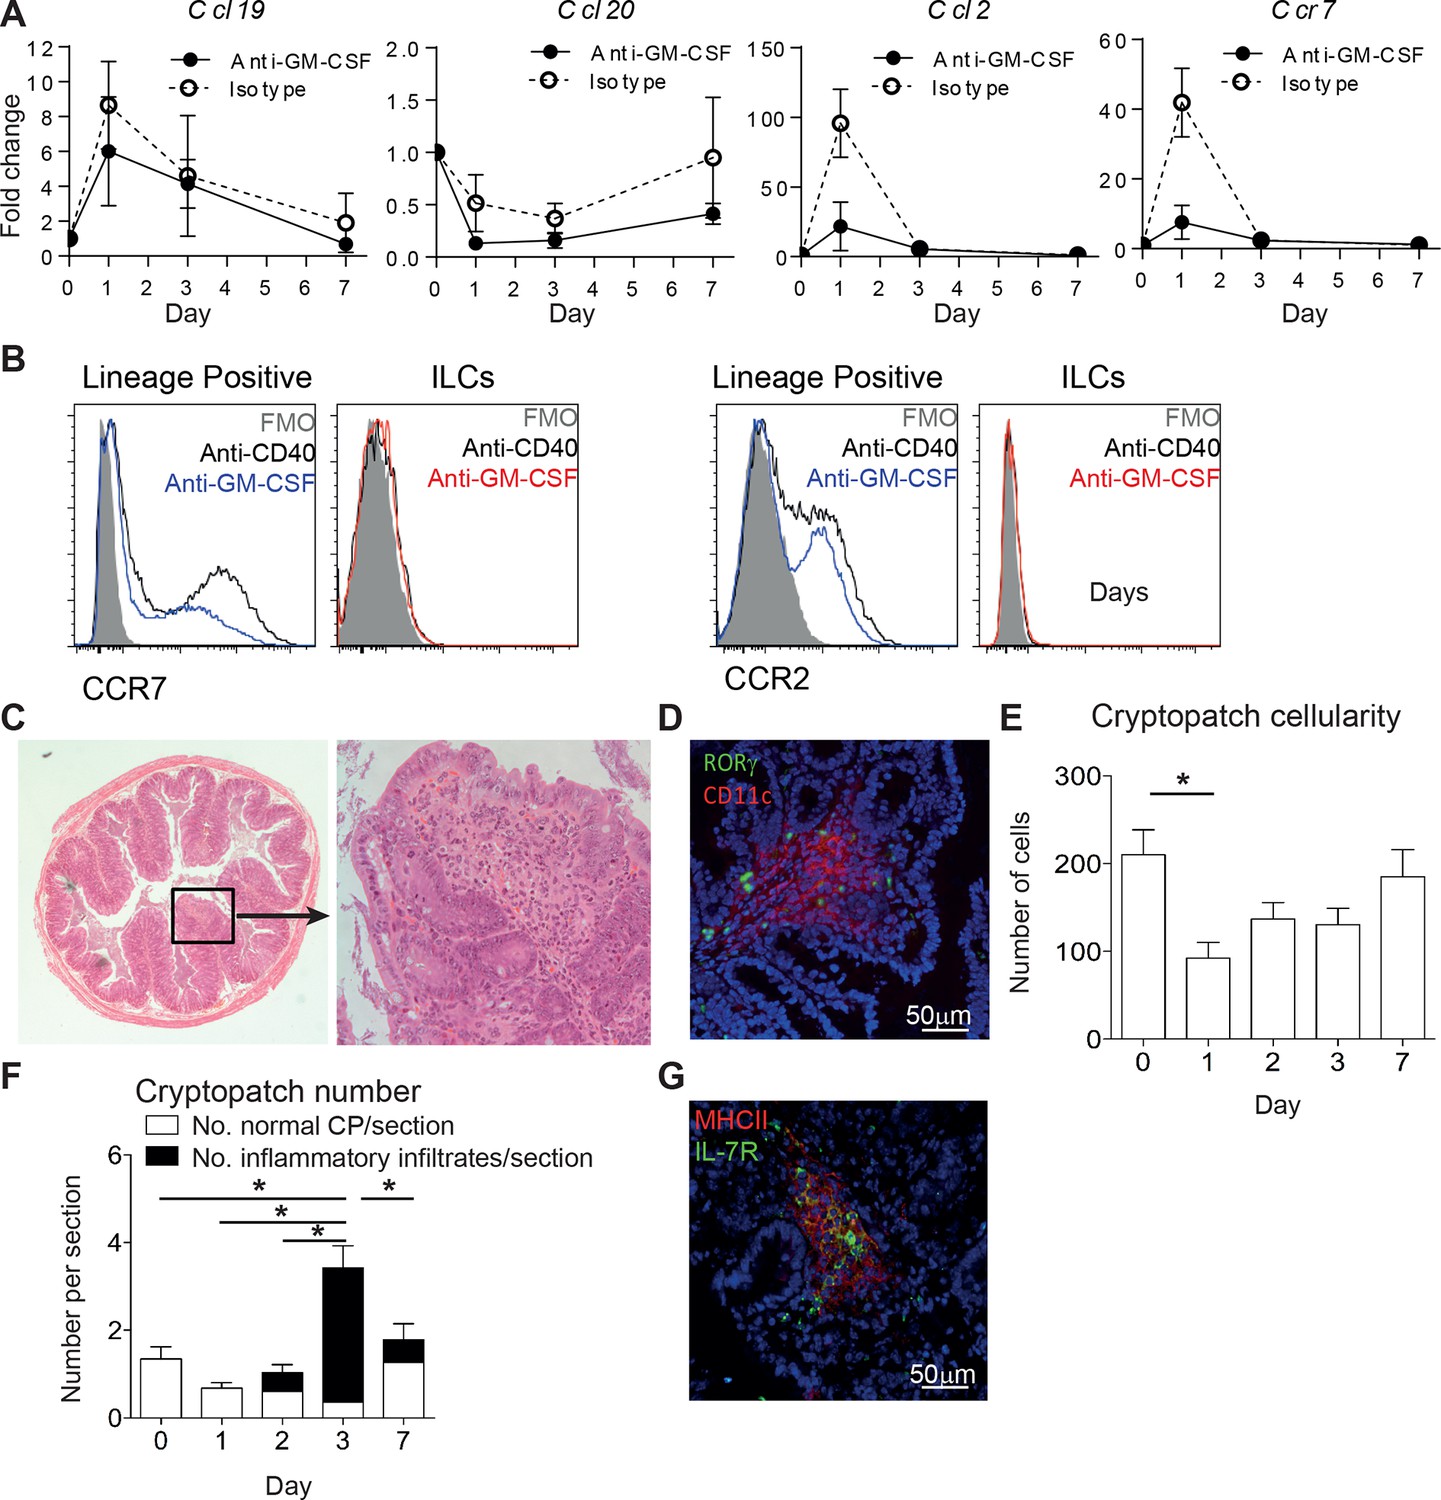
ILC movement precedes tissue reorganization.
(A) mRNA expression of Ccl19, Ccl20, and Ccl2 with the receptor Ccr7 in proximal colonic lamina propria at various time points following anti-CD40 and isotype or anti-GM-CSF injection at days -1, +1, and +3. Results are shown as fold change in target gene relative to hprt compared with day 0 uninjected mice. (B) Representative flow cytometry staining of CCR7 and CCR2 in single live lineage+ cells or ILCs from anti-CD40 or anti-GM-CSF and anti-CD40 treated mice. (C) Representative H&E staining of inflammatory foci (IF) in transverse proximal colon sections in B6Rag1-/- mice at day 7 following anti-CD40 injection at 2.5x and 20x magnification. (D) Representative immunofluorescence of IF in the proximal colon of anti-CD40 treated mice showing CD11c (red), RORγt (green) and DAPI (blue). (E) Number of cells in cryptopatches following anti-CD40 injection as assessed by H&E stained transverse colon sections. (F) Mean number of normal cryptopatches (CP) and areas containing inflammatory infiltrate in H&E stained transverse colon sections. (G) Representative immunofluorescence of a cryptopatch from an anti-GM-CSF and anti-CD40 treated mouse at day 3 showing MHCII (red), IL-7Rα (green), and DAPI (blue). Data are shown as means and SEM. Results are representative of 3–6 independent experiments with n=2–5 mice per experiment. *, p<0.05 One-way ANOVA with Bonferroni’s post test. Data are shown as means and SEM. Results are pooled from 2 independent experiments with n=4–6 mice per group per experiment.
Videos
Video 1
3D rotation of Il23rgfp/+ Rag1-/- ILCs (green) within the collagen matrix of the gut (blue).
https://doi.org/10.7554/eLife.10066.012
Video 2
Timelapse of cells within the cryptopatch show little motility.
https://doi.org/10.7554/eLife.10066.014
Video 3
ILCs within the top 15 μm of the cryptopatch are motile under steady-state conditions.
https://doi.org/10.7554/eLife.10066.015
Video 4
Timelapse of steady-state ILCs showing tracks of motile cells.
https://doi.org/10.7554/eLife.10066.016
Video 5
Timelapse of ILCs 6 hr after anti-CD40 treatment showing tracks of motile cells.
https://doi.org/10.7554/eLife.10066.017
Video 6
Timelapse of ILCs pretreated with anti-GM-CSF 24 hr and anti-CD40 6 hr before imaging.
https://doi.org/10.7554/eLife.10066.018Download links
A two-part list of links to download the article, or parts of the article, in various formats.
Downloads (link to download the article as PDF)
Open citations (links to open the citations from this article in various online reference manager services)
Cite this article (links to download the citations from this article in formats compatible with various reference manager tools)
ILC3 GM-CSF production and mobilisation orchestrate acute intestinal inflammation
eLife 5:e10066.
https://doi.org/10.7554/eLife.10066


