Becker muscular dystrophy mice showed site-specific decay of type IIa fibers with capillary change in skeletal muscle
- Department of Medicine (Neurology and Rheumatology), Shinshu University School of Medicine, Japan
- Intractable Disease Care Center, Shinshu University Hospital, Japan
- Department of Brain Disease Research, Shinshu University School of Medicine, Japan
- Department of Regenerative Science and Medicine, Shinshu University, Japan
- Research Center for Advanced Science and Technology, Shinshu University, Japan
- Department of Clinical Research, NHO Matsumoto Medical Center, Japan
- Third Department of Medicine, Shinshu University School of Medicine, Japan
Figures
Figure 1 with 2 supplements
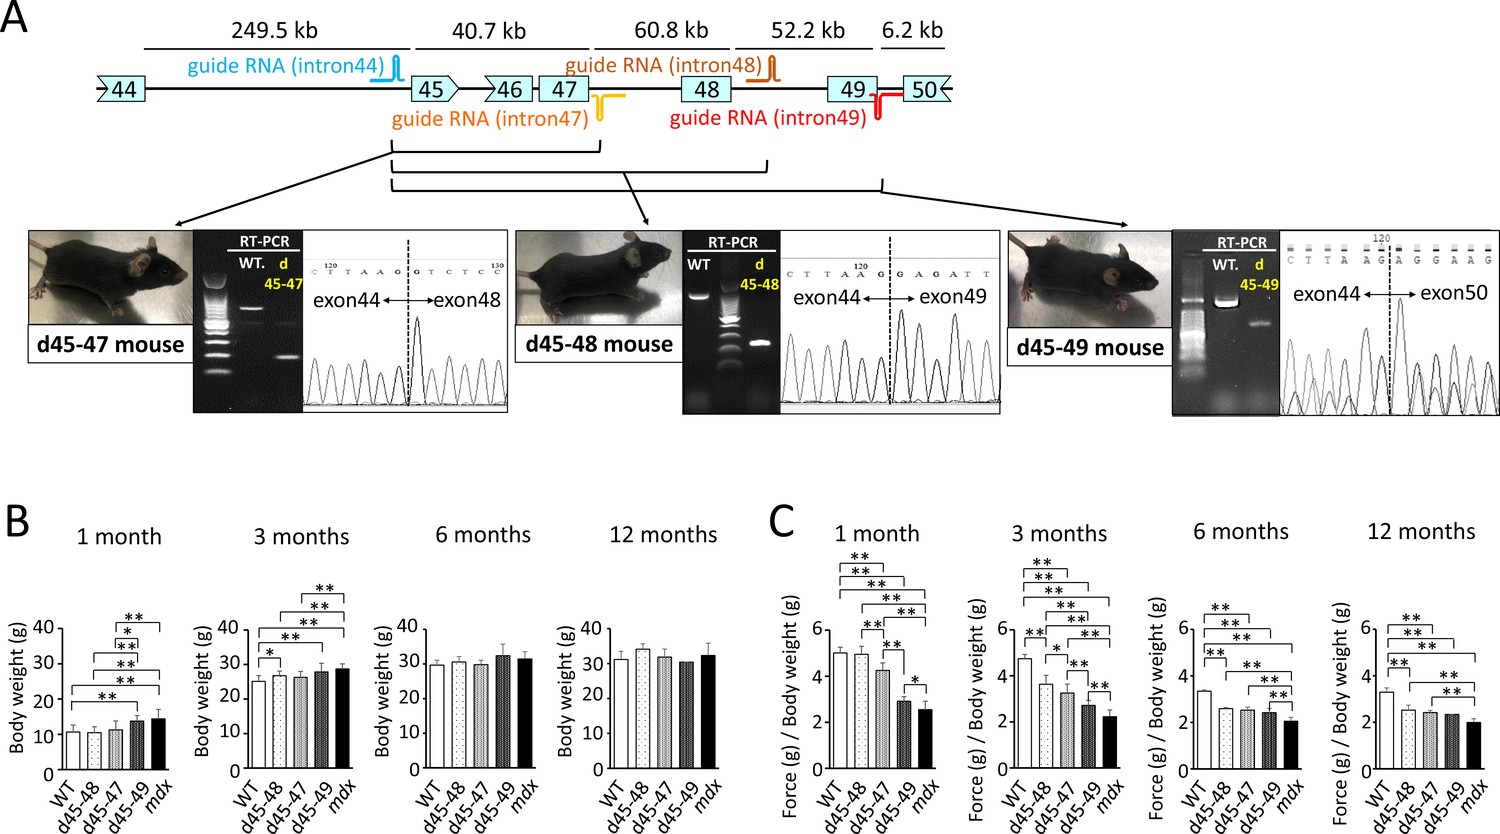
Generation and phenotypic changes in Becker muscular dystrophy (BMD) mice carrying d45–47, d45–48, and d45–49 in-frame mutation in mouse Dmd.
(A) Schematic representation of mouse Dmd from exons 44 to 50, and the location of guide RNAs. We established d45–47, d45–48, and d45–49 BMD mouse models, using guide RNA corresponding to the sequences of introns 44 and 47, introns 44 and 48, and introns 44 and 49, respectively. All BMD mouse models were confirmed having desired mutations by RT-PCR. (B) Body weight (g) in wild-type (WT), d45–48, d45–47, d45–49, and mdx mice, at the ages of 1, 3, 6, and 12 months (n = 10 at 1 and 3 months, n = 4 at 6 and 12 months). (C) Relative (to body weight (g)) forelimb grip strength in WT, d45–48, d45–47, d45–49, and mdx mice, at the ages of 1, 3, 6, and 12 months (n = 10 at 1 and 3 months, n = 4 at 6 and 12 months). Bar: mean ± SD; *p < 0.05, **p < 0.01.
Figure 1—figure supplement 1
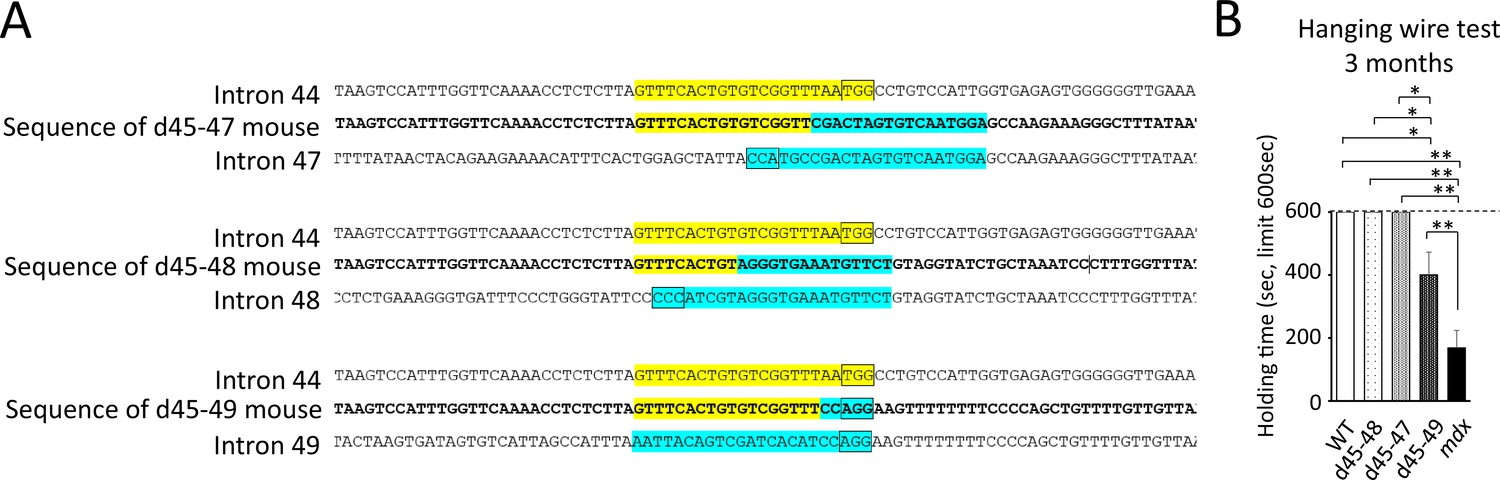
Intronic deletion breakpoint in mouse Dmd, and the result of the hanging wire test of Becker muscular dystrophy (BMD) mice carrying d45-47, d45-48 and d45-49.
(A) The intronic deletion breakpoint of Becker muscular dystrophy (BMD) mouse models having d45–47, d45–48, and d45–49. DNA sequences that is enclosed by a box indicates protospacer adjacent motif (PAM), and that is marked yellow of blue label corresponds guide RNA. (B) The holding time of hanging wire test (s, maximum limitation = 600 s) in wild-type (WT), d45–48, d45–47, d45–49, and mdx mice (n = 3), at the age of 3 months. Bar: mean ± SE; *p < 0.05, **p < 0.01.
Figure 1—video 1
The movie of the results of hanging wire test in wild-type (WT), d45–48, d45–47, d45–49, and mdx mice, at the age of 3 months.
WT, d45–48, and d45–47 mice could bring posterior legs quickly up toward their face and catch the wire. In contrast, d45–49 and mdx mice could not bring their posterior legs up above the chest.
Figure 2 with 1 supplement
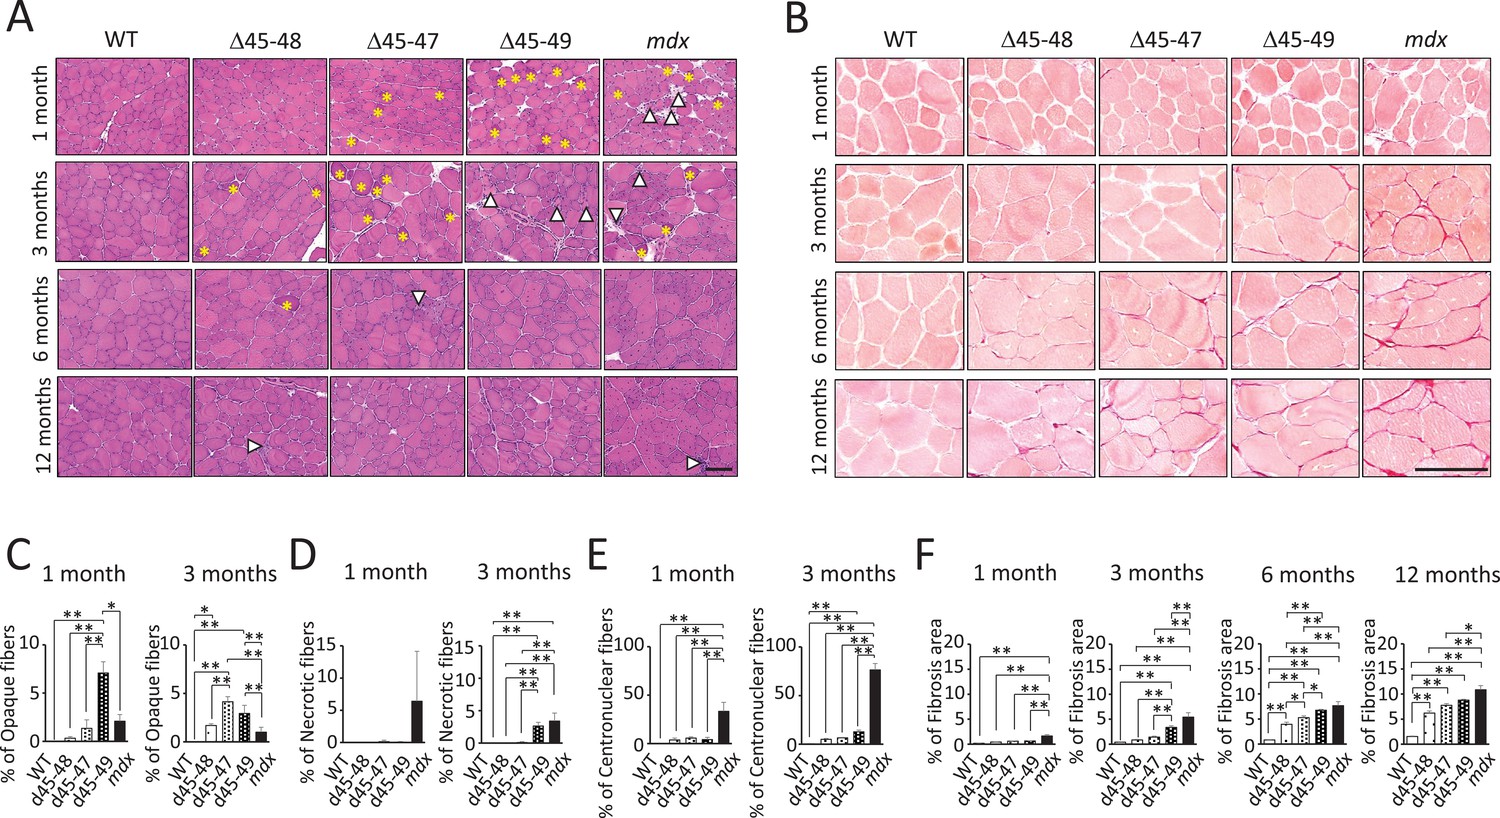
Histopathological changes in Becker muscular dystrophy (BMD) mice carrying d45–47, d45–48, and d45–49.
(A) Hematoxylin–eosin stain of tibialis anterior (TA) muscles in wild-type (WT), d45–48, d45–47, d45–49, and mdx mice, at the ages of 1, 3, 6, and 12 months. Yellow asterisk: mean opaque-fibers. Arrow head: mean necrotic fibers. (B) Sirius Red stain of TA in WT, d45–48, d45–47, d45–49, and mdx mice, at the ages of 1, 3, 6, and 12 months. (C) Percent opaque fibers at TA in WT, d45–48, d45–47, d45–49, and mdx mice, at the ages of 1 and 3 months (n = 3). (D) Percent necrotic fibers at TA in WT, d45–48, d45–47, d45–49, and mdx mice, at the ages of 1 and 3 months (n = 3). (E) Percent centronuclear fibers at TA in WT, d45–48, d45–47, d45–49, and mdx mice, at the ages of 1 and 3 months (n = 3). (F) Percent fibrosis area at TA in WT, d45–48, d45–47, d45–49, and mdx mice, at the ages of 1, 3, 6, and 12 months (n = 3). Bar: mean ± SD; *p < 0.05, **p < 0.01. Scale bar means 100 µm.
Figure 2—figure supplement 1
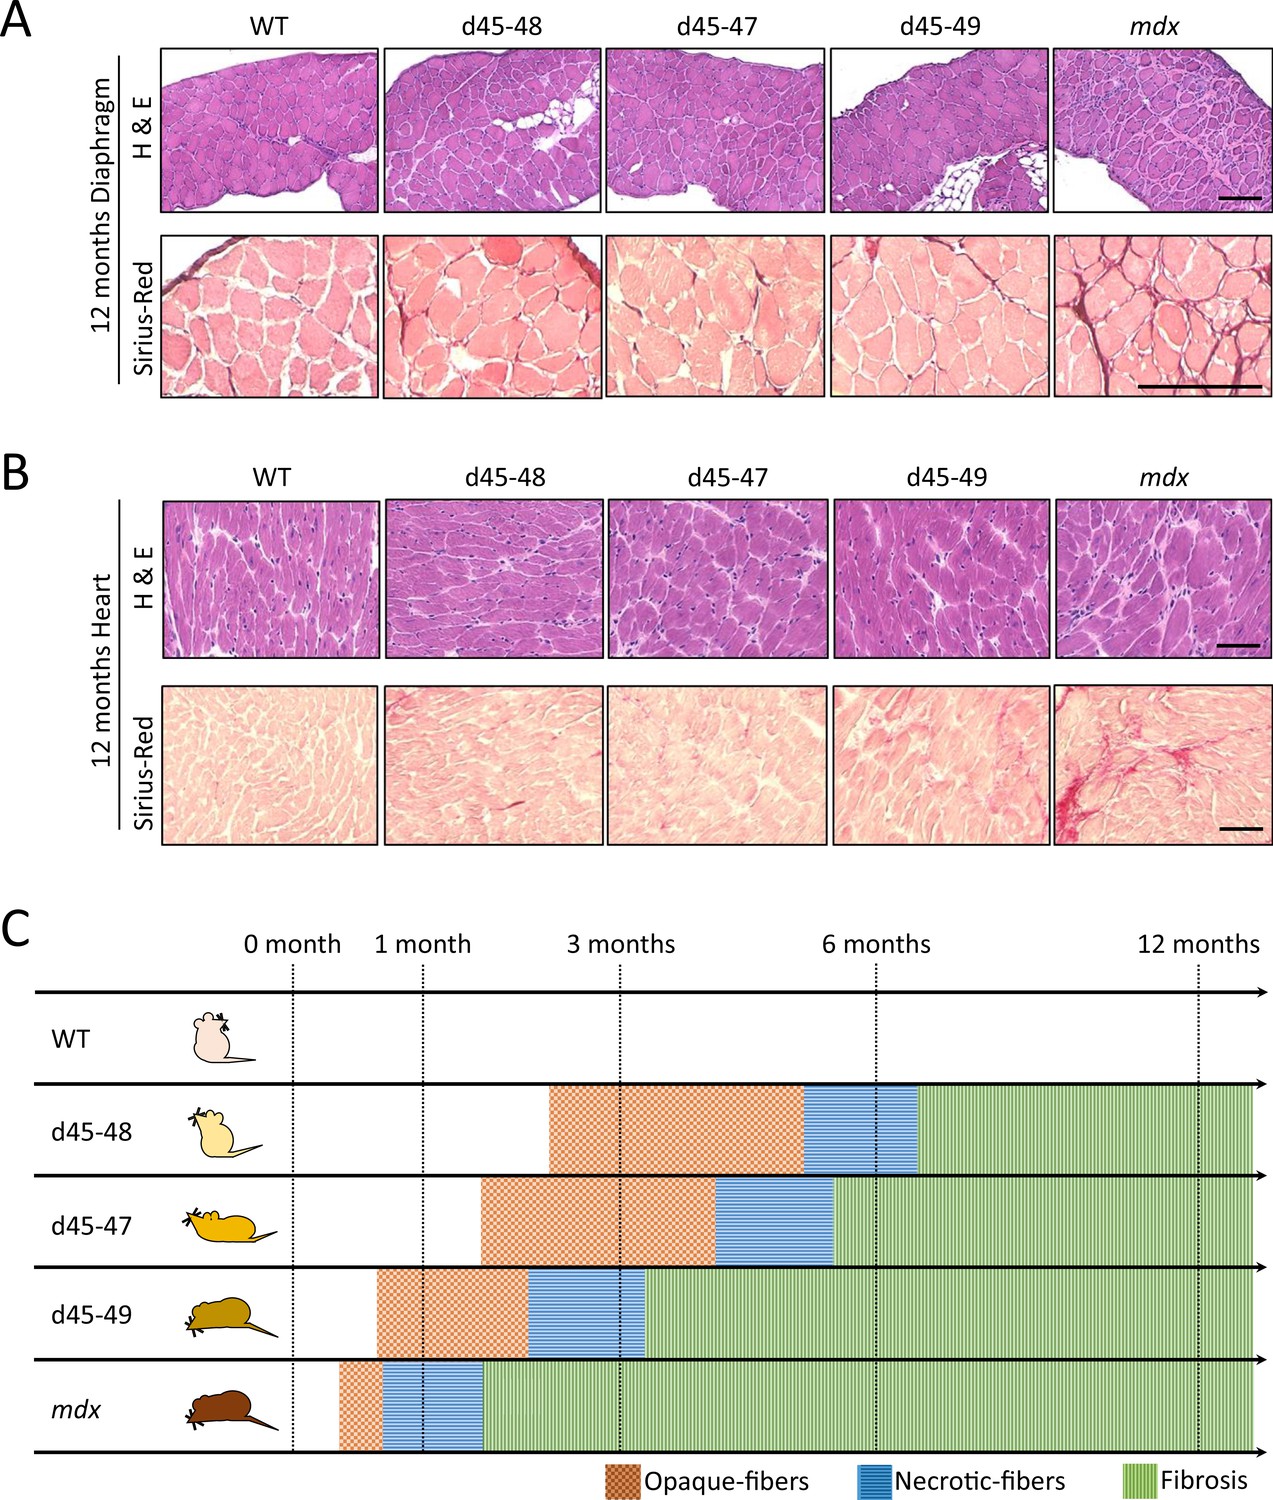
Histopathological changes of diaphragm and cardiac muscles, and the time-coursed histopathological changes of the skeletal muscle in Becker muscular dystrophy (BMD) mice carrying d45-47, d45-48 and d45-49.
(A) Hematoxylin–eosin and Sirius Red stain of diaphragm muscles in wild-type (WT), d45–48, d45–47, d45–49, and mdx mice, at the age of 12 months. Scale bar means 100 µm. (B) Hematoxylin–eosin and Sirius Red stain of cardiac muscles in WT, d45–48, d45–47, d45–49, and mdx mice, at the age of 12 months. Scale bar means 100 µm. (C) Schematic representation of time-coursed histopathological changes about muscle degeneration and fibrosis in WT, d45–48, d45–47, d45–49, and mdx mice. d45–49 and mdx mice showed muscle degeneration at an earlier age compared with d45–48 and d45–47 mice.
Figure 3 with 1 supplement

All Becker muscular dystrophy (BMD) mice showed truncated dystrophin expression and decreased sarcolemmal neuronal nitric oxide synthetase (nNOS) expression.
(A) Dystrophin, nNOS, and alpha-sarcoglycan immunohistochemistry of tibialis anterior (TA) in wild-type (WT), d45–48, d45–47, d45–49, and mdx mice, at the age of 1 and 3 months. (B) Western blot analysis for dystrophin in WT, d45–48, d45–47, d45–49, and mdx mice, at the ages of 1 and 3 months. (C) Western blot analysis for dystrophin-homolog utrophin in WT, d45–48, d45–47, d45–49, and mdx mice, at the ages of 1 and 3 months. (D) Western blot analysis for nNOS in WT, d45–48, d45–47, d45–49, and mdx mice, at the ages of 1 and 3 months. (E) Relative Dp427 protein levels (normalized by total protein band intensity) in WT, d45–48, d45–47, d45–49, and mdx mice (n = 3). (F) Relative Up395 protein levels (normalized by total protein band intensity) in WT, d45–48, d45–47, d45–49, and mdx mice (n = 3). (G) Relative nNOS protein levels (normalized by total protein band intensity) in WT, d45–48, d45–47, d45–49, and mdx mice (n = 3). Bar: mean ± SD; *p < 0.05, **p < 0.01. Scale bar means 100 µm.
Figure 3—figure supplement 1
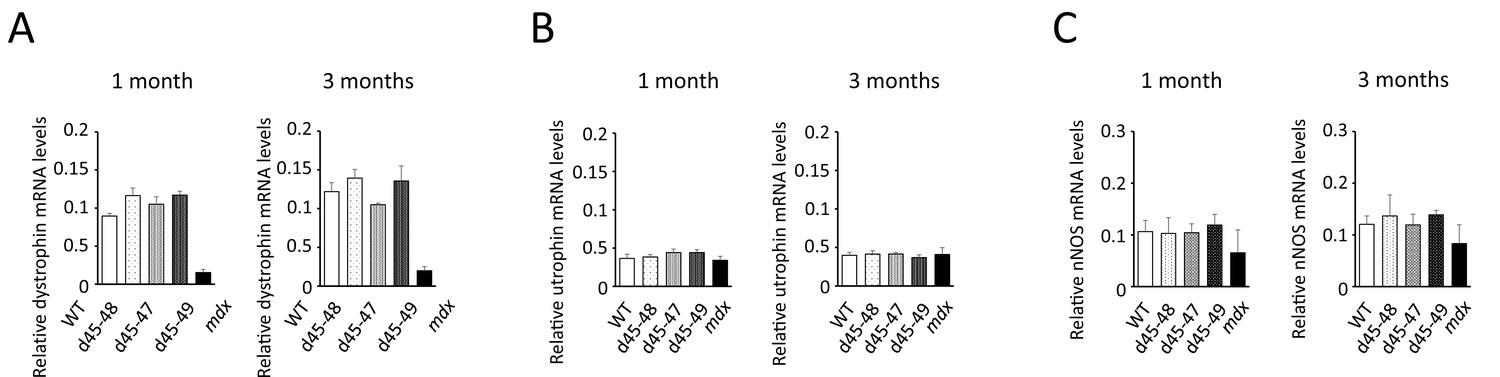
mRNA levels of dystrophin, utrophin and neuronal nitric oxide synthetase (nNOS) in Becker muscular dystrophy (BMD) mice.
(A) Relative mRNA levels of dystrophin exons 75–77 (normalized by 18S rRNA levels) in wild-type (WT), d45–48, d45–47, d45–49, and mdx mice (n = 3). (B) Relative mRNA levels of utrophin exons 70–72 (normalized by 18S rRNA levels) in WT, d45–48, d45–47, d45–49, and mdx mice (n = 3). (C) Relative mRNA levels of nNOS (normalized by 18S rRNA levels) in WT, d45–48, d45–47, d45–49, and mdx mice (n = 3). Bar: mean ± SD.
Figure 4 with 1 supplement
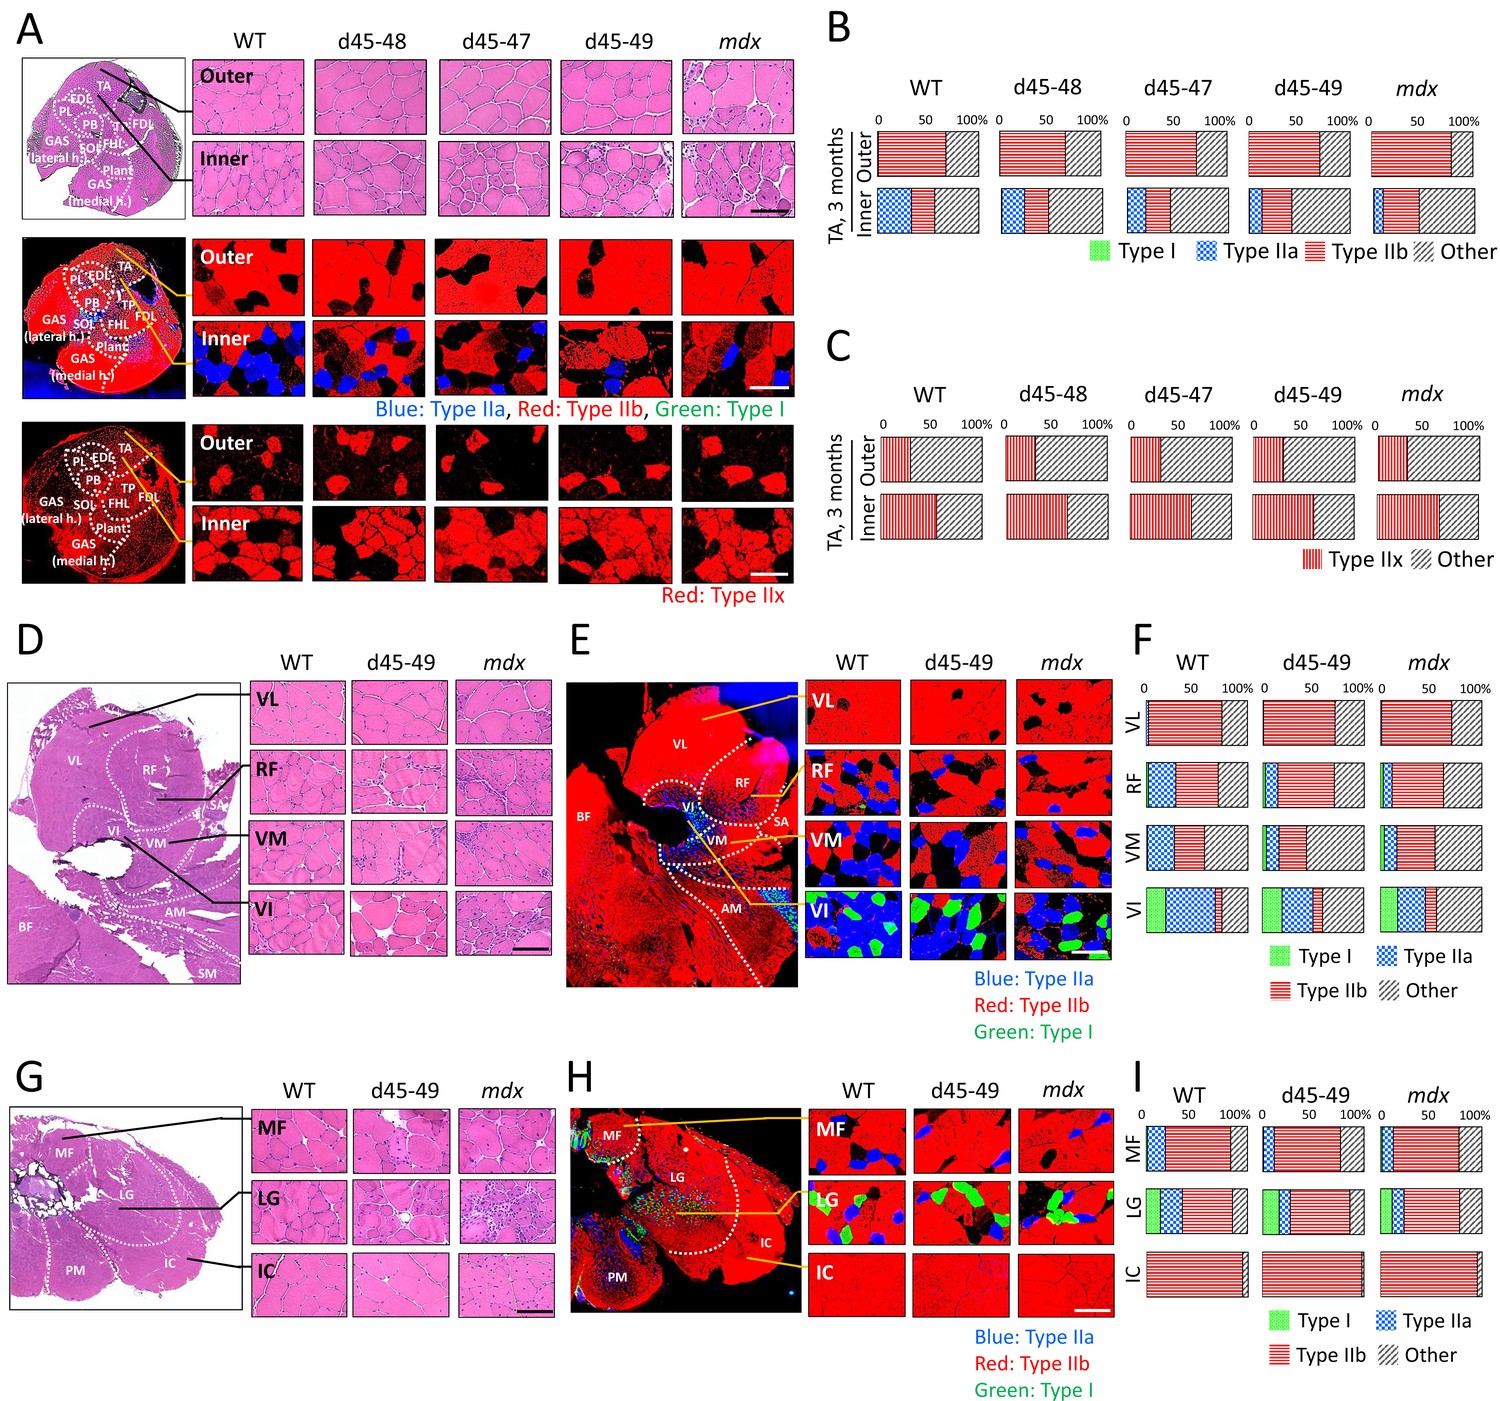
All Becker muscular dystrophy (BMD) mice showed site-specific muscle degeneration especially in inner part of tibialis anterior (TA) with type IIa fiber reduction.
(A) Hematoxylin–eosin stain (upper panels), MYH-2, -4, and -7 immunohistochemistry (middle panels: type IIa, IIb, and I fibers, respectively) and MYH-1 immunohistochemistry (lower panels: type IIx fibers) at outer or inner part of TA in wild-type (WT), d45–48, d45–47, d45–49, and mdx mice, at the age of 3 months. (B) The proportion of muscle fiber types at outer or inner part of TA about type I, IIa, IIb, and others, in WT, d45–48, d45–47, d45–49, and mdx mice, at the age of 3 months (n = 3). (C) The proportion of muscle fiber types at outer or inner part of TA about type IIx and others, in WT, d45–48, d45–47, d45–49, and mdx mice, at the age of 3 months (n = 3). (D) Hematoxylin–eosin stain at four component muscles of quadriceps muscle: vastus lateralis (VL), rectus femoris (RF), vastus medialis (VM), and vastus intermedius (VI), in WT, d45–49, and mdx mice, at the age of 3 months. (E) MYH-2, -4, and -7 immunohistochemistry (type IIa, IIb, and I fibers [blue, red, and green, respectively]) at VL, RF, VM, and VI in WT, d45–49, and mdx mice, at the age of 3 months. (F) The proportion of muscle fiber types at VL, RF, VM, and VI in WT, d45–49, and mdx mice, at the age of 3 months (average of n = 3). (G) Hematoxylin–eosin stain at three component muscles of erector spinae muscle: multifidus (MF), longissimus (LG), and iliocostalis (IC), in WT, d45–49, and mdx, at the age of 3 months. (H) MYH-2, -4, and -7 immunohistochemistry immunohistochemistry (type IIa, IIb, and I fibers [blue, red, and green, respectively]) at MF, LG, and IC in WT, d45–49, and mdx mice, at the age of 3 months. (I) The proportion of muscle fiber types at MF, LG, and IC in WT, d45–49, and mdx mice, at the age of 3 months (average of n = 3). Scale bar means 100 µm.
Figure 4—figure supplement 1
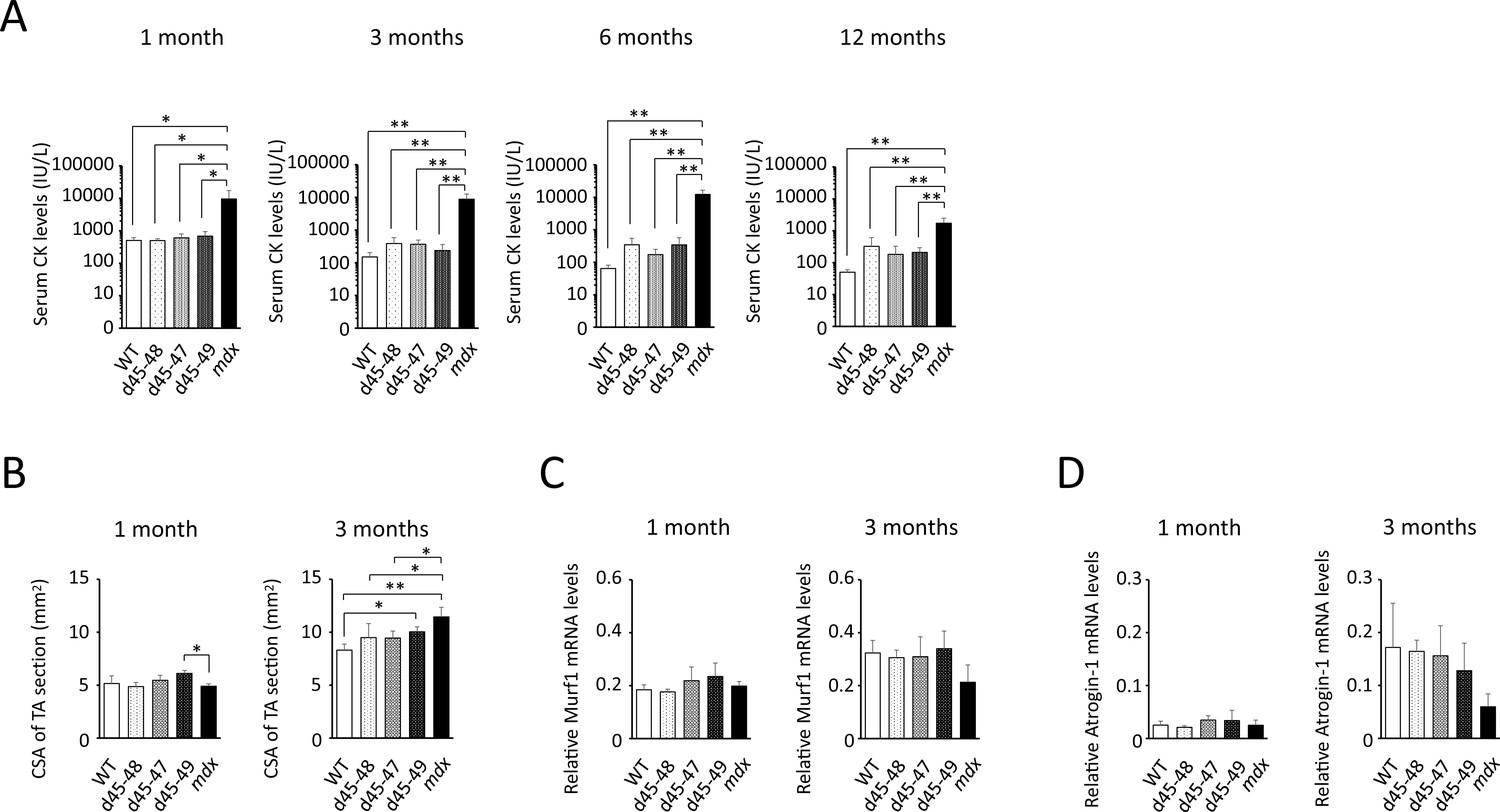
Serum CK levels, cross-sectional area (CSA) of TA muscles and mRNA levels of muscle atrophy-related genes in Becker muscular dystrophy (BMD) mice.
(A) Serum creatine kinase (CK) levels (IU/l) in wild-type (WT), d45–48, d45–47, d45–49, and mdx mice (n = 3), at the ages of 1, 3, 6, and 12 months. Bar: mean ± SE; *p < 0.05, **p < 0.01. (B) CSA (mm2) at the middle section of tibialis anterior (TA) muscles in WT, d45–48, d45–47, d45–49, and mdx mice (n = 3). (C) Relative mRNA levels of muscle ring finger protein-1 (Murf1) (normalized by 18S rRNA levels) in WT, d45–48, d45–47, d45–49, and mdx mice (n = 3). (D) Relative mRNA levels of atrogin-1 (normalized by 18S rRNA levels) in WT, d45–48, d45–47, d45–49, and mdx mice (n = 3). Bar: mean ± SD; *p < 0.05, **p < 0.01.
Figure 5 with 1 supplement
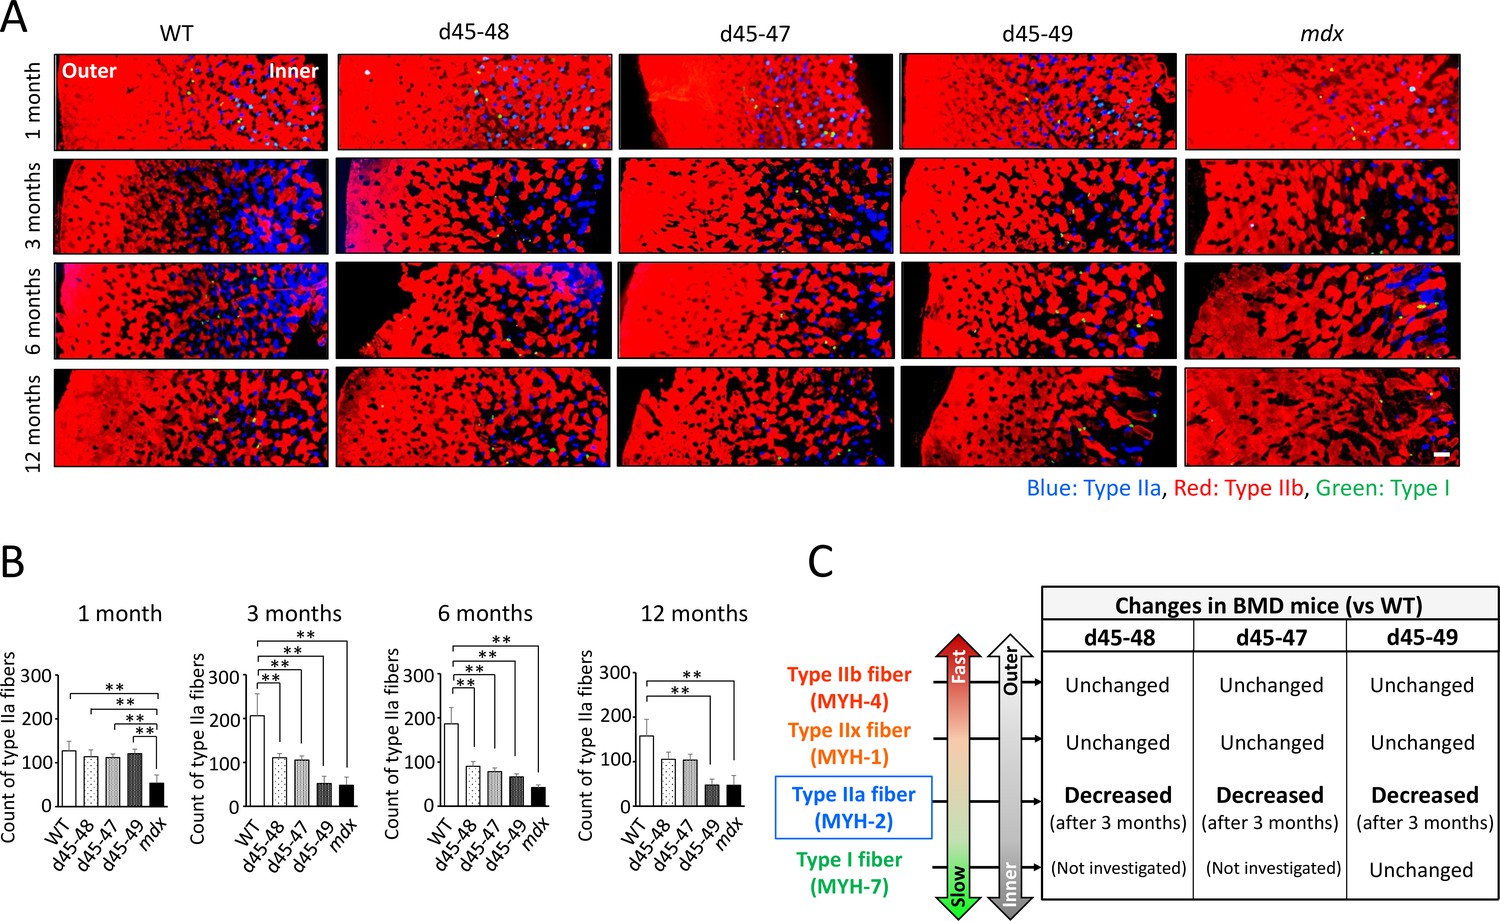
Type IIa fiber decrement started from the age of 3 months in Becker muscular dystrophy (BMD) mice.
(A) MYH-2, -4, and -7 immunohistochemistry (type IIa, IIb, and I fibers, respectively) at tibialis anterior (TA) under low magnification in wild-type (WT), d45–48, d45–47, d45–49, and mdx mice, at the age of 1, 3, 6, and 12 months. (B) The count of type IIa fibers involved in one TA section (at the middle part of TA) in WT, d45–48, d45–47, d45–49, and mdx mice, at the ages of 1, 3, 6, and 12 months (n = 3). (C) Schematic representation about the character of type I, IIa, IIx, and IIb fibers and its proportional changes in BMD mice compared with WT mice. Bar: mean ± SD; **p < 0.01. Scale bar means 100 µm.
Figure 5—figure supplement 1

A shift of the muscle fiber type composition in a cardiotoxin (CTX) induced muscle regeneration.
Hematoxylin–eosin stain (left panels), MYH-2, -4, and -7 (type IIa, IIb, and I fibers, respectively) immunohistochemistry (middle panels), and MYH-1 (type IIx fibers) immunohistochemistry (right panels) of 6 weeks tibialis anterior (TA) in wild-type (WT) mice at 1, 3, 5, 7, 14 and 28 days after CTX injection. The muscle fiber recovering in type IIb, IIa, and IIx fibers were shown at days 5, 14, and 28, respectively. Scale bar means 100 µm.
Figure 6
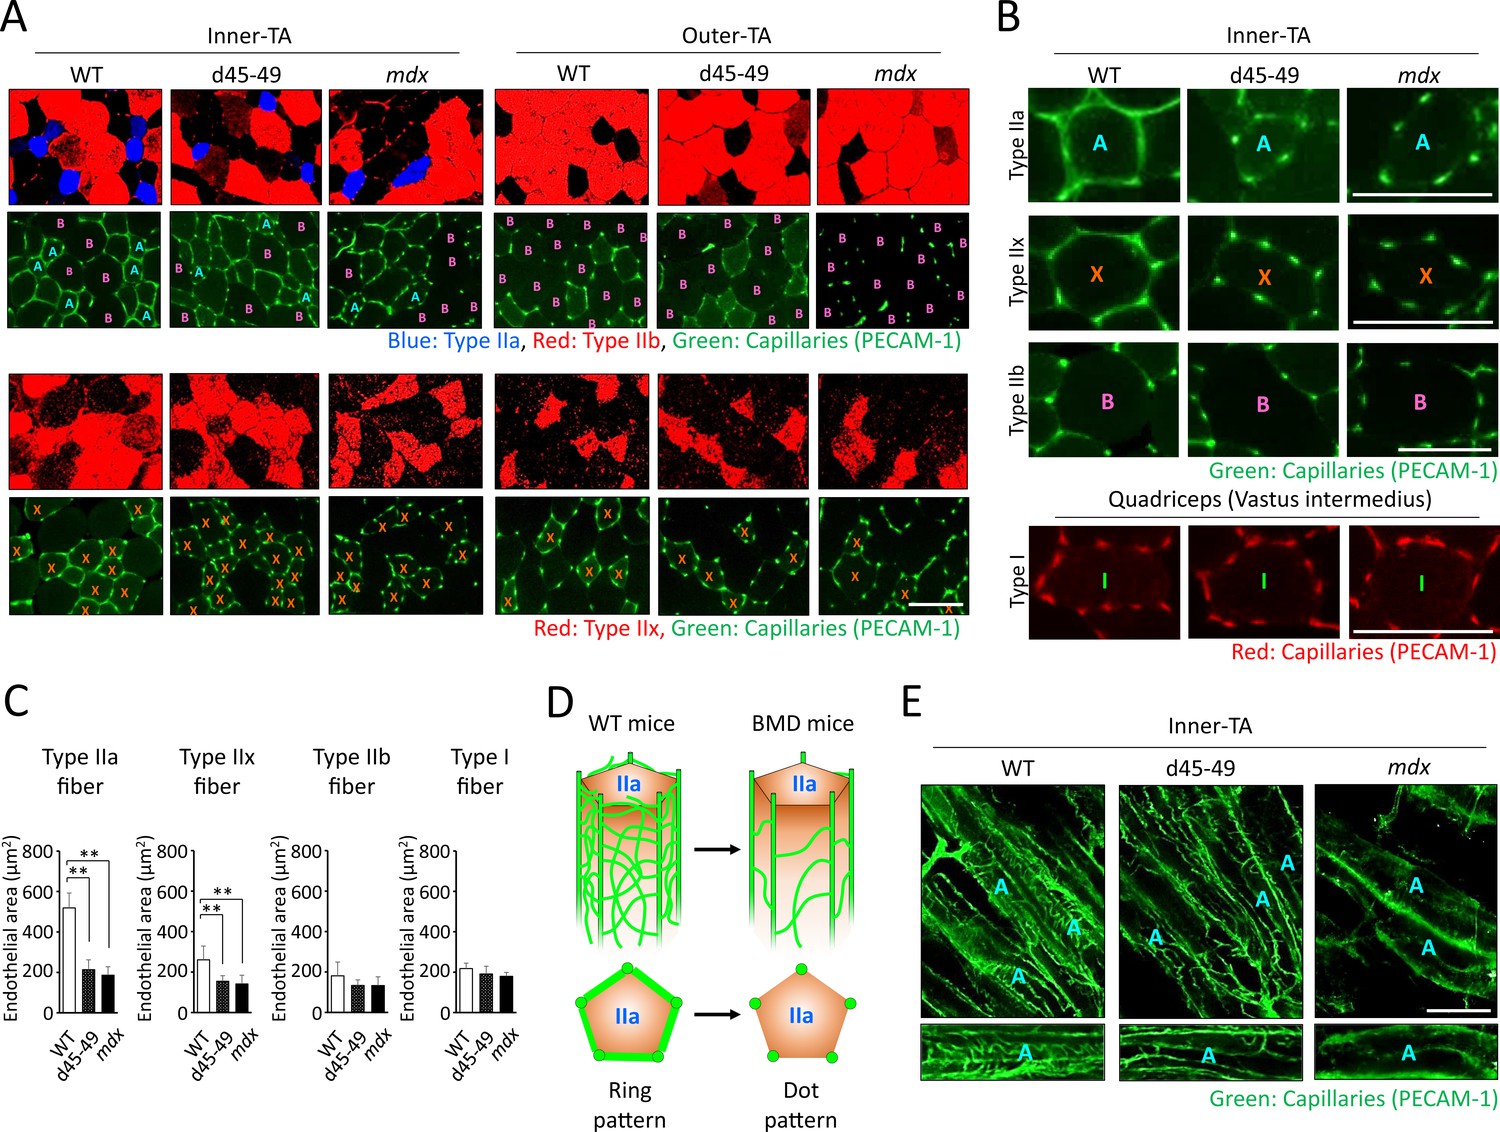
Capillaries contacting type IIa fiber were decreased and altered in morphology in Becker muscular dystrophy (BMD) mice.
(A) MYH-2, -4, -7, and PECAM-1 immunohistochemistry (upper panels: type IIa, IIb fibers and capillaries, respectively) and MYH-1 and PECAM-1 immunohistochemistry (lower panels: type IIx and capillaries, respectively) at the inner and the outer part of tibialis anterior (TA) in wild-type (WT), d45–49, and mdx mice, at the age of 3 months. <A>: mean type IIa fibers, <B>: mean type IIb fibers, <X>: mean type IIx fibers. (B) High-magnification images of PECAM-1 immunohistochemistry (capillaries) around type IIa, IIx, and IIb fibers at the inner part of TA, and around type I fibers at vastus intermedius in WT, d45–49, and mdx mice, at the age of 3 months. <A>: mean type IIa fibers, <B>: mean type IIb fibers, <X>: mean type IIx fibers, <I>: mean type I fibers. (C) The Endothelial area (µm2) of capillaries contacting one type IIa, IIx, IIb, and I fiber at the inner part of TA in WT, d45–49, and mdx mice, at the ages of 3 months (n = 3). (D) Schematic representation of an expected mechanisms of morphological changes in capillaries contacting to type IIa fibers from ‘ring-pattern’ to ‘dot-pattern’ in BMD mice. (E) PECAM-1 immunohistochemistry (capillaries) of the longitudinal sections at the inner part of TA in WT, d45–49, and mdx mice, at the age of 3 months (upper panels), and the interconnected branches and capillary loops around a representative type IIa fiber (lower panels). <A>: mean type IIa fibers. Bar: mean ± SD; *p < 0.05, **p < 0.01. Scale bar means 100 µm.
Additional files
-
Supplementary file 1
The list of primer sequences used for RT-PCR in this study.
- https://cdn.elifesciences.org/articles/100665/elife-100665-supp1-v1.docx
Download links
A two-part list of links to download the article, or parts of the article, in various formats.
Downloads (link to download the article as PDF)
Open citations (links to open the citations from this article in various online reference manager services)
Cite this article (links to download the citations from this article in formats compatible with various reference manager tools)
Becker muscular dystrophy mice showed site-specific decay of type IIa fibers with capillary change in skeletal muscle
eLife 13:RP100665.
https://doi.org/10.7554/eLife.100665.3


