POMC neurons control fertility through differential signaling of MC4R in kisspeptin neurons
- Harvard Medical School, United States
- Division of Endocrinology, Diabetes and Hypertension, Department of Medicine, Brigham and Women’s Hospital, United States
- Department of Chemical Physiology and Biochemistry, Oregon Health & Science University, United States
- Division of Neuroscience, Oregon National Primate Research Center, United States
- Harvard Program in Neuroscience, United States
Figures
Figure 1 with 1 supplement
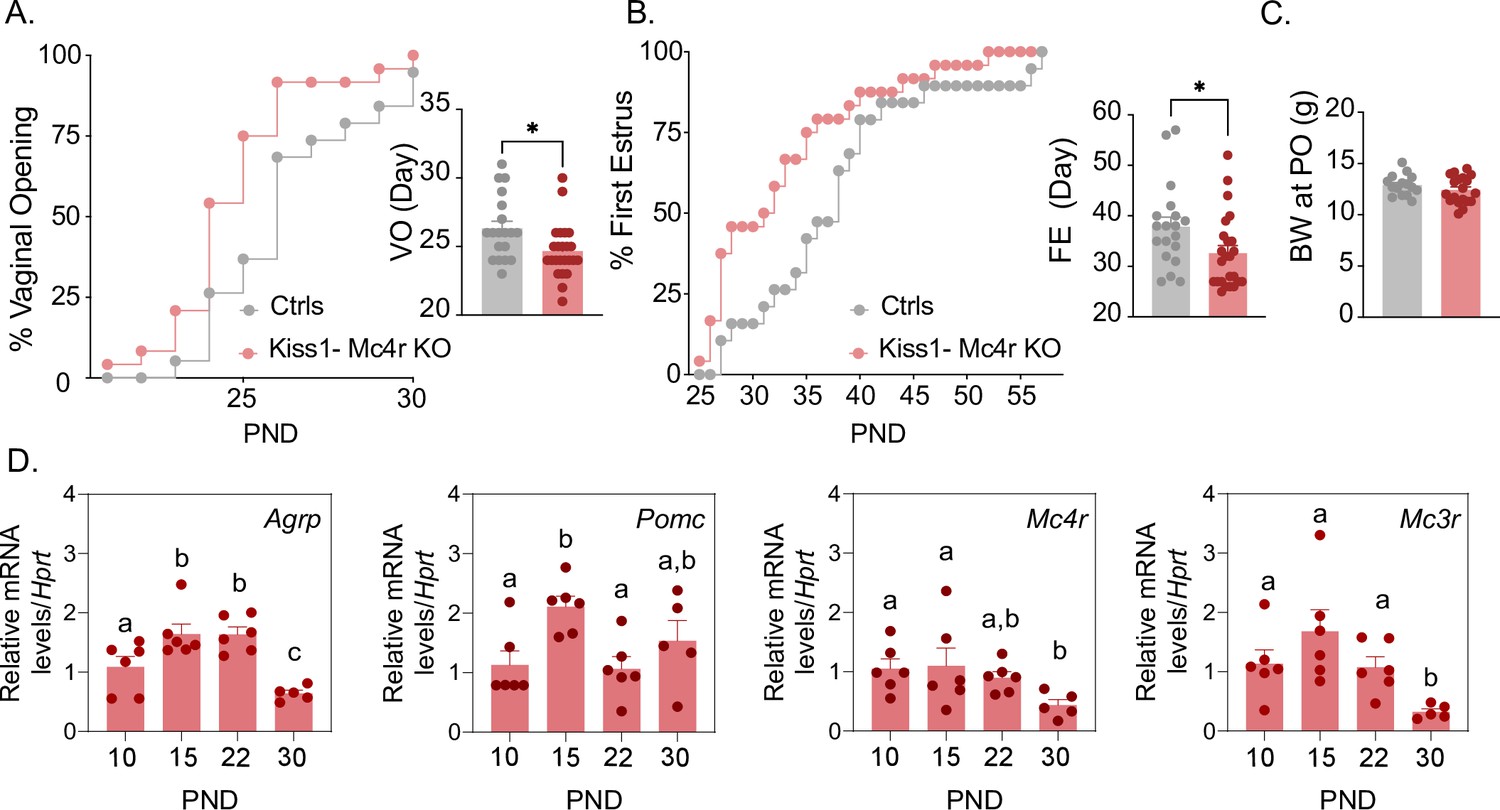
Mc4r expressed in Kiss1 neurons determines the timing of puberty onset.
Kiss1- Mc4r KO females display advanced puberty onset, assessed by daily monitoring of vaginal opening (A) and first estrus (B), as documented by cumulative percent and mean age of animals at vaginal opening (A) and first estrus (B) in Kiss1- Mc4r KO females (n = 24) compared to WT littermates (n = 19). *p < 0.05 by Student’s t-test. Data presented as the mean ± SEM. (C) Female Kiss1- Mc4r KO (n = 19) have normal body weight at the time of puberty onset compared to their WT littermates (n = 15). (D) Ontogeny expression of melanocortin genes (Agrp, Pomc, Mc4r, and Mc3r) in the ARH of WT female mice at different postnatal pre-pubertal and pubertal ages: P10, P15, P22, and P30, normalized to the housekeeping gene Hprt (n values: females at P10 (n = 6), P15 (n = 6), P22 (n = 6), and P30 (n = 5)). Groups with different letters are significantly different, as determined by one-way ANOVA followed by Fisher’s LSD test. Data presented as the mean ± SEM.
Figure 1—figure supplement 1
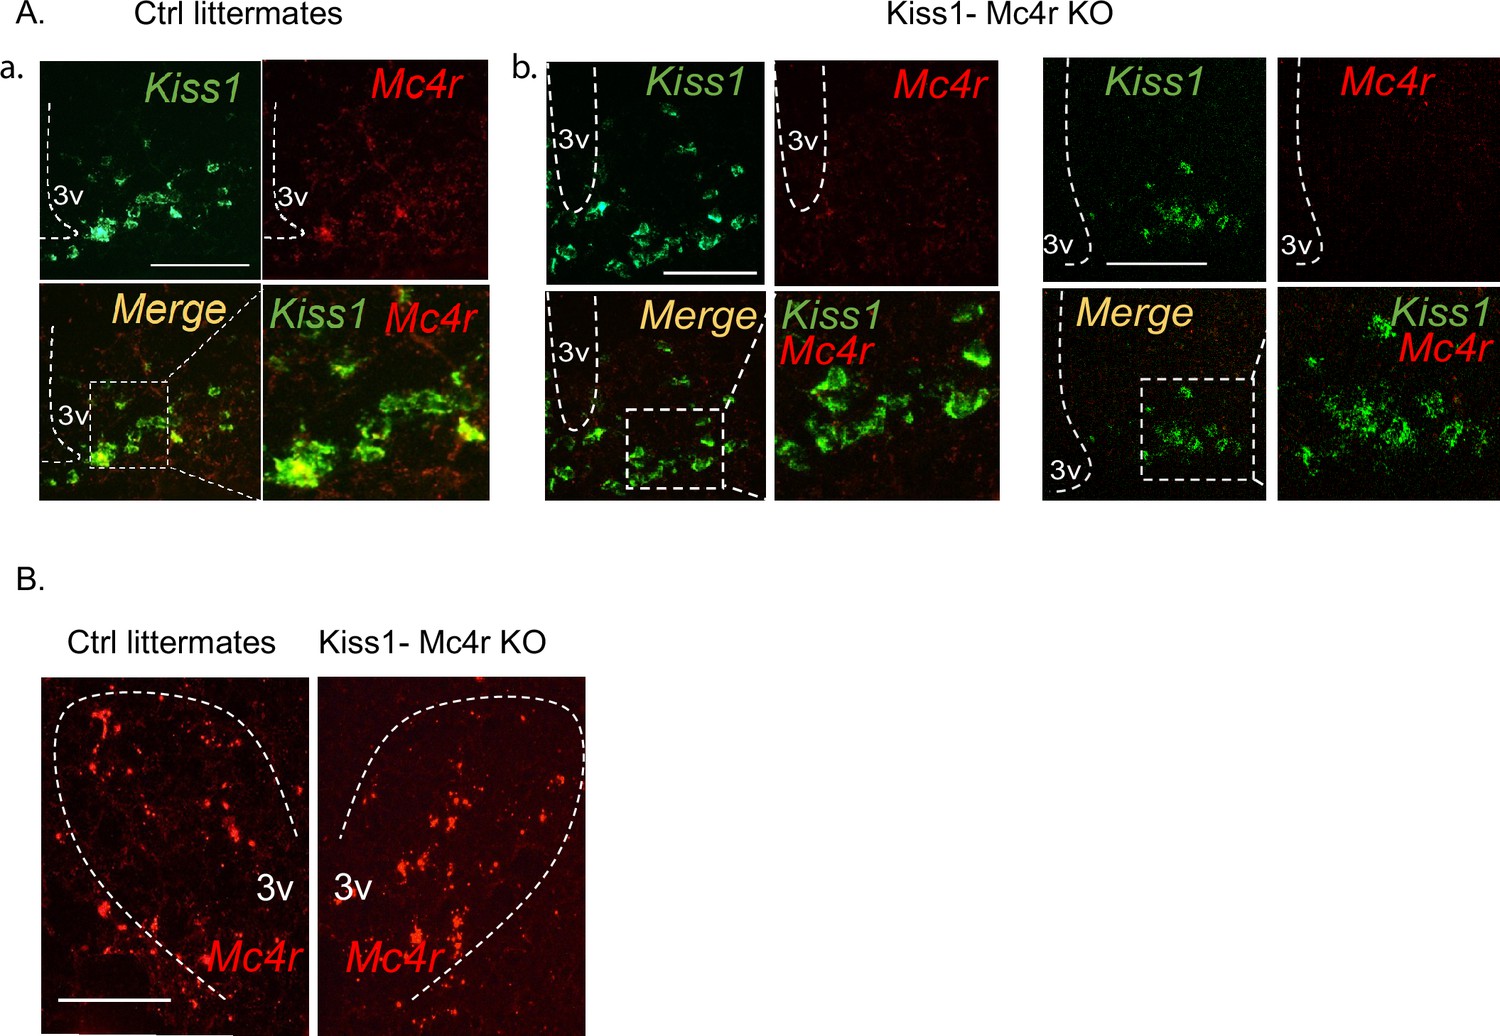
Validation of the Kiss1- Mc4r KO mouse model.
(A) Representative images depicting co-expression of Kiss1 and Mc4r mRNA, using RNAscope, in ovariectomy (OVX) WT female mice (a), and OVX Kiss1- Mc4r KO female mice in the ARH (b). As expected, Mc4r was not detected within Kiss1 neurons in Kiss1- Mc4r KO females. (B) Representative images depicting comparable Mc4r mRNA expression in the paraventricular hypothalamus between OVX WT and Kiss1- Mc4r KO females.
Figure 2 with 1 supplement
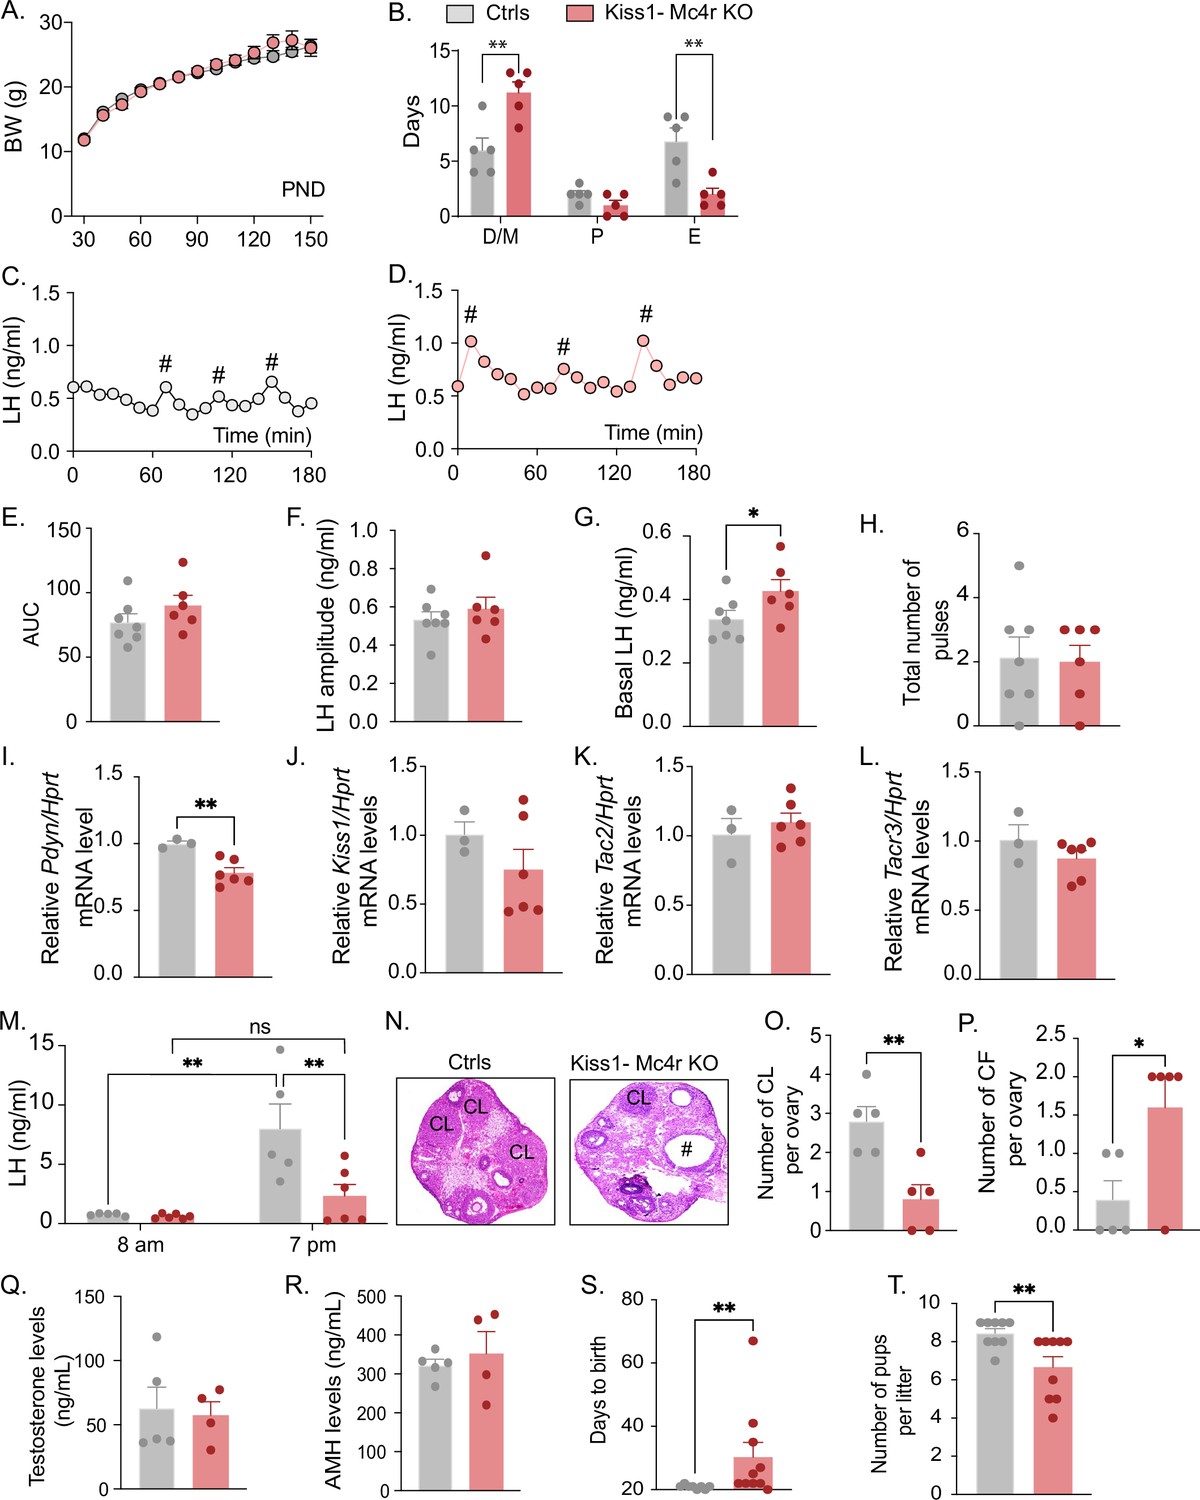
Deletion of Mc4r from Kiss1 neurons impairs fertility in Kiss1- Mc4r KO females.
(A) Female Kiss1- Mc4r KO (n = 31) have normal body weight from weaning and until post-natal day (PND) 150 compared to their WT littermates (n = 26). (B) Kiss1- Mc4r KO females displayed irregular estrous cycles with a longer time in diestrus and a shorter time in estrus compared to control females. **p < 0.01, two-way ANOVA followed by Tukey’s multiple comparisons test. (C, D) Pattern of luteinizing hormone (LH) pulsatility was analyzed in gonad intact Kiss1- Mc4r KO (n = 6) and control (n = 7) females. #Represents LH pulses. (E) LH total secretory mass assessed by area under the curve (AUC), (F) LH pulse amplitude, (G) basal LH, and (H) total number of pulses/180 min were analyzed. *p < 0.05 by Student’s t-test. The expression of the KNDy genes Pdyn (I), Kiss1 (J), Tac2 (K), and Tacr3 (L) was assessed in the ARH of adult Kiss1- Mc4r KO (n = 6) and control (n = 3) females. **p < 0.01 by Student’s t-test. Data presented as the mean ± SEM. (M) Kiss1- Mc4r KO (n = 6) and control (n = 5) females were subjected to an LH surge induction protocol. LH samples were collected in the morning (AM [8 a.m.]) and evening (PM [7 p.m.]) after lights off. **p < 0.01, two-way ANOVA followed by Sidak multiple comparisons test. (N) Ovarian histology shows a decrease in the number of corpora lutea (CL), (O) and an increase in the number of cystic follicles (CF, P) of Kiss1- Mc4r KO compared to controls (n = 5/group). # represents cystic follicles. Serum levels of testosterone (Q) and anti-Müllerian hormone (AMH) (R) in adult gonad intact Kiss1- Mc4r KO and control females (n = 5/group). Student’s t-test for unpaired samples. Data presented as the mean ± SEM. Kiss1- Mc4r KO females (n = 10) display impaired fertility compared to controls (n = 8) characterized by increased time to deliver pups (S) and decreased number of pups per litter (T), (n = 9/group). **p < 0.01 by Student’s t-test. Data presented as the mean ± SEM.
Figure 2—figure supplement 1
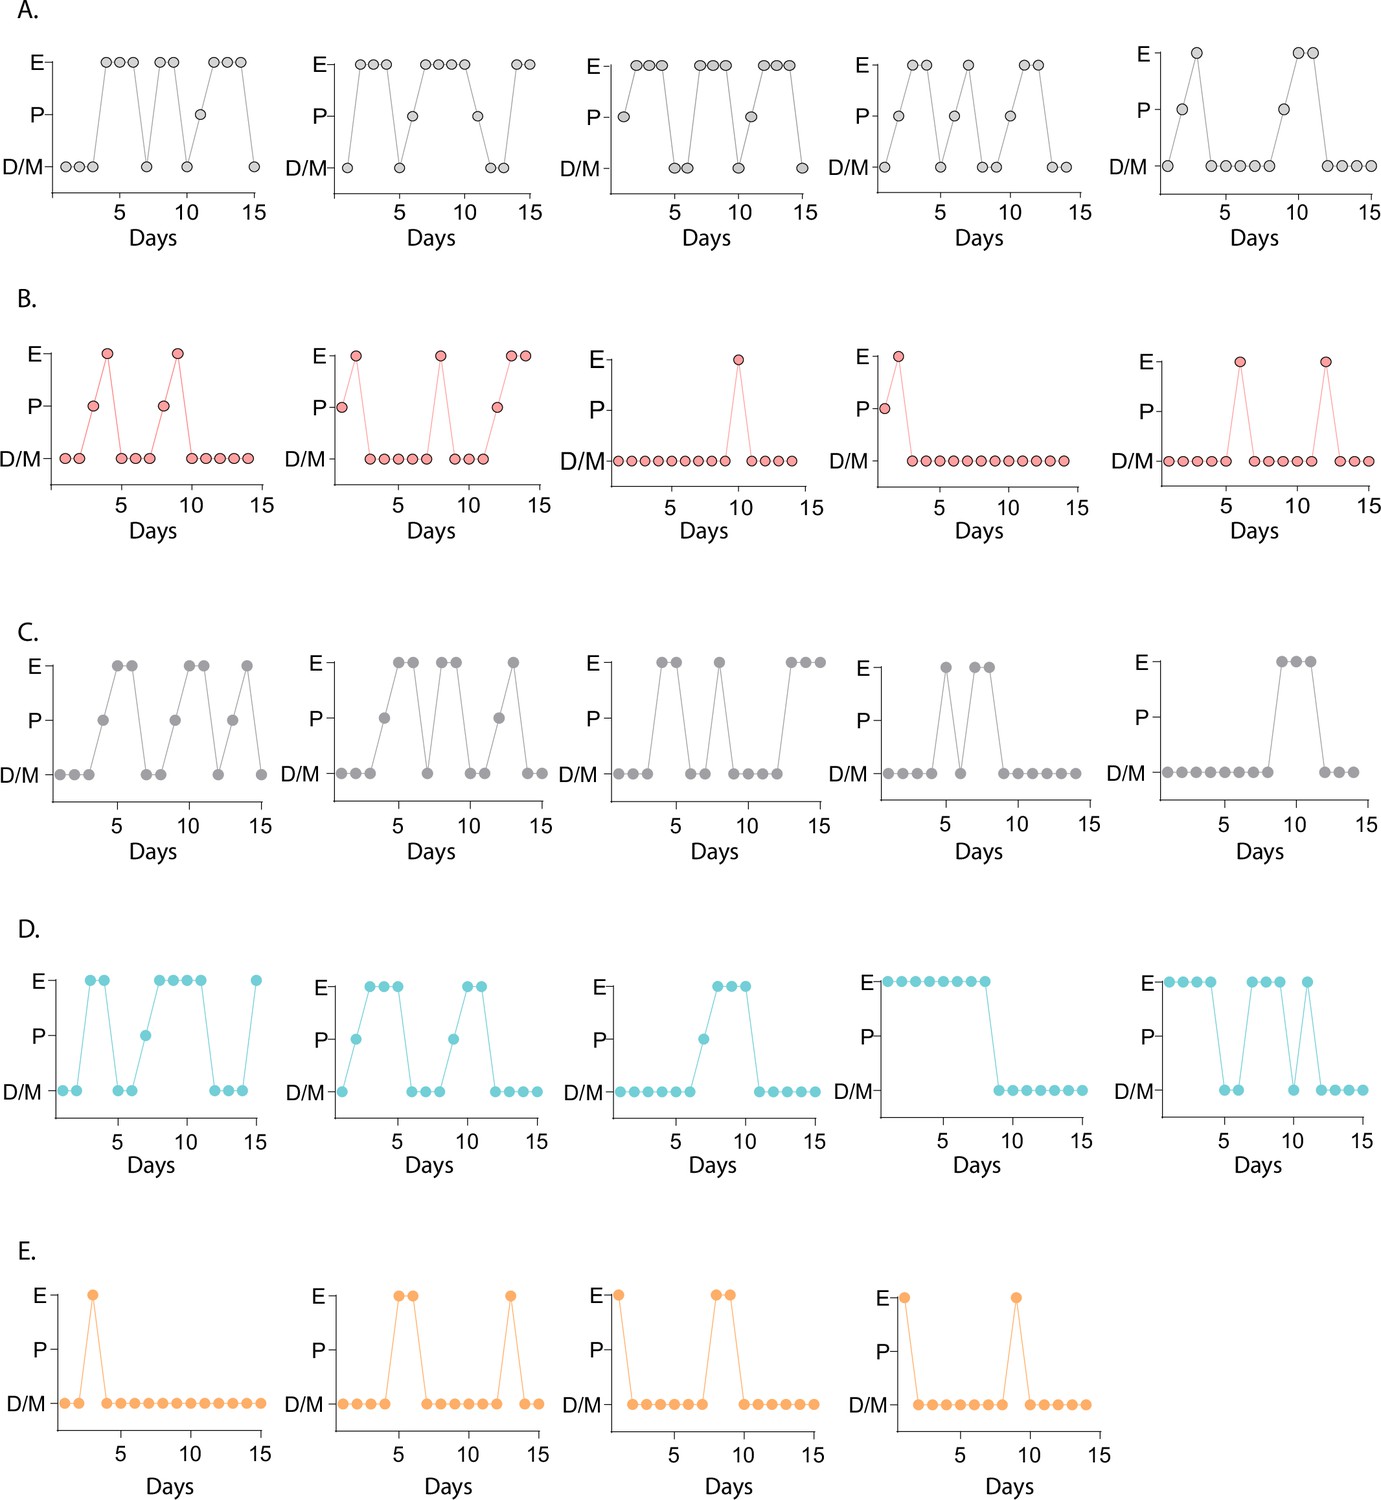
Estrous cycles of the Kiss1- Mc4r KO, Kiss1Cre: Mc4rloxTB, and Mc4rloxTB mouse models.
Representative examples of estrous cycles of Kiss1- Mc4r KO (B, n=5), their control littermates (A, n = 5), and Kiss1Cre: Mc4rloxTB (D, n = 5), Mc4rloxTB (E, n = 4) and their control littermates (C, n = 5), assessed by daily vaginal cytology for 15 days (D/M: diestrus/metestrus, P: proestrus, E: estrus).
Figure 3 with 1 supplement
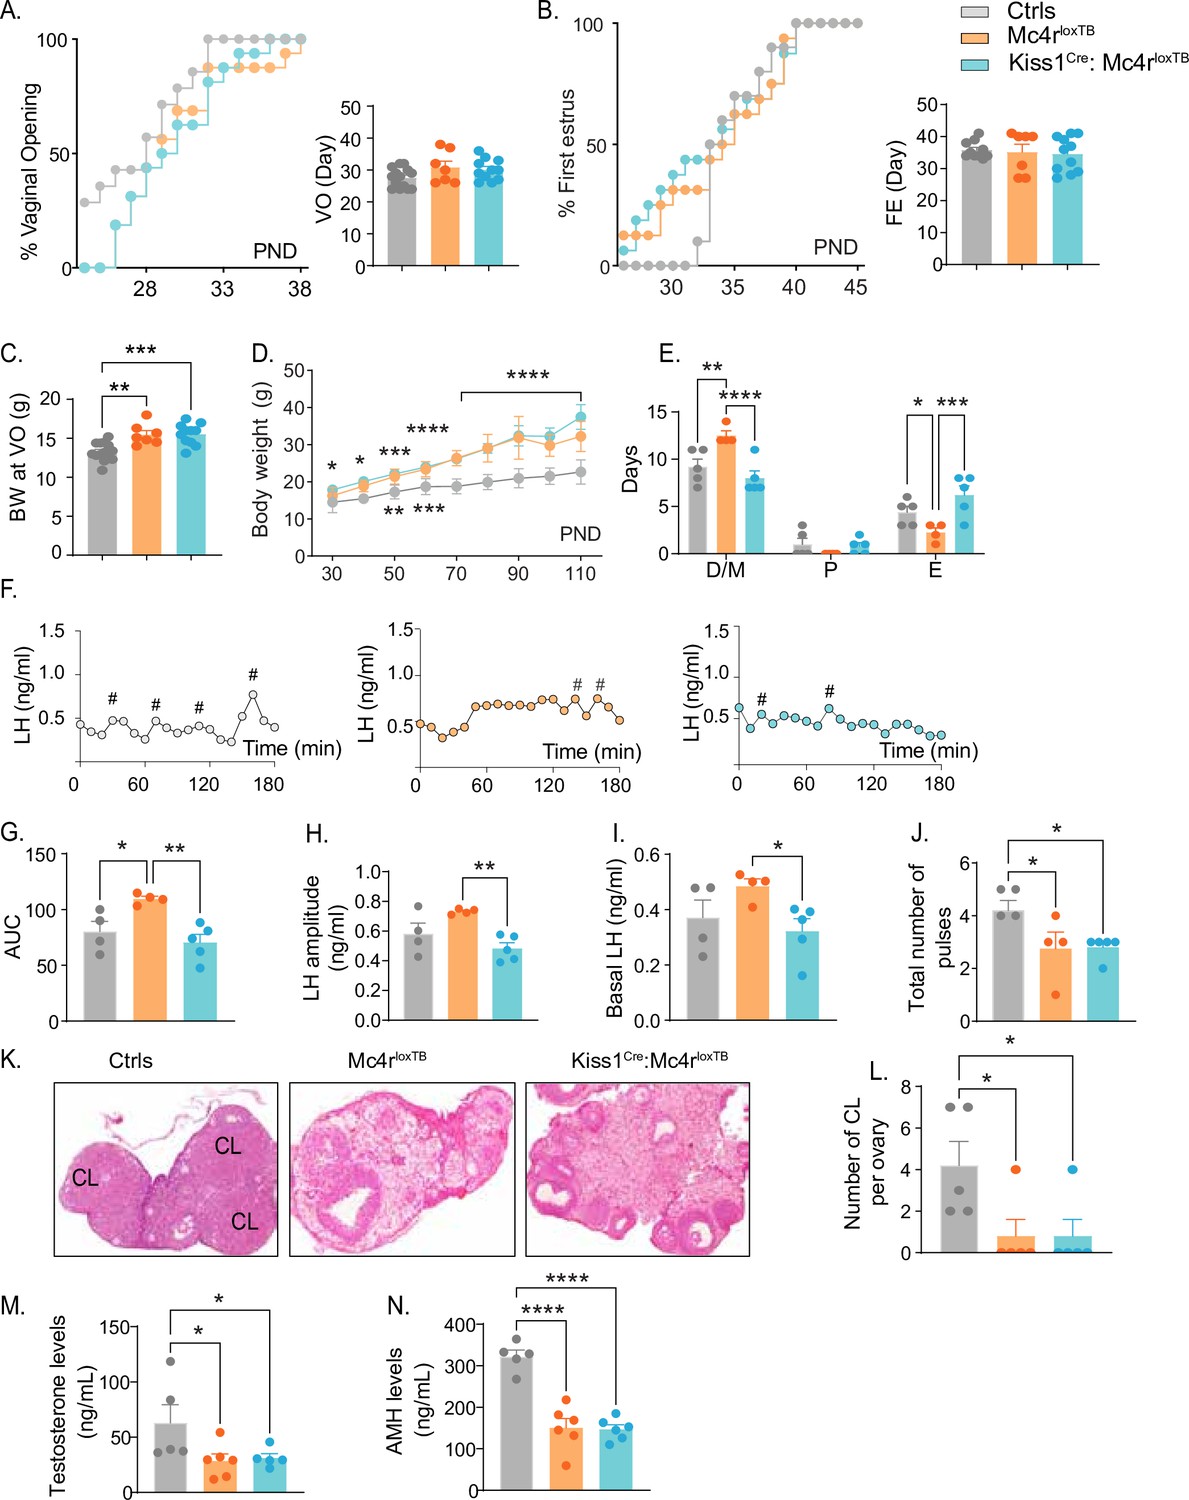
Re-insertion of Mc4r in Kiss1 neurons restores estrous cyclicity and luteinizing hormone (LH) pulsatility inKiss1Cre: Mc4rloxTB females.
(A, B) Kiss1Cre: Mc4rloxTB (n = 11) and Mc4rloxTB (Mc4r KO) (n = 7) displayed normal puberty onset as compared to their control littermates (n = 14), as documented by cumulative percent and mean age of animals at vaginal opening and first estrus. (C) Kiss1Cre: Mc4rloxTB and Mc4rloxTB both had significantly higher body weights at the time of puberty onset compared to their controls. **p < 0.01, ***p < 0.001 by one way ANOVA. (D) Mc4rloxTB(n = 6) and Kiss1Cre: Mc4rloxTB (n = 11) females displayed significantly higher body weight than their littermates (n = 7) from post-natal day 30 onwards. *p < 0.05, **p < 0.01, ***p < 0.001, and ****p < 0.0001. Upper significance (*) represents Ctrls vs. Kiss1Cre: Mc4rloxTB, and lower significance (*) represents Ctrls versus Mc4rloxTB. Significance was similar between post-natal day (PND) 70 and 110. Data presented as the mean ± SEM. (E) Mc4rloxTB females displayed irregular estrous cycles, presenting longer time in diestrus and shorter time in estrus compared to control females, while Kiss1Cre: Mc4rloxTB females displayed regular estrous cyclicity, similar to controls. *p < 0.05, **p < 0.01, ***p < 0.001, ****p < 0.0001, two-way ANOVA. Data presented as the mean ± SEM. (F) Pattern of LH pulsatility analyzed in gonad intact Mc4rloxTB (n = 4), Kiss1Cre: Mc4rloxTB (n = 5), and control littermates females (n = 5). LH samples were collected every 10 min for 180 min; # represents LH pulses. (G) LH total secretory mass, (H) LH pulse amplitude, (I) basal LH, and (J) total number of pulses/180 min were assessed. *p < 0.05, **p < 0.01 by one-way ANOVA. (K) Representative samples of ovarian histology from Mc4rloxTB, Kiss1Cre: Mc4rloxTB, and control females (n = 5/group); CL: corpora lutea. Data are presented as the mean ± SEM. (L) Ovarian histology showed a significant decrease in the number of corpora lutea in the Mc4r KO and Kiss1Cre: Mc4rloxTB compared to controls. Groups with different letters are significantly different. Serum levels of (M) testosterone and (N) anti-Müllerian hormone (AMH) in adult gonad intact females Mc4rloxTB, Kiss1Cre: Mc4rloxTB, and their control littermates. *p < 0.05, ****p < 0.0001, one-way ANOVA. Data are presented as the mean ± SEM.
Figure 3—figure supplement 1
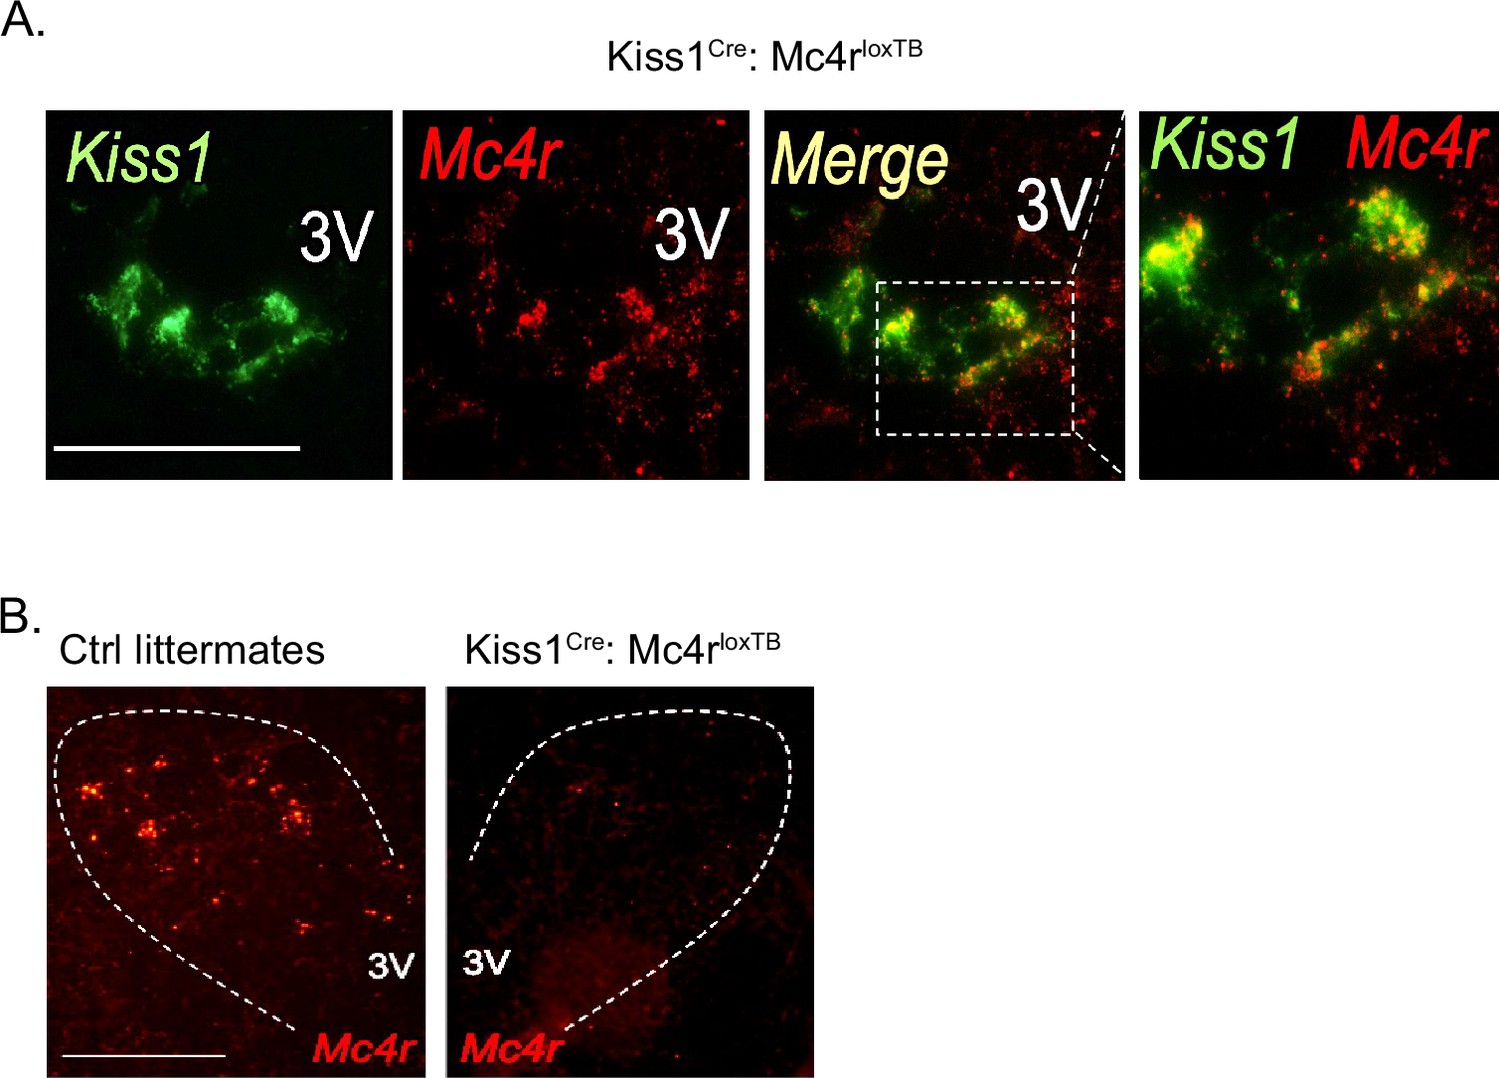
Validation of the Kiss1Cre: Mc4rloxTB mouse model.
(A) Representative images depicting co-expression of Kiss1 and Mc4r mRNA, using RNAscope, in ovariectomy (OVX) Kiss1Cre: Mc4rloxTB female mice in the ARH. As expected, Mc4r was detected within Kiss1 neurons in Kiss1Cre: Mc4rloxTB females. (B) Representative images depicting the absence of Mc4r mRNA expression in the paraventricular hypothalamus of Kiss1Cre: Mc4rloxTB female, compared to their WT control littermates.
Figure 4

Kiss1ARH neurons are activated by melanocortin agonists and respond to optogenetic stimulation of POMC neurons.
(A) Slices were taken from Kiss1Cre-injected (confocal image) brains to target fluorescent cells (arrowhead) for recording (white outline over electrode). (B) Whole-cell voltage-clamp recording of Kiss1ARH neurons following the direct application of the high-affinity melanocortin receptor agonist melanotan II (MTII, 250 nM) was added directly to the bath, and the response was compared between slices from ovariectomy (OVX) and OVX + E females. (C) While the average inward current was slightly higher in the OVX + E state, there was not a significant difference (Student’s t-test for unpaired samples, p > 0.05). (D) The Mc4r-selective agonist THIQ (100 nM) was perfused, and excitatory inward currents were generated in Kiss1ARH neurons. (E) Images are of AAV-driven labeling of POMC cells as seen through the confocal. (F) Using the AAV-driven expression of channelrhodopsin in adult PomcCre mice, high-frequency stimulation elicited a slow inward current in Kiss1 neurons. (G) The identity of cells was confirmed through the presence of a persistent sodium current (see Zhang et al., 2015) and/or with RT-PCR of harvested cytoplasm showing Kiss1 expression (Gel: MM = molecular marker, TC = tissue controls). (H) A direct synaptic projection from POMC to Kiss1ARH neuron (post hoc identified) was confirmed using the ‘rescue’ protocol: 1, baseline glutamatergic responses were initially generated (black trace); 2, then action potentials were eliminated by blocking voltage-gated sodium channels with tetrodotoxin (TTX) and the postsynaptic response (red trace); 3, blockade of potassium channels facilitated calcium entry into the terminal through ChR2 to release synaptic vesicles, ‘rescuing’ the postsynaptic glutamate response (green trace). (I) Glutamatergic responses were also often observed, particularly in the ventral ARH. As seen when targeting low input resistance neurons (i.e., Kiss1ARH) with low-frequency optogenetic stimulation (5 ms pulse, 50 ms inter-spike interval), the first response in OVX + vehicle females was larger relative to the second response in OVX + E2-treated female mice. Representative traces are the average of 30 sweeps. (J) The averaged paired-pulse ratio was lower in recordings from estradiol-treated female mice, indicating an increased release probability (Student’s t-test P<0.05). (K) High-frequency optogenetic stimulation elicited a small inward current. (L) In a different cell, a high frequency inward current was noted before constant perfusion of SHU9119 for 15 min (break between traces). When the stimulation protocol was repeated, no inward current was elicited. (M) The majority of high-frequency responses were inward, and only twice was an inhibitory outward current recorded in identified Kiss1ARH neurons. Perfusion of the non-selective opioid receptor antagonist naloxone reversed the current, eliminating MCR activation as the mechanism.
-
Figure 4—source data 1
Tif images (uncropped labeled and unlabeled), showing the original gel picture for Figure 4G, indicating the relevant bands.
- https://cdn.elifesciences.org/articles/100722/elife-100722-fig4-data1-v1.pdf
-
Figure 4—source data 2
Tif images (uncropped labeled and unlabeled), showing the original gel picture for Figure 4G, indicating the relevant bands.
- https://cdn.elifesciences.org/articles/100722/elife-100722-fig4-data2-v1.pdf
Figure 5
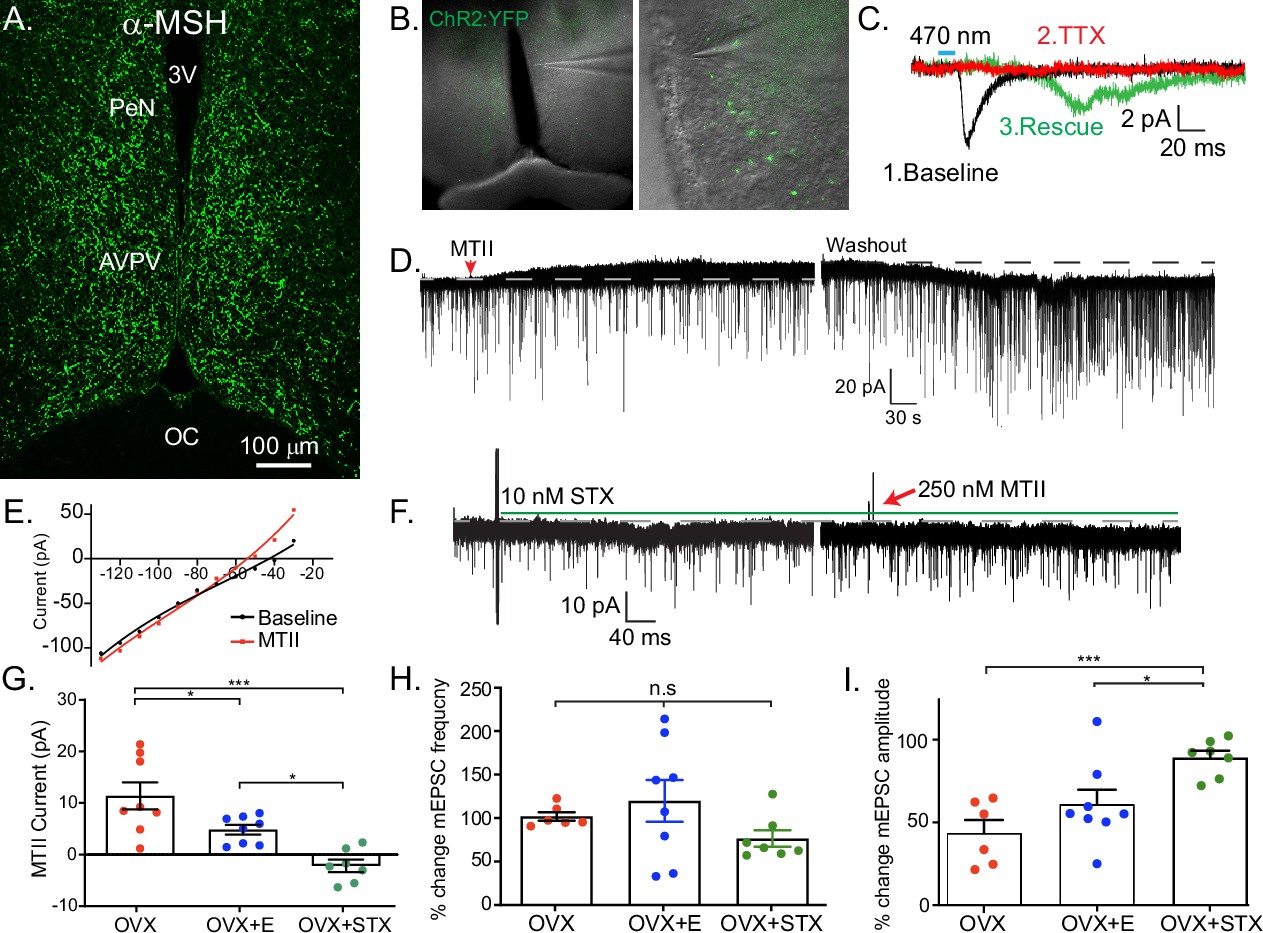
Kiss1AVPV/PeN neurons are inhibited by Mc4r agonists in an E2-dependent manner.
(A) Immunohistochemistry showing robust labeling of α-melanocyte stimulating hormone (αMSH) fibers in the AVPV/PeN region in ovariectomy (OVX) + E2 WT female mice. (B) Low and high power bright-field images taken during electrophysiology recording in OVX + E2 POMC-Cre mice expressing YFP:ChR2 in the ARH following AAV injection. (Left) Low power image shows the location of recorded cells. (Right) Higher power image of area from white box inset displaying POMC fibers innervating the area. (C) Fibers surrounded putative Kiss1AVPV/PeN neurons (expressing INaP, IT, and Ih), and optogenetic stimuli were able to elicit postsynaptic currents that were eliminated with tetrodotoxin (TTX, 1 μM), but ‘rescued’ with the addition of K+ channel blockers (4-aminopyridine [4-AP] and tetraethyl ammonium [TEA]), which indicates a monosynaptic connection between POMCARH and Kiss1AVPV neurons. (D) Whole-cell voltage-clamp recordings were made in ChR2-YFP positive cells in brain slices taken from Kiss1Cre:Ai32 female mice. Bath application of melanotan II (MTII, 500 nM) generated an inhibitory outward current in a Kiss1AVPV/PeN neuron from OVX female. As the cell was synaptically isolated using bath-applied TTX (1 μM), this represents a direct effect. Washout of MTII while still in TTX quickly led to a return to baseline RMP. (E) An IV relationship was plotted using voltage steps before and after MTII administration. The crossing at –80 mV (~EK+) indicates that the opening of K+ channels underlies the MC4R inhibition of Kiss1AVPV/PeN neurons. (F) In a subset of recordings from OVX brain slices, the selective membrane estrogen receptor (Gq-mER) agonist STX (10 nM) was added to the bath for ~10 min prior to the addition of MTII. STX pretreatment resulted in either a greatly attenuated outward current or even an inward current, as shown in this example. (G) The mean outward current was significantly higher when recording in Kiss1AVPV/PeN neurons from brain slices from vehicle-treated, OVX females compared to E2-treated, OVX females or acute STX-treated brain slices from OVX females (one-way ANOVA F(2,19) = 12.32, p < 0.001; Holm–Sidak post hoc comparisons found significant differences between all groups; *p < 0.05, ***p < 0.001). (H) There was no difference in the frequency of mEPSCs (miniature excitatory postsynaptic current) after MTII, calculated as a percent of baseline between groups. (I) However, there was a significant difference in the mEPSC amplitude (calculated as a percent of baseline) between all groups: main effect F(2,19) = 10.58, p < 0.001. Post hoc comparisons using Holm–Sidak found OVX + STX to be different from both OVX (p < 0.001) and OVX + E (p < 0.05).
Figure 6
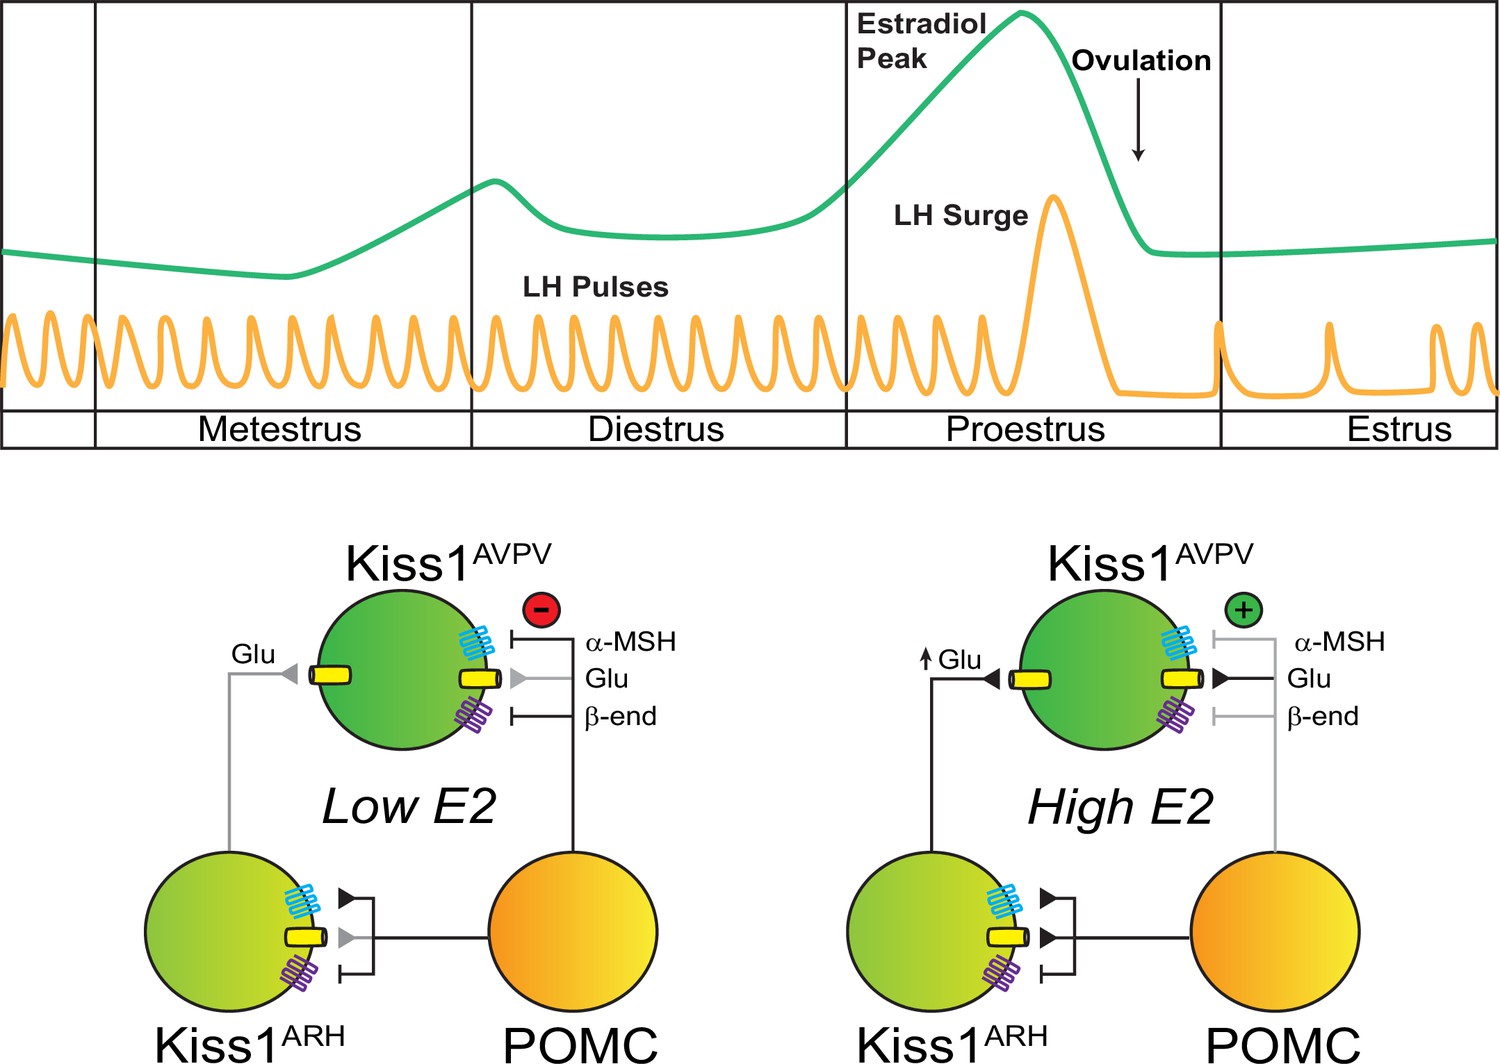
Working model of the neuronal input from POMC ARH to Kiss1 ARH and AVPV/PeN populations.
POMCARH neurons excite Kiss1ARH neurons via glutamate and α-melanocyte stimulating hormone (αMSH) release, which activate glutamatergic ionotropic receptors and Mc4r, respectively. In the low E2 state, αMSH fibers project to the AVPV/PeN, and Mc4r inhibit Kiss1AVPV/PeN neurons via opening a K+ channel. However, in the high E2 state, E2 enhances the glutamatergic excitation of both POMC and Kiss1 ARH neurons. E2 treatment rapidly abrogates (uncouples) the inhibitory MC4R signaling in Kiss1AVPV/PeN neurons, allowing greater excitatory actions of Kiss1ARH neurons via enhanced glutamate release (Zhang et al., 2015).
Tables
Table 1
Primers.
| Gene | Gene length (pb) | Accession # | Primers | Location (nt) | Sequence |
|---|---|---|---|---|---|
| Hprt | 352 | NM_013556.2 | Hprt-F | 704–728 | CCTGCTGGATTACATTAAAGCGCTG |
| Hprt-R | 377–401 | GTCAAGGGCATATCCAACAACAAAC | |||
| Agrp | 136 | NM_001271806.1 | Agrp-F | 466–488 | GCCTCAAGAAGACAACTGCAGAC |
| Agrp-R | 580–601 | AAGCAGGACTCGTGCAGCCTTA | |||
| Pomc | 138 | NM_001278584.1 | Pomc-F | 187–208 | CCATAGATGTGTGGAGCTGGTG |
| Pomc-R | 303–324 | CACCTCCGTTGCCAGGAAACAC | |||
| Mc4r | 101 | NM_016977.4 | Mc4r-F | 552–570 | CCCGGACGGAGGATGCTAT |
| Mc4r-R | 632–652 | TCGCCACGATCACTAGAATGT | |||
| Pdyn | 200 | NM_018863.4 | Pdyn-F | 45–64 | ACAGGGGGAGACTCTCATCT |
| Pdyn-R | 223–244 | GGGGATGAATGACCTGCTTACT | |||
| Kiss1 | 129 | AF472576.1 | Kiss1-F | 147–166 | GCTGCTGCTTCTCCTCTGTG |
| Kiss1-R | 256–275 | TCTGCATACCGCGATTCCTT | |||
| Tac2 | 234 | NM_001199971.1 | Tac2- F | 238–257 | GCTCCACAGCTTTGTCCTTC |
| Tac2- R | 452–471 | GCTAGCCTTGCTCAGCACTT | |||
| Tacr3 | 159 | NM_021382.6 | Tacr3-F | 759–779 | GCCATTGCAGTGGACAGGTAT |
| Tacr3-R | 898–917 | ACGGCCTGGCATGACTTTTA |
Additional files
-
Source data 1
Electrophysiology raw data.
- https://cdn.elifesciences.org/articles/100722/elife-100722-data1-v1.xlsx
-
MDAR checklist
- https://cdn.elifesciences.org/articles/100722/elife-100722-mdarchecklist1-v1.docx
-
Source code 1
MATLAB code used to analyze the luteinizing hormone (LH) pulses data (in Figures 2 and 3).
- https://cdn.elifesciences.org/articles/100722/elife-100722-code1-v1.zip
Download links
A two-part list of links to download the article, or parts of the article, in various formats.
Downloads (link to download the article as PDF)
Open citations (links to open the citations from this article in various online reference manager services)
Cite this article (links to download the citations from this article in formats compatible with various reference manager tools)
POMC neurons control fertility through differential signaling of MC4R in kisspeptin neurons
eLife 13:RP100722.
https://doi.org/10.7554/eLife.100722.4


