Emerging cooperativity between Oct4 and Sox2 governs the pluripotency network in early mouse embryos
- Cell and Developmental Biology Group, Max Planck Institute for Molecular Biomedicine, Germany
- Guangzhou National Laboratory, Guangzhou International Bio Island, China
- Department of Genetics, Harvard Medical School, United States
- Embryonic Self-Organization Research Group, Max Planck Institute for Molecular Biomedicine, Germany
Figures
Figure 1 with 2 supplements
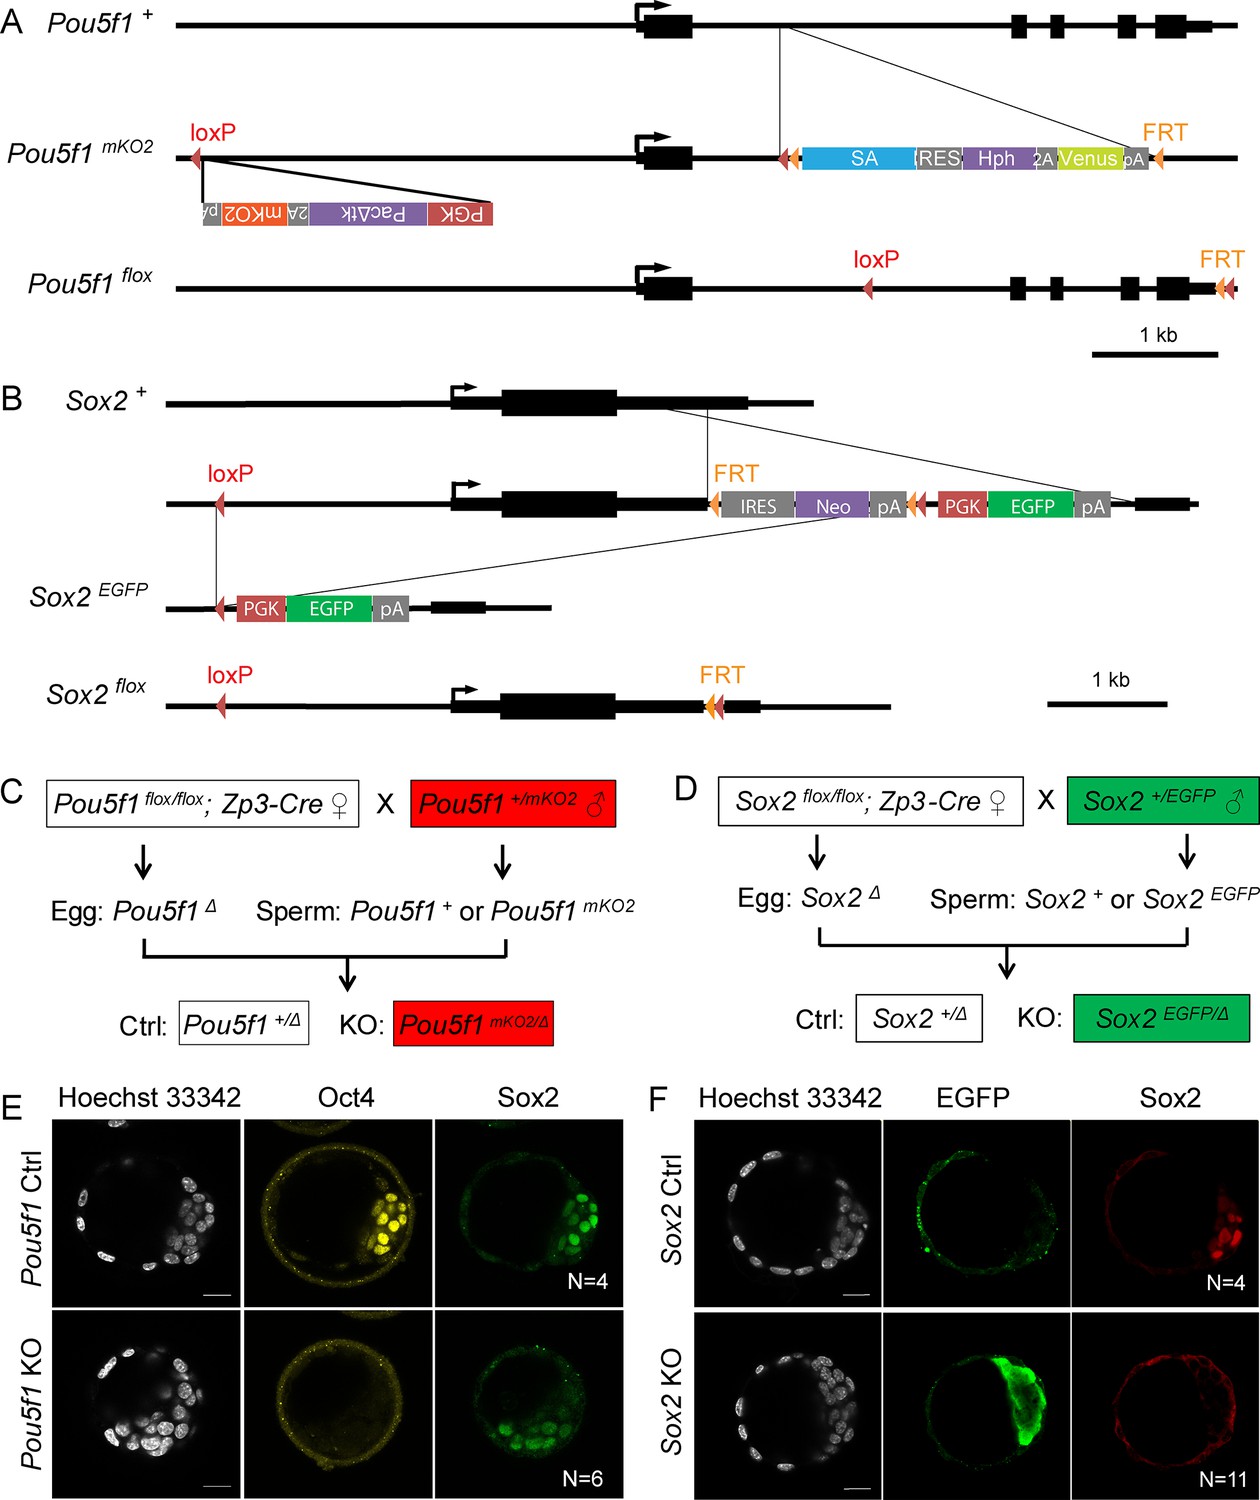
Generation of maternal-zygotic knockout (KO) embryos.
(A) Schemes of mKO2-labeled Pou5f1-KO (Pou5f1mKO2) and Pou5f1 flox alleles. (B) Schemes of EGFP-labeled Sox2-KO (Sox2EGFP) and Sox2 flox alleles. (C) Mating strategy for Pou5f1 Ctrl and KO embryos. (D) Mating strategy for Sox2 Ctrl and KO embryos. (E) Immunostaining with embryos separated based on the mKO2 fluorescence. (F) Immunostaining with embryos separated based on the EGFP fluorescence. N, the number of embryos. Scalebar, 20 μm.
-
Figure 1—source data 1
Imaging data of Pou5f1+ mKO2- embryos in panel E.
- https://cdn.elifesciences.org/articles/100735/elife-100735-fig1-data1-v1.zip
-
Figure 1—source data 2
Immunostaining of the Pou5f1- mKO2+ embryo in panel E.
- https://cdn.elifesciences.org/articles/100735/elife-100735-fig1-data2-v1.zip
-
Figure 1—source data 3
Imaging data of Sox2+ EGFP- and Sox2- EGFP+ embryos in panel F.
- https://cdn.elifesciences.org/articles/100735/elife-100735-fig1-data3-v1.zip
Figure 1—figure supplement 1
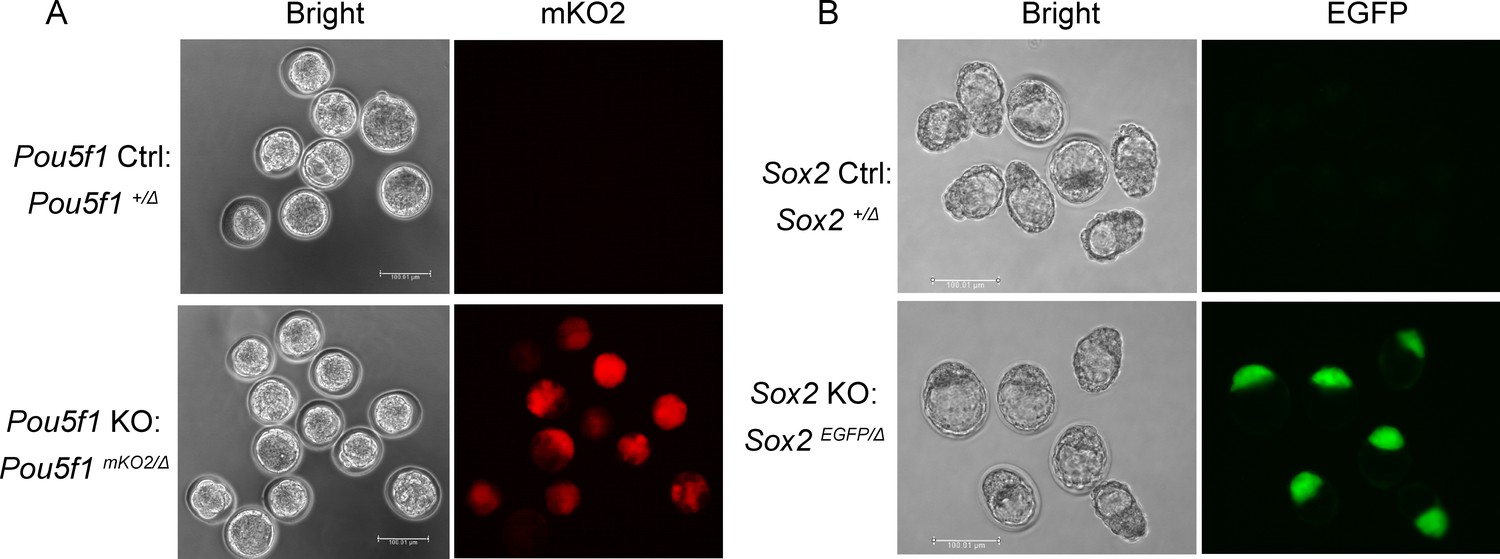
Validation of the transgenic embryos.
(A) The mKO2-labeled Pou5f1-KO embryos were identified under fluorescent microscopy at E2.5+1 day. Scalebar, 100 μm. (B) The EGFP-labeled Sox2-KO embryos were identified under florescent microscopy at E2.5+2 days. Scalebar, 100 μm.
-
Figure 1—figure supplement 1—source data 1
Live imaging of embryos.
- https://cdn.elifesciences.org/articles/100735/elife-100735-fig1-figsupp1-data1-v1.zip
Figure 1—figure supplement 2
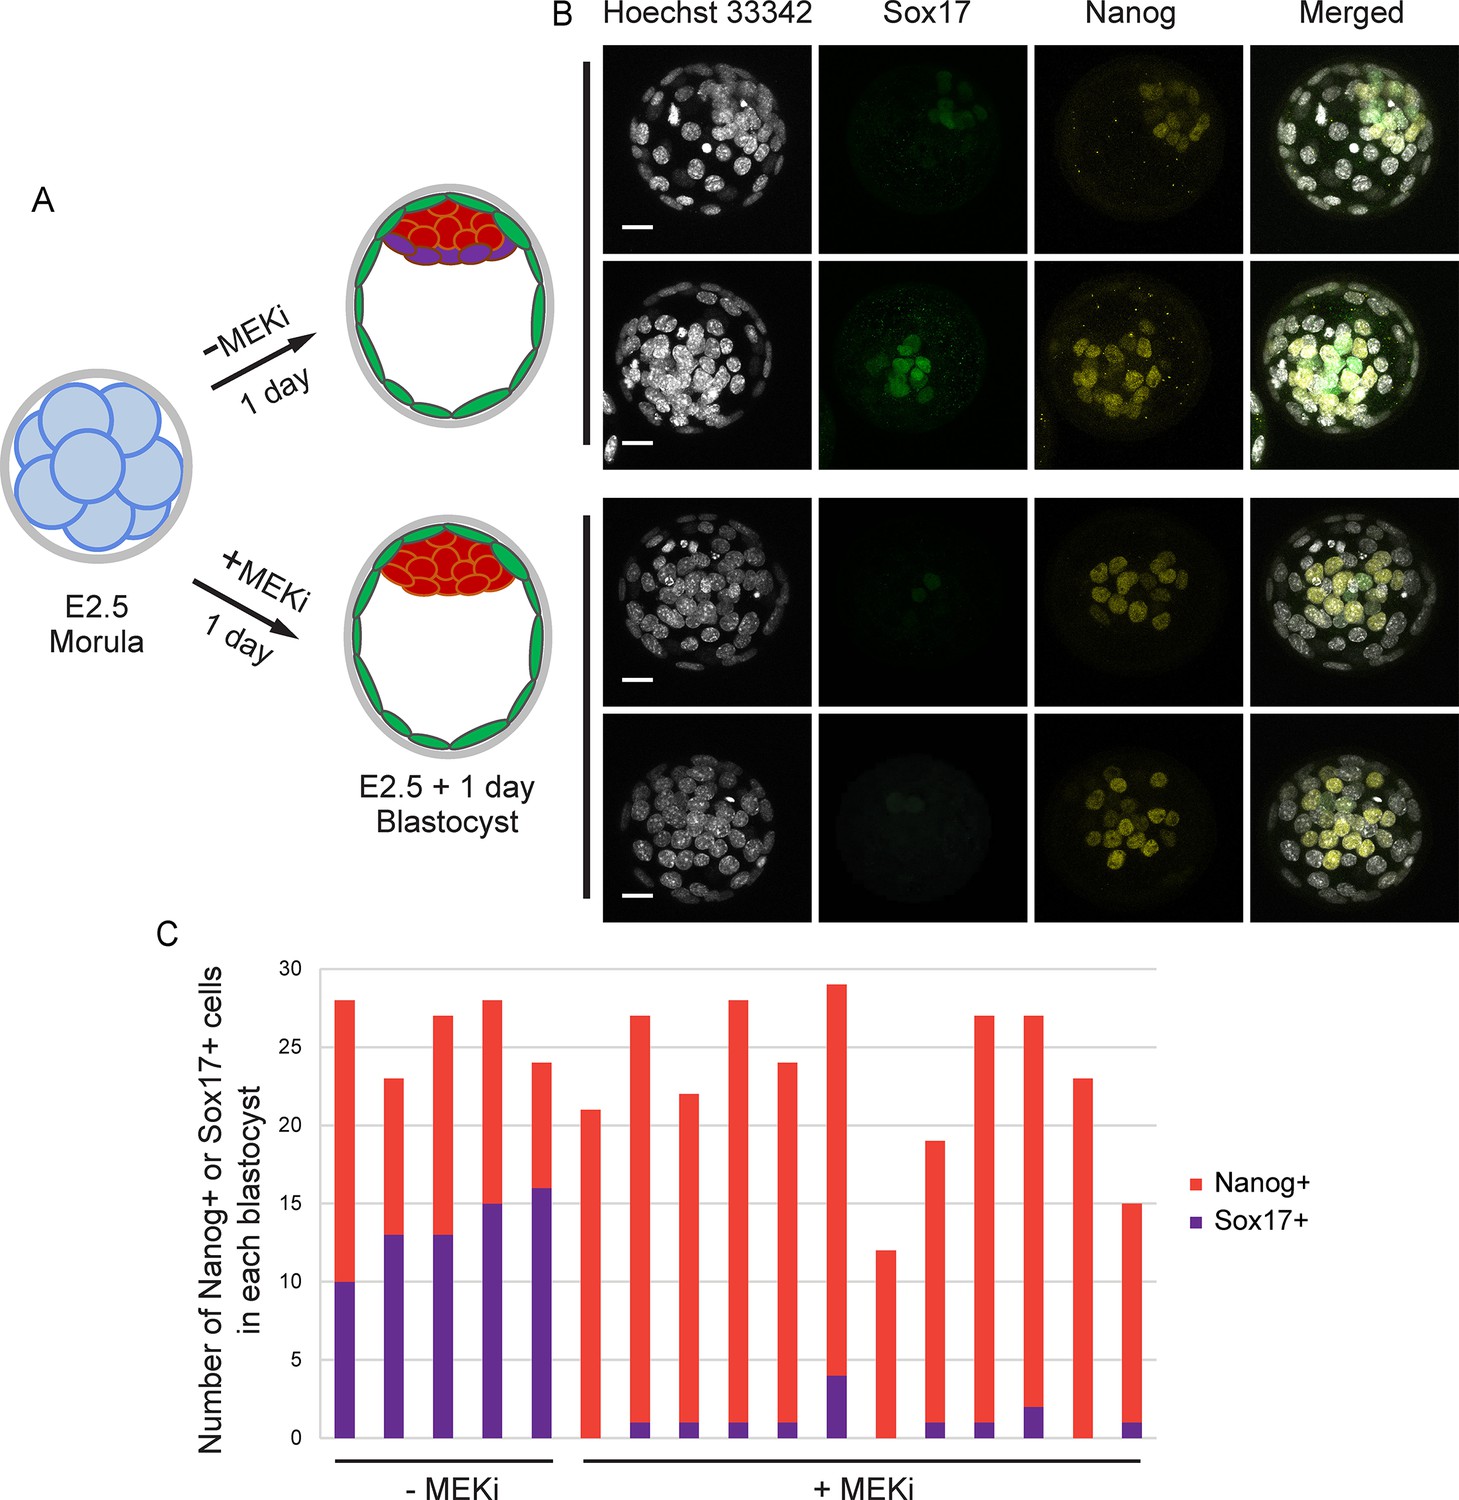
Validation of the effect of MEK inhibitor (MEKi).
(A) The scheme of MEKi (PD0325901, 1 μM) treatment. (B) Immunostaining of Sox17 and Nanog in the blastocysts treated with or without MEKi. Scalebar, 20 μm. (C) The number of Sox17+ or Nanog+ cells in each blastocyst.
-
Figure 1—figure supplement 2—source data 1
Imaging data of embryos.
- https://cdn.elifesciences.org/articles/100735/elife-100735-fig1-figsupp2-data1-v1.zip
Figure 2 with 3 supplements
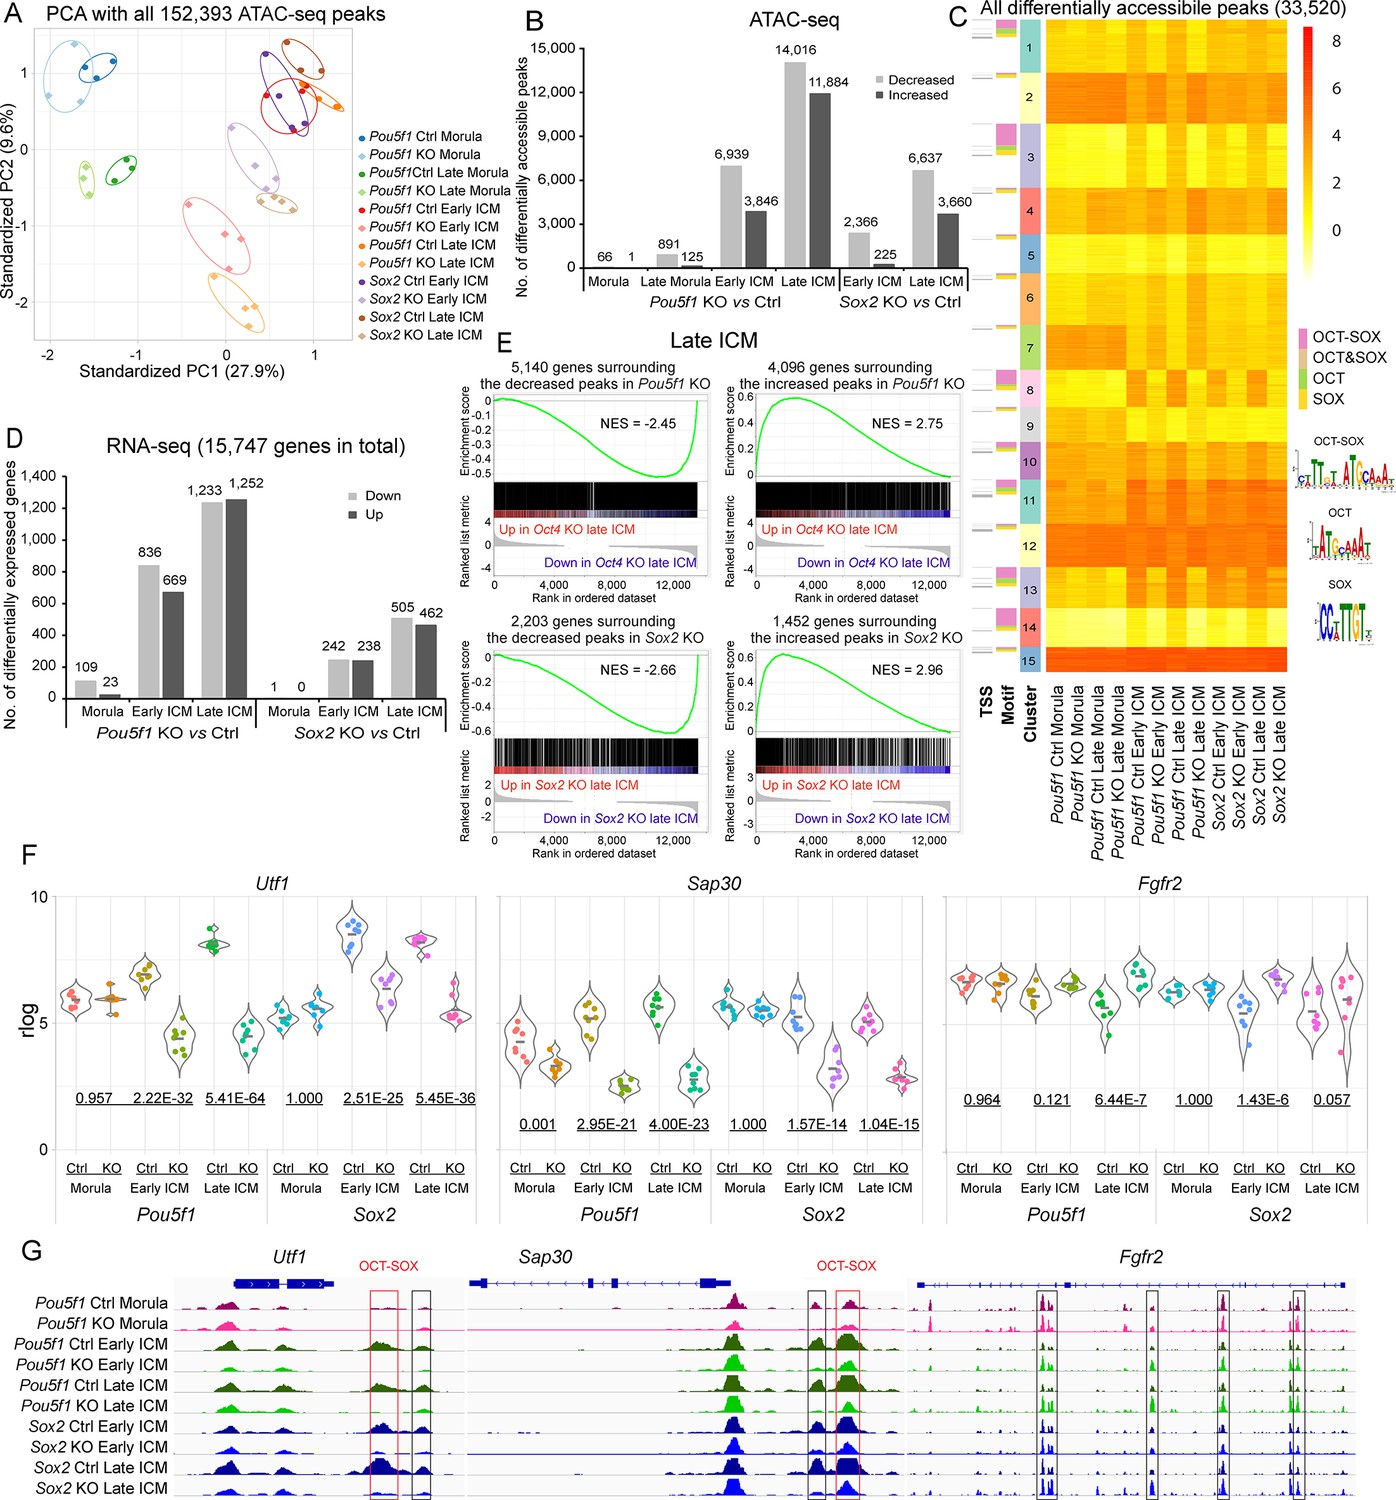
Oct4 and Sox2 regulate chromatin landscape and transcriptome in the inner cell mass (ICM).
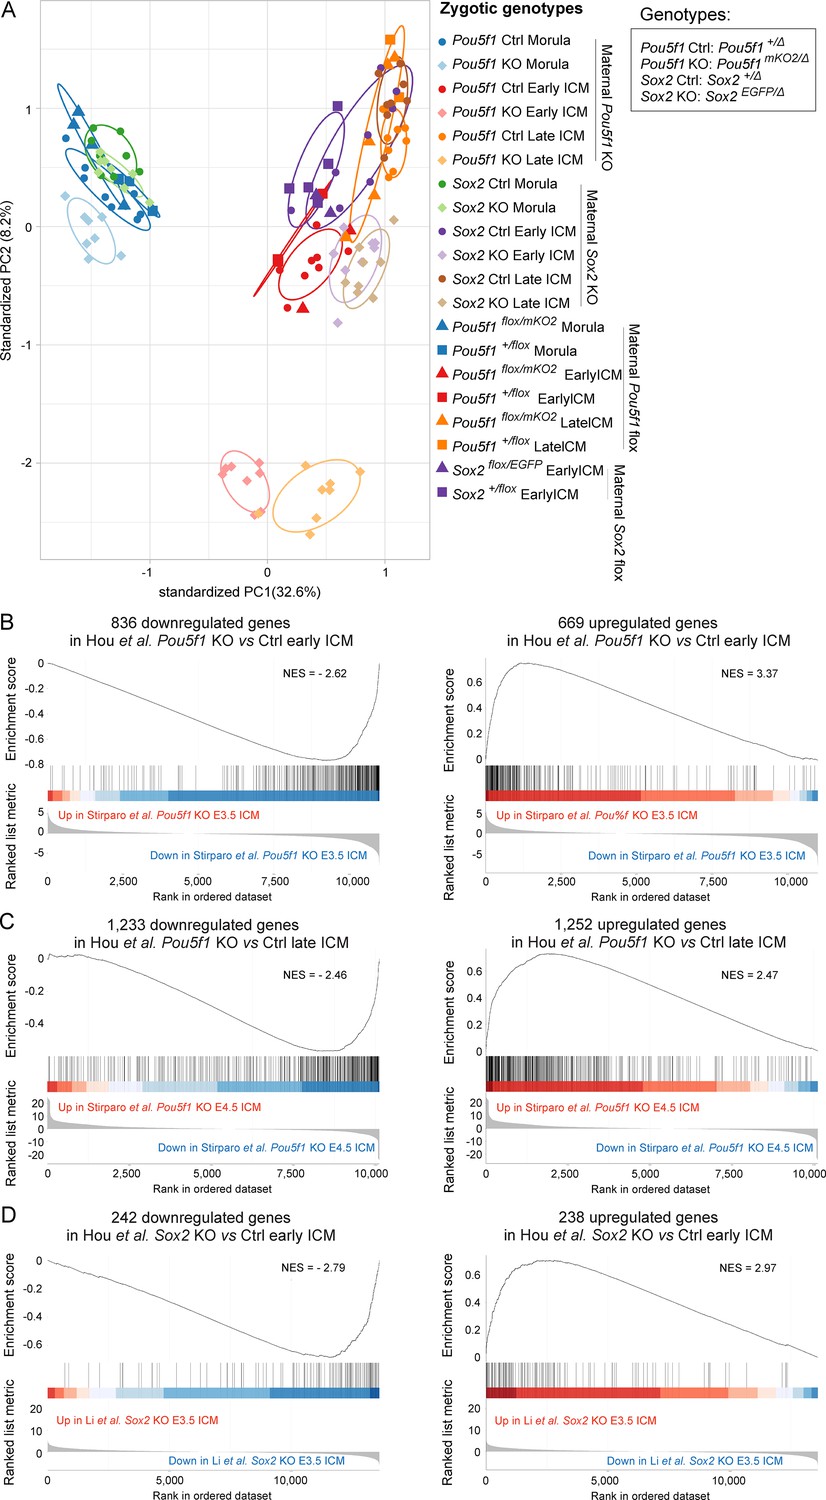
(A) Principal component analysis (PCA) plot of all the identified ATAC-seq peaks. (B) Number of differentially accessible ATAC-seq peaks in knockout (KO) vs Ctrl samples. Cutoff, adjusted p-value<0.05. (C) k-Means clustering of all the significantly differential ATAC-seq peaks in KO vs Ctrl in B. The heatmap is sorted by clusters, motifs, and transcription start sites (TSSs). Peaks located within 100 bp from TSS were considered as TSS peaks. OCT-SOX, OCT, or SOX motifs indicate that the peak contains the canonical OCT-SOX, OCT, or SOX motif, respectively, while OCT&SOX motif indicates that separate OCT and SOX motifs were discovered in one peak. Cutoff, adjusted p-value<0.05. (D) Number of differentially expressed genes in KO vs Ctrl samples. Cutoff, adjusted p-value<0.05 and log2 fold change≥1. (E) Gene set enrichment analysis (GSEA) shows the correlation between significantly changed ATAC-seq peaks and the transcription of genes whose TSSs are located within 10 kb of the peak centers in Pou5f1- or Sox2-KO late ICMs. NES, normalized enrichment score. (F) Examples of down- and upregulated genes. The underlined numbers represent the adjusted p-values. (G) The ATAC-seq profiles surrounding the genes in E. Boxes mark the differentially accessible peaks, and red boxes specifically mark those with the OCT-SOX motif.
Figure 2—figure supplement 1
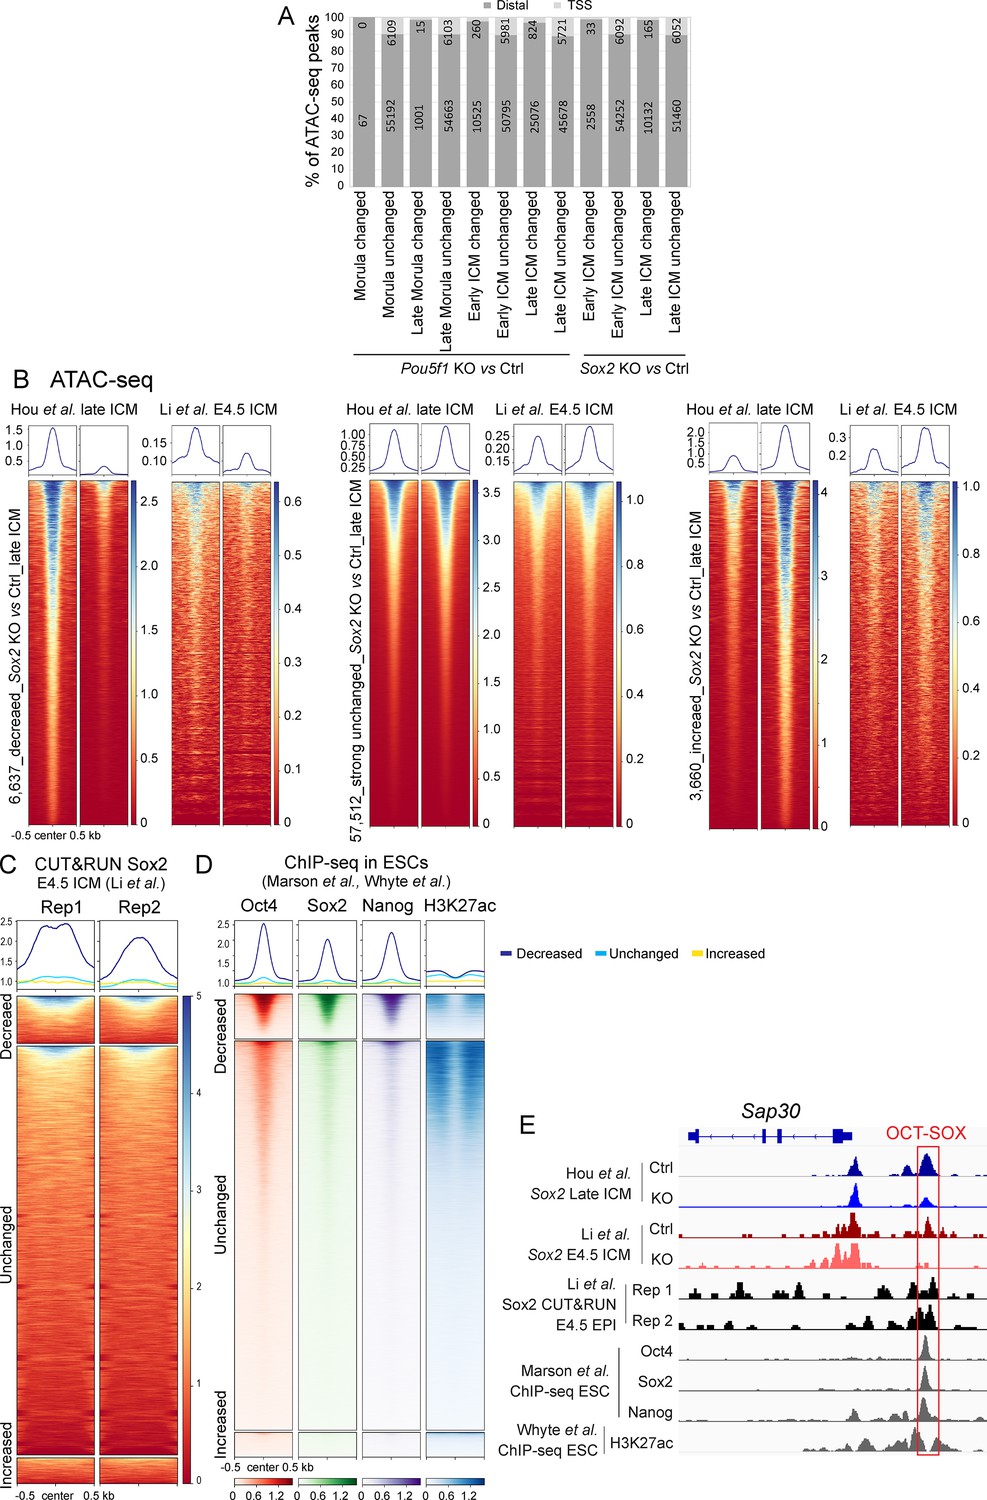
Quality check of the low-input ATAC-seq.
(A) The location of ATAC-seq peaks relative to transcription start sites (TSSs). The number in each bar represents the number of peaks in each group. (B and C) ATAC-seq (B) and Sox2 CUT&RUN (C) profiles (Li et al., 2023) over the decreased, unchanged, and increased ATAC-seq peaks identified in our Sox2-KO late inner cell masses (ICMs). (D) ChIP-seq profiles of Oct4, Sox2, Nanog, and H3K27ac in embryonic stem cells (ESCs) (Marson et al., 2008) over the decreased, unchanged, and increased ATAC-seq peaks in our Sox2-KO late ICMs. To exclude spurious peaks, only strong unchanged peaks (57,512 out of 142,096) were used in the analysis from C to E. (E) IGV tracks displaying ATAC-seq and Sox2 CUT&RUN profiles (Li et al., 2023) in late ICMs, along with ChIP-seq profiles of Oct4, Sox2, Nanog, and H3K27ac in ESCs (Marson et al., 2008; Whyte et al., 2012), centered around the genomic locus of Sap30. Arrows mark the decreased ATAC-seq peaks.
Figure 2—figure supplement 2
Quality check of the low-input RNA-seq.
(A) Principal component analysis (PCA) plot illustrating the distribution of RNA-seq samples with the indicated stages and genotypes. (B–D) Gene set enrichment analysis (GSEA) plots of down- and upregulated genes identified in our Pou5f1-KO early inner cell mass (ICM) (B), Pou5f1-KO late ICM (C), and Sox2-KO early ICM (D) in the single-cell RNA-seq (scRNA-seq) dataset of ICM samples without MEK inhibitor (MEKi) (Stirparo et al., 2021; Li et al., 2023). NES, normalized enrichment score.
Figure 2—figure supplement 3
The correlation between chromatin accessibility and the transcription activity of surrounding genes.
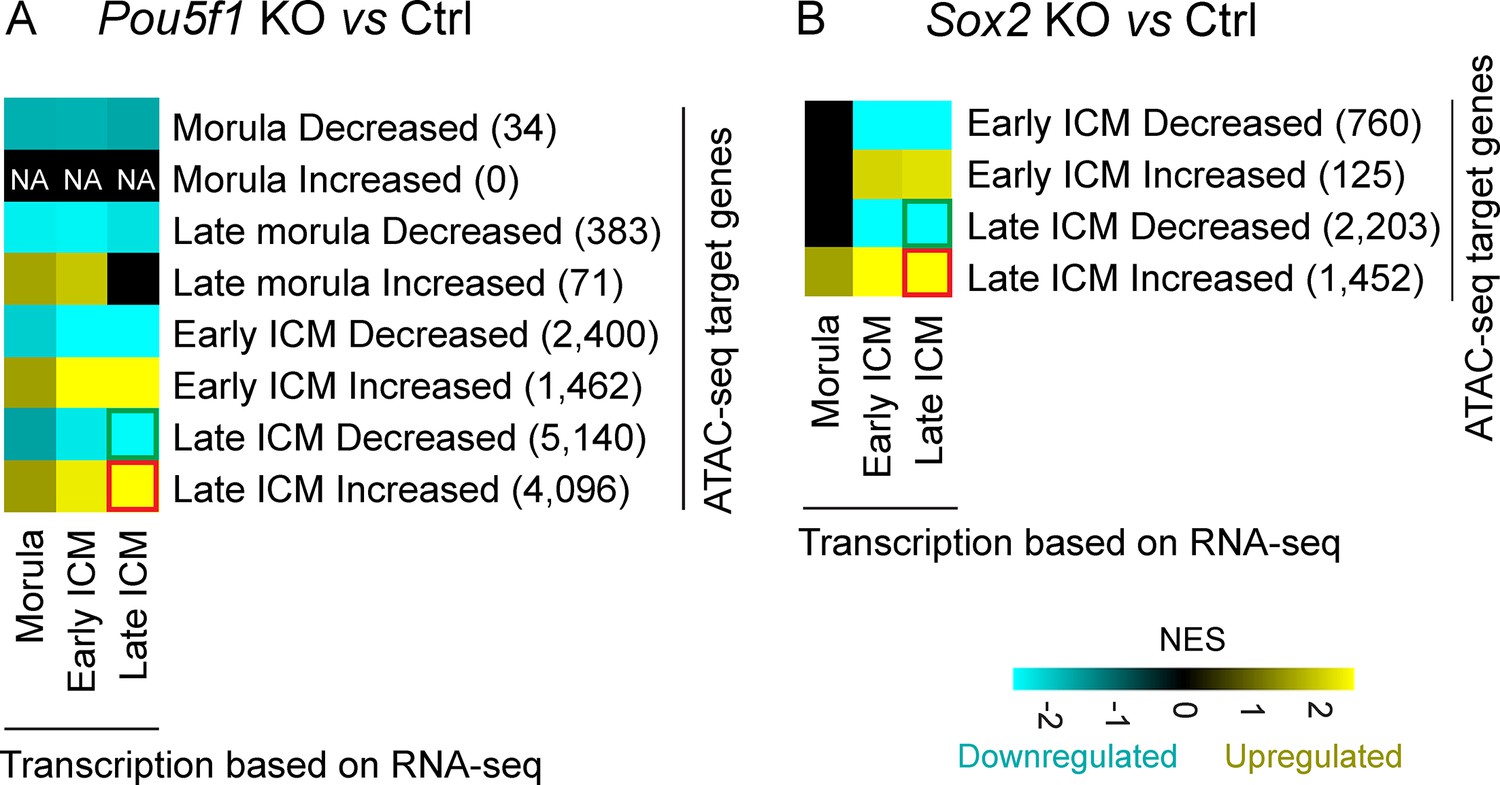
Heatmap of gene set enrichment analysis (GSEA) enrichment Pou5f1-KO (A) and Sox2-KO (B) samples. The analysis utilized genes with transcription start site (TSS) falling within a 10 kb proximity to the decreased or increased ATAC-seq peaks. The number in parentheses denotes the count of genes with TSS located within 10 kb of the significantly differential peaks in each module. NES, normalized enrichment score.
Figure 3 with 1 supplement
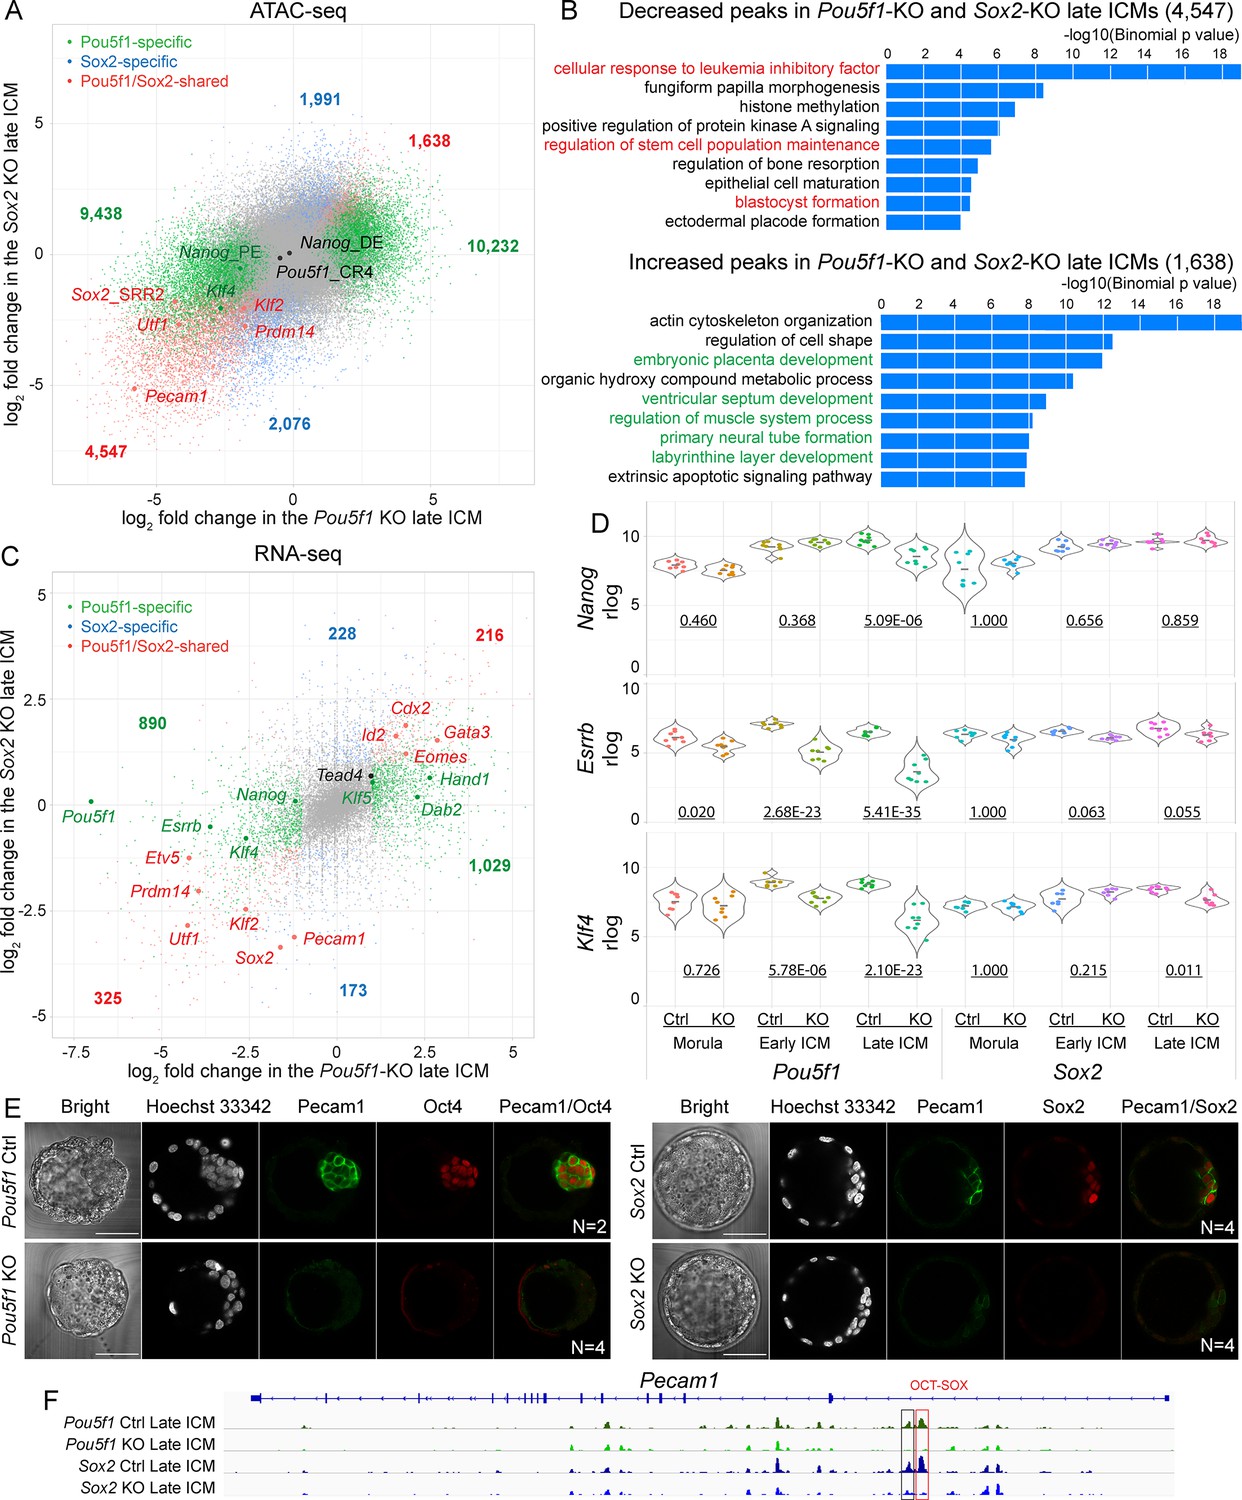
Oct4 and Sox2 activate epiblast (EPI)-specific genes and suppress trophectoderm (TE)-specific genes in inner cell mass (ICM).
(A) A scatter plot shows the log2 fold change of ATAC-seq signals in the Pou5f1-KO and Sox2-KO late ICM. Colored dots represent the significantly changed peaks. Cutoff, adjusted p-value<0.05. (B) GREAT ontology enrichment analysis of the significantly changed peaks shared in the Pou5f1-KO and Sox2-KO late ICM. Red terms are related to the pluripotency and preimplantation embryonic development, and green ones are related to the development of embryonic and extraembryonic lineages in the post-implantation embryos. (C) A scatter plot shows the log2 fold changes of RNA-seq signals in the Pou5f1-KO and Sox2-KO late ICM. Cutoff, adjusted p-value<0.05 and log2 fold change≥1. (D) Violin plots of RNA-seq rlog values for Nanog, Esrrb, and Klf4 in the embryos. The underlined numbers represent the adjusted p-values. (E) Immunostaining of Pecam1 in the late blastocysts (E2.5+2 days). Scalebar, 50 μm. (F) The accessibility of putative enhancers around Pecam1 in ICMs. Boxes mark the decreased peaks and red box marks the peak with the OCT-SOX motif.
-
Figure 3—source data 1
Imaging data of embryos in panel E.
- https://cdn.elifesciences.org/articles/100735/elife-100735-fig3-data1-v1.zip
-
Figure 3—source data 2
Imaging data of embryos in panel E.
- https://cdn.elifesciences.org/articles/100735/elife-100735-fig3-data2-v1.zip
Figure 3—figure supplement 1
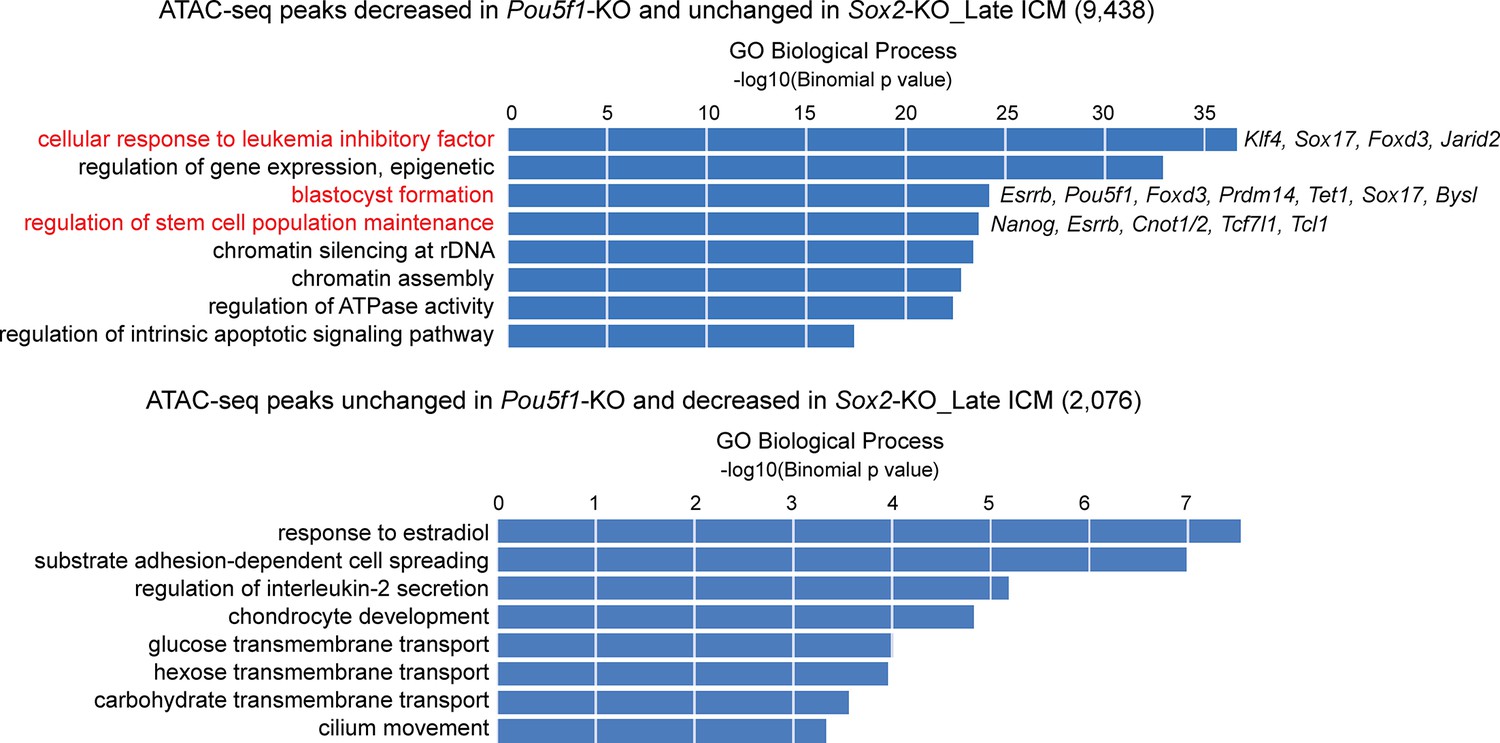
GREAT biological process enrichment analysis of ATAC-seq peaks specifically decreased in the Pou5f1-KO or Sox2-KO late inner cell masses (ICMs).
Terms highlighted in red are related to the pluripotency and preimplantation embryonic development. Example genes of associated peaks are listed.
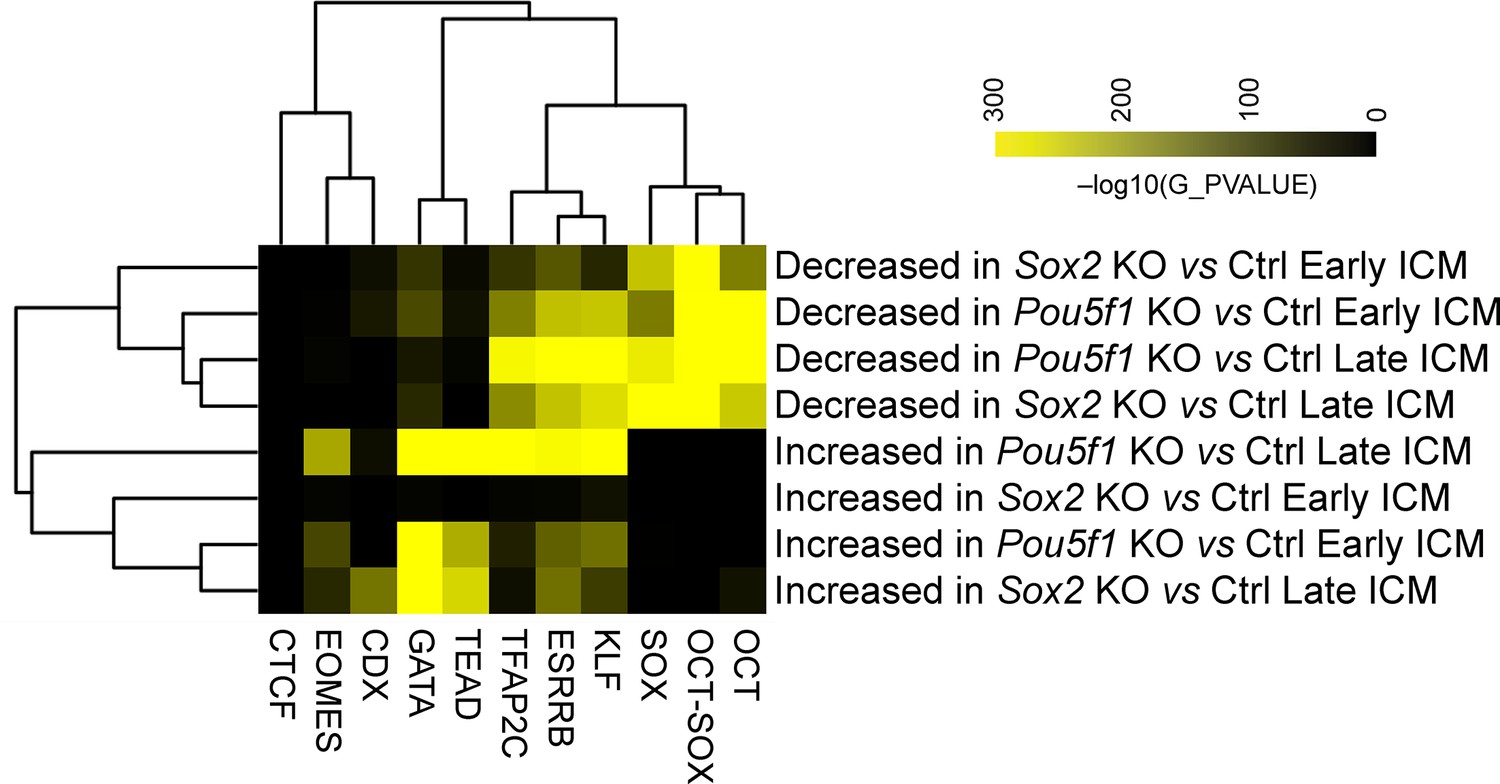
Figure 4 with 2 supplements
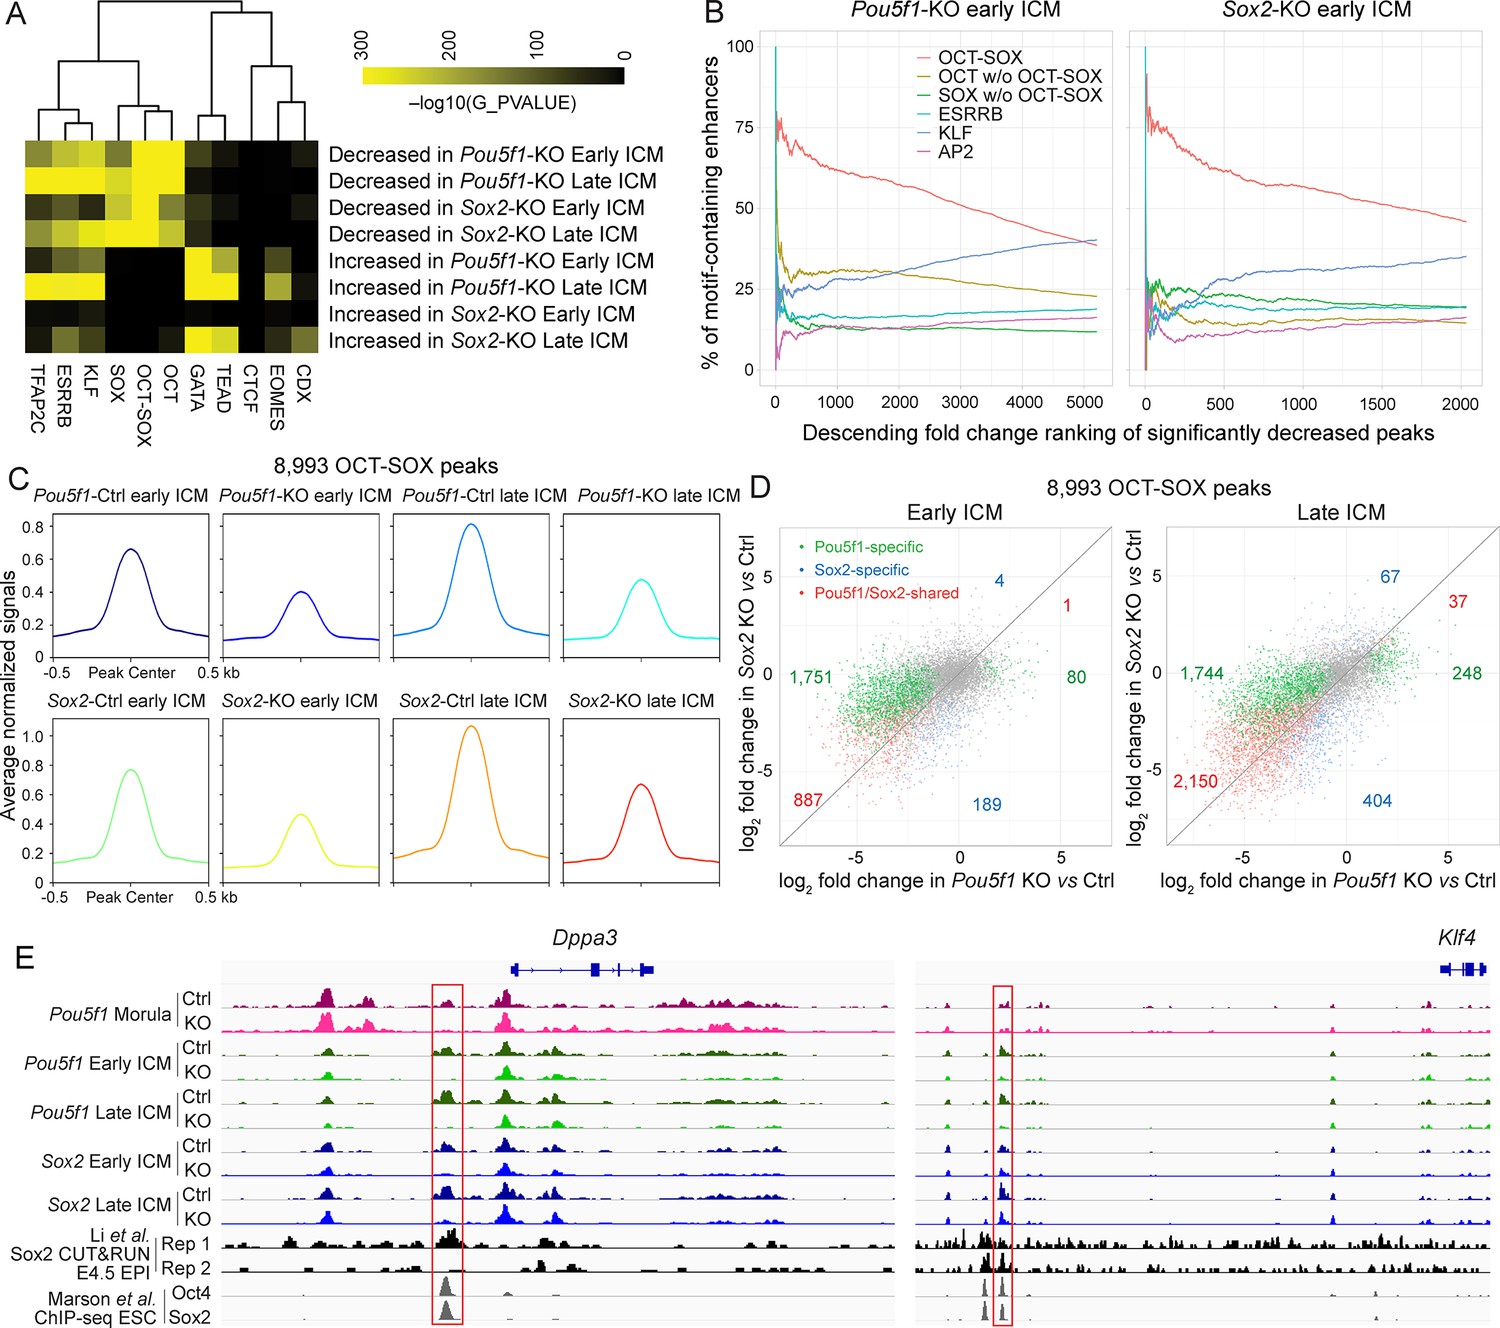
Oct4 and Sox2 activate OCT-SOX enhancers cooperatively and independently in inner cell mass (ICM).
(A) Motif enrichment analysis of significantly changed ATAC-seq peaks in the Pou5f1-KO and Sox2-KO ICMs. (B) Occurrence of the motifs in the ranked peaks. The decreased enhancers were ranked by the fold reduction. The cumulative percentages of peaks containing at least one sequence for a given motif are plotted against ranks of peaks. (C) Average profiles of the 8993 OCT-SOX peaks across all the Ctrl and KO ICM samples. (D) Scatter plots show the log2 fold change of 8993 OCT-SOX peaks in the Pou5f1- and Sox2-KO late ICMs. (E) The profiles of ATAC-seq in early embryos, Sox2 CUT&RUN in E4.5 EPI (Li et al., 2023), and Oct4 and Sox2 ChIP-seq in embryonic stem cells (ESCs) (Marson et al., 2008) around the known OCT-SOX enhancers of Klf4 and Dppa3. The red boxes mark the OCT-SOX enhancers.
Figure 4—figure supplement 1
Motif enrichment analysis of significantly changed ATAC-seq peaks that are distal to transcription start sites (TSSs).
The values are –log10(p-value).
Figure 4—figure supplement 2
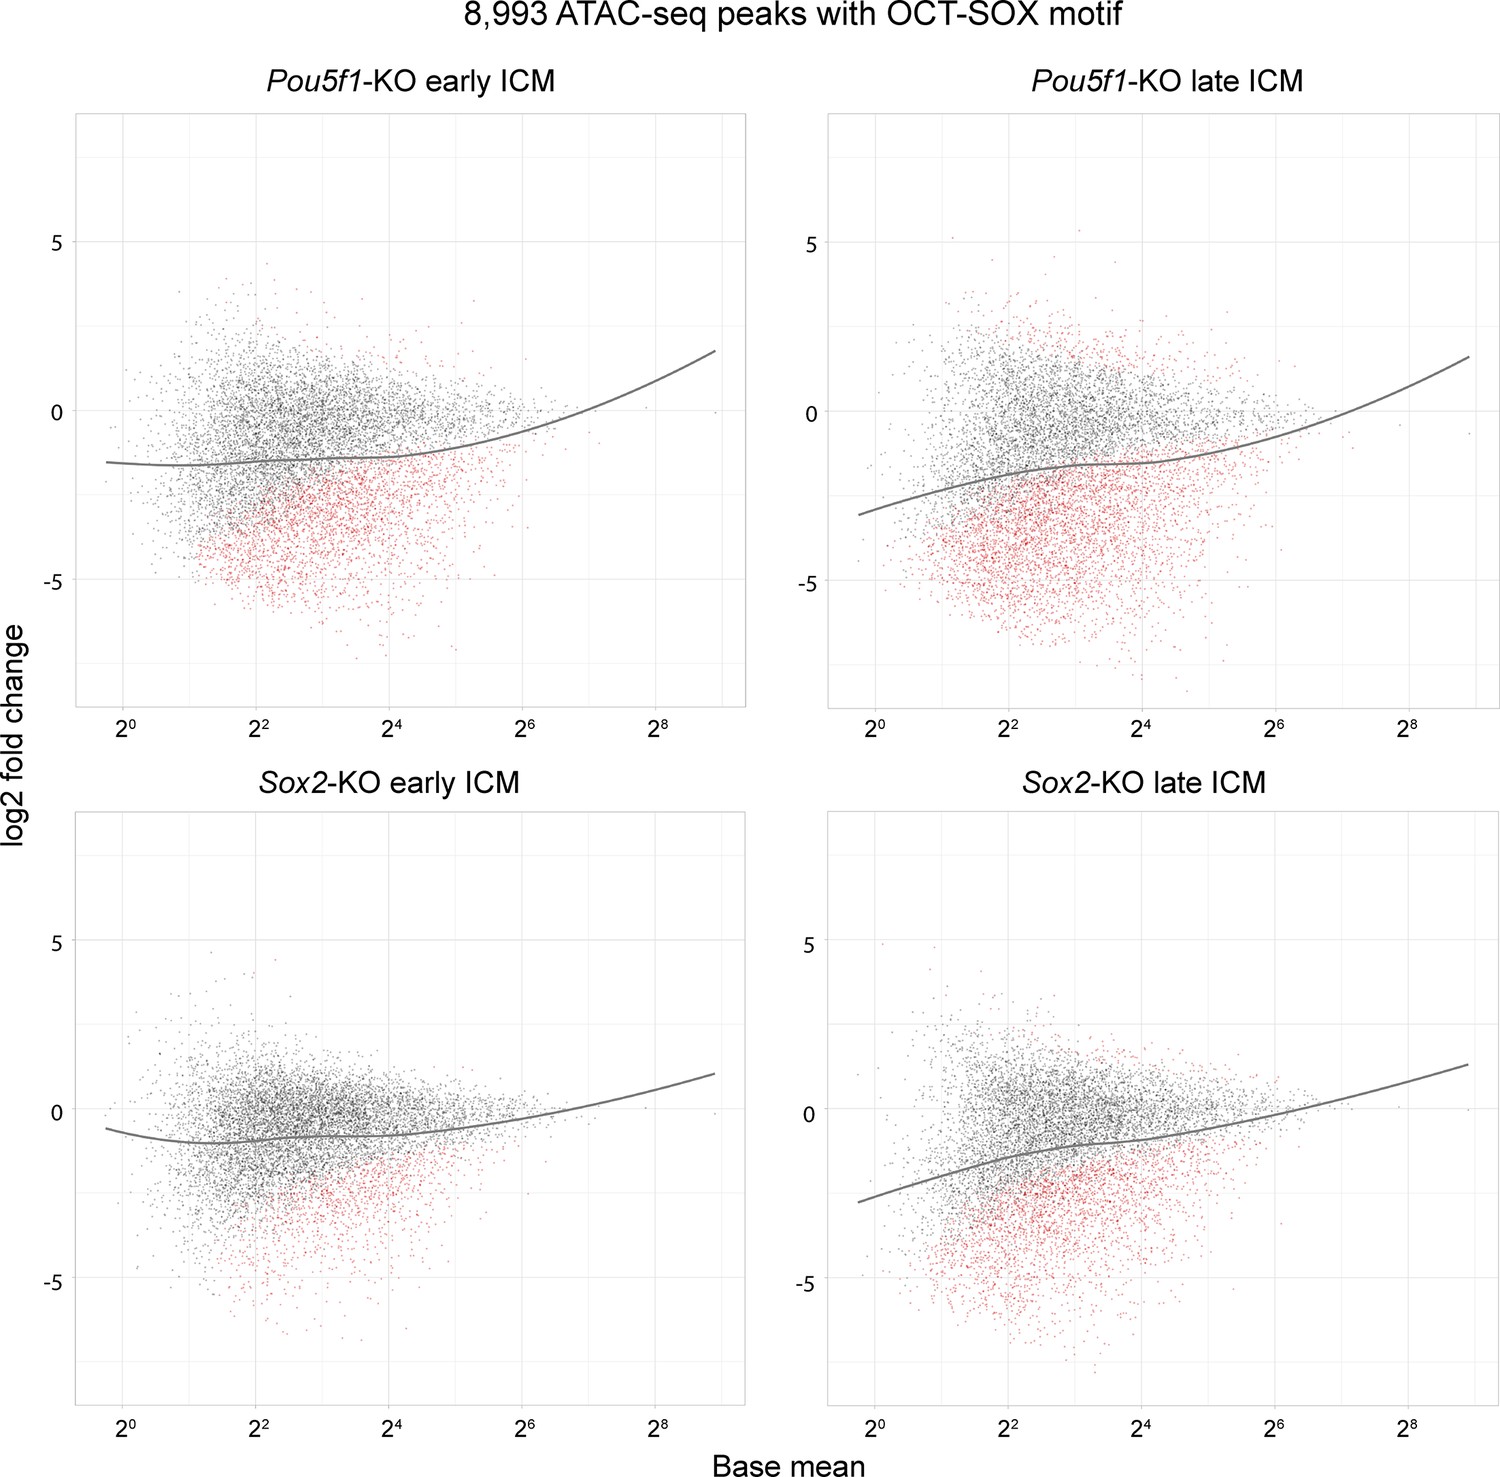
MA plots show the log2 fold change of the 8993 OCT-SOX peaks in Pou5f1- and Sox2-KO inner cell masses (ICMs).
Black and red dots represent the unchanged and significantly changed peaks, respectively. Gray lines are the regression curves of the 8993 OCT-SOX peaks.
Figure 5 with 1 supplement
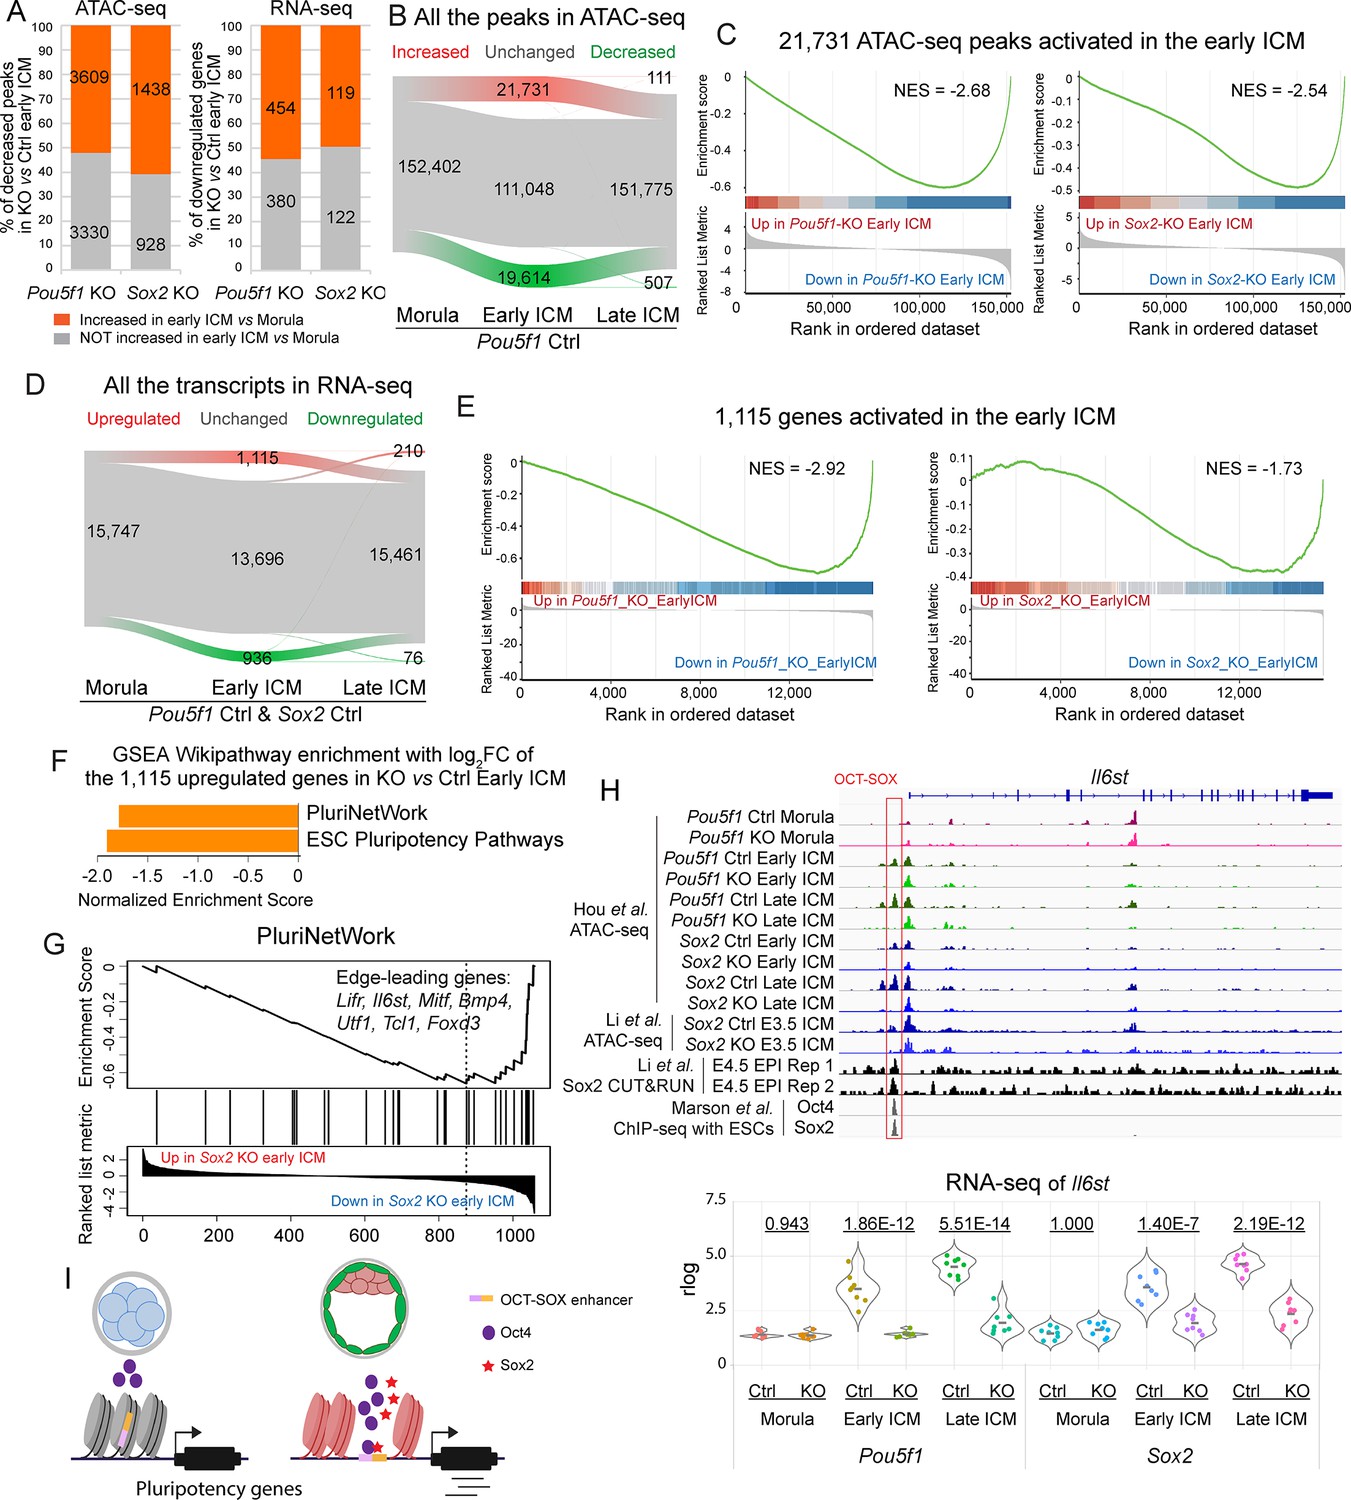
Oct4 and Sox2 promote the developmental trajectory from the morula to the inner cell mass (ICM).
(A) Bar graphs show the dynamics of the decreased peaks (left) and genes (right) in Pou5f1- and Sox2-KO early ICMs from the morula to the early ICM. (B and D) Alluvial plots show the dynamics of chromatin accessibility (B) and transcriptome (D) from morula to late ICM in the Ctrl embryos. Green, gray, and red lines represent the decreased, unchanged, and increased peaks/genes, respectively. In D, only genes significantly up- or downregulated in both Pou5f1 Ctrl and Sox2 Ctrl embryos were considered as up- or downregulated genes, while all the rest were considered as unchanged genes. (C and E) Gene set enrichment analysis (GSEA) plots show the enrichment of the 21,731 ATAC-seq peaks (C) and 1115 genes (E) in Pou5f1-KO and Sox2-KO early ICMs. NES, normalized enrichment score. (F) The bar chart illustrates the GSEA Wikipathway enrichment in WebGestalt. The log2 fold change values of the 1115 upregulated genes (D) in Sox2-KO vs Ctrl early ICM were used in this analysis. False discovery rate (FDR)≤0.05. FC, fold change. (G) GSEA enrichment plot of the term PluriNetWork in F. NES, normalized enrichment score. (H) Upper panel: IGV tracks displaying ATAC-seq and Sox2 CUT&RUN profiles (Li et al., 2023), along with ChIP-seq profiles of Oct4 and Sox2 in embryonic stem cells (ESCs) (Marson et al., 2008), centered around the genomic locus of Il6st. Red box marks the OCT-SOX enhancer. Lower panel: violin plot showing the rlog values of Il6st. The underlined numbers represent the adjusted p-values. (I) Model of the activation of pluripotency-related genes in the early embryos.
Figure 5—figure supplement 1

The dynamics of chromatin accessibility and transcriptome from morula to inner cell mass (ICM).
(A) GREAT analysis was conducted on the most prominently elevated ATAC-seq peaks in Ctrl early ICM vs Ctrl morula. A log2 fold change cutoff of >3 was applied due to the limits of GREAT analysis with fewer than 10,000 peaks. (B) Motif enrichment analysis with PScan of the increased ATAC-seq peaks in Ctrl early ICM vs Ctrl morula. Cutoff, log2 fold change>3. (C) Expression of Sox2, Pou5f1, Nanog, Esrrb, and Klf4 in morulae and ICMs (related to Figure 5). (D) Bar chart illustrating the gene set enrichment analysis (GSEA) Wikipathway enrichment in WebGestalt. The log2 fold change values of the 1115 upregulated genes (Figure 5D) in Pou5f1-KO vs Ctrl early ICM were used in this analysis. False discovery rate (FDR)>0.05. (E) Venn diagram showing the overlap between genes upregulated in early ICMs and those downregulated in Pou5f1-KO or Sox2-KO early ICMs. Pathway over-representation analysis was conducted on the genes upregulated in Ctrl early ICMs vs Ctrl Morula and downregulated in Pou5f1-KO vs Ctrl early ICM.
Author response image 1

Analysis of the published H3K27ac ChIP-seq dataset of mouse ICM at 94-96 h post hCG (B) (Liu, et al., Nat Cell Biol 2024).
A. ChIP-seq profiles of H3K27ac over the decreased, unchanged and increased ATAC-seq peaks in our Oct4-KO late ICMs. To exclude spurious peaks, only strong unchanged peaks (57,512 out of 142,096) were used in the analysis. B. IGV tracks displaying ATAC-seq and H3K27ac ChIP-seq profiles around Dppa3 and Oct4. Red boxes mark the known OCT-SOX enhancers.
Additional files
-
Supplementary file 1
Coordinates for the marked well-known enhancers in Figure 3A.
- https://cdn.elifesciences.org/articles/100735/elife-100735-supp1-v1.docx
-
Supplementary file 2
Oligos for ATAC-seq library preparation.
- https://cdn.elifesciences.org/articles/100735/elife-100735-supp2-v1.docx
-
Supplementary file 3
Oligos for RNA-seq library preparation.
- https://cdn.elifesciences.org/articles/100735/elife-100735-supp3-v1.docx
-
Supplementary file 4
DESeq2 of ATAC-seq peaks.
- https://cdn.elifesciences.org/articles/100735/elife-100735-supp4-v1.xlsx
-
Supplementary file 5
DESeq2 of RNA-seq.
- https://cdn.elifesciences.org/articles/100735/elife-100735-supp5-v1.xlsx
-
MDAR checklist
- https://cdn.elifesciences.org/articles/100735/elife-100735-mdarchecklist1-v1.docx
Download links
A two-part list of links to download the article, or parts of the article, in various formats.
Downloads (link to download the article as PDF)
Open citations (links to open the citations from this article in various online reference manager services)
Cite this article (links to download the citations from this article in formats compatible with various reference manager tools)
Emerging cooperativity between Oct4 and Sox2 governs the pluripotency network in early mouse embryos
eLife 13:RP100735.
https://doi.org/10.7554/eLife.100735.3


