Seasonal and comparative evidence of adaptive gene expression in mammalian brain size plasticity
- Department of Ecology and Evolution, Stony Brook University, United States
- Department of Psychology, Developmental and Brain Sciences Program, University of Massachusetts Boston, United States
- Max Planck Institute of Animal Behavior, Germany
- University of Konstanz, Germany
- John Jay College of Criminal Justice, United States
- Division of Medical Physics, Department of Dignostic and Interventional Radiology, University Medical Center Freiburg, Faculty of Medicine, University Freiburg, Germany
- Health Science and Technology, Aalborg University, Denmark
- Consortium for Inter-Disciplinary Environmental Research, Stony Brook University, United States
Figures
Figure 1 with 1 supplement
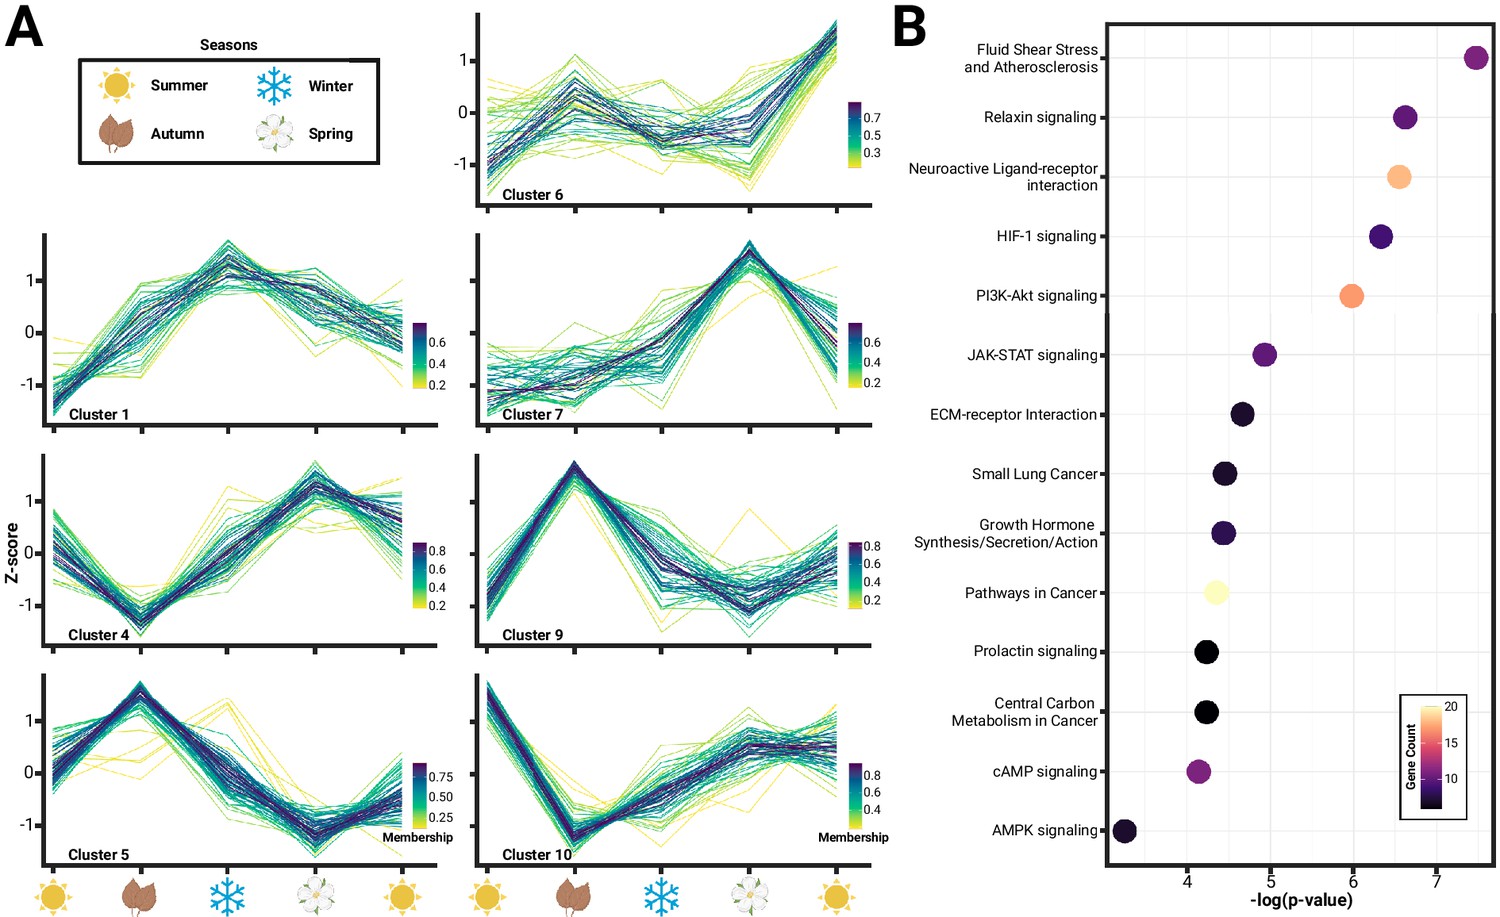
Seasonal changes in hypothalamic gene expression enriches pathways related to homeostasis.
(A) Hierarchical clustering of gene expression identified 12 distinct clusters, of which 7 clusters (Arain et al., 2013; Pucek, 1970; Pucek, 1965b; Pucek, 1965a; Keicher et al., 2017; Taylor et al., 2013; Hyvärinen, 1984) comprising of 394 genes, showed variation consistent with seasonality or Dehnel’s phenomenon. (B) Functional characterization of these genes using Kyoto Encyclopedia of Genes and Genomes (KEGG) Gene Ontology (GO) pathways found an enrichment of 14 pathways (p<0.05), many of which have been implicated in hypothalamic control of homeostatic maintenance, including relaxin signaling, neuroactive ligand-receptor interaction, HIF-1 signaling, and phosphoinositide-3 kinase (PI3K)-Akt signaling.
Figure 1—figure supplement 1
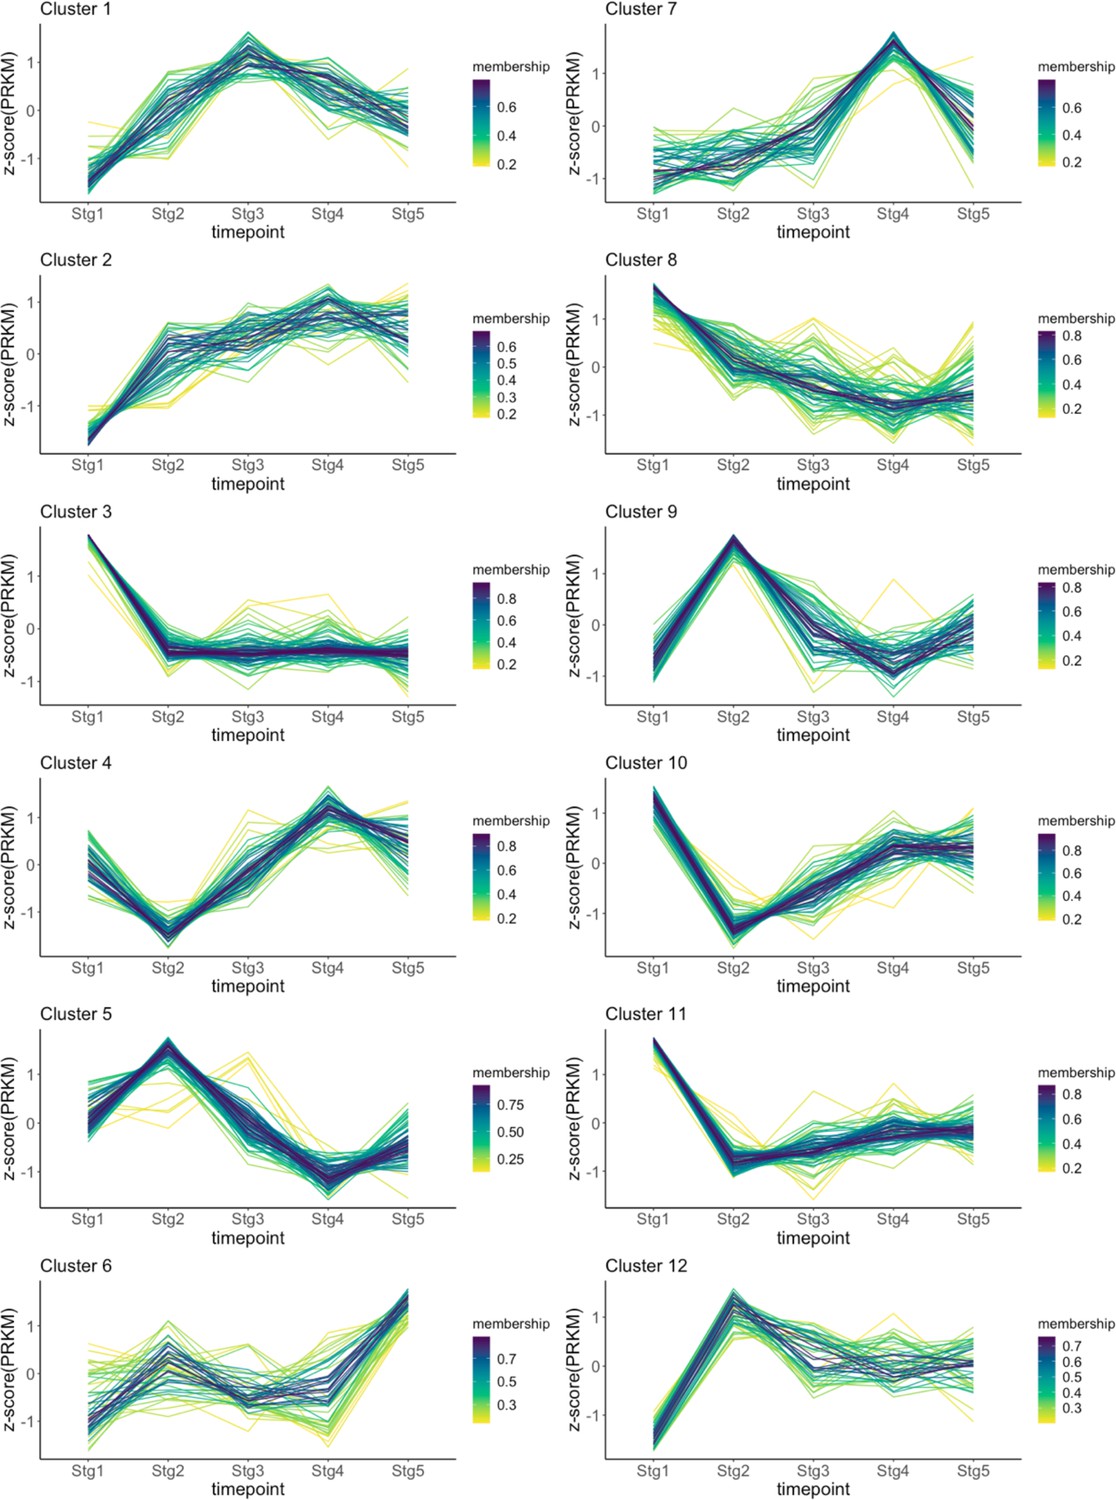
Hierarchical clustering of 786 gene expression profiles formed 12 distinct clusters in the shrew hypothalamus.
Of these 12 clusters, 5 clusters (Clusters 2, 3, 8, 11, 12) consisted of 392 genes which resembled a large expression divergence between summer juveniles and the remaining individuals. These genes show expression divergence between recently postnatal shrews and the other stages, compared to the variation found across Dehnel’s phenomenon (Clusters 1, 4, 5, 6, 7, 9, 10).
Figure 2
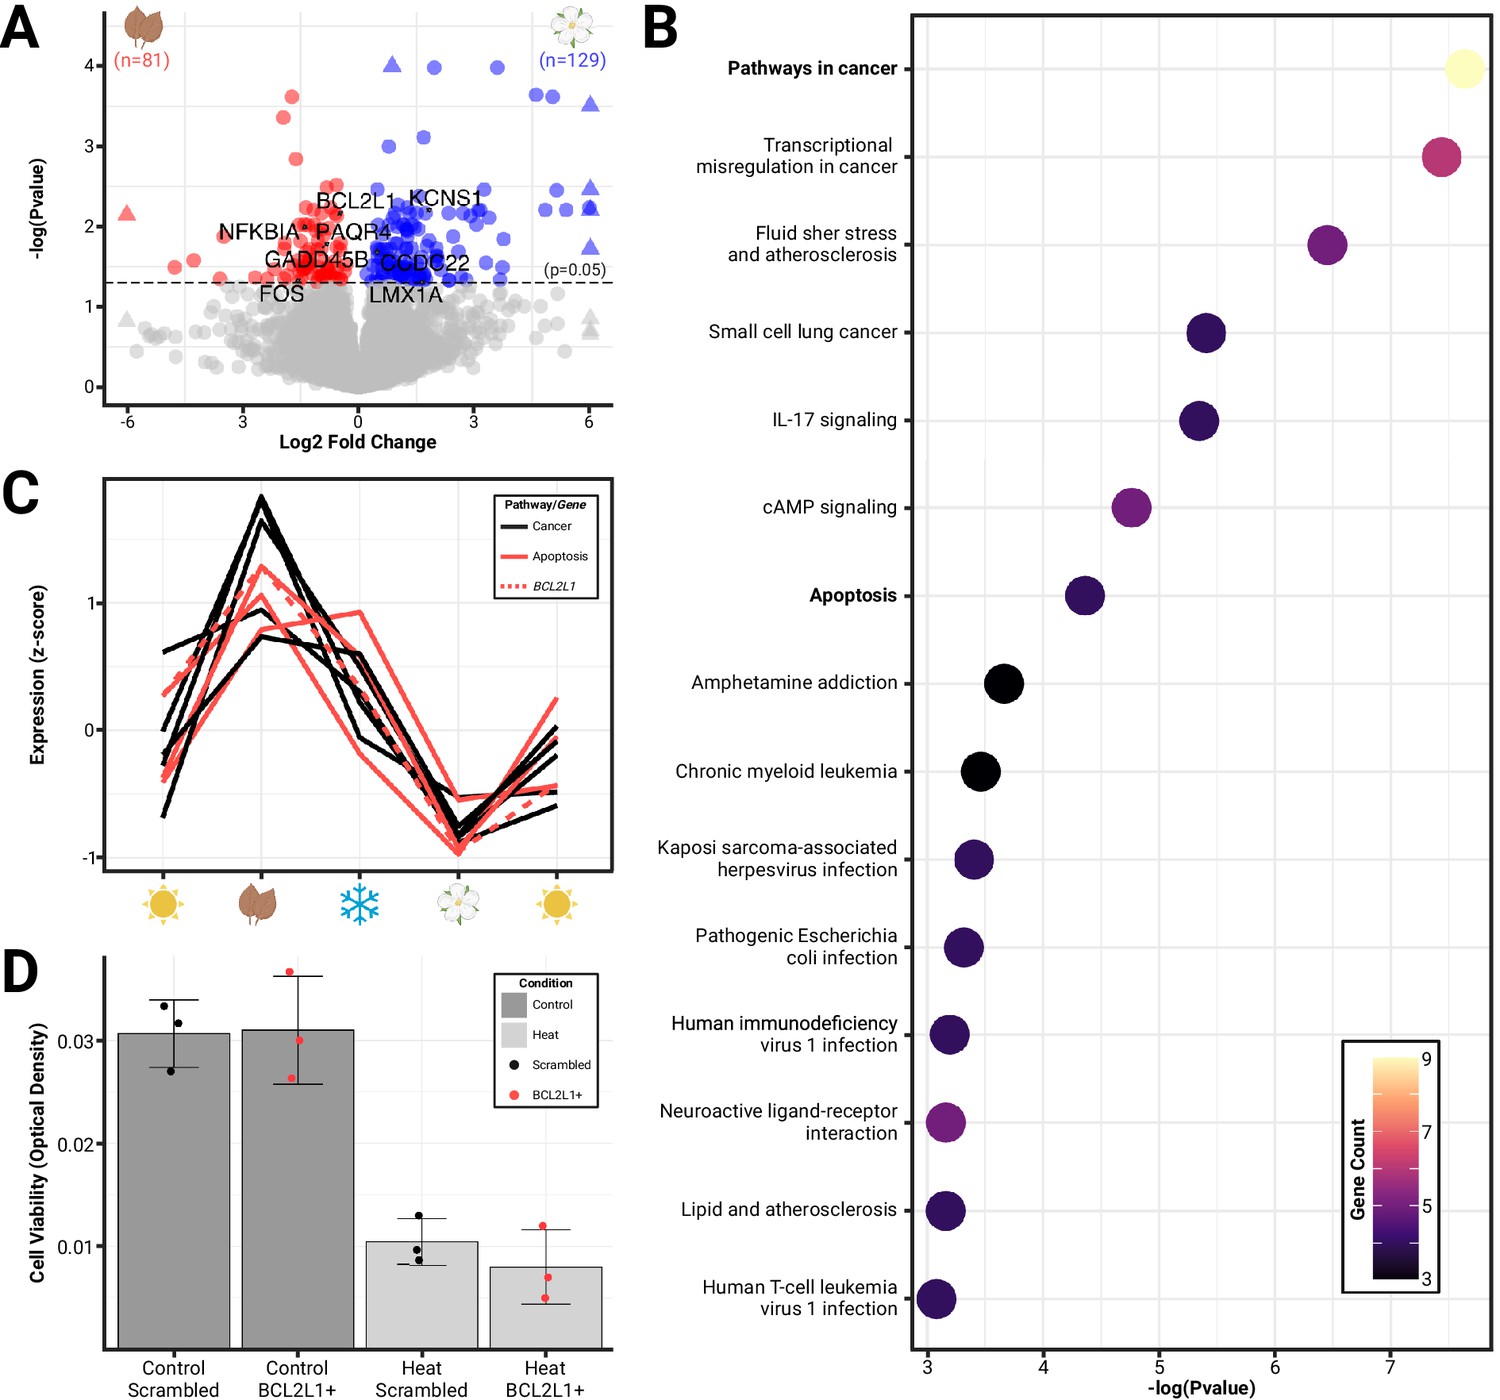
Differential gene expression reveals the roles of cellular proliferation and death in seasonal brain size changes.
(A) Volcano plot of significant (padj<0.05) differentially expressed genes (colored) between phenotypic extremes of hypothalami size change (spring vs autumn) plotted by log-fold change. (B) Pathway enrichment analysis identified 15 pathways to be enriched for differentially expressed genes, including pathways in cancer and apoptosis (downregulated). (C) Patterning of gene expression across seasons of Dehnel’s phenomenon for genes found in the cancer (all) and apoptosis (red) pathways, including BCL2L1 (dashed). (D) Cell viability of Mustela putorius furo neural cell lines exposed to four treatments: scrambled BCL2L1 overexpression (n=3), BCL2L1 overexpression (n=3), heat with scrambled BCL2L1 overexpression (n=3), and heat with BCL2L1 overexpression (n=3). Error bars represent the mean ± standard deviation. Heat significantly reduced the cell viability compared to controls but was not rescued by BCL2L1 overexpression.
Figure 3 with 1 supplement
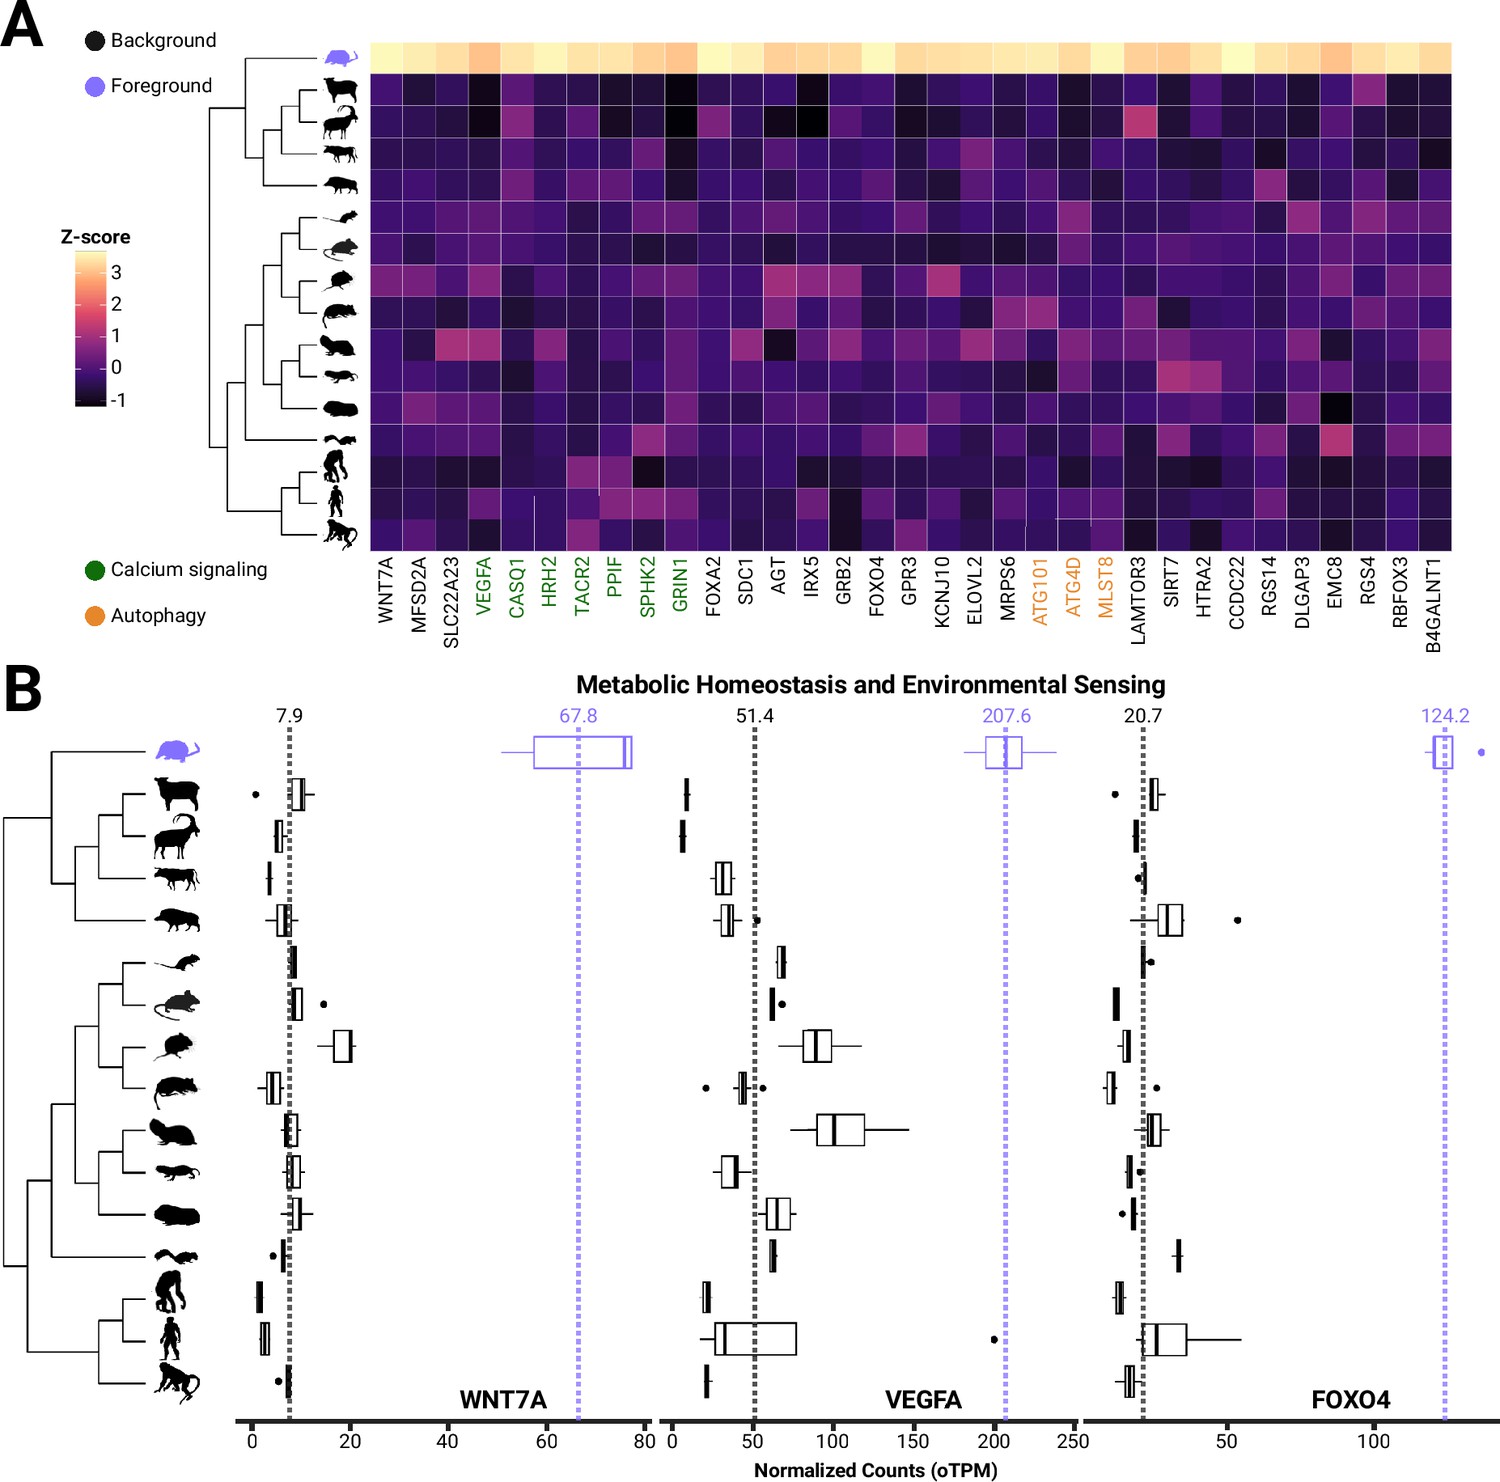
Genes involved in blood-brain barrier formation and maintenance are evolutionary upregulated in S. araneus.
(A) Heatmap and boxplots of genes with shrew-specific upregulation compared to other mammals associated with processes including calcium signaling, autophagy, neurological functions, (B) metabolic homeostasis and environmental sensing.
Figure 3—figure supplement 1
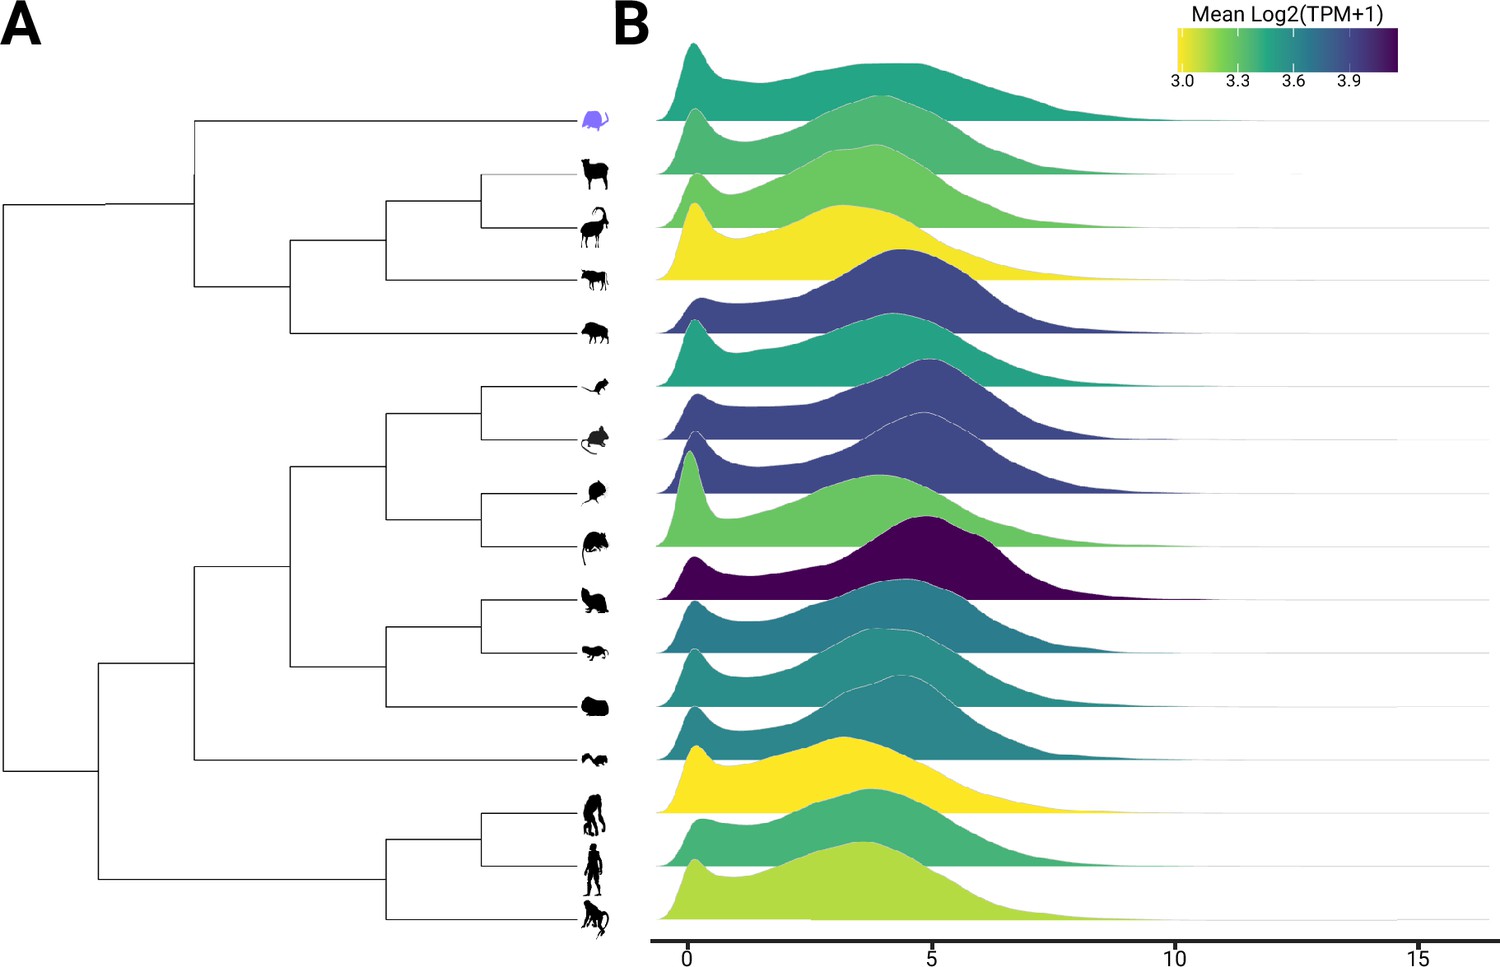
Count distribution for each species used in EVE analyses.
(A) Phylogeny used for comparative transcriptomics of the hypothalamus with (B) each species normalized count distribution of single-copy orthologs (6496 genes). Visualization shows the efficacy of normalization as each species has roughly similar distributions.
Figure 4
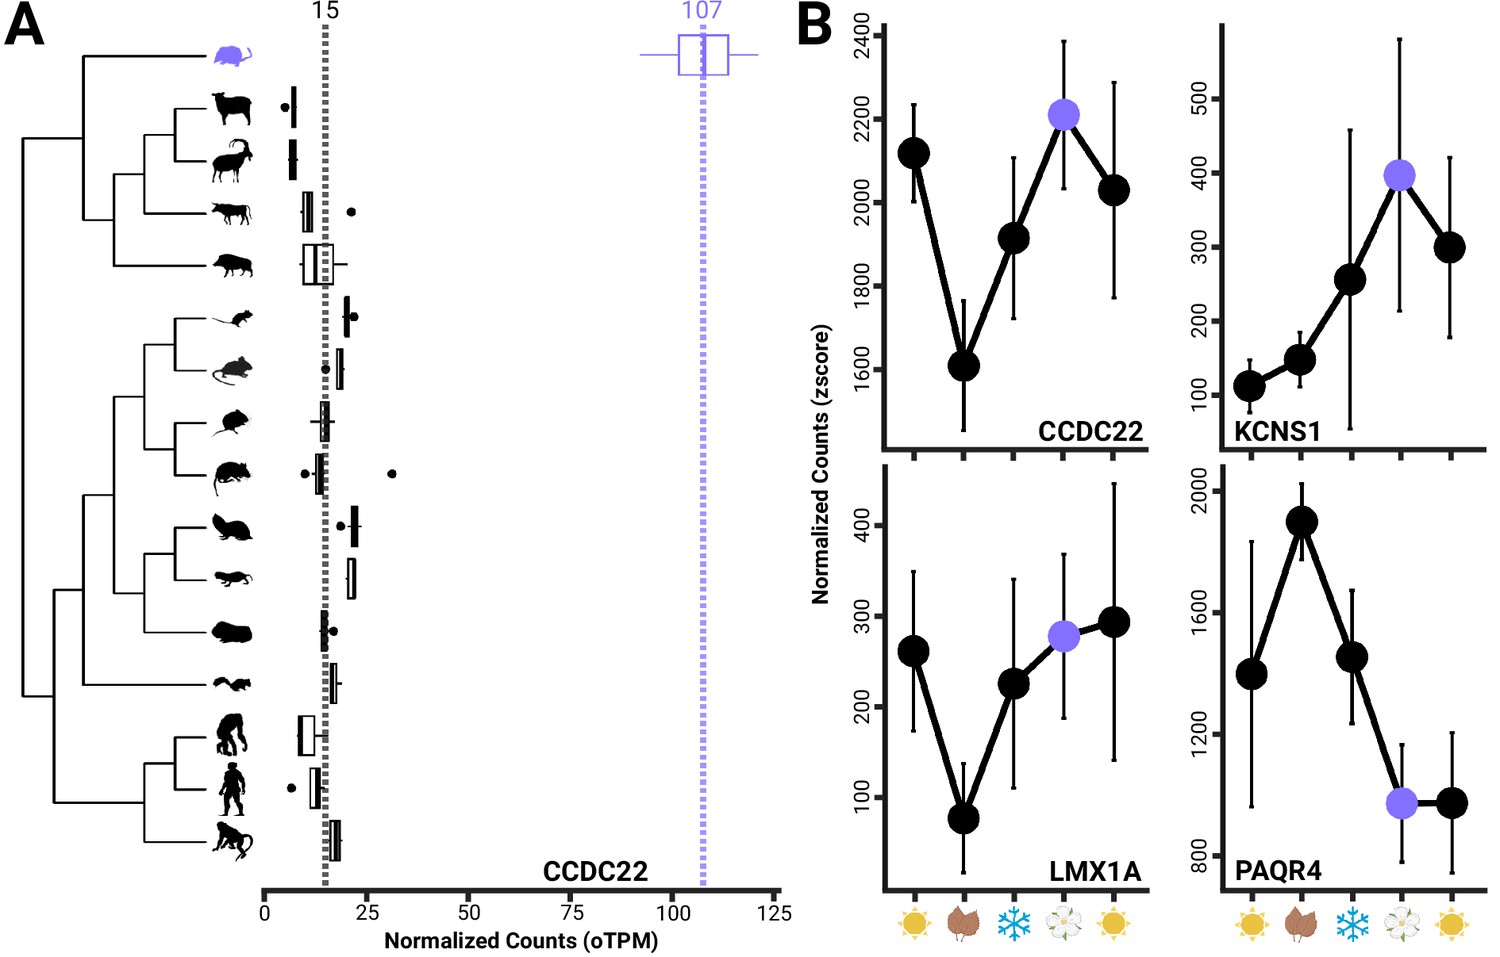
Boxplots of CCDC22 showing both evolutionary upregulation (A) in the shrew and differential gene expression between spring and autumn individuals, as found in three other genes (KCNS1, LMX1A, PAQR4) (B), which have been implicated in the development and progression of human neurological disorders.
Error bars represent the mean ± standard deviation per season.
Tables
Table 1
Significant shrew-specific upregulation of genes associated with calcium signaling pathways, blood-brain barrier (BBB) plasticity, food intake and leptin response, and other related functions.
| Gene | Function | FC | p-Value | KEGG (p<0.05) |
|---|---|---|---|---|
| WNT7A | BBB/neurogenesis/angiogenesis | 8.60 | 0.000 | NA |
| MFSD2A | Transports DHA across blood-brain barrier/fasting induced | 5.22 | 0.000 | NA |
| SLC22A23 | BBB plasticity | 4.69 | 0.000 | NA |
| VEGFA | BBB plasticity/calcium signaling | 4.04 | 0.024 | Calcium signaling |
| CASQ1 | Calcium signaling/myopathy | 7.22 | 0.000 | Calcium signaling |
| HRH2 | Calcium signaling/sleep related/histaminergic neurons | 11.74 | 0.000 | Calcium signaling |
| TACR2 | Calcium signaling | 14.21 | 0.000 | Calcium signaling |
| PPIF | Calcium signaling | 4.92 | 0.000 | Calcium signaling |
| SPHK2 | Calcium signaling/food intake | 3.18 | 0.025 | Calcium signaling |
| GRIN1 | Calcium signaling/food intake | 3.60 | 0.016 | Calcium signaling |
| FOXA2 | Food intake | 19.37 | 0.000 | NA |
| SDC1 | Food intake | 10.74 | 0.000 | NA |
| AGT | Leptin response/food intake/FOXO1 | 4.23 | 0.029 | NA |
| IRX5 | Leptin response/food intake/neurogenesis | 3.83 | 0.006 | NA |
| GRB2 | Leptin response | 3.36 | 0.003 | NA |
| FOXO4 | Leptin response | 5.99 | 0.000 | NA |
| GPR3 | Thermogenesis/obesity | 3.77 | 0.002 | NA |
| KCNJ10 | Metabolic homeostasis/tanycyte formation | 4.87 | 0.002 | NA |
| ELOVL2 | Lipid metabolism/elongation of VLFA | 6.29 | 0.001 | NA |
| MRPS6 | Mitochondria protein synthesis/Parkinson’s | 4.00 | 0.000 | NA |
| ATG101 | Autophagy | 3.95 | 0.000 | Autophagy |
| ATG4D | Autophagy | 3.84 | 0.000 | Autophagy |
| MLST8 | Autophagy/mTor pathway | 8.03 | 0.000 | Autophagy |
| LAMTOR3 | Modulates mTor pathway | 5.37 | 0.000 | NA |
| SIRT7 | Neuroprotective during neurogenesis | 4.64 | 0.004 | NA |
| HTRA2 | Aging/cell and organ size/neuroprotection | 3.86 | 0.000 | NA |
| CCDC22 | NF-KB regulation/Ritscher-Schinzel | 6.95 | 0.000 | NA |
| RGS14 | Suppressed synaptic plasticity (LTP) | 6.21 | 0.002 | NA |
| DLGAP3 | OCD | 5.72 | 0.001 | NA |
| EMC8 | Protein homeostasis of GABAnergic neurons/ER membrane complex | 3.42 | 0.021 | NA |
| RGS4 | GABAnergic/photoperiod/environmental processing | 6.81 | 0.002 | NA |
| RBFOX3 | Promotes sleep/associated with epilepsy | 7.10 | 0.000 | NA |
| B4GALNT1 | Ganglioside synthesis/Promotes BACE1 | 4.30 | 0.008 | NA |
Additional files
-
Supplementary file 1
RNA sequencing information from species collected from the NIH National Center for Biotechnology Information’s (NCBI) Sequence Read Archive datasets.
- https://cdn.elifesciences.org/articles/100788/elife-100788-supp1-v1.xlsx
-
Supplementary file 2
Kyoto Encyclopedia of Genes and Genomes (KEGG) Gene Ontology (GO) enrichment using Database for Annotation, Visualization, and Integrated Discovery (DAVID) functional annotation for each cluster identified in TCseq.
- https://cdn.elifesciences.org/articles/100788/elife-100788-supp2-v1.xlsx
-
MDAR checklist
- https://cdn.elifesciences.org/articles/100788/elife-100788-mdarchecklist1-v1.pdf
Download links
A two-part list of links to download the article, or parts of the article, in various formats.
Downloads (link to download the article as PDF)
Open citations (links to open the citations from this article in various online reference manager services)
Cite this article (links to download the citations from this article in formats compatible with various reference manager tools)
Seasonal and comparative evidence of adaptive gene expression in mammalian brain size plasticity
eLife 13:RP100788.
https://doi.org/10.7554/eLife.100788.3


