Dopamine increases protein synthesis in hippocampal neurons enabling dopamine-dependent LTP
- Department of Physiology, Development and Neuroscience, Physiological Laboratory, University of Cambridge, United Kingdom
- Neurobiology Division, MRC Laboratory of Molecular Biology, United Kingdom
Figures
Figure 1 with 1 supplement
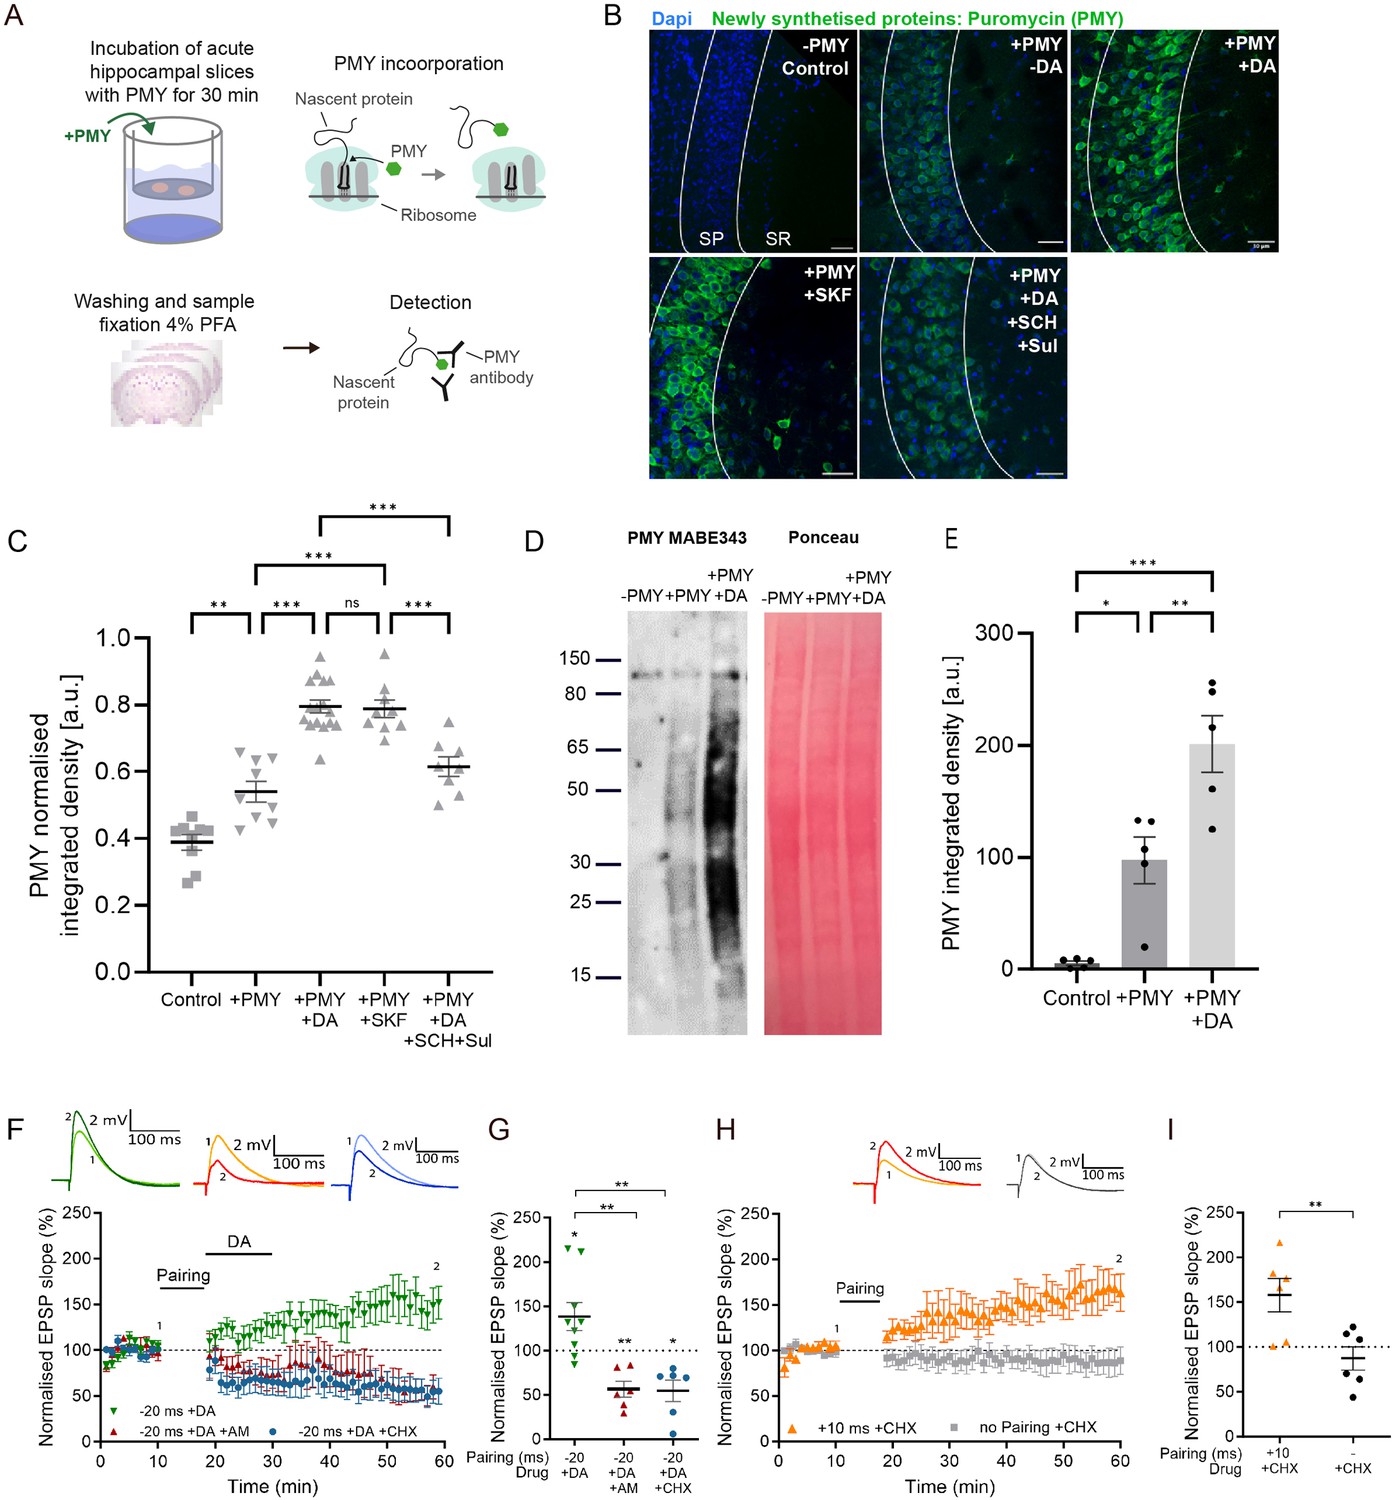
Dopamine increases protein synthesis in CA1, required for dopamine-dependent long-term potentiation (DA-LTP), but not for conventional t-LTP.
(A) Experimental workflow for protein synthesis labelling in acute hippocampal slices using a puromycilation assay. PMY=puromycin. (B) Representative images of the CA1 region of the hippocampus (SP: stratum pyramidale, SR: stratum radiatum) of puromycin-labelled proteins (green) and Dapi (blue) in the following conditions: negative control (no PMY), PMY alone, PMY +dopamine (DA), PMY+SKF38393 (SKF), and PMY+DA +SCH23390 (SCH)+sulpiride (Sul). The slices show an increase in protein synthesis after DA or SKF38393 application, which is blocked by DA receptor antagonists SCH23390 and sulpiride. Scale bar, 30 µm. (C) Summary of results. One-way ANOVA followed by Tukey’s HSD test, **, p<0.01; ***, p<0.001; ns, not significant. (D) Representative western blot of newly synthesised proteins detected by PMY Mabe343 antibody shows no signal in negative control (-PMY), and increased PMY signal in the presence of dopamine (+DA). Ponceau stain confirms equal loading of total protein. (E) Summary of results. One-way ANOVA followed by Tukey’s HSD test, *, p<0.05; **, p<0.01; ***, p<0.001. (F) Dopamine application (DA) after a post-before-pre pairing protocol (Pairing, Δt = –20ms) leads to synaptic potentiation (green trace), which is blocked by postsynaptically applied anisomycin (AM; red trace) or cycloheximide (CHX; blue trace). (G) Summary of results. t-test, **, p<0.01. (H) Intact conventional t-LTP (Δt = +10ms, orange trace) in the presence of CHX. (I) Summary of results. t-test, **, p<0.01. Traces show an excitatory postsynaptic potential (EPSP) before (1) and 40 min after (2) pairing. Plots show averages of normalised EPSP slopes ± SEM.
-
Figure 1—source data 1
Normalised EPSP slopes of all recorded cells and data points of statistics figures.
- https://cdn.elifesciences.org/articles/100822/elife-100822-fig1-data1-v1.xlsx
-
Figure 1—source data 2
Original file of the full raw uncropped, unedited western blot.
- https://cdn.elifesciences.org/articles/100822/elife-100822-fig1-data2-v1.zip
-
Figure 1—source data 3
Uncropped western blot with the relevant bands labelled.
- https://cdn.elifesciences.org/articles/100822/elife-100822-fig1-data3-v1.pdf
Figure 1—figure supplement 1
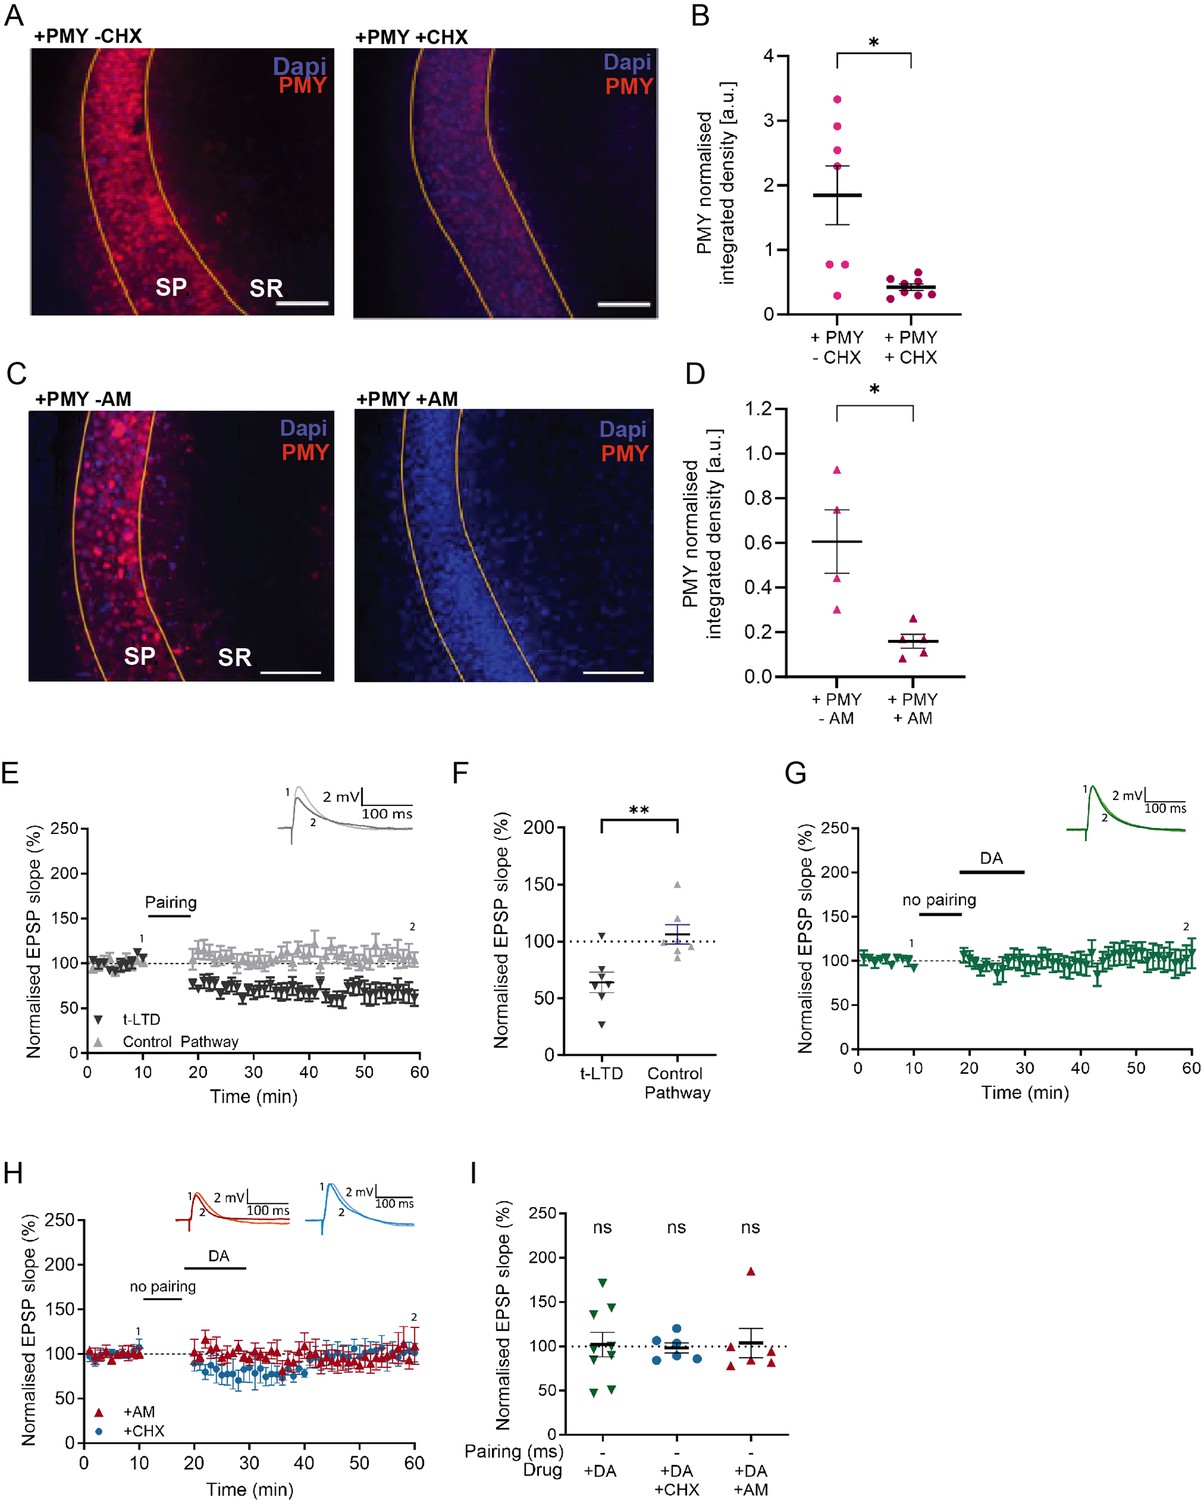
Puromycin (PMY) assay is specific to protein synthesis and protein synthesis inhibitors do not affect baseline synaptic transmission within 60 min of recording.
(A, C) Representative images of the CA1 region of the hippocampus (SP: stratum pyramidale, SR: stratum radiatum) of puromycin-labelled proteins (PMY, red) and Dapi (blue). PMY incorporation is significantly reduced in the presence of the protein synthesis inhibitors (A) cycloheximide (CHX) or (C) anisomycin (AM). Scale bar, 80 µm (B, D) Summary of results. t-test, *, p<0.05 (E), Post-before pre-pairing protocol leads to input-specific synaptic depression. Pairing protocol (Δt = -20ms) induces t-LTD (black trace) and does not affect synaptic weights in control pathway (gray trace). (F) Summary of results. (G) Dopamine application alone, without prior pairing, does not affect synaptic weights in control pathway (green trace). (H) Postsynaptically applied AM (red trace) or CHX (blue trace) does not affect synaptic weights throughout recording. Traces show an excitatory postsynaptic potential (EPSP) before (1) and 40 min after (2) pairing. Plots show averages of normalised EPSP slopes ± SEM. (I), Summary of results. t-test, ns, not significant.
-
Figure 1—figure supplement 1—source data 1
Normalised EPSP slopes of all recorded cells and data points of statistics figures.
- https://cdn.elifesciences.org/articles/100822/elife-100822-fig1-figsupp1-data1-v1.xlsx
Figure 2
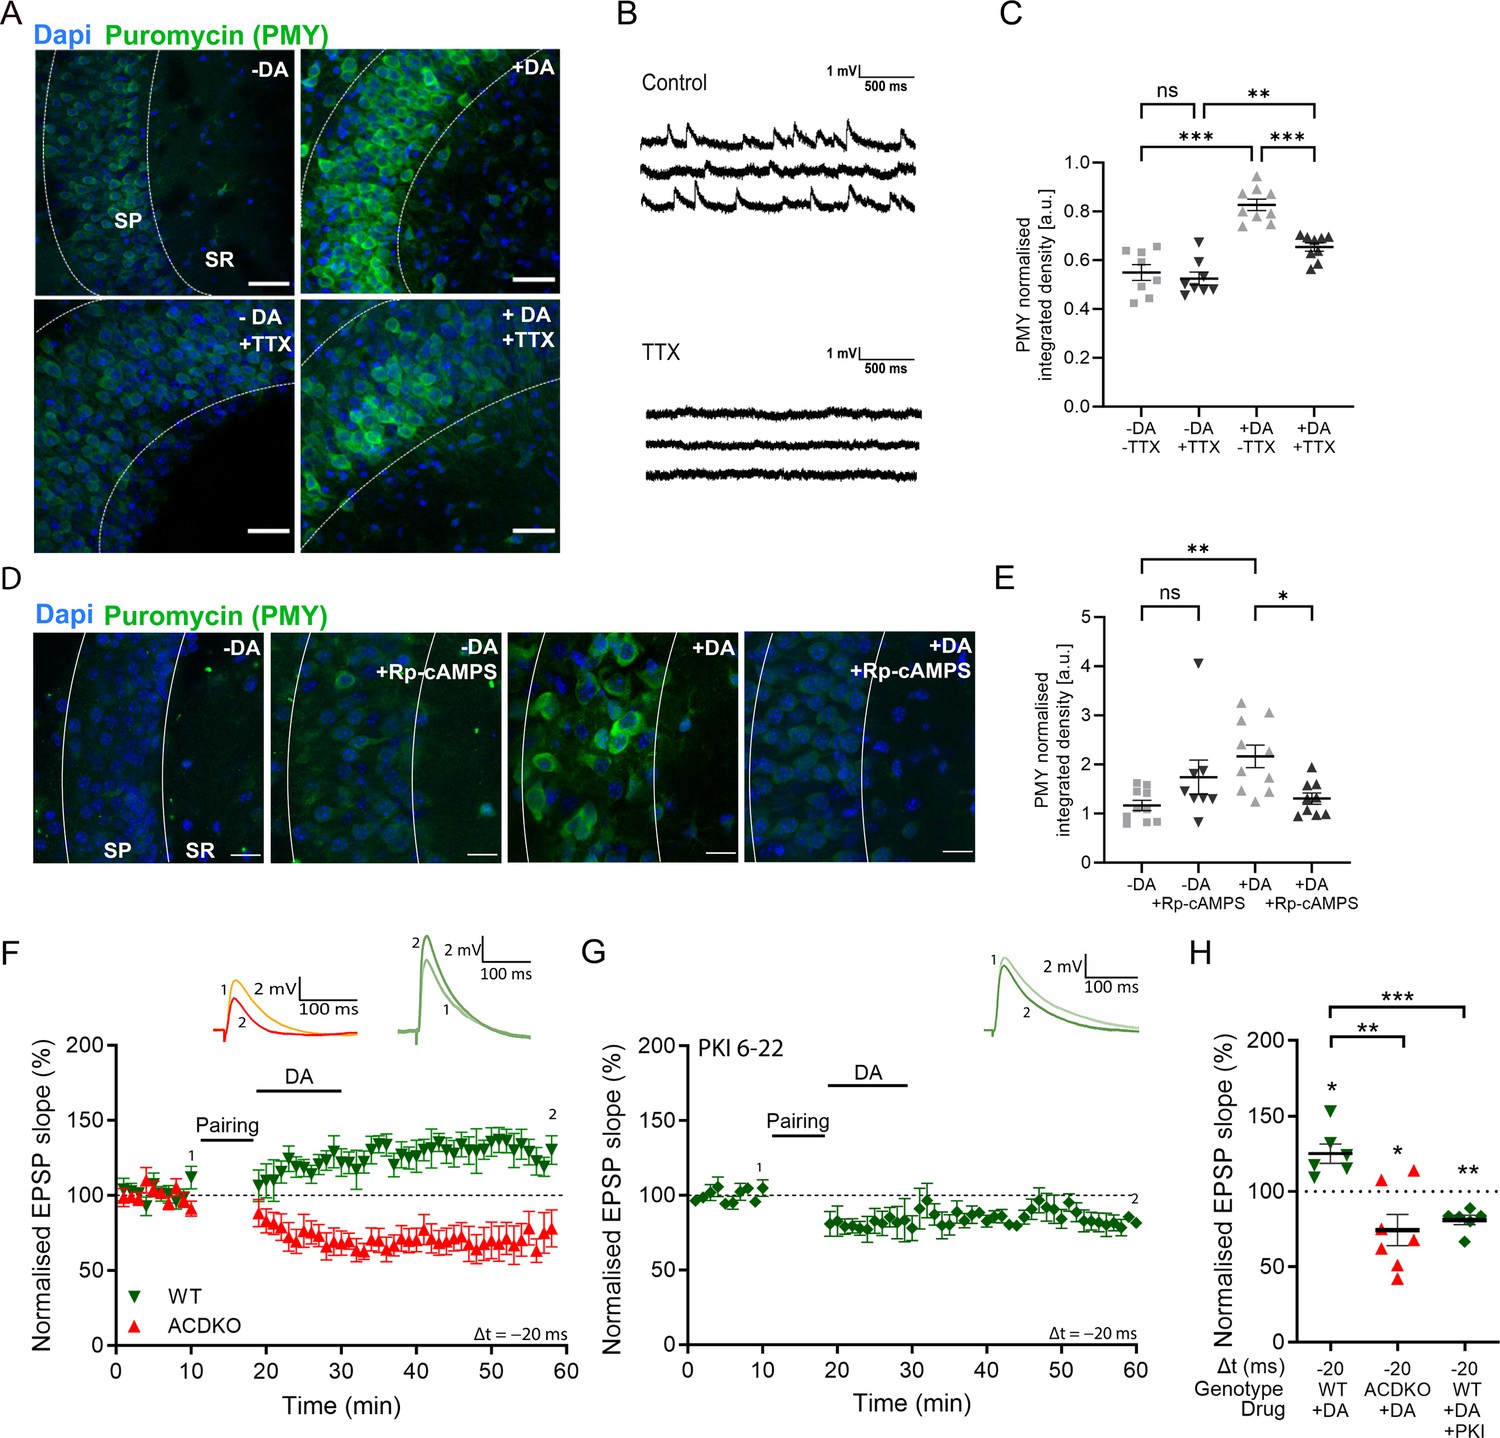
Dopamine and neuronal activity mediate increase in protein synthesis via AC1/8 and PKA enabling dopamine-dependent long-term potentiation (DA-LTP).
(A) Representative images of the CA1 region (SR: stratum oriens, SP: stratum pyramidale) of the hippocampus of puromycin (PMY)-labelled proteins in the following conditions: PMY alone (-DA), PMY +dopamine (+DA), PMY + TTX (-DA+TTX), PMY + dopamine + TTX (+DA+TTX). Images show that the dopamine-induced increase in protein synthesis is reduced in the presence of TTX. Scale bar, 30 µm. (B) TTX abolishes spontaneous activity shown in traces of whole-cell patch clamp recording. (C) Summary of results. One-way ANOVA followed by Tukey’s HSD test, **, p<0.01; ***, p<0.001; ns, not significant. (D) Representative images of the CA1 region (SR: stratum oriens, SP: stratum pyramidale) of the hippocampus of PMY-labelled proteins in the following conditions: PMY alone (-DA), PMY +Rp-cAMPS (-DA+Rp-cAMPS), PMY +dopamine (+DA), and PMY + dopamine + Rp-cAMPS (+DA + Rp-cAMPS). Images show that the dopamine-induced increase in protein synthesis is prevented by Rp-cAMPS. (E) Summary of results. One-way ANOVA followed by Tukey’s HSD test, *, p<0.05; **, p<0.01; ns, not significant. (F) Dopamine application (DA) after a post-before-pre pairing protocol (Pairing, Δt = -20ms) leads to synaptic potentiation in WT (green trace), but not in AC DKO mice (red trace). (G) Postsynaptically applied PKA inhibitor PKI6-22 blocks DA-LTP (green trace), leaving synaptic depression instead. (H) Summary of results. One-way ANOVA followed by Tukey’s HSD test, **, p<0.01; ***, p<0.001. Traces show an excitatory postsynaptic potential (EPSP) before (1) and 40 min after (2) pairing. Plots show averages of normalised EPSP slopes ± SEM.
-
Figure 2—source data 1
Normalised EPSP slopes of all recorded cells and data points of statistics figures.
- https://cdn.elifesciences.org/articles/100822/elife-100822-fig2-data1-v1.xlsx
Figure 3 with 1 supplement
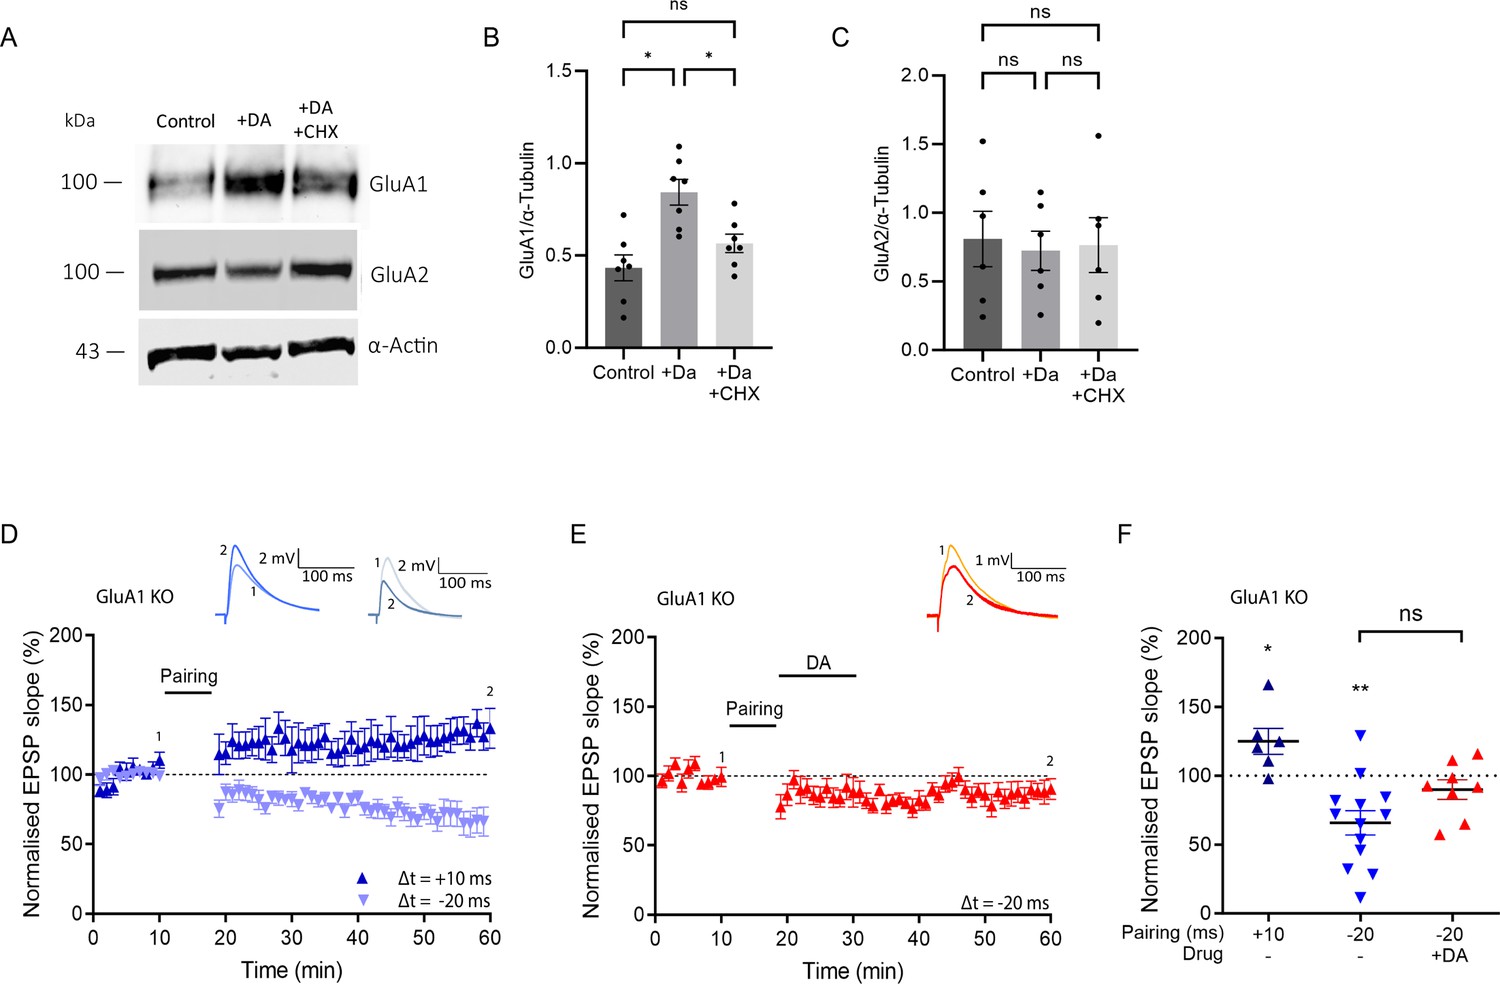
Dopamine increases GluA1 in a protein-synthesis-dependent manner, which is required for dopamine-dependent long-term potentiation (DA-LTP).
(A) Western blot images from tissue homogenates of the hippocampal CA1 region show increase in GluA1 upon dopamine application (+DA), which is abolished in the presence of cycloheximide (+DA + CHX). α-Actin was used as loading control. Western blot shows unchanged GluA2 following dopamine application (DA) and no change with cycloheximide (+DA + CHX). (B, C) Summary of results. One-way ANOVA followed by Tukey’s HSD test, *, p<0.05; ns, not significant. (D) A t-LTP pairing protocol (Δt = +10 ms) induces potentiation (dark blue trace), and a t-LTD protocol (Δt = -20 ms) induces depression (light blue trace) in GluA1 KO mice, (E) No DA-LTP in GluA1 KO mice. (F) Summary of results. All traces show an excitatory postsynaptic potential (EPSP) before (1) and 40 min after (2) pairing. Plots show averages of normalised EPSP slopes ± SEM. t-test, *, p<0.05; **, p<0.01; ns, not significant.
-
Figure 3—source data 1
Normalised EPSP slopes of all recorded cells and data points of statistics figures.
- https://cdn.elifesciences.org/articles/100822/elife-100822-fig3-data1-v1.xlsx
-
Figure 3—source data 2
Original files of the full raw uncropped, unedited western blots.
- https://cdn.elifesciences.org/articles/100822/elife-100822-fig3-data2-v1.zip
-
Figure 3—source data 3
Uncropped western blot with the relevant bands labelled.
- https://cdn.elifesciences.org/articles/100822/elife-100822-fig3-data3-v1.pdf
Figure 3—figure supplement 1
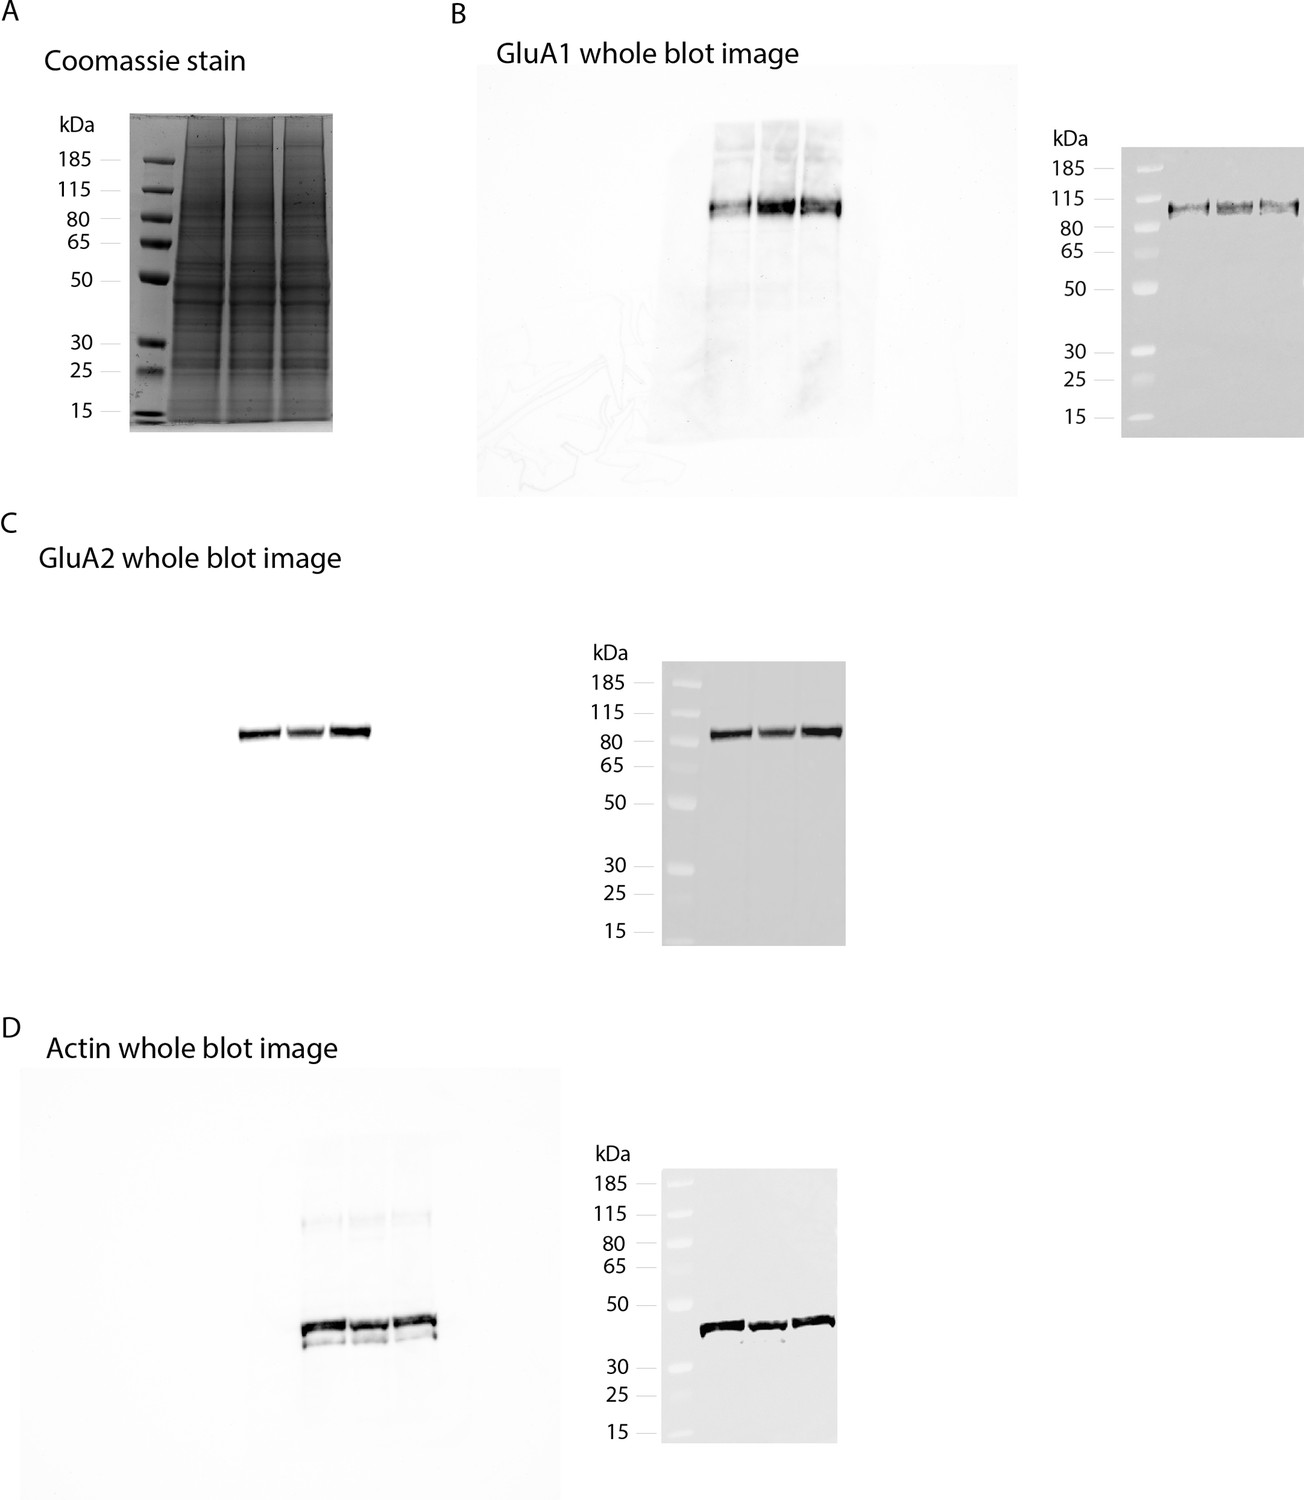
Whole blot images of western blots presented in main Figure 3.
(A) Total protein stain of whole polyacrylamide gel stained with coomassie blue as loading control. Western blot of this gel was probed for (B) GluA1, (C) GluA2, and (D) actin.
Figure 4 with 1 supplement
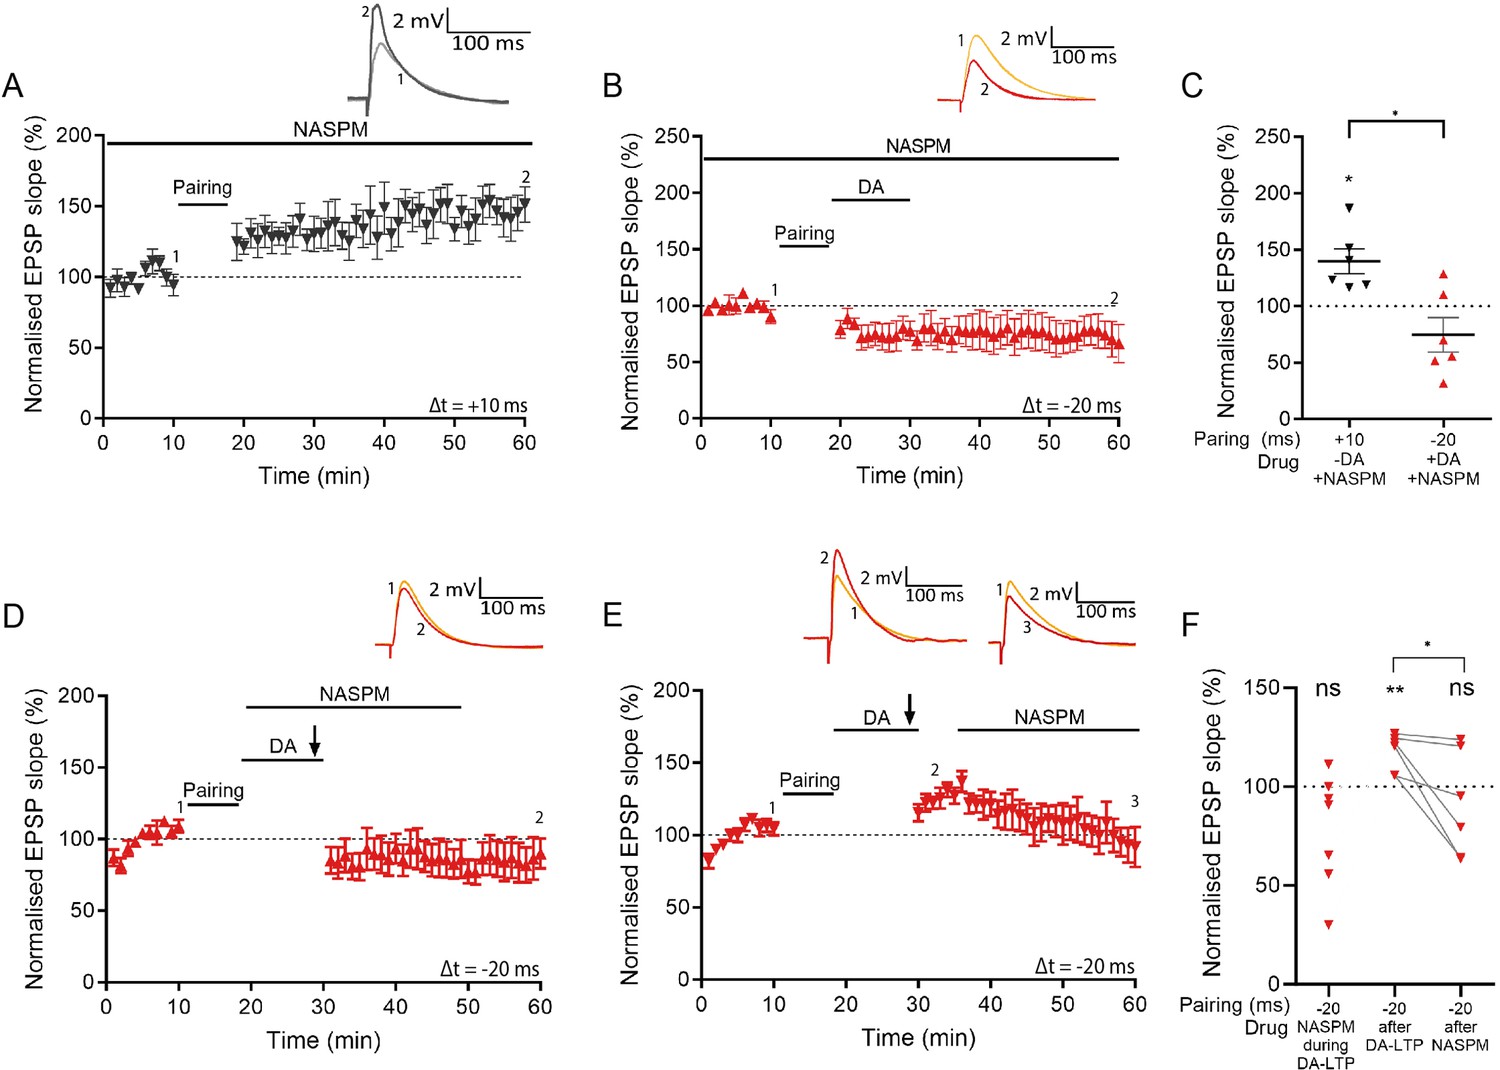
CP-AMPARs are required for dopamine-dependent long-term potentiation (DA-LTP) but not for conventional t-LTP.
(A) A t-LTP pairing protocol (Δt = +10 ms) induces synaptic potentiation in the presence of extracellularly applied 1-naphthyl acetyl spermine (NASPM). (B) NASPM blocks DA-LTP. (C) Summary of results. t-test, *, p<0.05. (D) Burst-induced DA-LTP is blocked by NASPM. (E) Burst-induced DA-LTP potentiation decreases when NASPM is applied 7 min afterwards. (F) Summary of results. t-test, *, p<0.05; **, p<0.01; ns, not significant. Traces in (A, B, and D) show an excitatory postsynaptic potential (EPSP) before (1) and 40 min after pairing (2). Traces in (E) show an EPSP before (1), 5 min after DA and burst stimulation (2), and 40 min after pairing (3). Plots show averages of normalised EPSP slopes ± SEM.
-
Figure 4—source data 1
Normalised EPSP slopes of all recorded cells and data points of statistics figures.
- https://cdn.elifesciences.org/articles/100822/elife-100822-fig4-data1-v1.xlsx
Figure 4—figure supplement 1
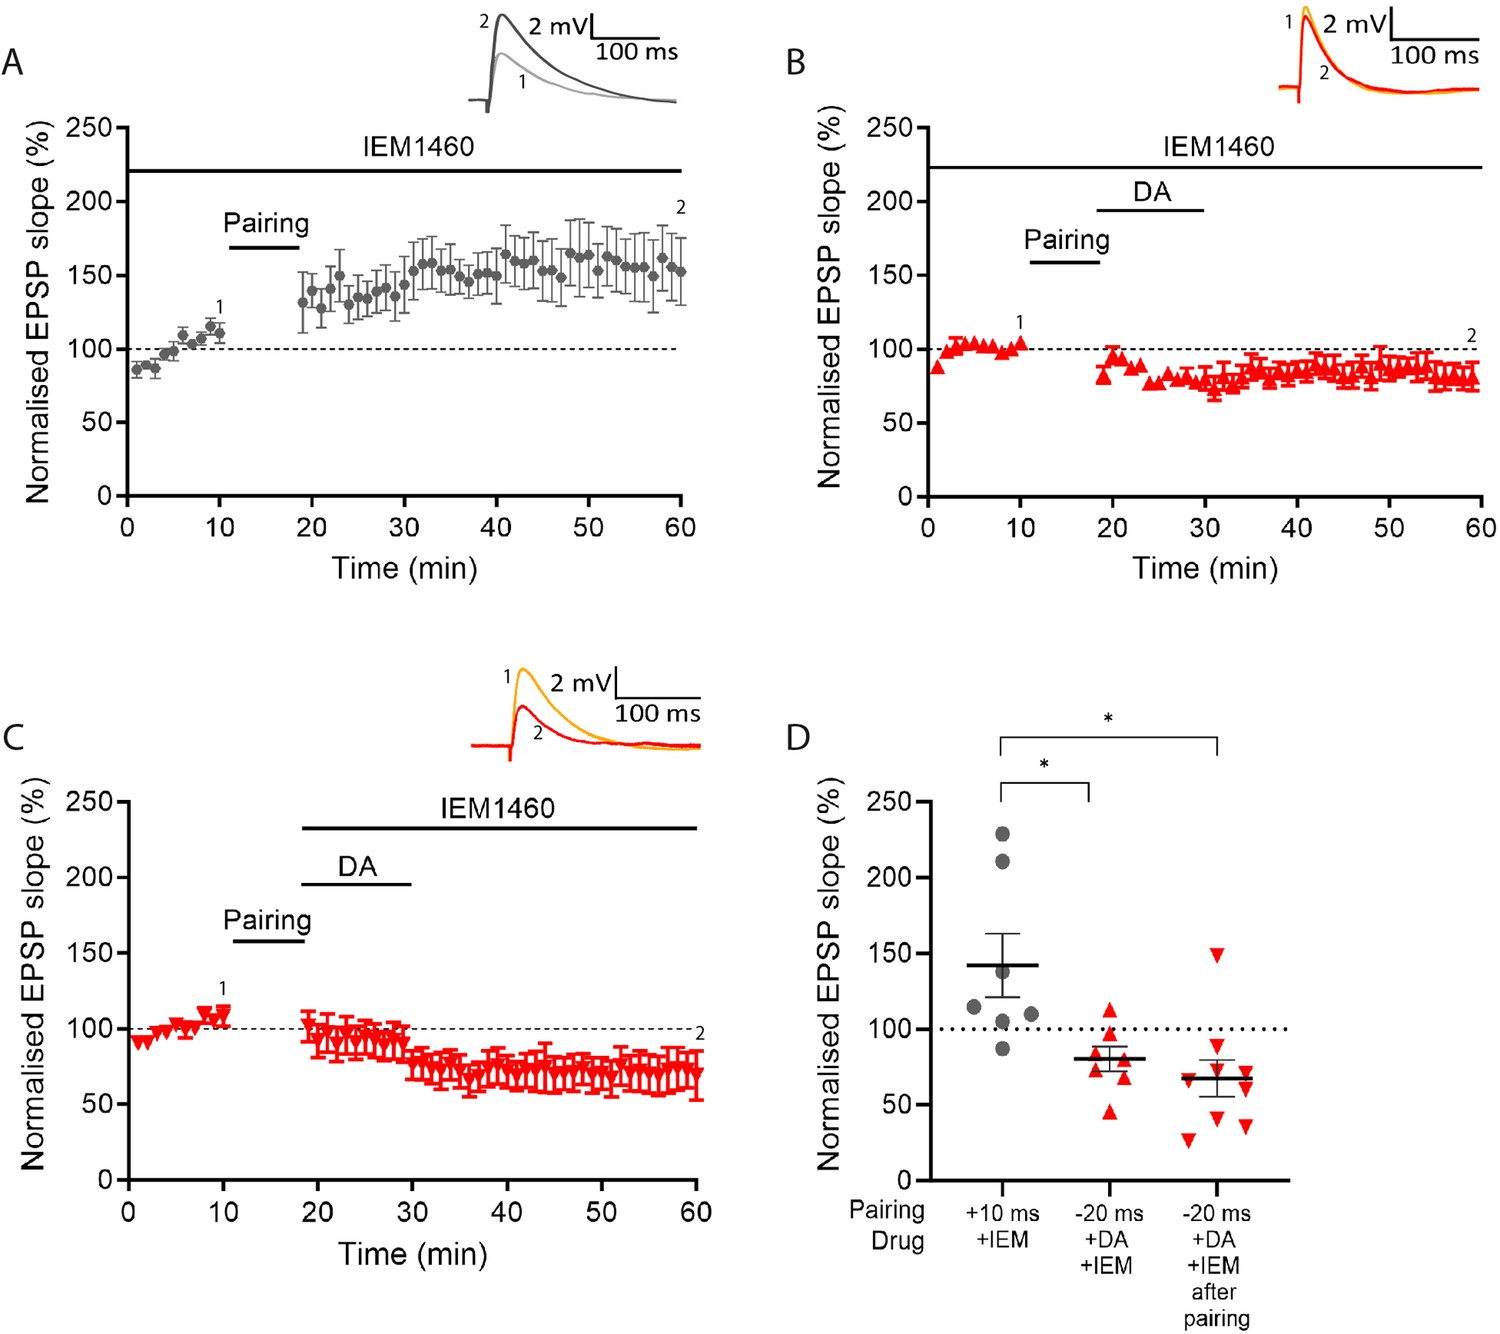
CP-AMPARs blocker IEM-1460 confirms that CP-AMPARs are required for dopamine-dependent long-term potentiation (DA-LTP) but not for conventional t-LTP.
(A) A t-LTP pairing protocol (Δt = +10 ms) induces synaptic potentiation in the presence of extracellularly applied IEM-1460. (B, C) IEM-1460 blocks DA-LTP, whether applied throughout (B) or after the pairing protocol (C). (D) Summary of results. t-test, *, p<0.05. Traces show an excitatory postsynaptic potential (EPSP) before (1) and 40 min after pairing (2). Plots show averages of normalised EPSP slopes ± SEM.
-
Figure 4—figure supplement 1—source data 1
Normalised EPSP slopes of all recorded cells and data points of statistics figures.
- https://cdn.elifesciences.org/articles/100822/elife-100822-fig4-figsupp1-data1-v1.xlsx
Additional files
Download links
A two-part list of links to download the article, or parts of the article, in various formats.
Downloads (link to download the article as PDF)
Open citations (links to open the citations from this article in various online reference manager services)
Cite this article (links to download the citations from this article in formats compatible with various reference manager tools)
Dopamine increases protein synthesis in hippocampal neurons enabling dopamine-dependent LTP
eLife 13:RP100822.
https://doi.org/10.7554/eLife.100822.3


