Simultaneous cyclin D1 overexpression and p27kip1 knockdown enable robust Müller glia cell cycle reactivation in uninjured mouse retina
- Department of Biomedical Sciences and Tung Biomedical Sciences Centre, City University of Hong Kong, China
- Ming Wai Lau Centre for Reparative Medicine, Karolinska Institutet, China
- Institute of Biomedicine, University of Eastern Finland, Finland
Figures
Figure 1 with 6 supplements
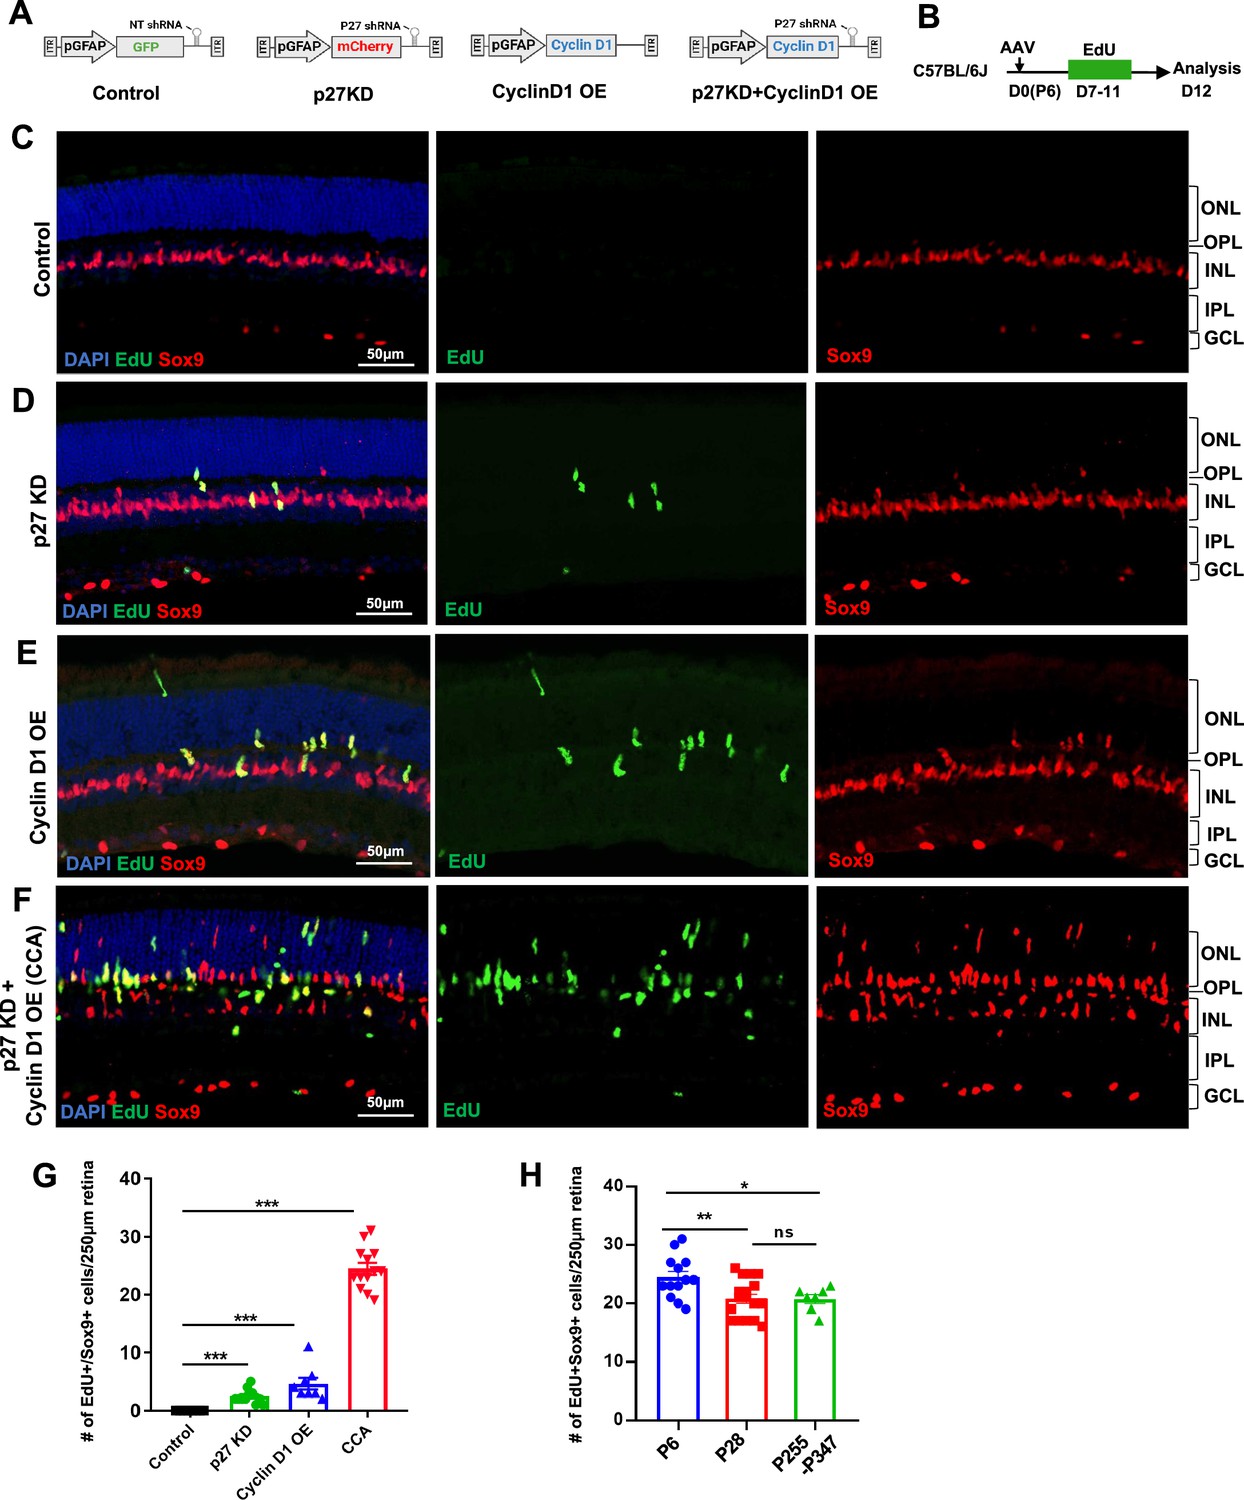
Simultaneous p27Kip1 downregulation and cyclin D1 overexpression drive robust Müller glia (MG) proliferation in the uninjured mouse retina.
(A) Schematic representations of adeno-associated virus (AAV) vectors used in this study. AAV-GFAP-GFP-non-target (NT) shRNA for control, AAV-GFAP-mCherry-p27 shRNA for p27kip1 knockdown (KD), AAV-GFAP-cyclin D1 for cyclin D1 overexpression (OE), and AAV-GFAP-cyclin D1-p27 shRNA for p27kip1 KD and cyclin D1 OE. (B) Experimental design. Mice received an intravitreal AAV injection on postnatal day 6 (P6), designated as D0, and daily 5-ethynyl-2’-deoxyurdine (EdU) injections intraperitoneally from D7 to D11. (C–F) Analysis of EdU incorporation with Sox9 co-labeling in uninjured mouse eyes injected with indicated viruses. ONL, outer nuclear layer; OPL, outer plexiform layer; INL, inner nuclear layer; IPL, inner plexiform layer; GCL, ganglion cell layer. (G) Quantification of EdU+Sox9+ cells per 250 µm high infection areas. Control (n=8 eyes), p27kip1 KD (n=11 eyes), cyclin D1 OE (n=8 eyes), CCA (n=14 eyes). (H) Quantification of EdU+Sox9 + cells per 250 µm high infection areas in retinas injected with CCA at indicated ages: P6 (n=13), P28 (n=17), and P255-P347 (n=7). Five EdU injections were given intraperitoneally from D7 to D11 post-CCA injection, and retinas were harvested for EdU analysis on D12. Data are presented as mean ± SEM. *p<0.05, **p<0.01, ***p<0.001, ns = not significant (one-way ANOVA with Tukey’s post hoc test) (G–H).
Figure 1—figure supplement 1
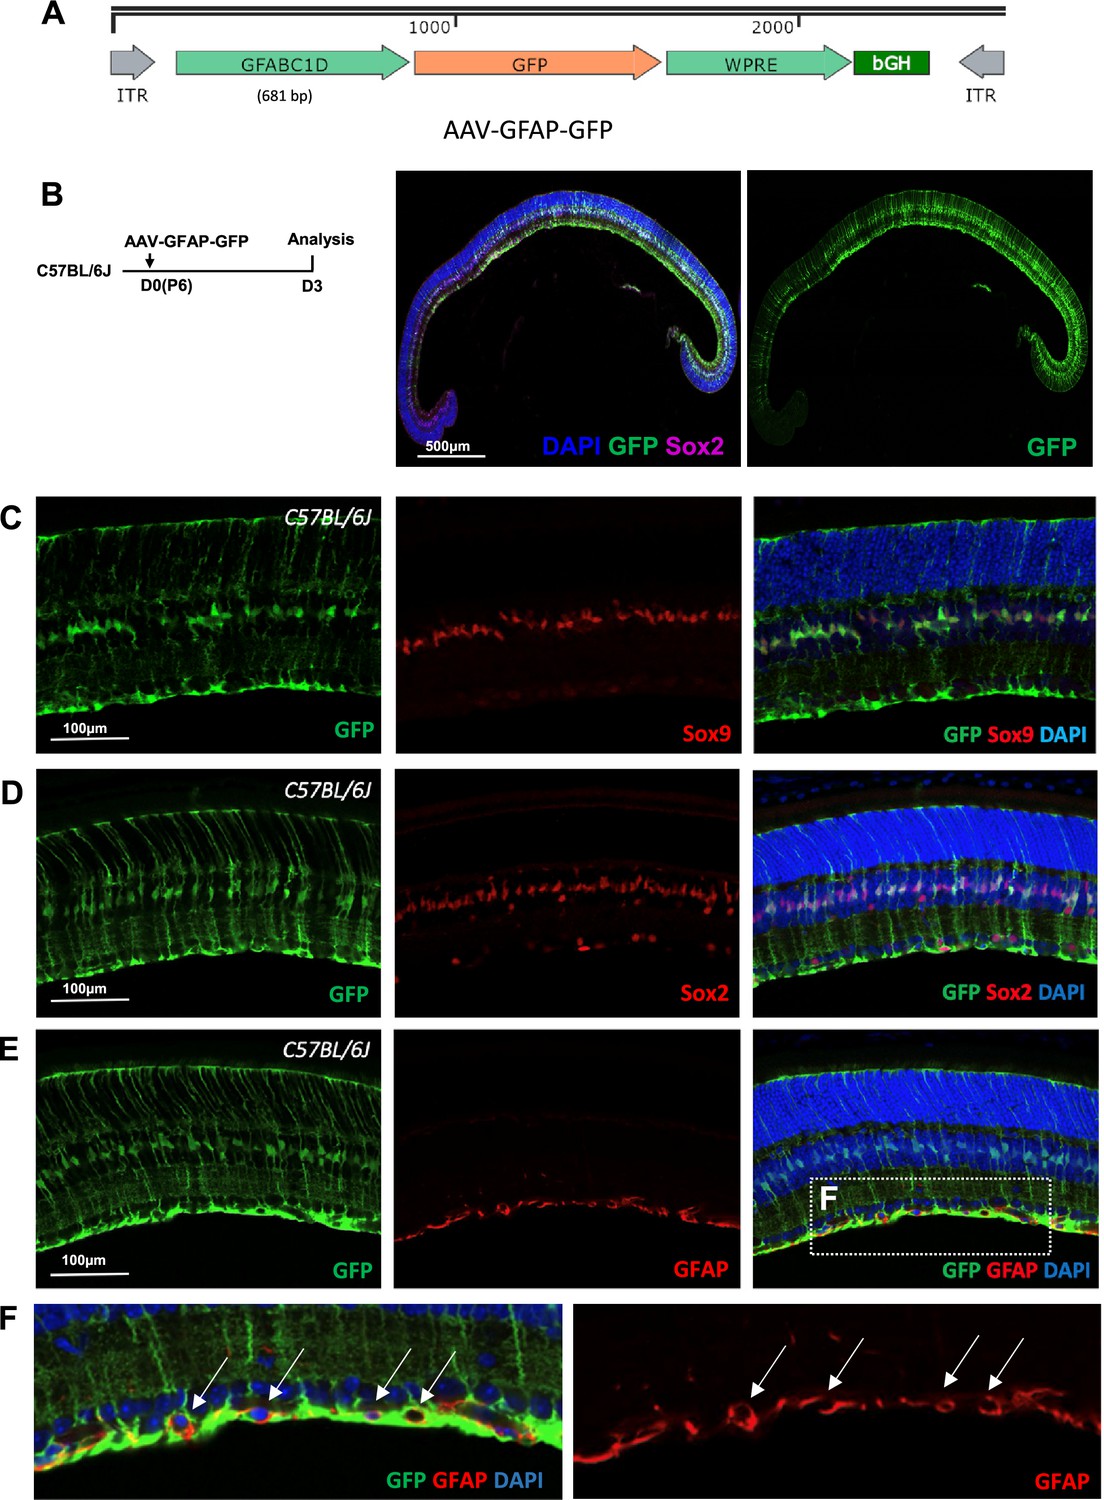
Specific GFP expression in Müller glia (MG) of mouse eyes intravitreally injected with AAV-GFAP-GFP vector.
(A) Schematic diagram of the AAV-GFAP-GFP vector genome. The promoter sequence was the GFABC1D region of human glial fibrillary acidic protein (GFAP) gene promoter. (B) Mouse retinas infected by AAV-GFAP-GFP virus via intravitreally injection on P6, and GFP expression started as early as 3 days post-injection. (C–F) Immunohistochemistry of MG marker Sox9 (C) and Sox2 (D), as well as astrocyte marker GFAP (E–F). (F) Zoomed-in image of the boxed area in E’’, illustrating that GFP+ MG end feet encircle GFAP-stained astrocytes (arrows). GFP signal and the GFAP staining did not colocalize, indicating that AAV-GFAP-GFP specifically label MG rather than astrocytes. AAV, adeno-associated virus.
Figure 1—figure supplement 2
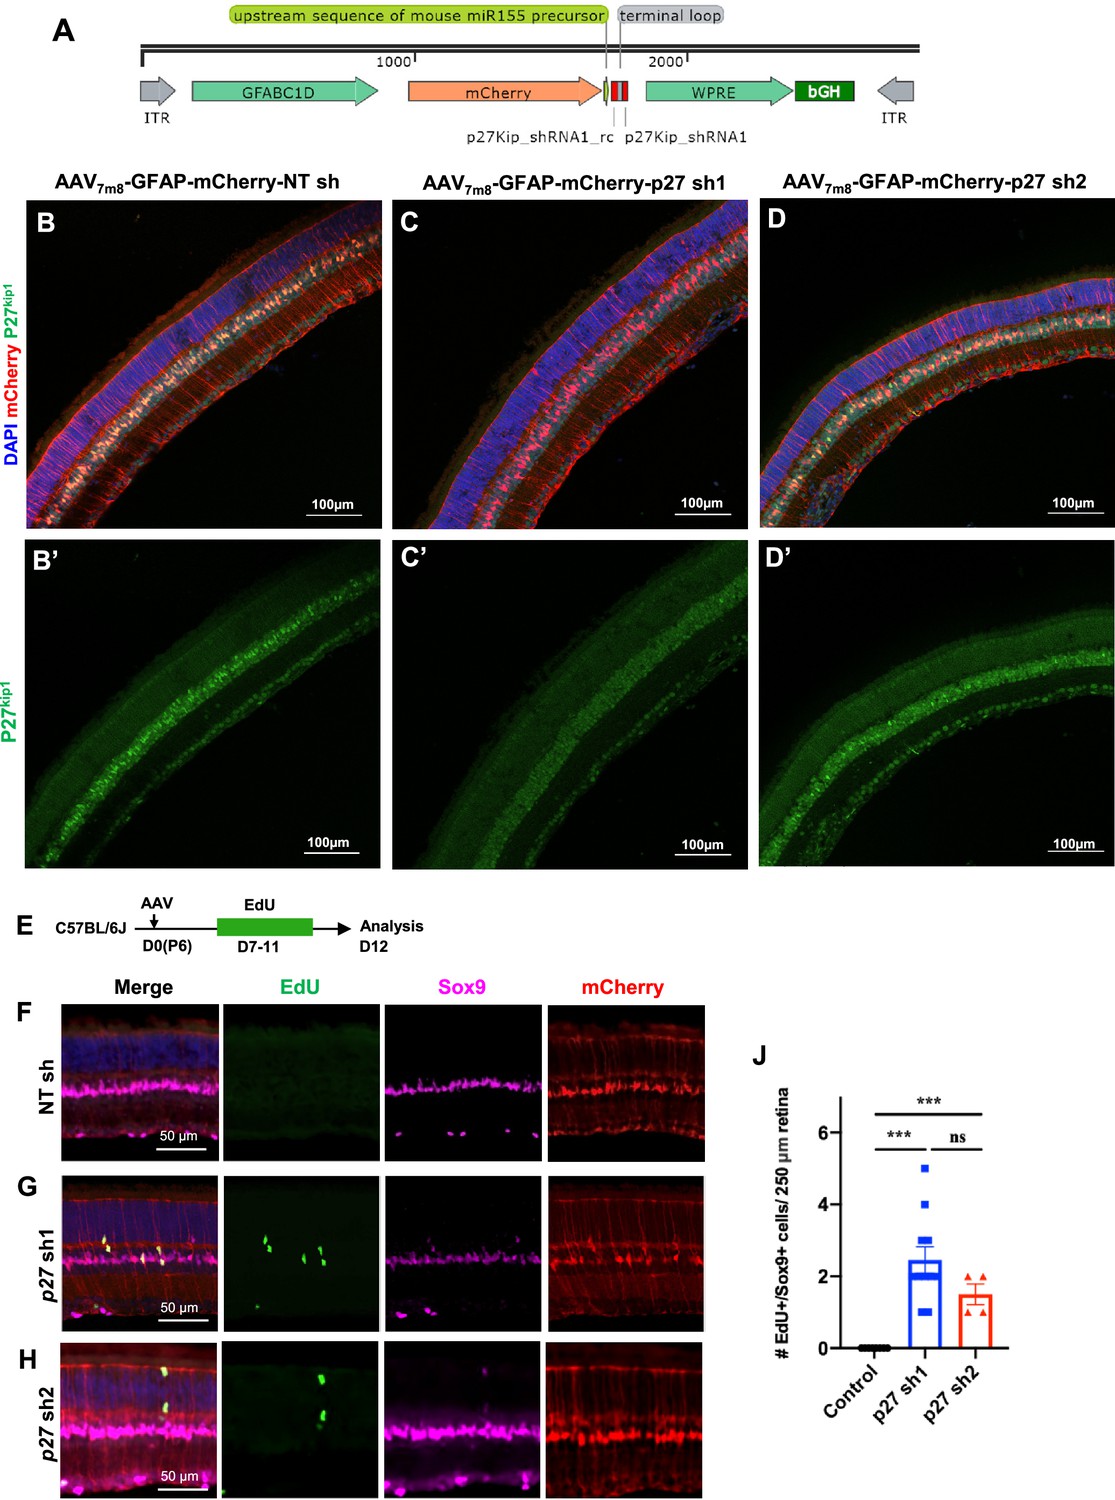
Downregulation of p27kip1 expression in Müller glia (MG) by AAV-GFAP-mCherry-p27 shRNA1/2 vector.
(A) Schematic diagram of the AAV-GFAP-mCherry-p27 shRNA vector genome. P27 shRNA was cloned in the mouse miR155 cassette and inserted in the 3’UTR of mCherry. (B–D) Immunohistochemistry for p27kip1 in retinas infected with AAV-GFAP-mCherry-NT shRNA (B), AAV-GFAP-mCherry-p27 shRNA1 (C), and AAV-GFAP-mCherry-p27 shRNA2 (D). p27 sh1 with higher p27kip1 knockdown efficiency was used in this study. (E) Experimental design of 5-ethynyl-2’-deoxyurdine (EdU) assay. (F–H) Representative images of retinas infected with various AAV vectors expressing different shRNAs. (J) Quantification of EdU+Sox9+ cells in retinas injected with AAV-NT shRNA (n=8), AAV-p27 shRNA1 (n=11), and AAV-p27 shRNA2 (n=4). Data presented as mean ± SEM. ns = not significant, ***p<0.001 (one-way ANOVA analysis with post hoc Tukey’s test). AAV, adeno-associated virus.
Figure 1—figure supplement 3

Müller glia (MG)-specific upregulation of cyclin D1 in mouse retina infected with AAV-GFAP-cyclin D1.
(A–B) Immunostaining for cyclin D1 in retinas infected with either control AAV-GFAP-GFP vector (A) or AAV-GFAP-cyclin D1 (B). (C) Western blot analysis confirming cyclin D1 overexpression in AAV-GFAP-cyclin D1-injected retinas. The retinal lysate from one mouse retina per lane. AAV, adeno-associated virus.
-
Figure 1—figure supplement 3—source data 1
PDF file containing original western blots for panel C, indicating the relevant bands and virus treatment.
- https://cdn.elifesciences.org/articles/100904/elife-100904-fig1-figsupp3-data1-v1.zip
-
Figure 1—figure supplement 3—source data 2
Original files for western blots displayed in panel C.
- https://cdn.elifesciences.org/articles/100904/elife-100904-fig1-figsupp3-data2-v1.zip
Figure 1—figure supplement 4
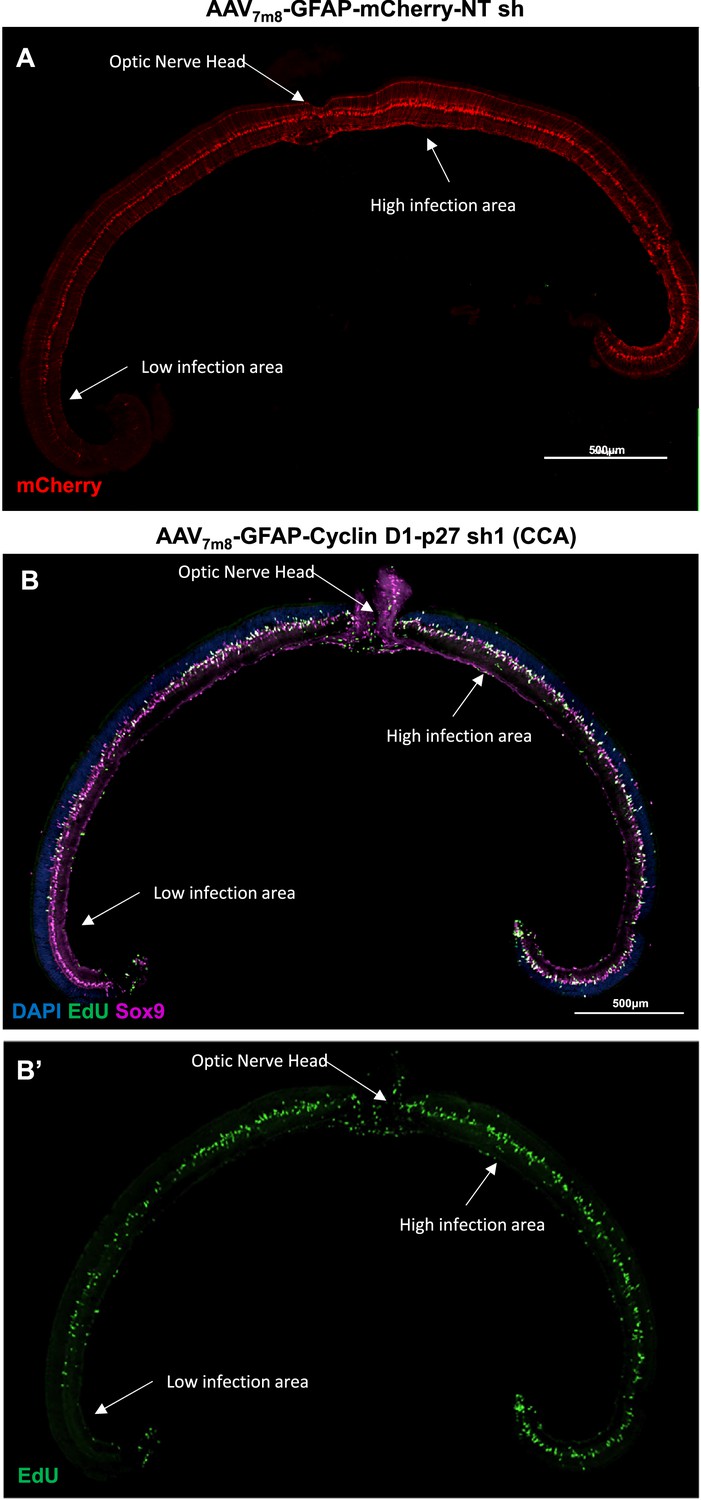
Infection pattern of intravitreally delivered adeno-associated virus (AAV) vector.
(A) Whole retinal cross-section demonstrating typical infection pattern by AAV-GFAP-mCherry-NT shRNA vector, with strong mCherry expression indicating high infection efficiency in the central retina. (B) Distribution of EdU+ cells across the retinal section, showing nonuniformity. Mouse eyes were infected by cell cycle activator (CCA) vector via intravitreal injection on P6, and proliferating Müller glia (MG) were labeled by five EdU injections from day 7 to 11 post-CCA injection. EdU+ cell hotspot typically located near the optic nerve head.
Figure 1—figure supplement 5
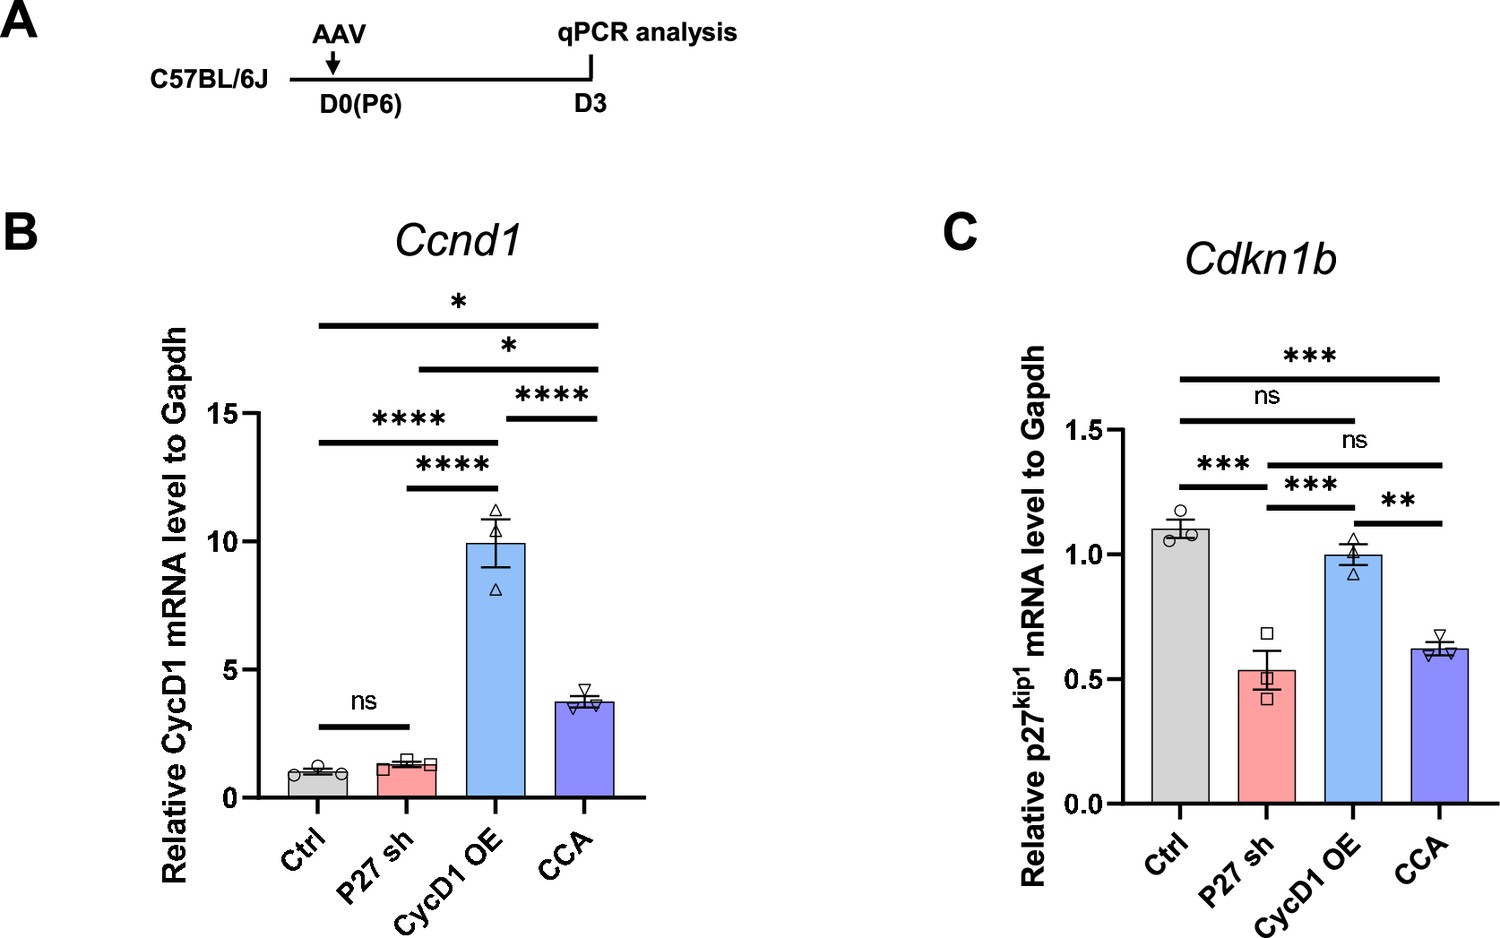
Comparison of cyclin D1 overexpression and p27kip1 knockdown efficiencies by different viruses.
(A) Experimental design. (B–C) Quantitative PCR results for Ccnd1 (B) and Cdkn1b (C) in retinas from different treatment groups, showing more efficient cyclin D1 overexpression driven by AAV-GFAP-cyclin D1 compared to cell cycle activator (CCA). p27kip1 knockdown efficiency by AAV-GFAP-mCherry-p27 shRNA1 was comparable to that of CCA. Data presented as mean ± SEM, n=3. ns = not significant, *p<0.05, **p<0.01, ***p<0.001, ****p<0.0001 (one-way ANOVA with post hoc Tukey’s test).
Figure 1—figure supplement 6
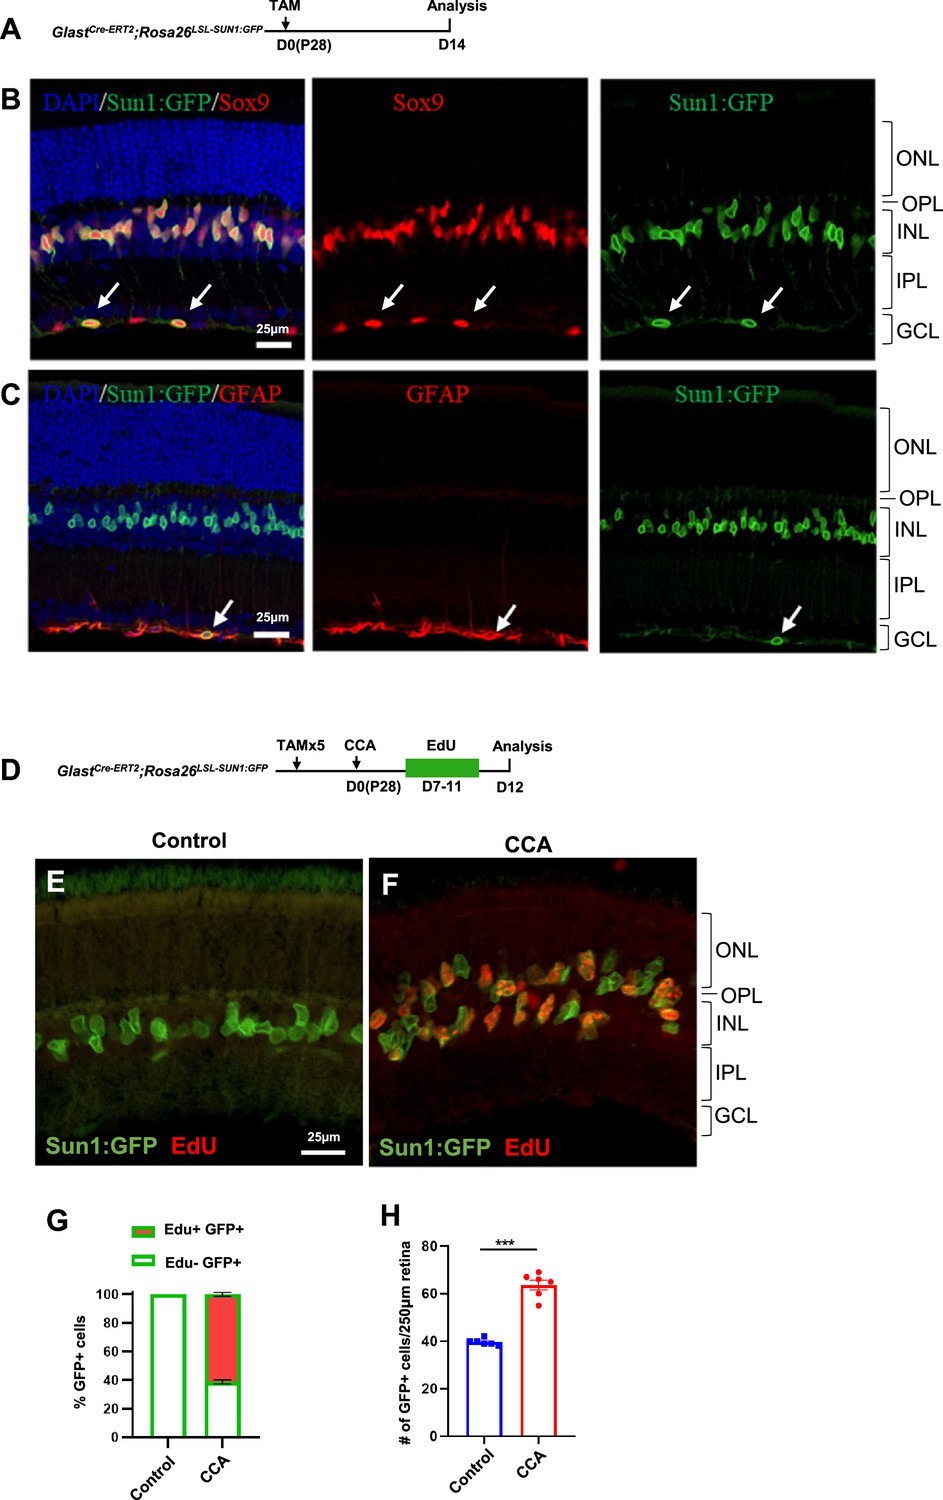
Characterization of Müller glia (MG) proliferation in GlastCre-ERT2; Rosa26LSL-Sun1:GFP transgenic mice.
(A) Experimental design. (B–C) Immunohistochemistry against MG marker Sox9 (B) and astrocyte marker GFAP (C) in retinas of GlastCre-ERT2; Rosa26LSL-Sun1:GFP mice, where GFAP expression was low in MG in uninjured retinas. Arrows indicate Sun1:GFP positive astrocytes in the ganglion cell layer (GCL), which expressed high levels of GFAP. (D) Experimental design. (E–F) 5-Ethynyl-2’-deoxyurdine (EdU) incorporation analysis in retinas following control (E) or cell cycle activator (CCA) (F) treatment. (G) Quantification of EdU+GFP+ and EdU–GFP+ cell percentages in high infection areas of GlastCre-ERT2; Rosa26LSL-Sun1:GFP retinas injected with CCA. (H) Quantification of total GFP+ MG per 250 µm in high infection areas. Data presented as mean ± SEM, n=6. ***p<0.001 (unpaired two-tailed Student’s t-test).
Figure 2 with 4 supplements
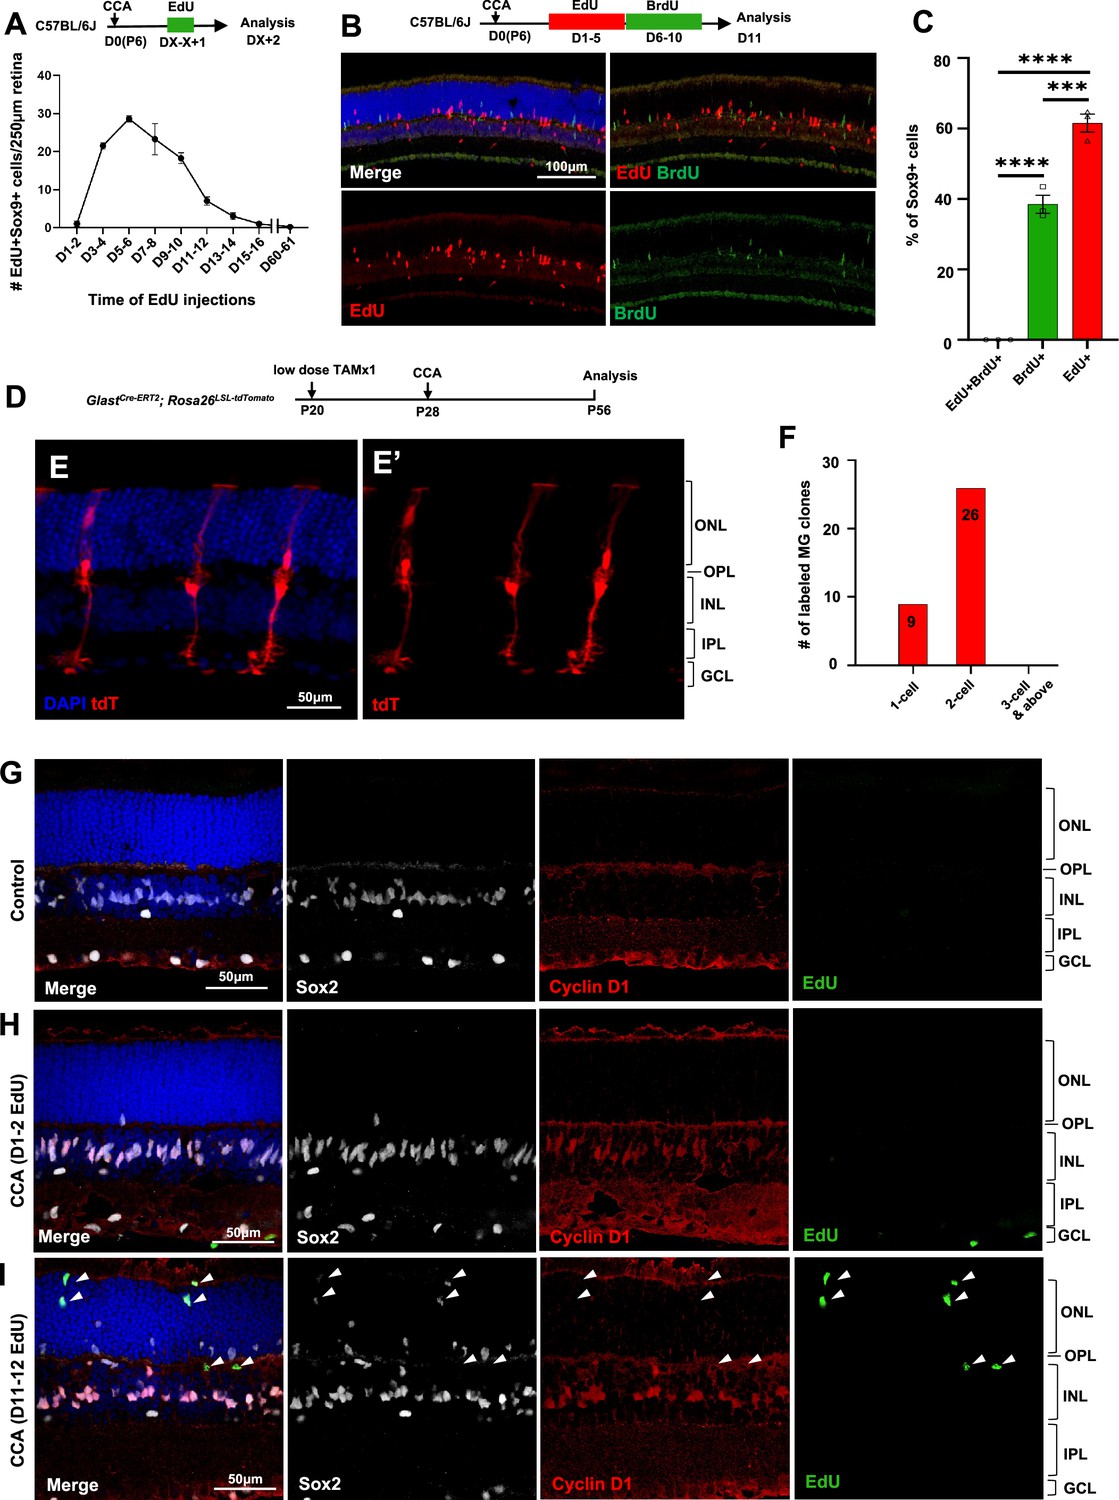
Müller glia (MG) proliferation induced by cell cycle activator (CCA) is self-limiting.
(A) Time-course analysis of MG proliferation following CCA injection. 5-Ethynyl-2’-deoxyurdine (EdU) was administered for 2 consecutive days, starting at various days post-CCA injection, with samples harvested 1 day after the second EdU injection. Data are presented as mean ± SEM (n≥4). (B) Analysis of cells labeled with EdU and 5-bromo-2' deoxyuridine (BrdU). (C) Quantification of the percentages of EdU+BrdU−, EdU−BrdU+, and EdU+BrdU+ cells of the total Sox9+ cells. Data are presented as mean ± SEM (n=3). ***p<0.001, ****p<0.0001 (one-way ANOVA with Tukey’s post hoc test). (D) Experimental design. (E) A representative image of sparsely labeled MG in the GlastCre-ERT2; Rosa26LSL-tdTomato mouse retina. (F) Quantification of the numbers of 1-cell, 2-cell, and larger clones in ten 250 µm hotspot areas from four retinas infected with CCA. (G–I) Eye samples from the time-course EdU analysis (A) were stained for cyclin D1 and Sox2. Representative retinal sections from uninjected eyes (G), mice with EdU injections at D1–2 and harvest at D3 (H), and mice with EdU injections at D11–12 and harvest at D13 (I). Arrowheads point out the EdU+ cells that are negative for cyclin D1 staining. ONL, outer nuclear layer; OPL, outer plexiform layer; INL, inner nuclear layer; IPL, inner plexiform layer; GCL, ganglion cell layer.
Figure 2—figure supplement 1
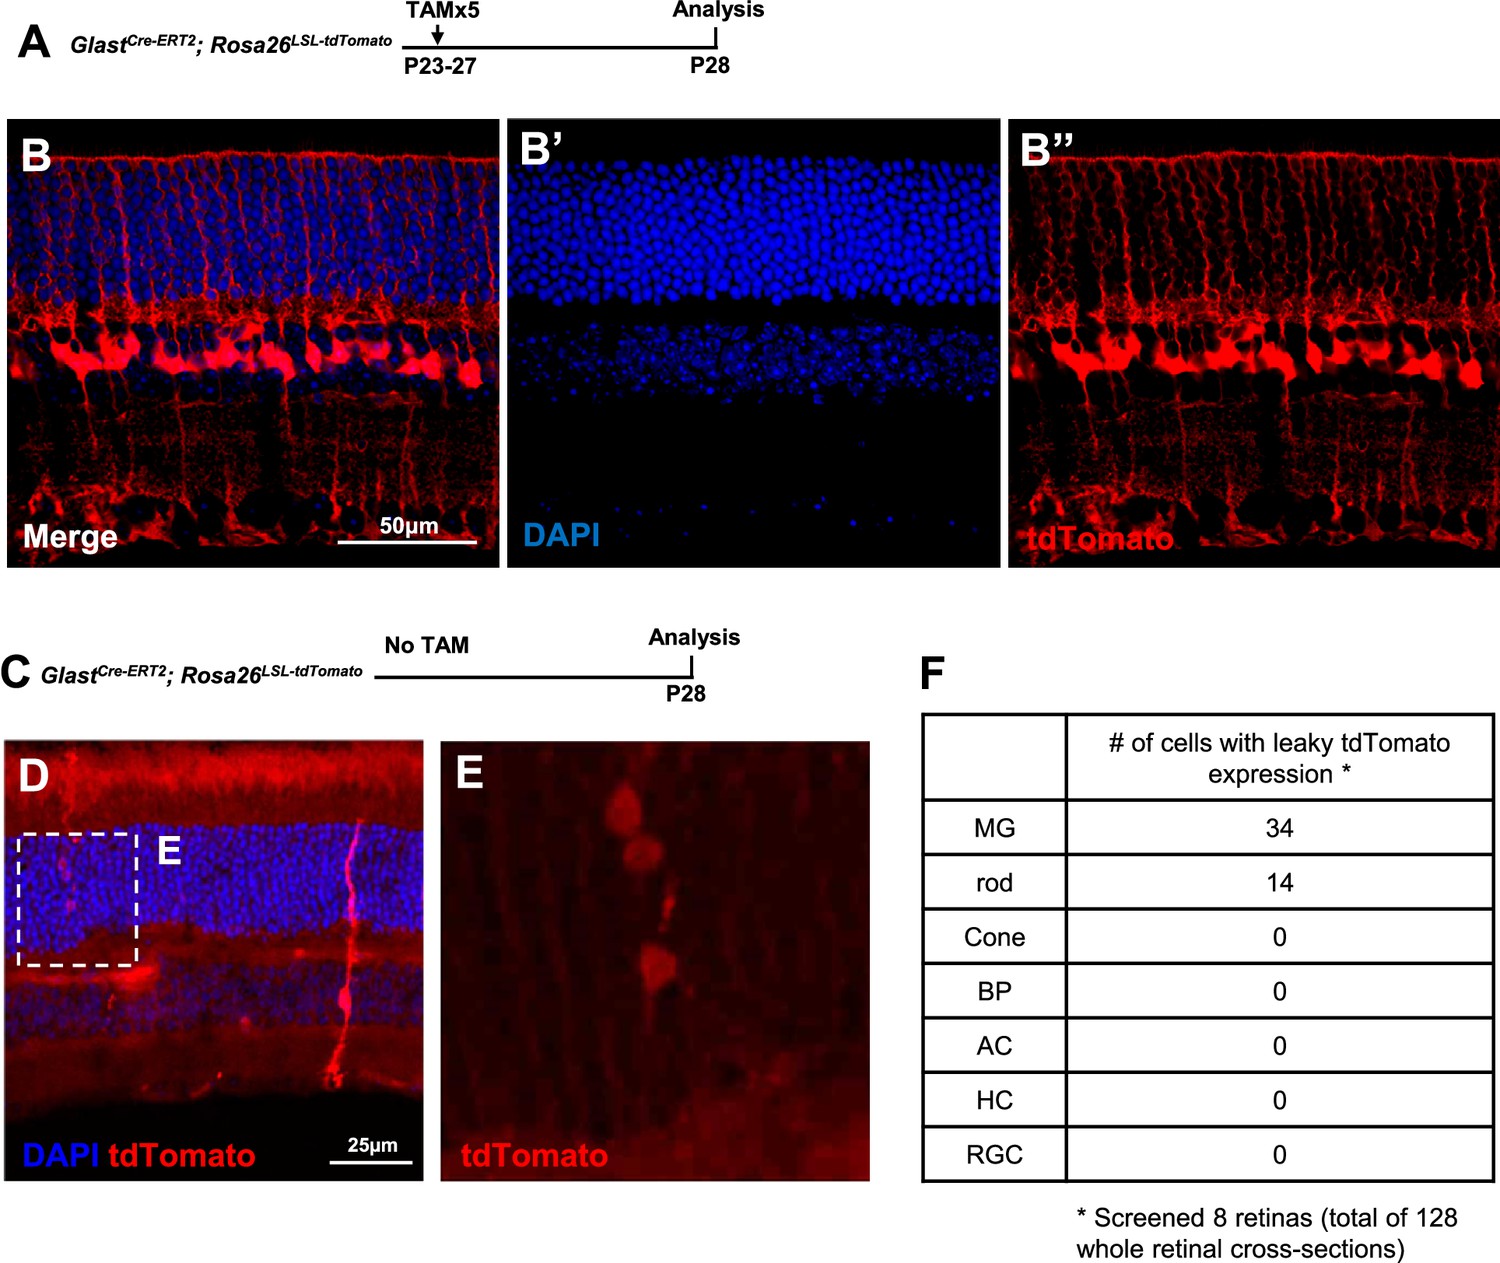
Characterization of Müller glia (MG) labeling and leaky expression in GlastCre-ERT2; Rosa26LSL-tdTomato transgenic mice.
(A) Experimental design. (B) MG were labeled by tdTomato in retinas of GlastCre-ERT2; Rosa26LSL-tdTomato mice treated with five tamoxifen injections from P23 to P27. (C) Experimental design. (D–E) Characterization of leaky expression of GlastCre-ERT2; Rosa26LSL-tdTomato mouse retina without tamoxifen induction. The boxed area in B is enlarged in C. Leaky expression was observed in MG as well as rods at very low incidence. (F) Quantification of tdTomato-positive cells in retina without TAM injection. A total of 128 retinal sections from 8 retinas were examined. 34 MGs and 14 rod cells labeled by leaky tdTomato expression were found in all sections after careful examination.
Figure 2—figure supplement 2
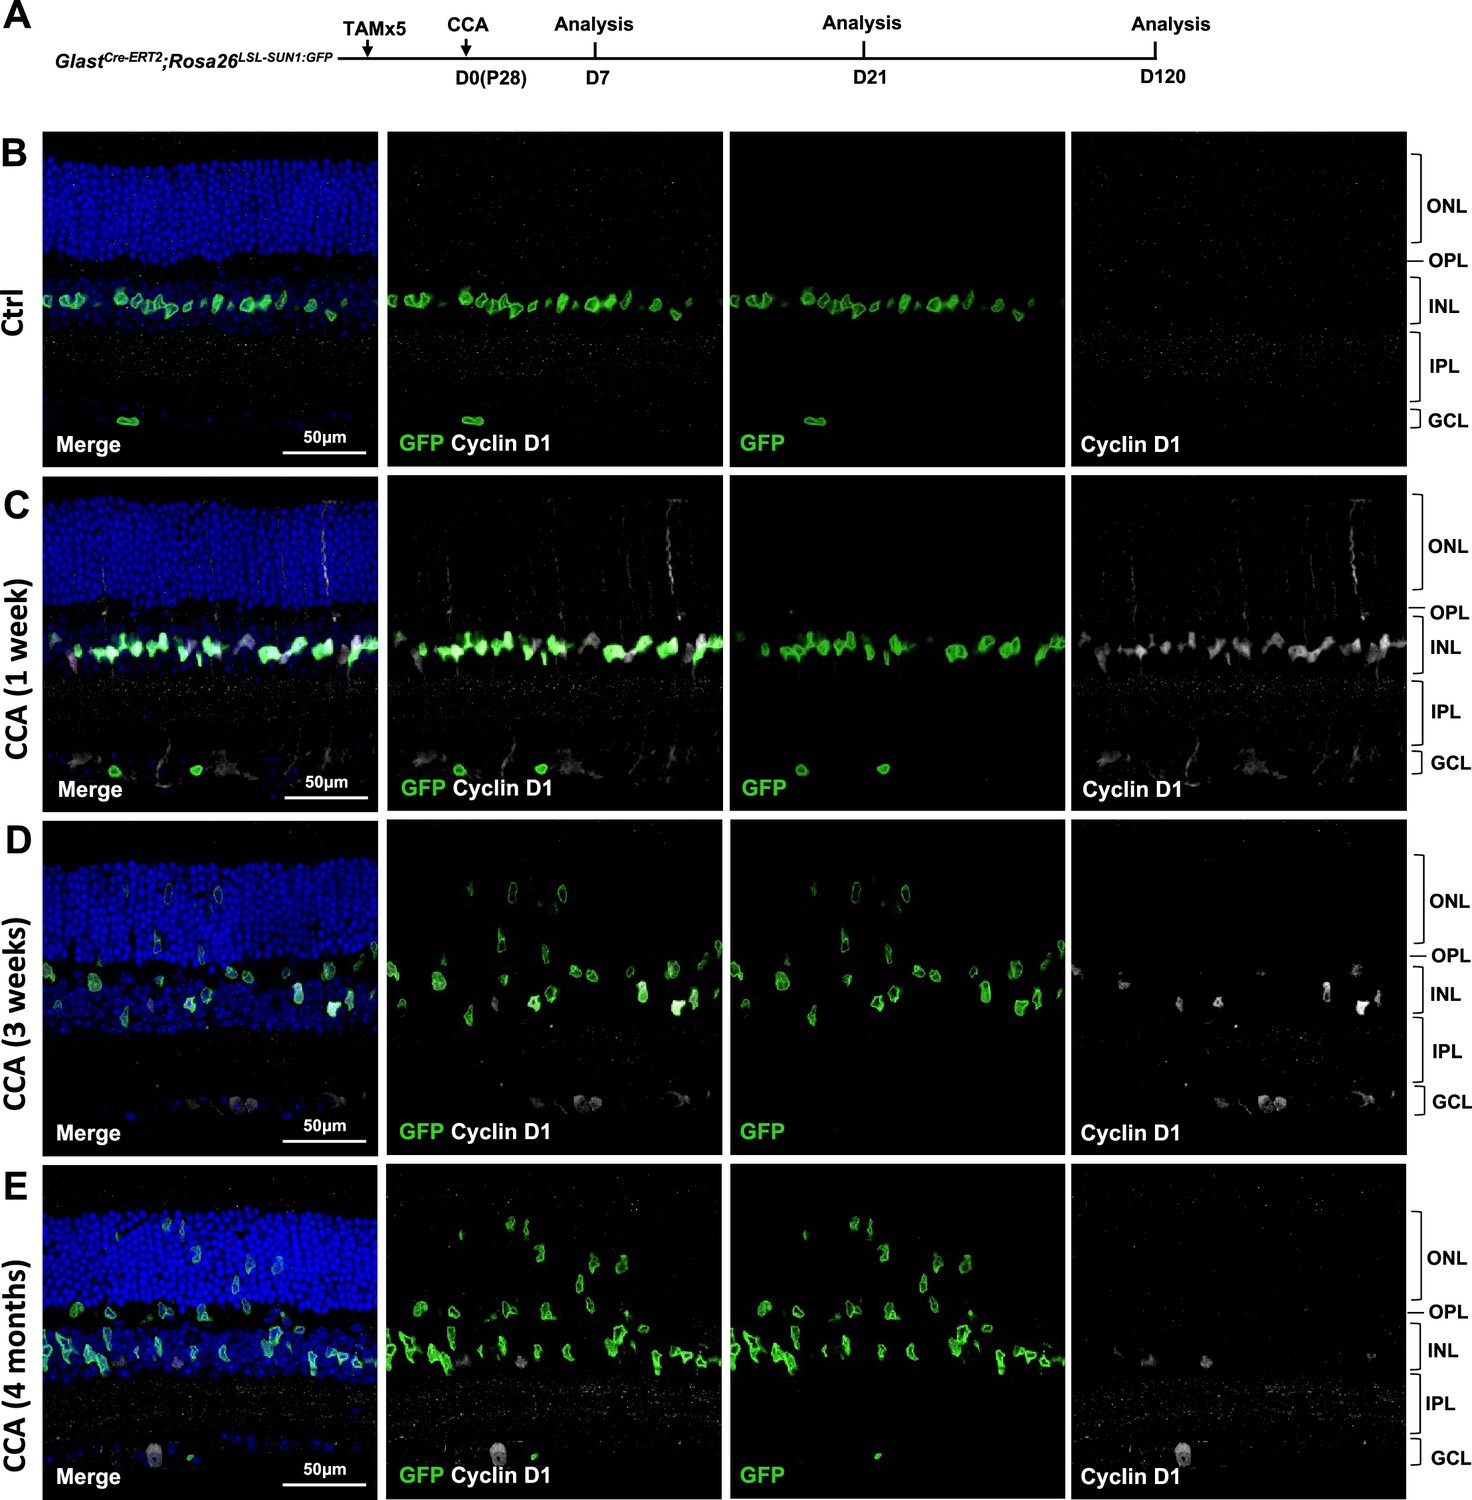
Analysis of cyclin D1 expression at different days post-cell cycle activator (CCA) injection on P28.
(A) Experimental design. (B–E) Immunohistochemical analysis of cyclin D1 in GlastCre-ERT2; Rosa26LSL-Sun1:GFP mouse retinal sections at 1 week, 3 weeks, and 4 months post-CCA injection.
Figure 2—figure supplement 3
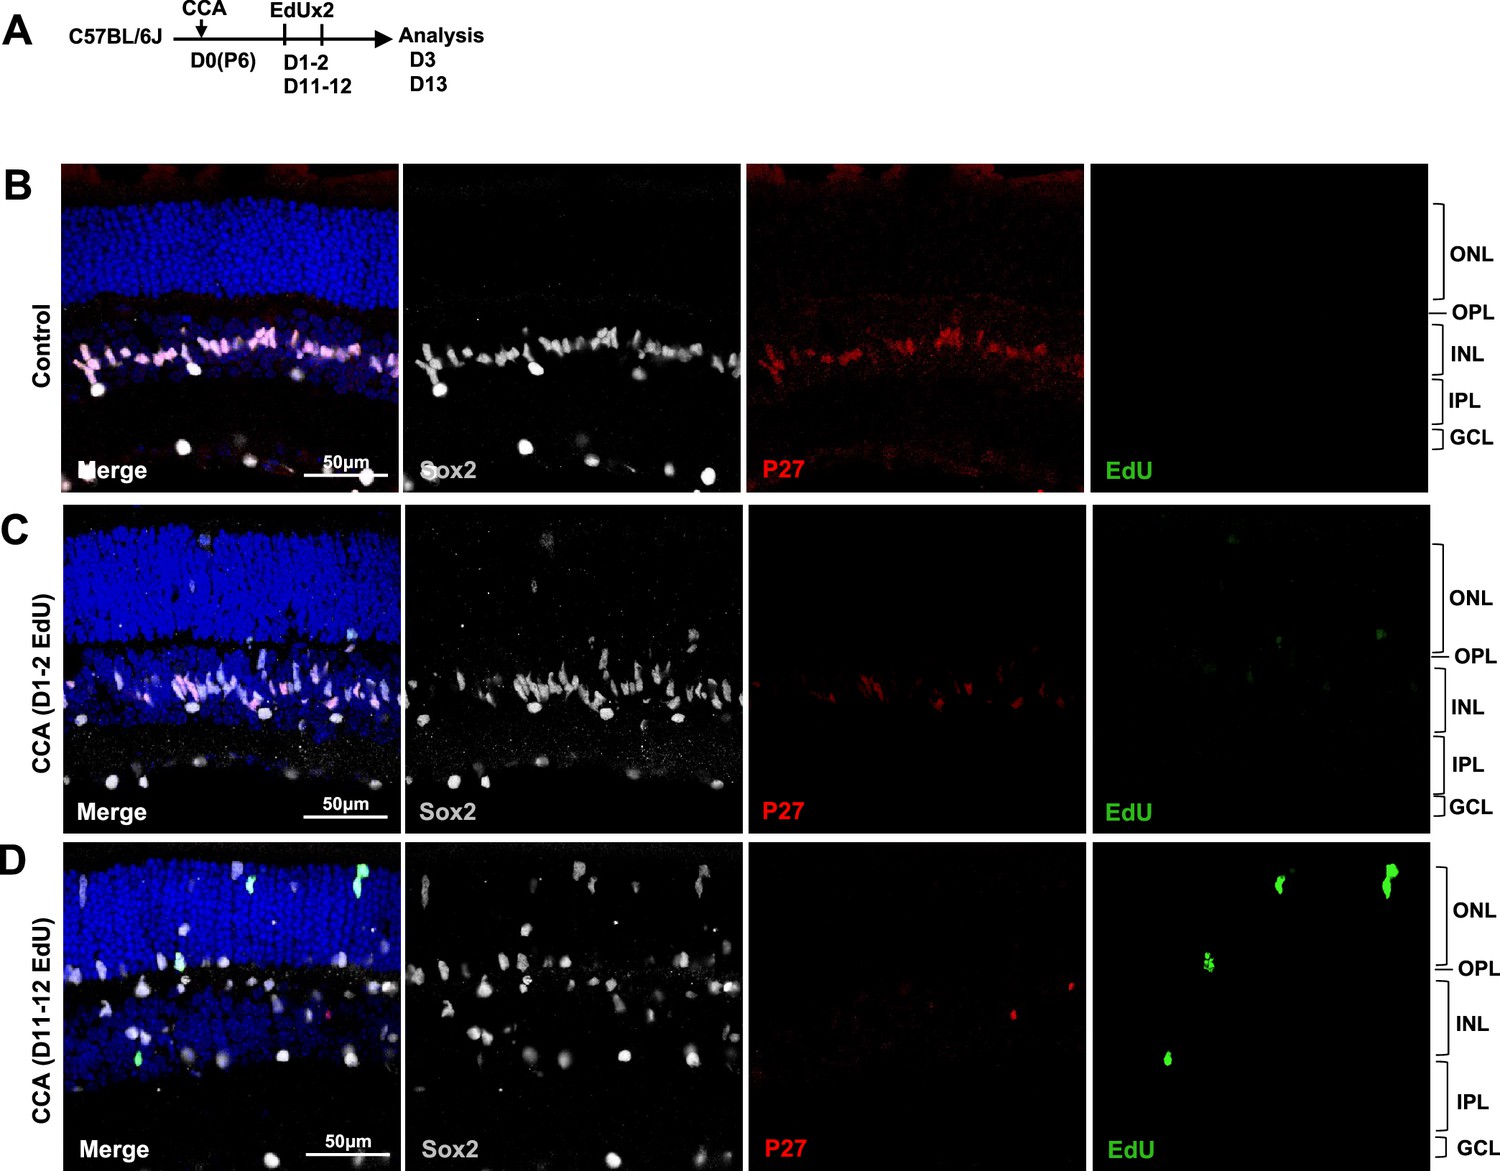
Analysis of p27kip1 expression at different days post-cell cycle activator (CCA) injection on P6.
(A) Experimental design. (B–D) Analysis of 5-ethynyl-2’-deoxyurdine (EdU) incorporation co-labeled with p27kip1 and Müller glia (MG)-specific marker Sox2 in the retinas received two EdU injections on D1–2 (C) and D11–12 (D) post-CCA treatment. Control retinas received EdU injections on D11–12 without CCA treatment on D0.
Figure 2—figure supplement 4
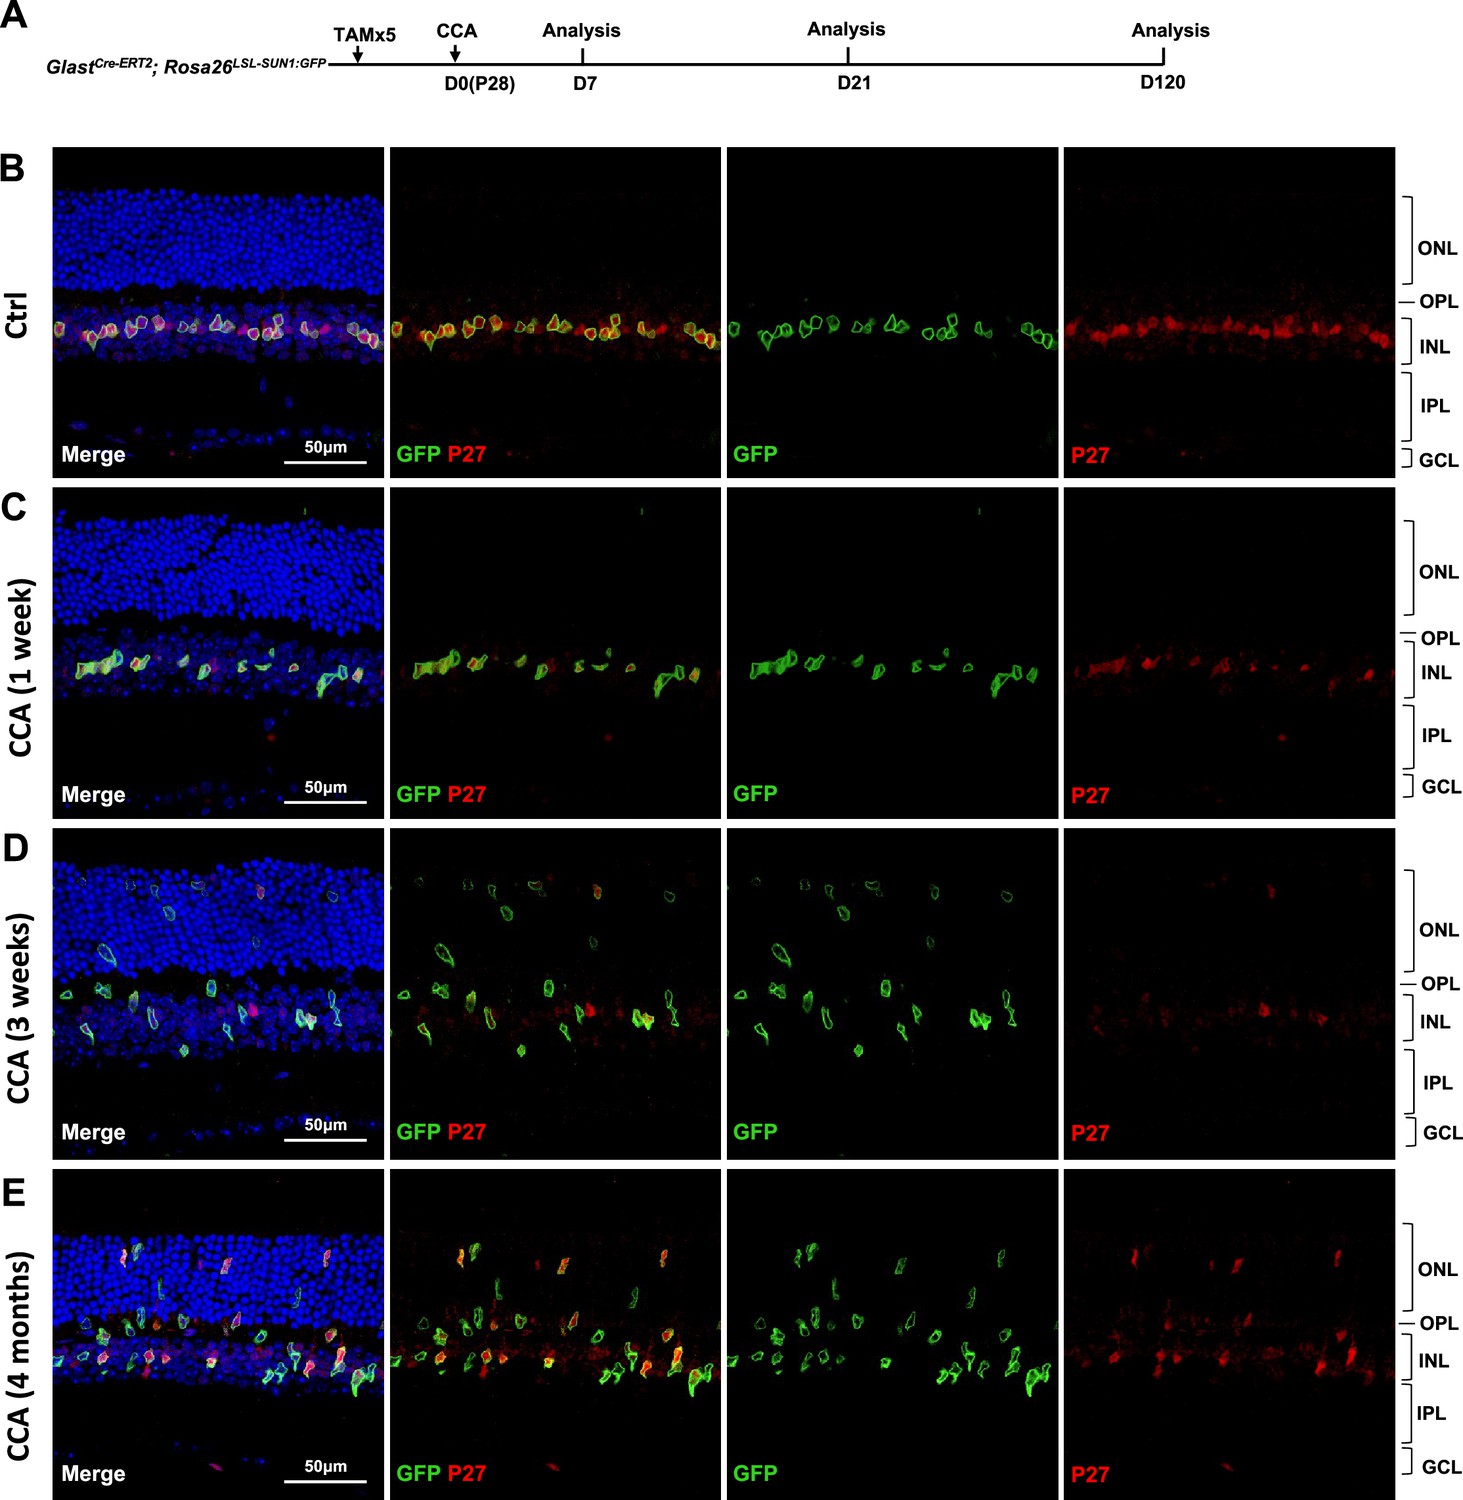
Analysis of p27kip1 expression at different days post-cell cycle activator (CCA) injection on P28.
(A) Experimental design. (B–E) Immunohistochemical analysis of p27kip1 expression in GlastCre-ERT2; Rosa26LSL-Sun1:GFP mouse retinal sections at 1 week, 3 weeks, and 4 months post-CCA injection.
Figure 3 with 6 supplements
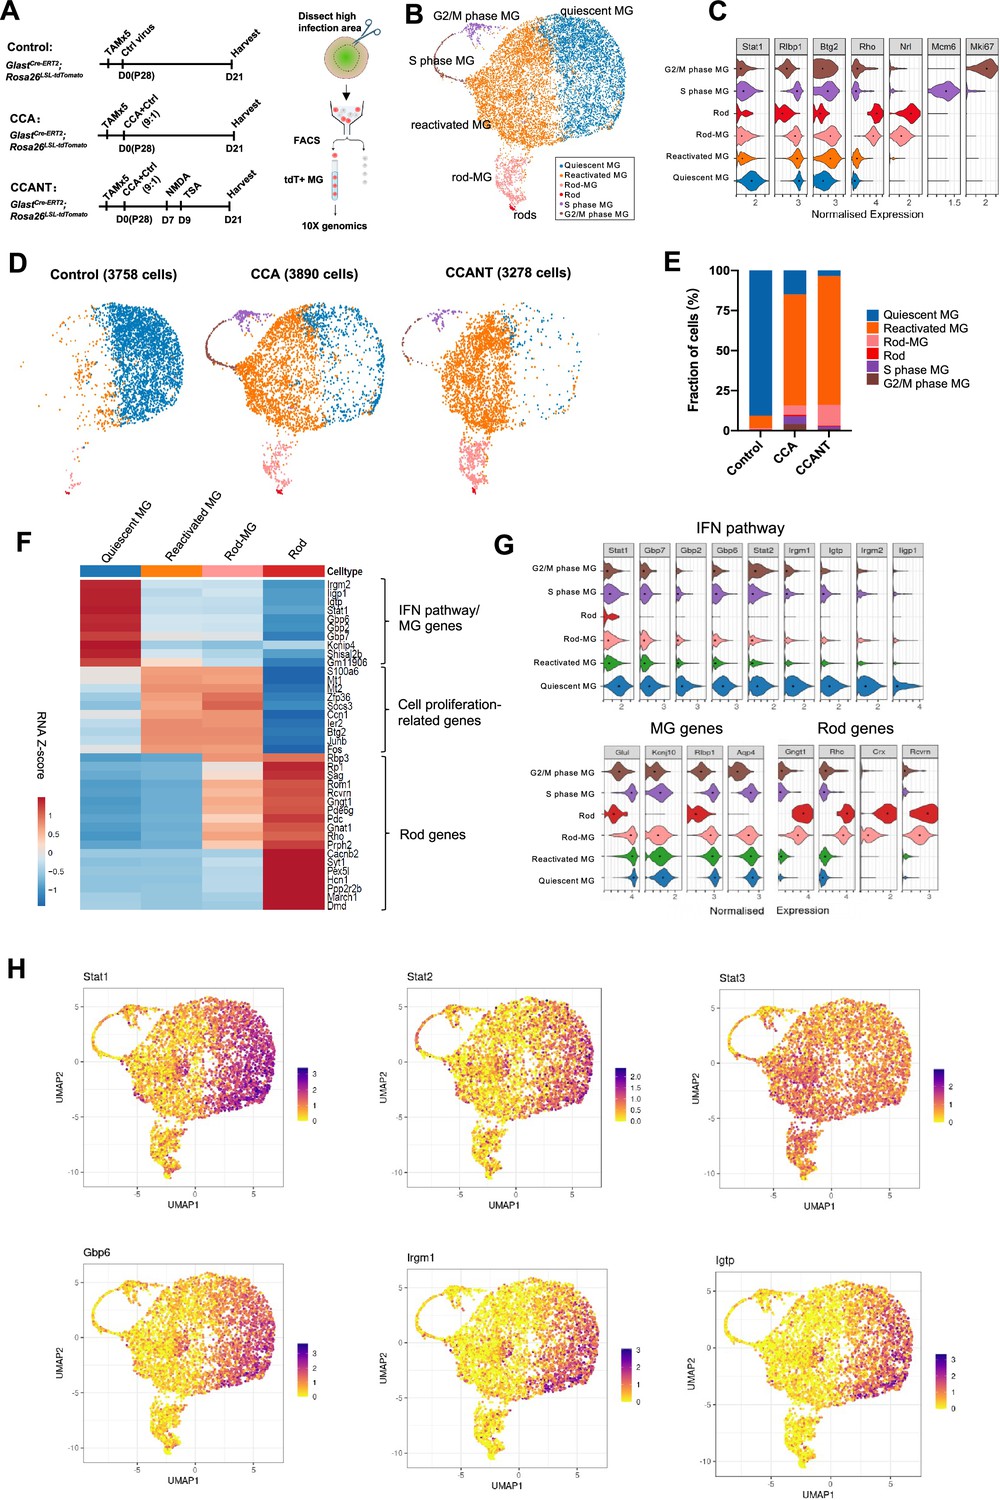
Single-cell RNA (scRNA-seq) analysis of Müller glia (MG) at 3 weeks post-CCA treatment.
(A) Schematic illustration of the scRNA-seq experiment. (B) Uniform Manifold Approximation and Projection (UMAP) plot of scRNA-seq data for all MG combined from three groups with control, CCA, or CCANT treatment, with clusters identified based on known marker gene expression. (C) Violin diagram showing expression of retinal cell markers in different cell clusters. (D) Split UMAP plots of control, CCA, and CCANT groups. (E) Proportions of cell clusters within control, CCA, and CCANT groups. (F) Heatmap of top differentially expressed genes (DEGs) between cell clusters. Cell clusters are shown in columns, and genes are in rows. Color scale denotes Z score of the normalized gene expression levels. (G) Violin diagram illustrating the expression of interferon (IFN) pathway genes, MG genes, and rod genes across different cell clusters. (H) Feature plots showing normalized gene expression of Stat1, Stat2, Stat3, Gbp6, Irgm1, and Igtp in different cell clusters. CCA, cell cycle activator; CCANT, CCA+NMDA+TSA.
Figure 3—figure supplement 1
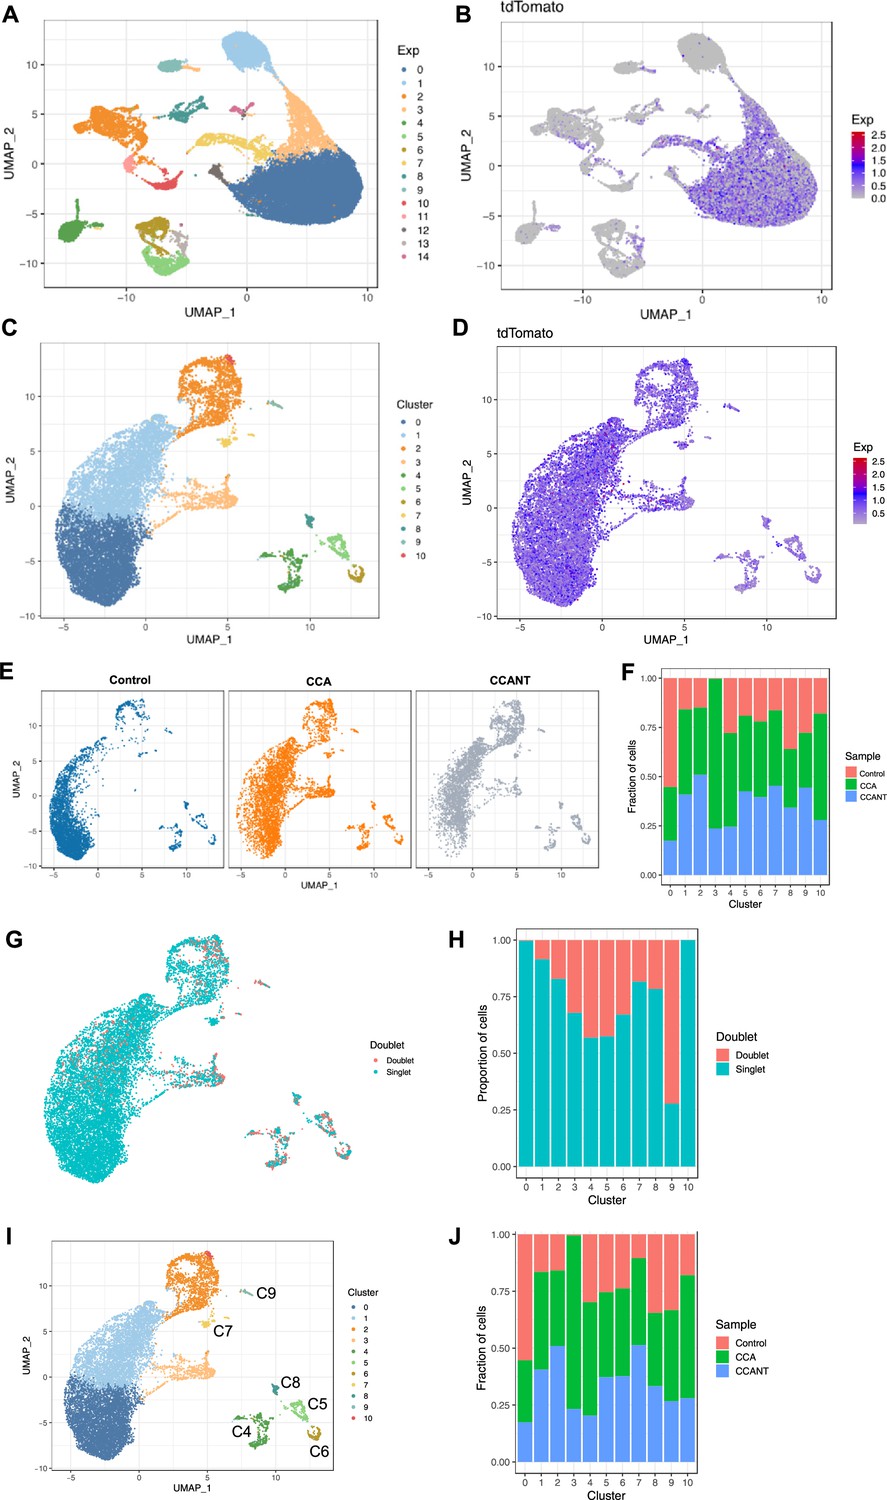
Preprocessing and filtering of single-cell RNA (scRNA) data and removal of doublet cells.
(A) Uniform Manifold Approximation and Projection (UMAP) plot showing the clustering of control, cell cycle activator (CCA), and CCANT-treated cells. (B) Feature plot showing the expression of tdTomato. (C) UMAP plot and clustering of control, CCA, and CCANT-treated cells after removal of tdTomato-negative cells. (D) Feature plot showing tdTomato expression after tdTomato-negative cell removal. (E) UMAP plots of control, CCA, and CCANT groups separately. (F) Proportions of control, CCA, and CCANT groups in the UMAP cell clusters shown in (C). (G) Feature plot indicating doublets in pink. (H) Proportion of doublets in all cell clusters, with cluster 9 showing over 70% doublets, indicating low quality. (I) Clustering of control, CCA, and CCANT-treated cells with cluster labels C4-C9. (J) Proportion of control, CCA, and CCANT groups in cell clusters after doublets removal.
Figure 3—figure supplement 2
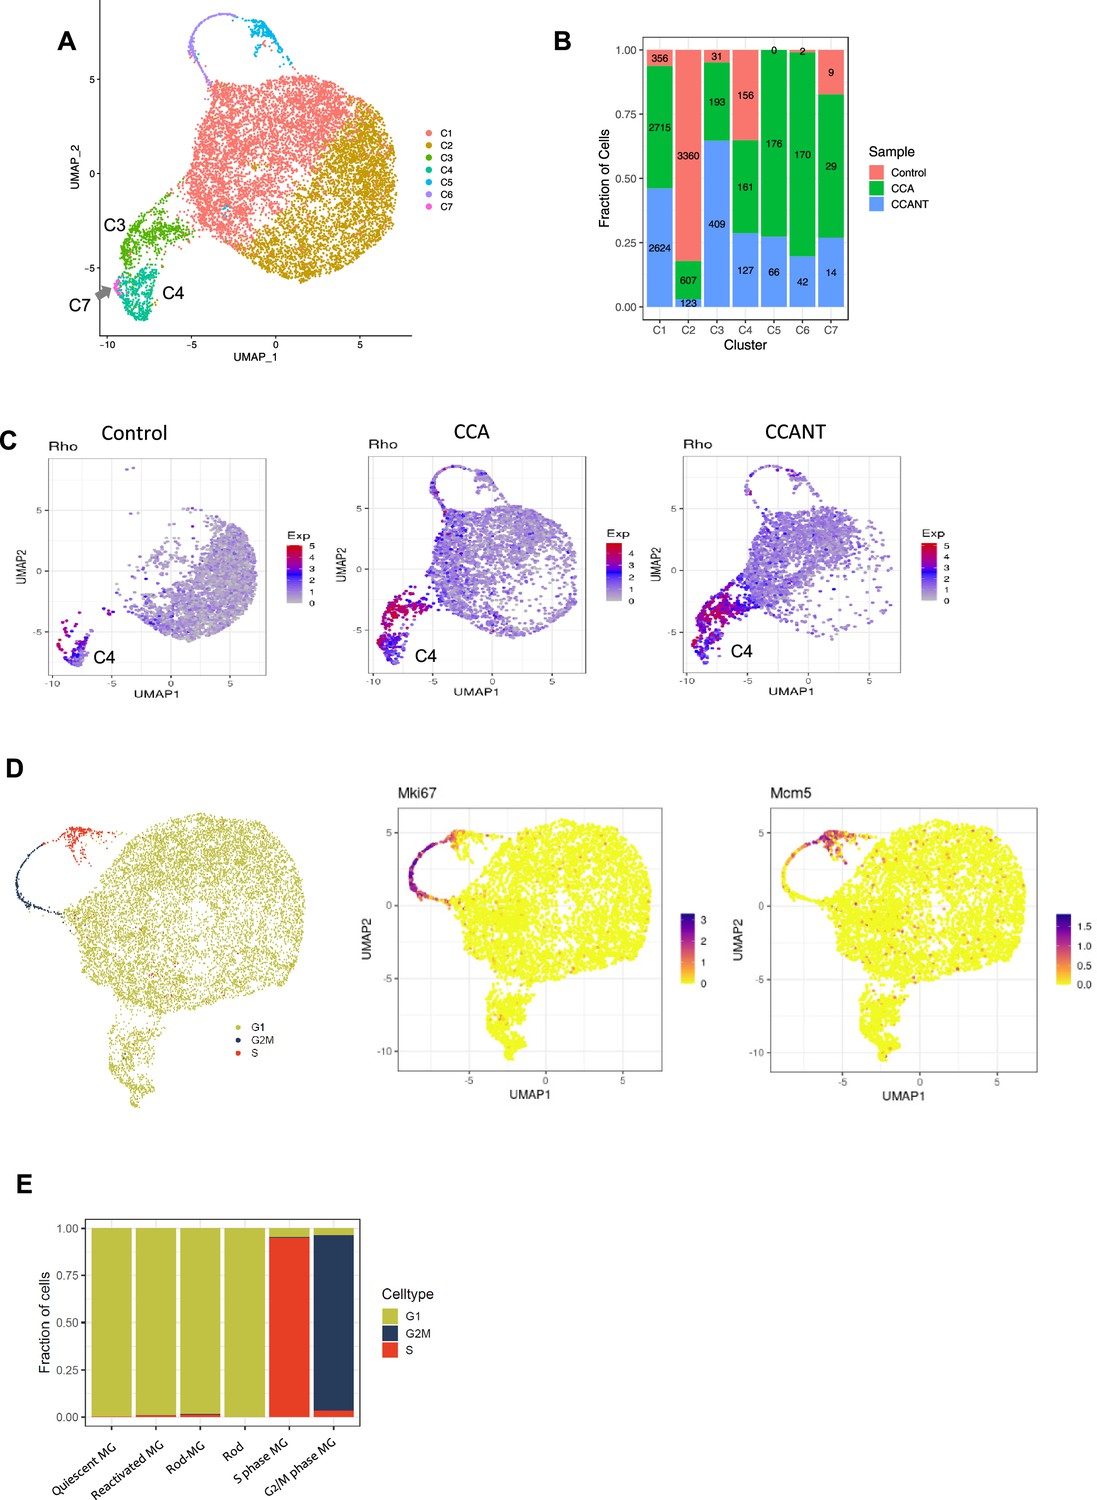
Removal of possibly contaminated cells.
(A) Uniform Manifold Approximation and Projection (UMAP) plot showing seven cell clusters after removing doublet cells and small clusters composed by non-Müller glia (MG) cells (C4-9 in Figure 3—figure supplement 1I and J). (B) Percentages and numbers of cells in three groups across seven clusters. Two clusters of MG C3 and C4 express rod genes such as Rho, Gnat1, and Nrl. In the C4 cluster, the percentages of cells from each group are similar, suggesting that C4 is likely a cluster of MG cells contaminated with rod processes during retinal cell isolation. This cluster was removed from further analysis. The C3 cluster was enriched in cell cycle activator (CCA) or CCANT-treated samples and was kept for further analysis. (C) Split feature plots showing that the cells in the cluster C4 exhibited similar proportional contributions from all three groups and expressed lower level of rod-specific genes such as Rho than C3. C4 was defined as contaminated cells and removed for further analysis. (D) UMAP plot showing the cells in the G1, G2/M, or S phase. (E) Proportions of cells in different cell cycle phases across six clusters.
Figure 3—figure supplement 3
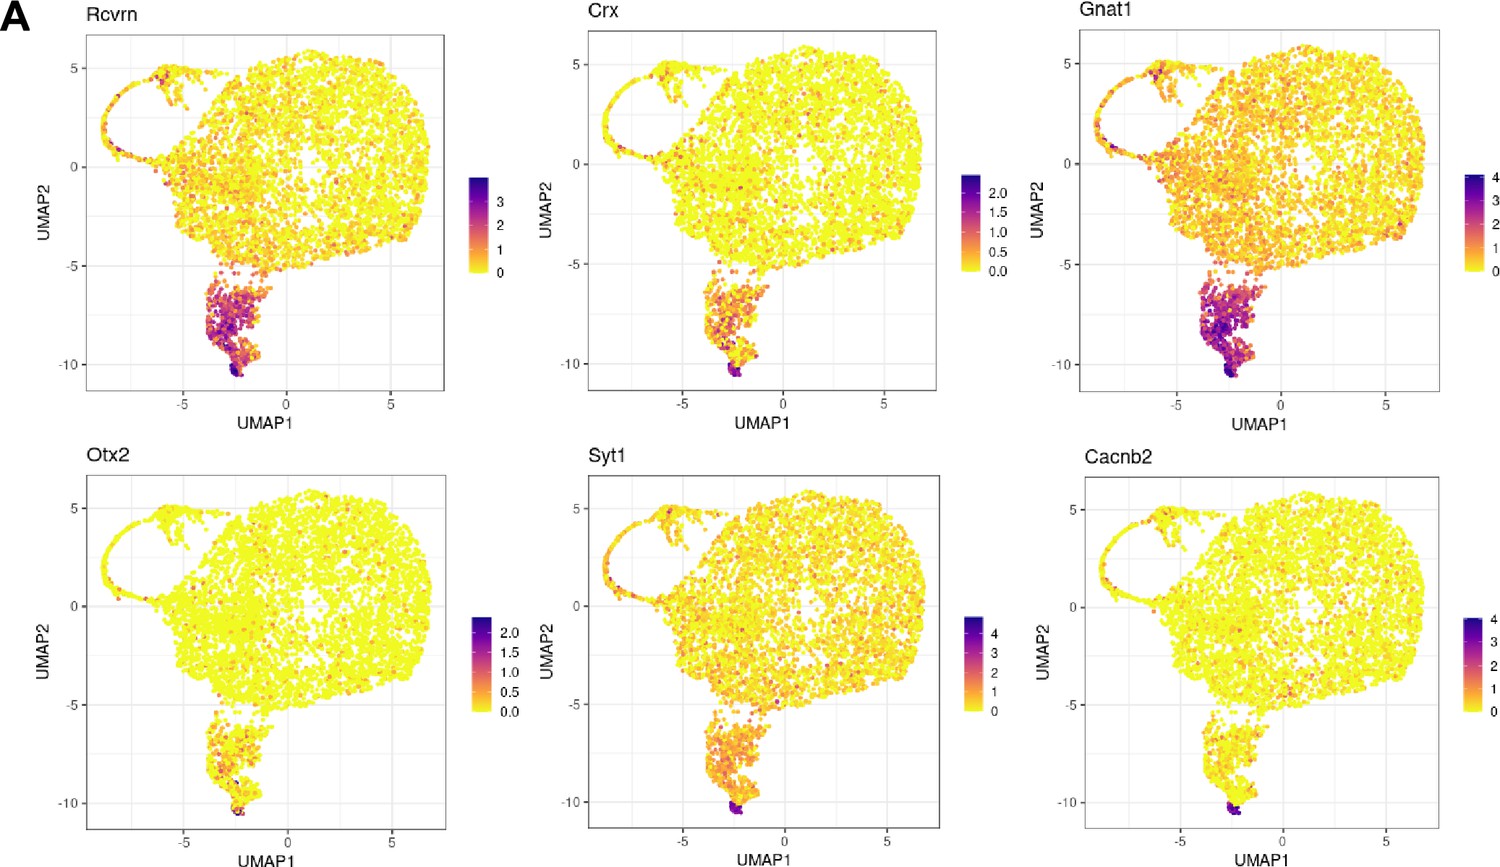
Characterization of the rod-Müller glia (MG) and rod clusters in the single-cell RNA (scRNA-seq) analysis.
(A) Uniform Manifold Approximation and Projection (UMAP) plots showing expression patterns of various rod genes.
Figure 3—figure supplement 4
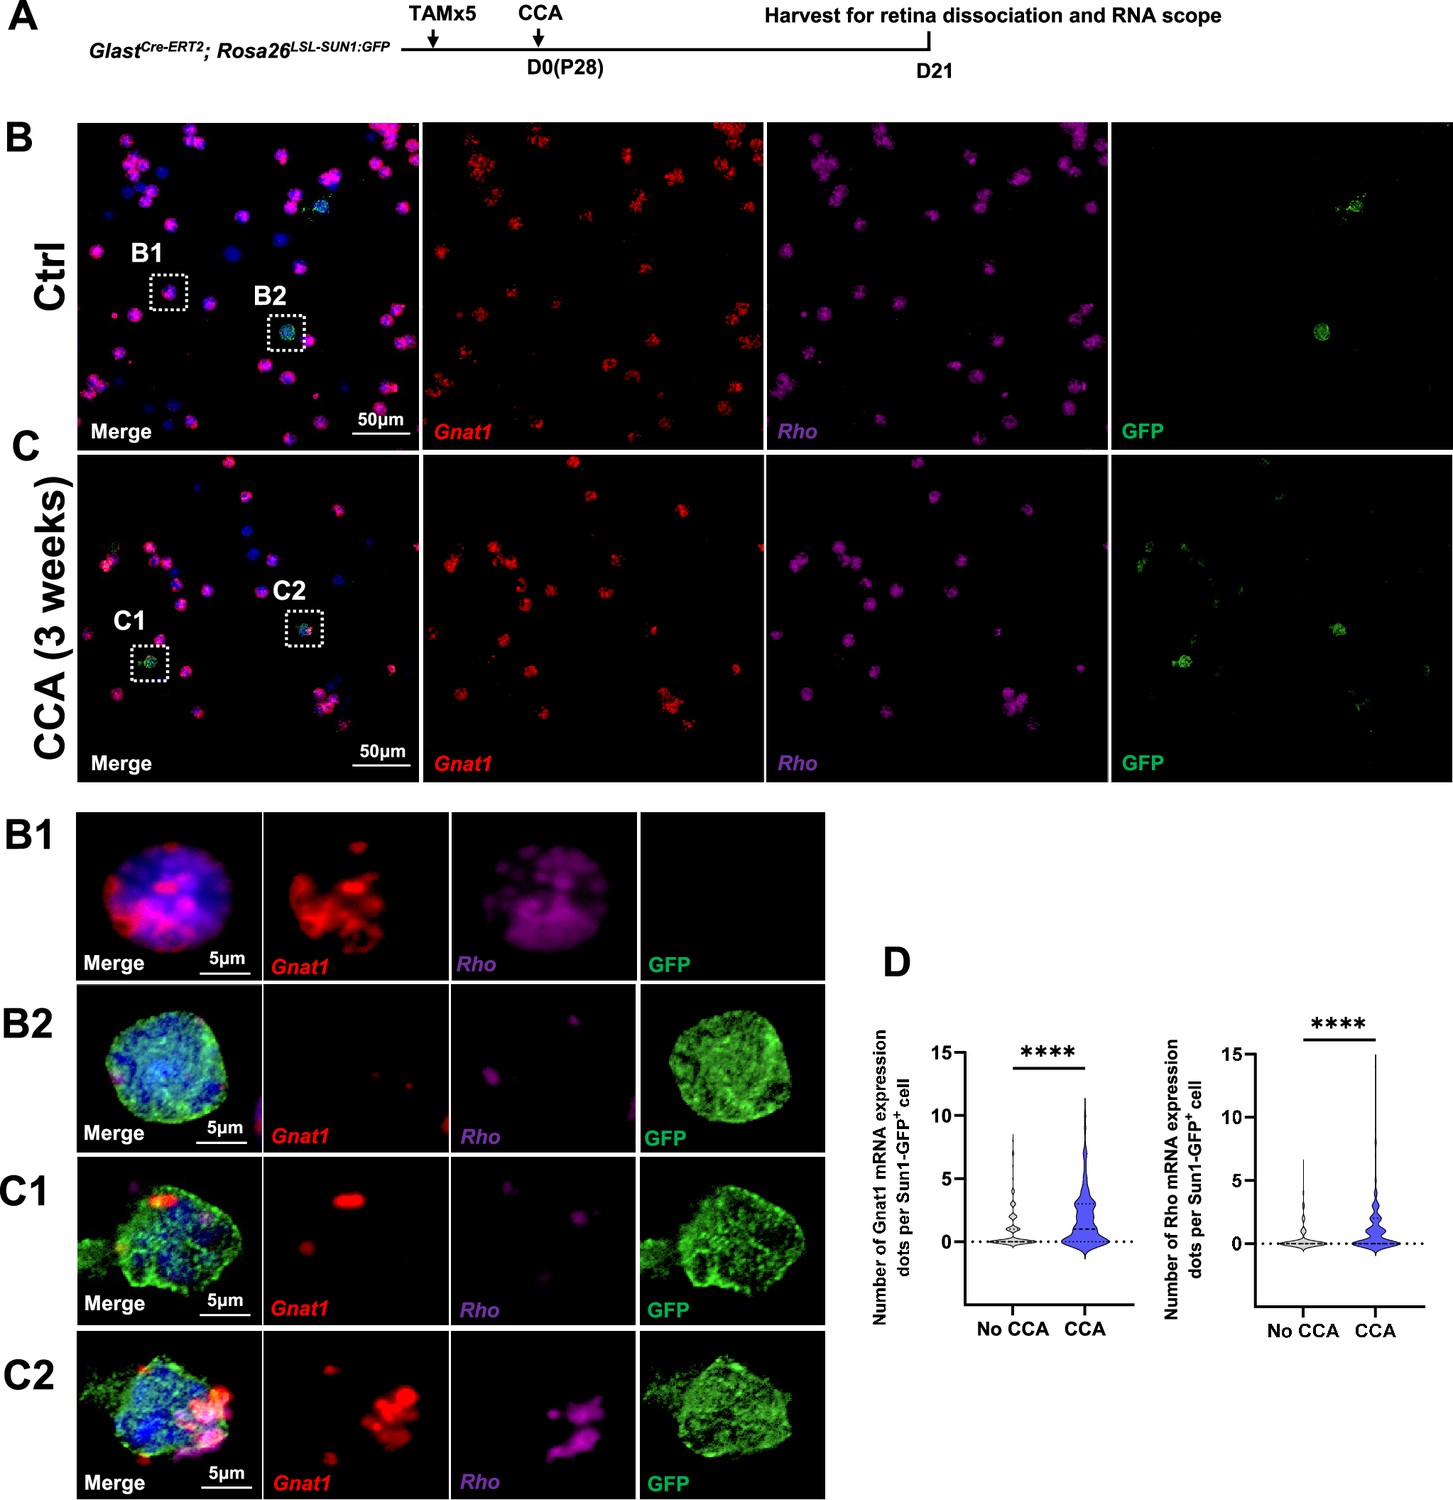
RNA in situ hybridization analysis of rod gene expression in dissociated Müller glia (MG) following cell cycle activator (CCA) treatment.
(A) Schematic of RNA in situ hybridization analysis for rod gene expression in dissociated MG 3 weeks post-CCA treatment. (B–C) Expression levels of rod mRNAs (Rho and Gnat1) in dissociated retinas from control and CCA-treated groups. (B1–C2) Enlarged views of boxed regions in (B–C). (D) Quantification of Gnat1 and Rho mRNA expression by dots per Sun1:GFP+ cell. Data presented as mean ± SEM, total 300 GFP+ cells were measured in two biological sample per group. ****p<0.0001 (unpaired two-tailed Student’s t-test).
Figure 3—figure supplement 5
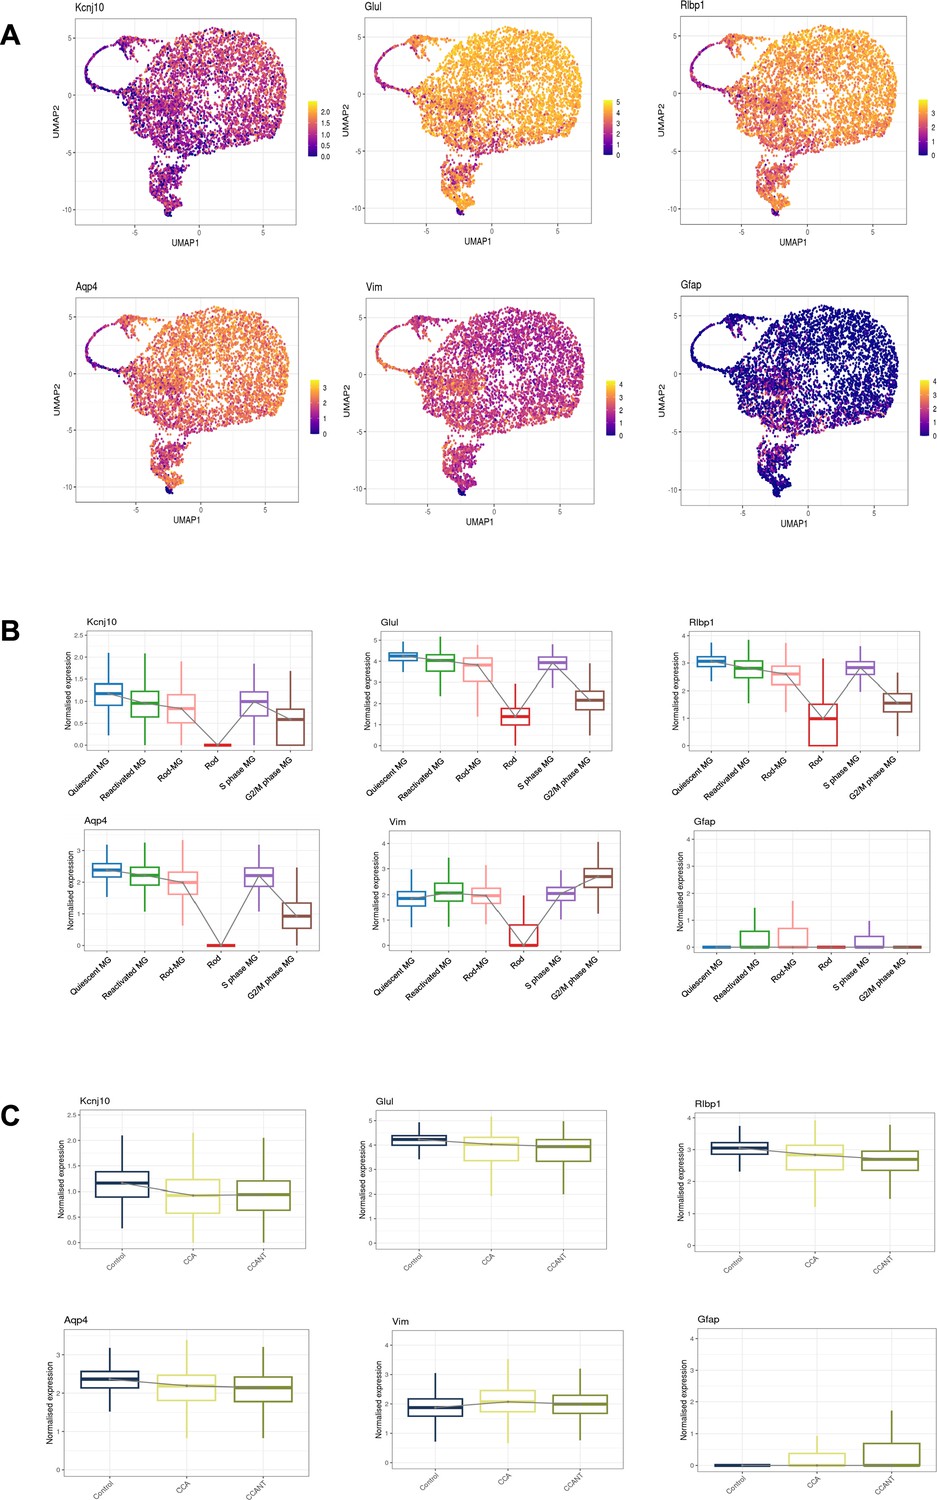
Expression level changes of Müller glia (MG) genes in reactivated MG.
(A) Feature plots showing the expression patterns of genes associated with the quiescent state (Kcnj10, Glul, Rlbp1, and Aqp4) and the reactivated state of MG (Vim and GFAP). (B) Box plots showing expression levels of MG genes in different clusters. (C) Box plots showing expression levels of MG genes in different groups.
Figure 3—figure supplement 6
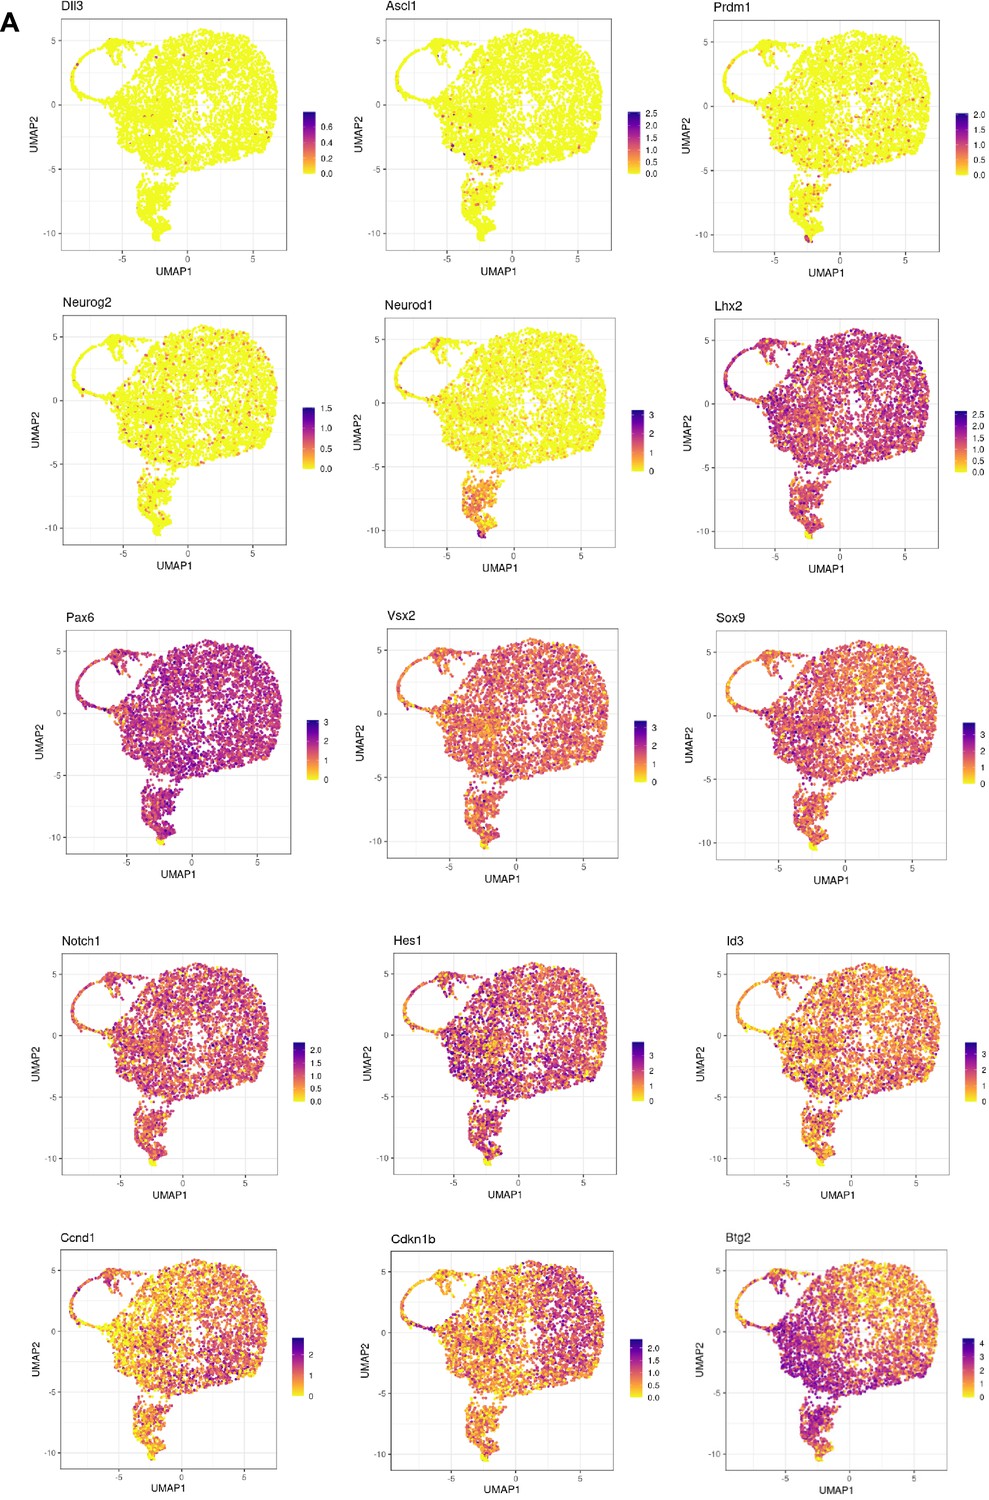
Absence of neurogenic progenitor clusters induced by cell cycle activator (CCA) treatment.
(A) Feature plots illustrating neurogenic or progenitor genes, Notch pathway genes, Ccnd1, Cdkn1b, and Btg2.
Figure 4
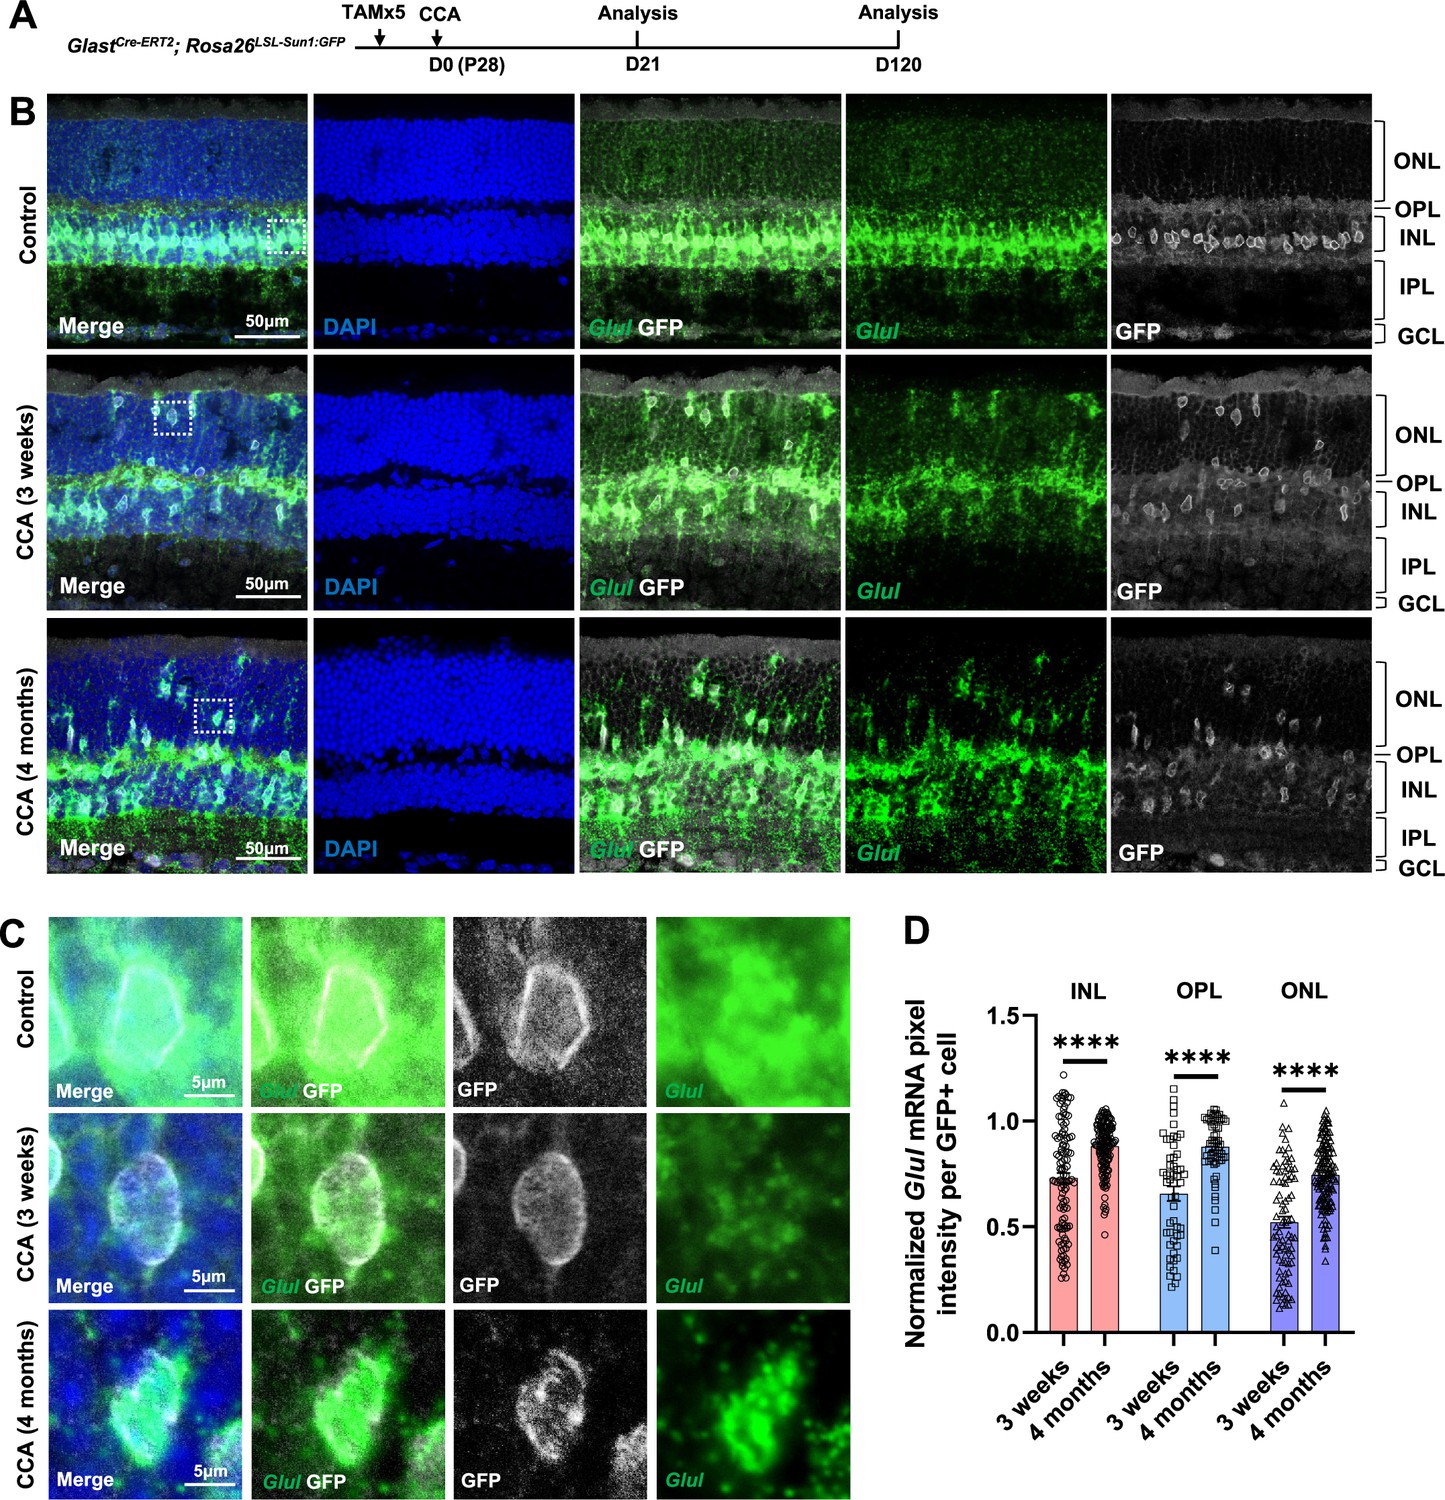
Glul mRNA levels decrease in the Müller glia (MG) that migrated to the ONL and OPL.
(A) Experimental design. (B) In situ hybridization showing Glul mRNA expression. Control retina did not receive any adeno-associated virus (AAV) injection. ONL, outer nuclear layer; OPL, outer plexiform layer; INL, inner nuclear layer; IPL, inner plexiform layer; GCL, ganglion cell layer. (C) Magnified views of the highlighted cells in panel (B). (D) Average pixel intensity of Glul mRNA per GFP+ cell. Pixel intensity of MG treated with cell cycle activator (CCA) was normalized to the average pixel intensity of MG in the uninjected eye of the same animal. n=60 GFP+ cells in each retinal layer from three mice, data are presented as mean ± SEM. ****p<0.0001 (unpaired two-tailed Student’s t-test) (D).
Figure 5
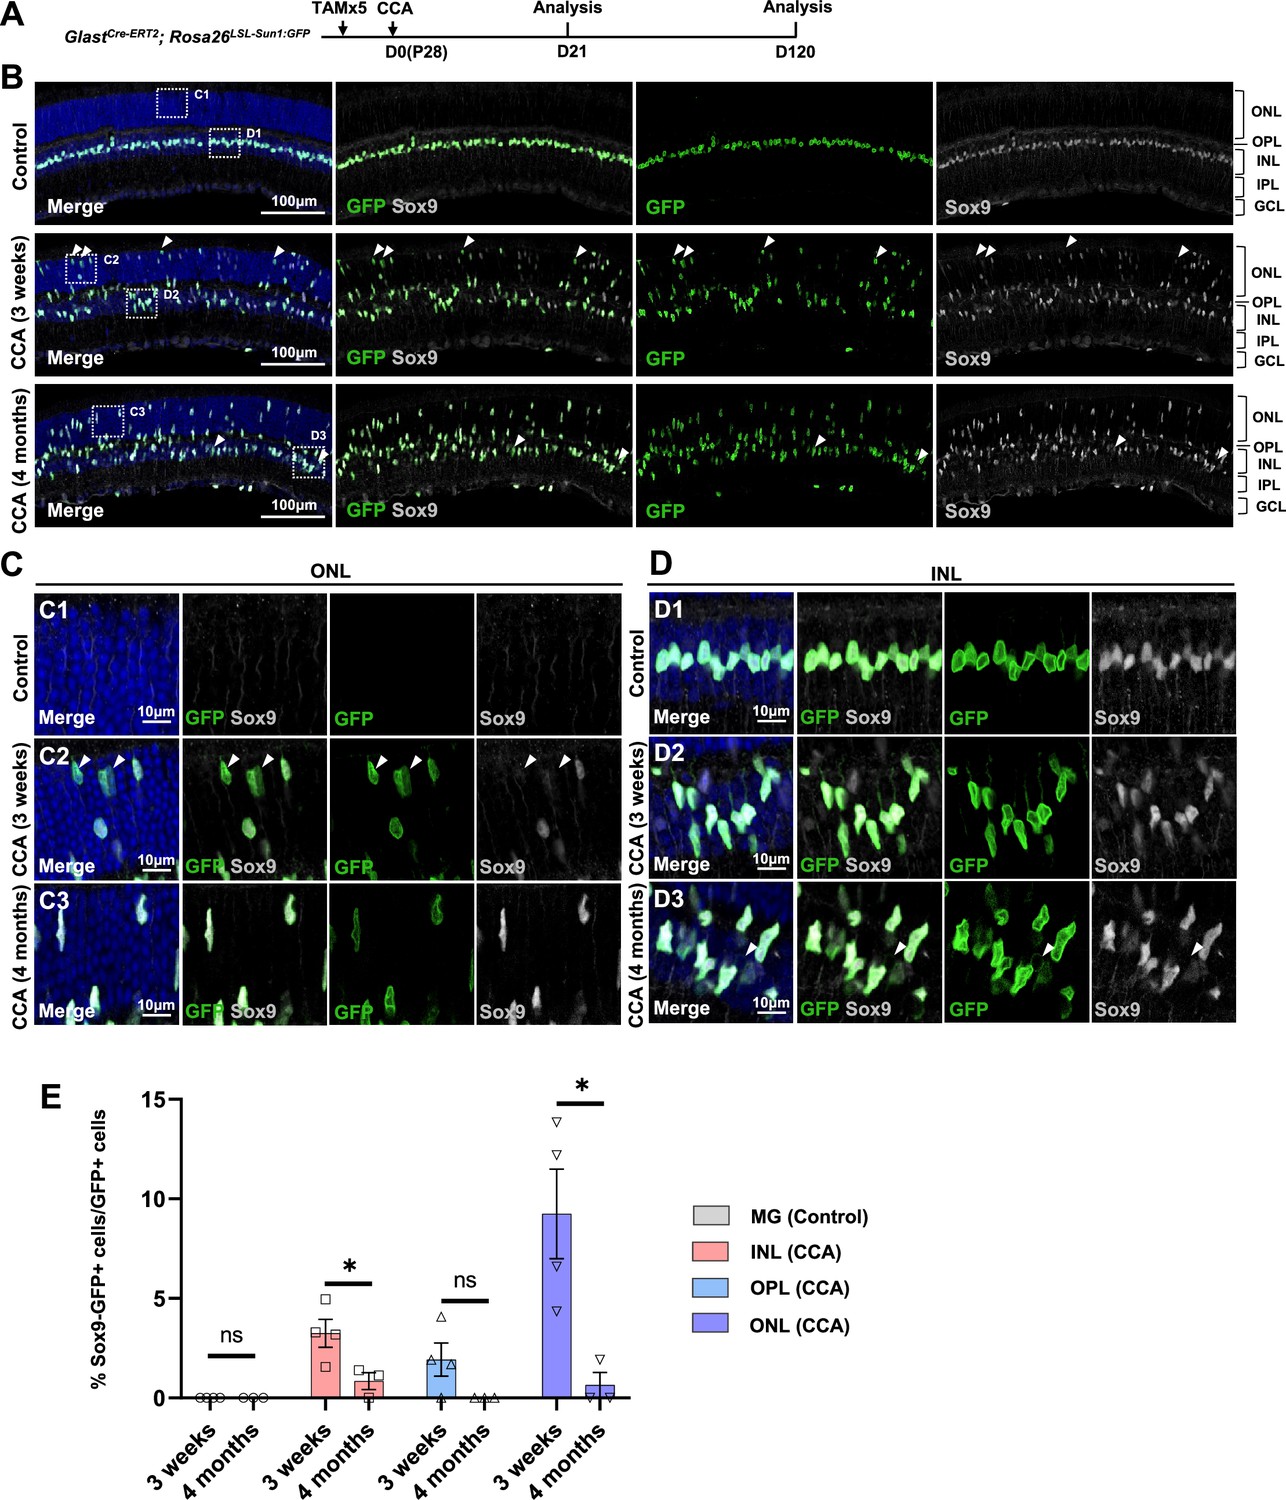
Temporary loss of Sox9 in a subset of Müller glia (MG) following cell cycle activator (CCA) treatment.
(A) Experimental design. (B) Representative retinal sections of GlastCre-ERT2; Rosa26LSL-Sun1:GFP mice without virus injection (control) or mice at 3 weeks and 4 months post-CCA injection. Arrowheads highlight Sox9−GFP+ cells. (C–D) Magnified views of the boxed regions in (B). Arrowheads highlight Sox9−GFP+ cells. (E) Quantification of Sox9−GFP+ cells as a percentage of total GFP+ cells in each retinal layer. n=3 mice, data are presented as mean ± SEM. ns = not significant, *p<0.05 (unpaired two-tailed Student’s t-test). ONL, outer nuclear layer; OPL, outer plexiform layer; INL, inner nuclear layer; IPL, inner plexiform layer; GCL, ganglion cell layer.
Figure 6 with 1 supplement
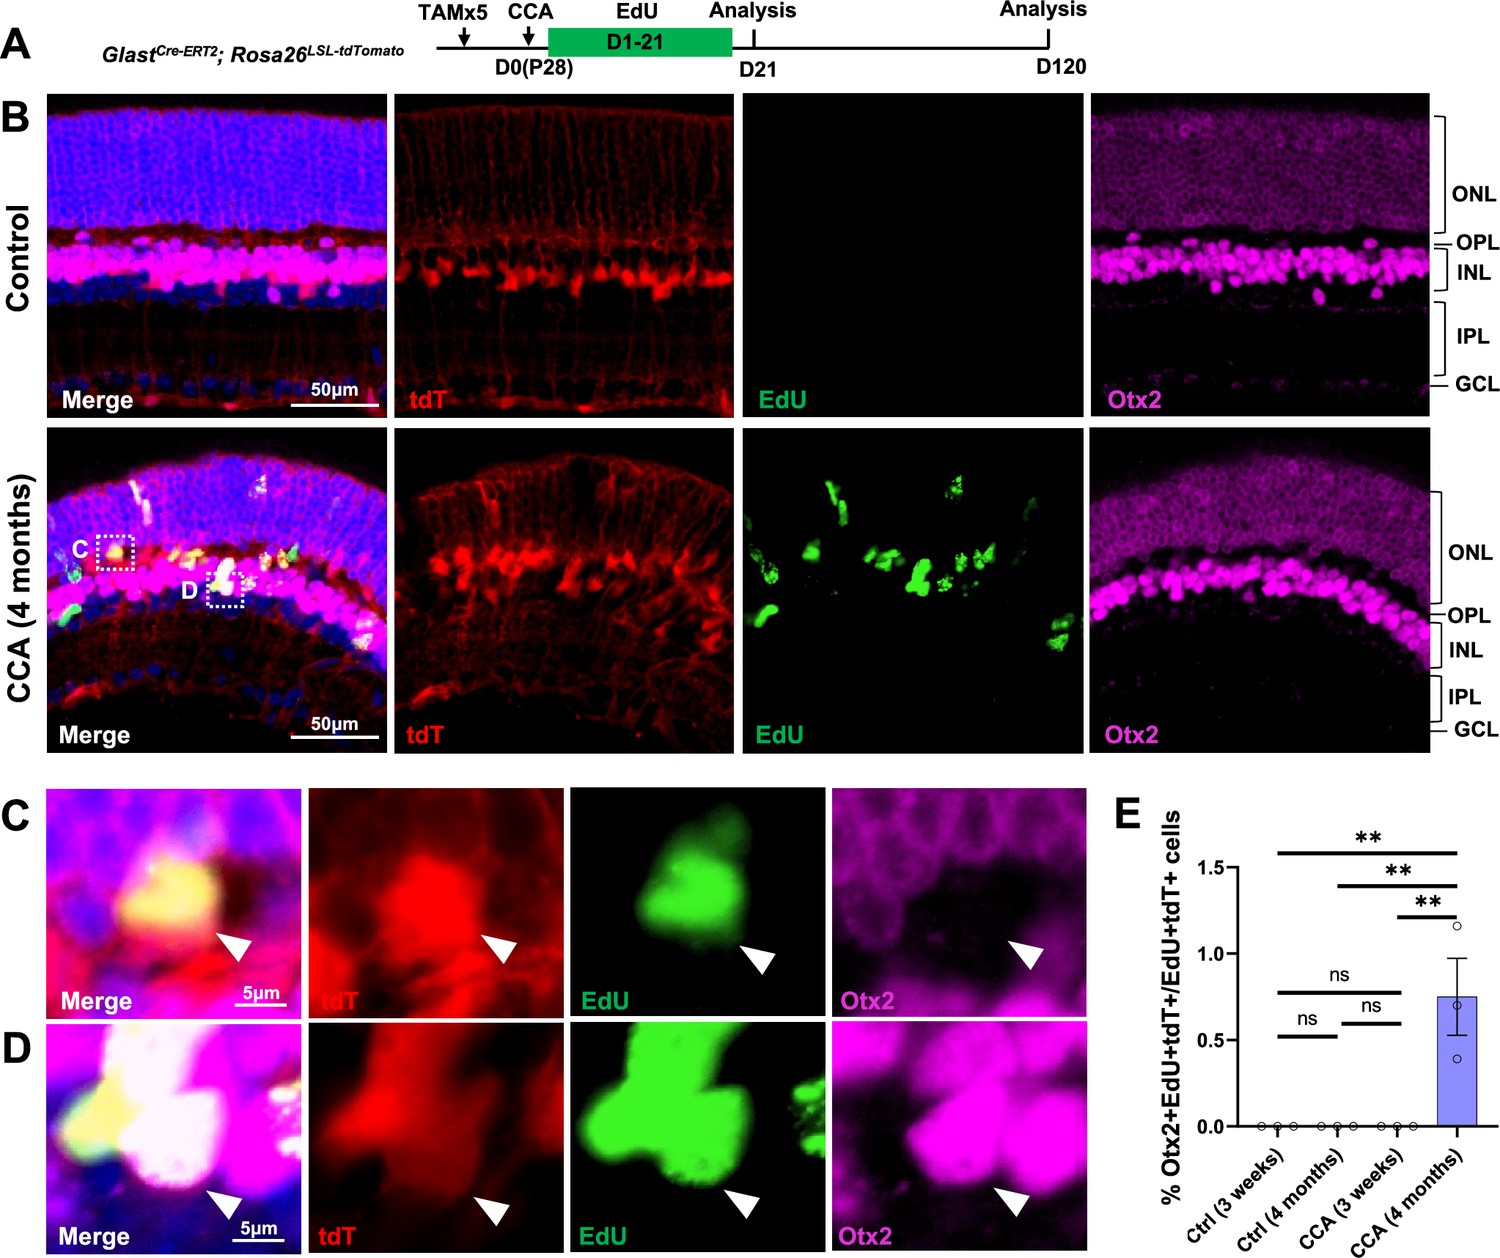
Cell cycle activator (CCA) induces de novo genesis of Otx2+ cells from Müller glia (MG).
(A) Experimental design. (B) Representative retinal sections of GlastCre-ERT2; Rosa26LSL-tdTomato mice without adeno-associated virus (AAV) injection (control) or mice at 4 months post-CCA injection. Sections were co-stained for EdU and Otx2. ONL, outer nuclear layer; OPL, outer plexiform layer; INL, inner nuclear layer; IPL, inner plexiform layer; GCL, ganglion cell layer. (C–D) Magnified views of the highlighted cells in (B). Arrowhead highlights a tdT+EdU+ MG in the OPL that is negative for Otx2 (C), while arrowhead highlights a tdT+EdU+Otx2+ MG in the INL. (E) Quantification of tdT+EdU+Otx2+ cells as a percentage of total tdT+EdU+ cells. n=3 mice, data are presented as mean ± SEM. ns = not significant, **p<0.01 (one-way ANOVA with Tukey’s post hoc test).
Figure 6—figure supplement 1
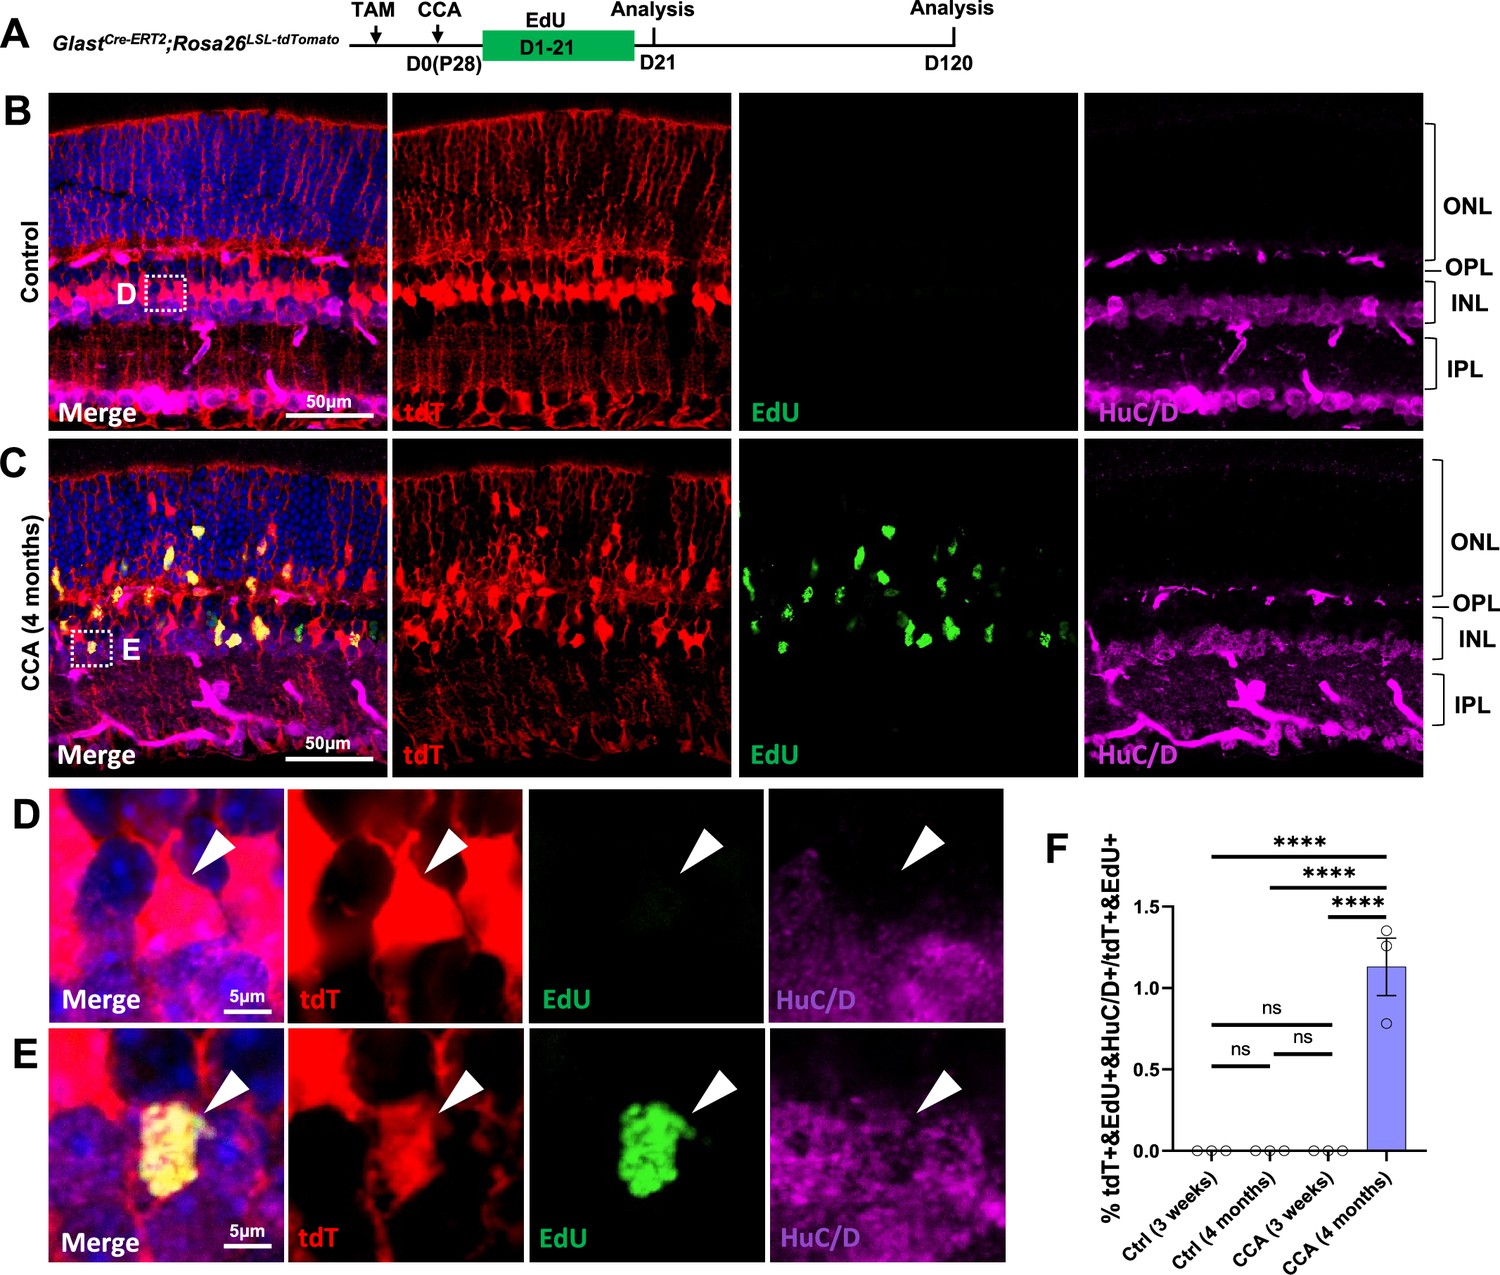
Detection of Müller glia (MG)-derived HuC/D+ cells in the inner nuclear layer (INL) after cell cycle activator (CCA) treatment.
(A) Experimental design. (B–C) Representative images of control uninjected retinas or retinas infected by CCA virus. 5-Ethynyl-2’-deoxyurdine (EdU) was co-labeled with amacrine cell marker HuC/D. (D–E) Enlarged views of the boxed area in (B, C). (F) Quantification of tdT+EdU+HuC/D+ cells as a percentage of total tdT+EdU+ cells at different time points post-CCA treatment in GlastCre-ERT2; Rosa26LSL-tdTomato retinas. Data presented as mean ± SEM, n=3. ****p<0.0001 (one-way ANOVA with Tukey’s post hoc test).
Figure 7 with 1 supplement
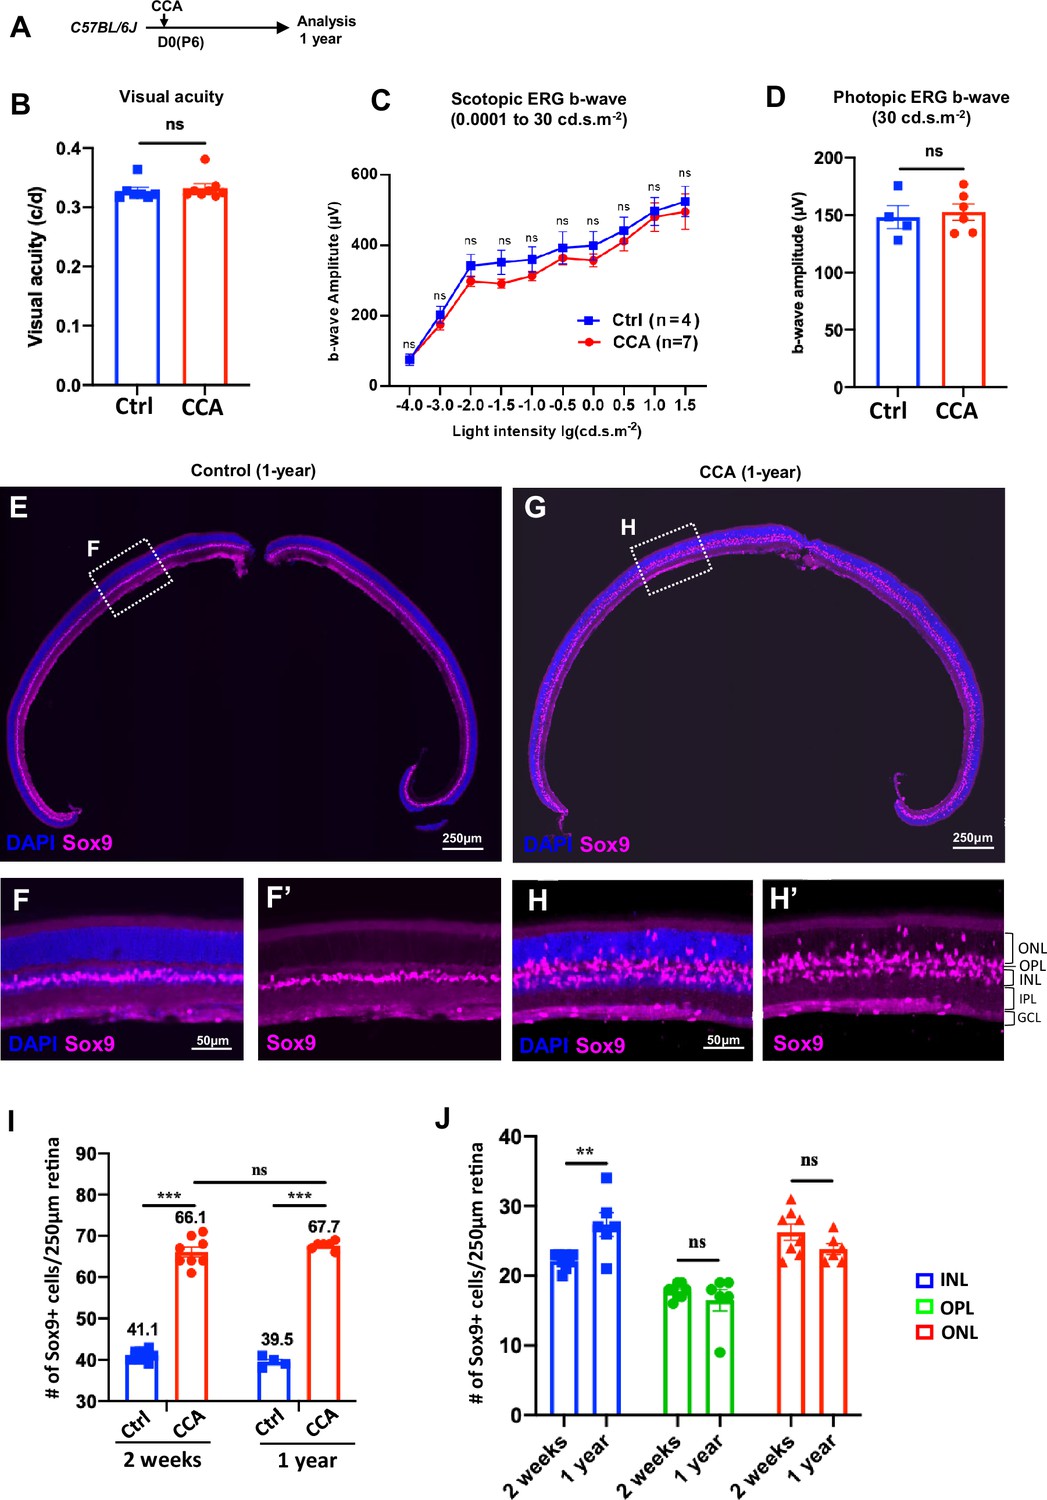
Cell cycle activator (CCA) does not lead to retinal neoplastic transformation.
(A) Experimental design. (B–C) Optomotor and electroretinography (ERG) tests were performed on wild-type mice with one eye injected with CCA and the other eye as control (without AAV injection) at 1-year post-CCA injection. Visual acuity by the optomotor test (B), b-wave amplitudes of the scotopic ERG under different light intensity in (C), and b-wave amplitudes of the photopic ERG under 30 cd×s/m2 in (D). Data are presented as mean ± SEM. ns = not significant (paired two-tailed Student’s t-test) (B–D). (E–H) Immunostaining for MG marker Sox9. (F, H) Zoomed-in images of the boxed areas in (E) and (G). (I) Quantification of the numbers of Sox9+ cells in control retinas versus CCA-treated retinas at 2 weeks or 1-year post-CCA injection and in age-matched wild-type control retinas. Data are presented as mean ± SEM. ns = not significant, ***p<0.001 (one-way ANOVA with Tukey’s post hoc test). (J) Quantification of the number of Sox9+ cells in each retinal layer. Data are presented as mean ± SEM. ns = not significant, **p<0.01 (unpaired two-tailed Student’s t-test).
Figure 7—figure supplement 1
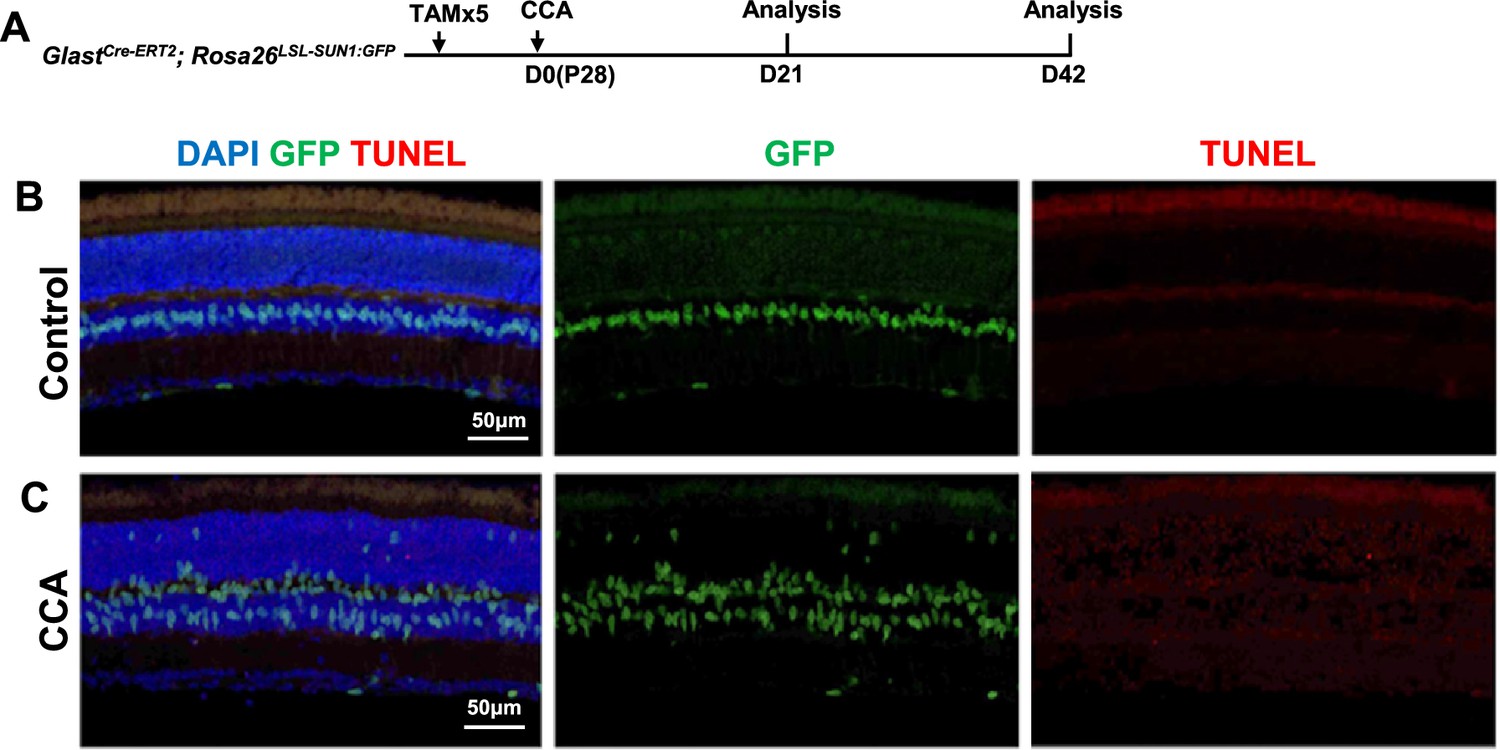
Absence of TUNEL-positive Müller glia (MG) in the retina following cell cycle activator (CCA) treatment.
(A) Experimental design. (B–C) Representative images of TUNEL analysis of GlastCre-ERT2; Rosa26LSL-Sun1:GFP retinas in control (B) or CCA-treated retinas (C) at 3 weeks after CCA treatment.
Additional files
-
Supplementary file 1
Differential gene expression analysis between different cell types or three treatment groups.
Differential gene expression analysis between different cell types or three treatment groups was performed using DESeq2. All genes with counts>0 in the test were considered. No other thresholds were used.
- https://cdn.elifesciences.org/articles/100904/elife-100904-supp1-v1.xlsx
-
MDAR checklist
- https://cdn.elifesciences.org/articles/100904/elife-100904-mdarchecklist1-v1.docx
Download links
A two-part list of links to download the article, or parts of the article, in various formats.
Downloads (link to download the article as PDF)
Open citations (links to open the citations from this article in various online reference manager services)
Cite this article (links to download the citations from this article in formats compatible with various reference manager tools)
Simultaneous cyclin D1 overexpression and p27kip1 knockdown enable robust Müller glia cell cycle reactivation in uninjured mouse retina
eLife 13:RP100904.
https://doi.org/10.7554/eLife.100904.3


