Temporal dynamics analysis reveals that concurrent working memory load eliminates the Stroop effect through disrupting stimulus-response mapping
- School of Psychology, Shanghai University of Sport, China
- School of Psychology and Cognitive Science, East China Normal University, China
- Faculty of Psychology, Southwest University, China
- Brain Health Institute, National Center for Mental Disorders, Shanghai Mental Health Center, Shanghai Jiao Tong University School of Medicine and School of Psychology, China
Figures
Figure 1
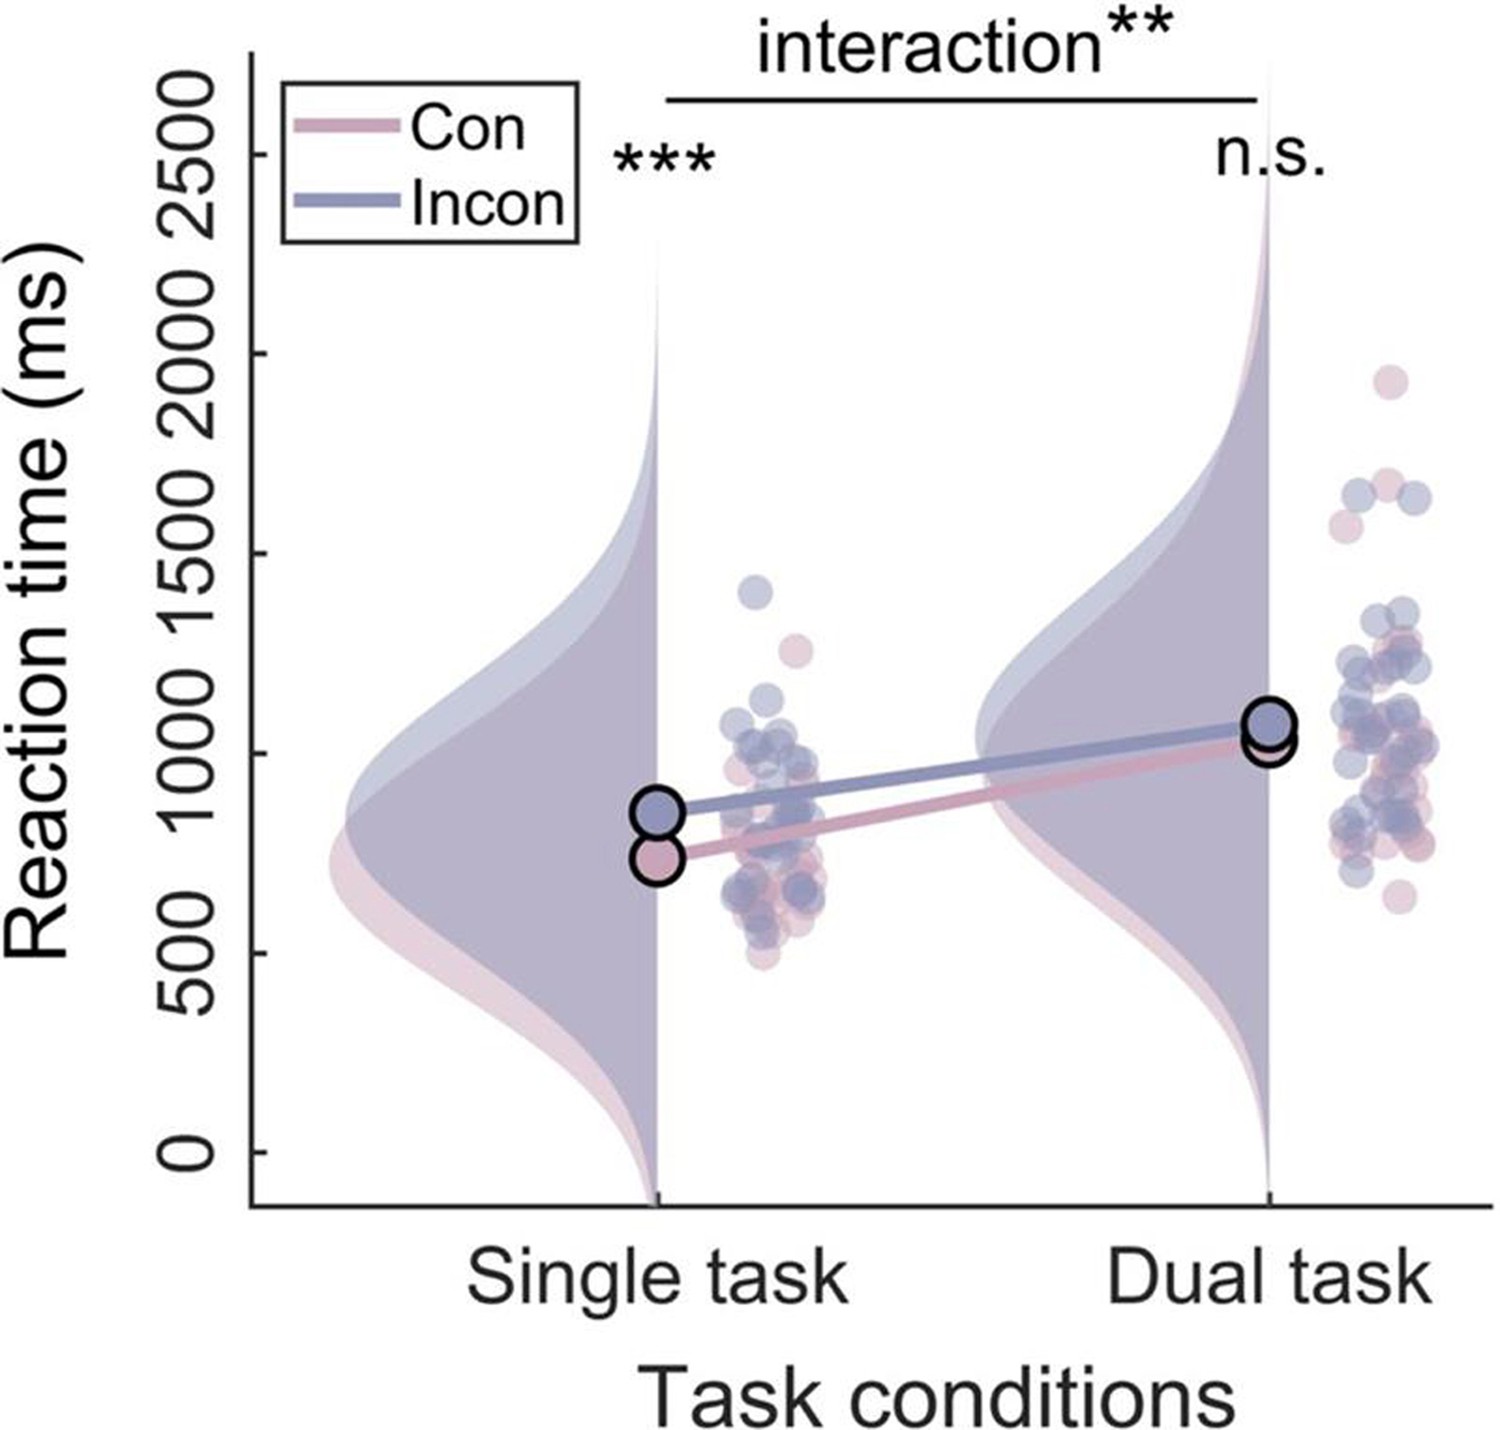
Raincloud plots (Allen et al., 2019) of behavioral data.
The plot consists of a probability density plot, a line graph, and raw data points. **p<0.01, ***p<0.001.
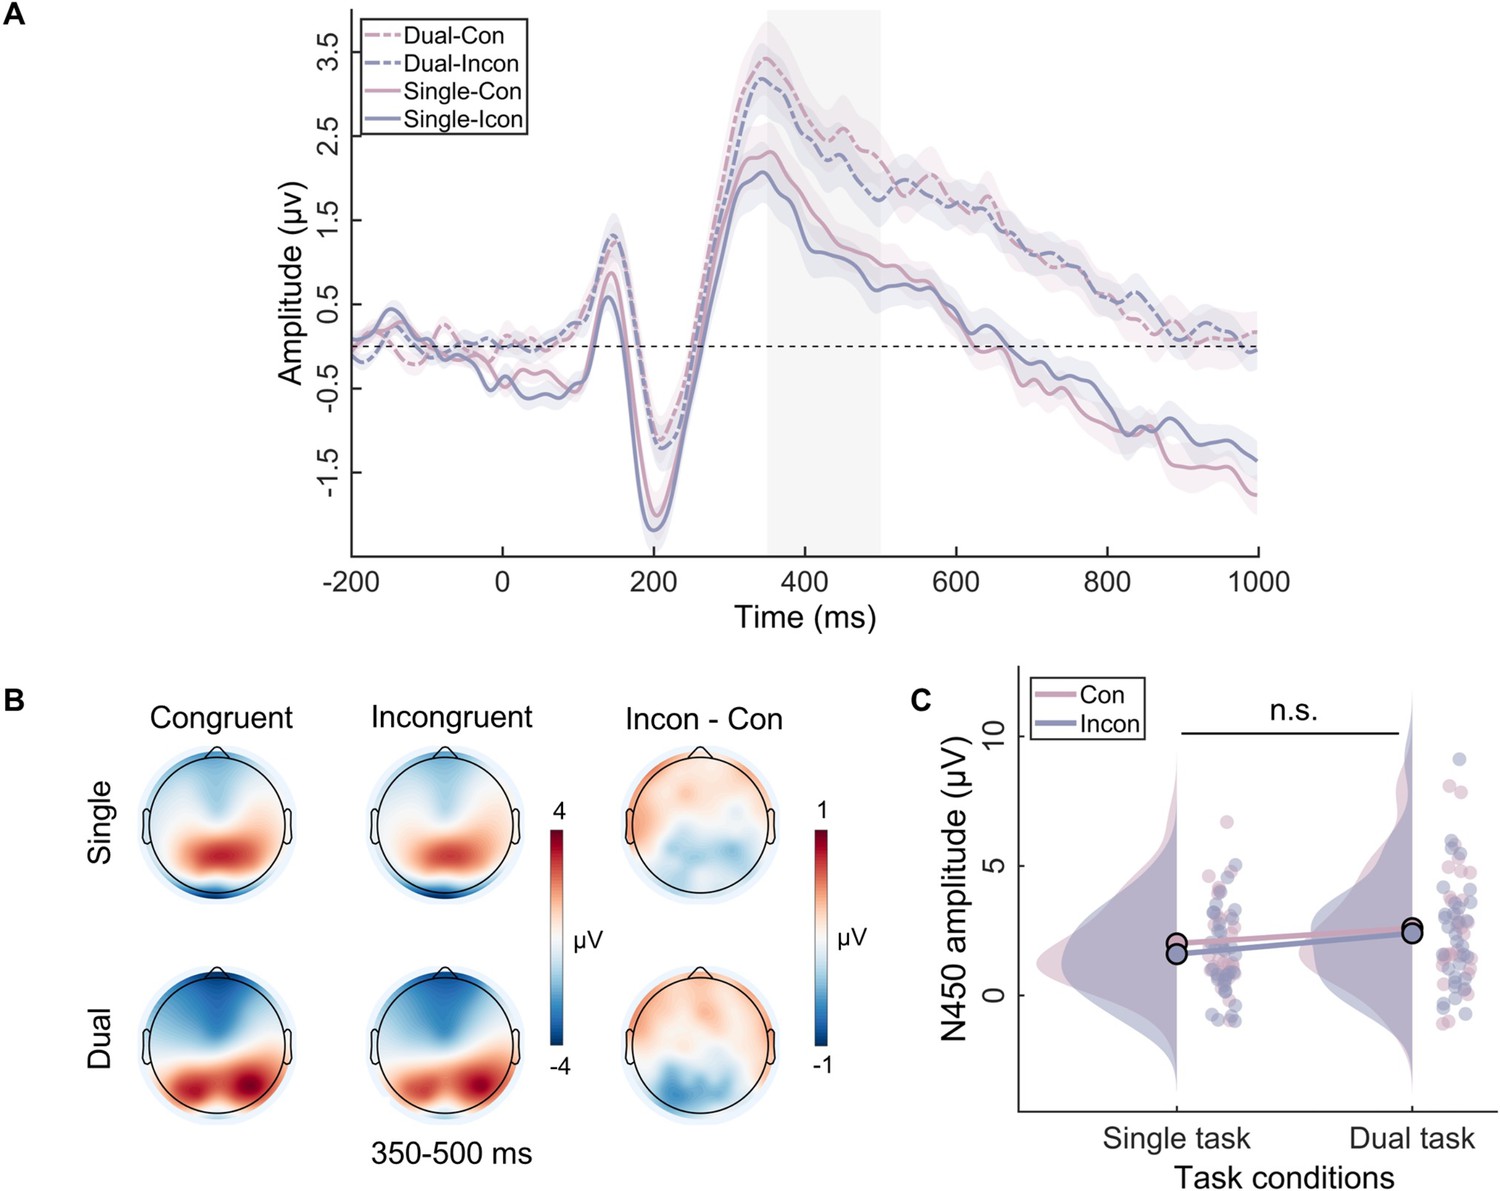
Figure 2

The P1 results in the single task and the dual task.
(A) The event-related potential (ERP) waveforms for the P1 component. The shaded rectangle represents the defined time windows, and the shading above and below the ERP waveform represents the 95% confidence intervals. (B) Topographic distributions of average amplitude for each condition within the time window (110–150 ms) and the amplitude differences between congruent and incongruent trials in single and dual tasks. (C) Raincloud plots of amplitude for P1 across conditions. n.s., not significant.
Figure 3
The N450 results in the single task and the dual task.
(A) The event-related potential (ERP) waveforms for N450 components. The shaded rectangle represents the defined time windows, and the shading above and below the ERP waveform represents the 95% confidence intervals. (B) Topographic distributions of average amplitude for each condition within the time window (350–500 ms) and the amplitude differences between congruent and incongruent trials in single and dual tasks. (C) Raincloud plots of amplitude for N450 across conditions. n.s., not significant.
Figure 4
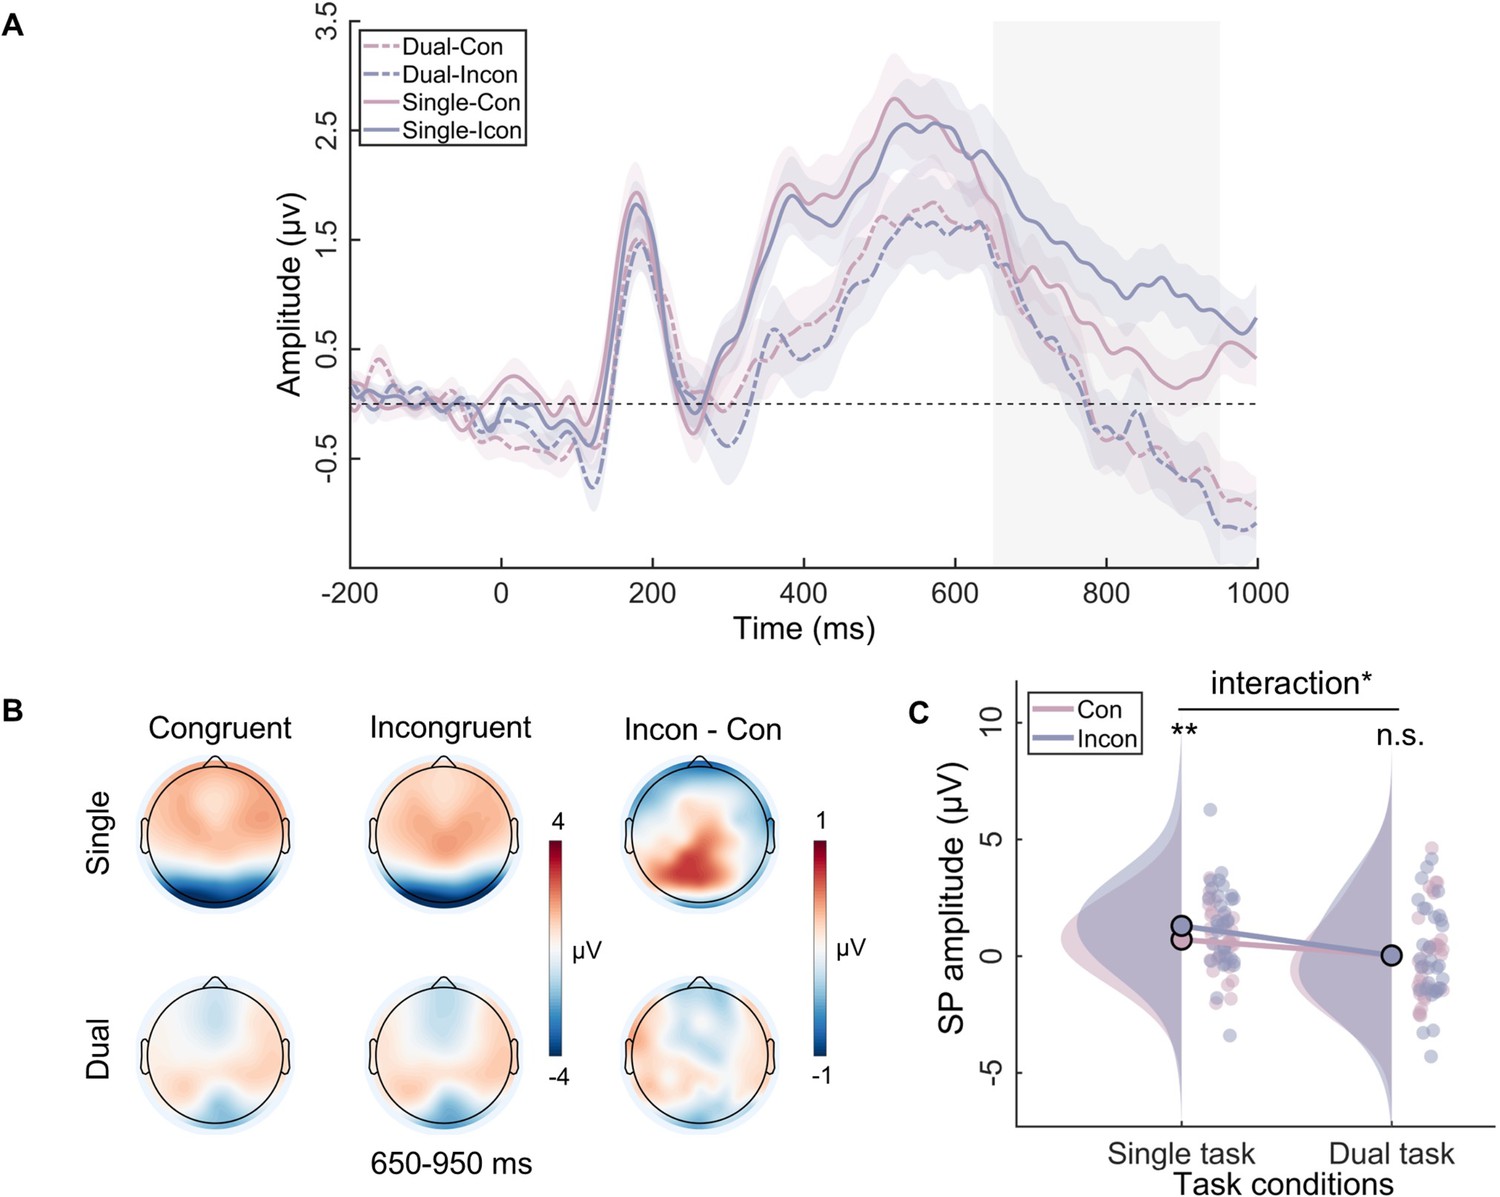
The sustained potential (SP) results in the single task and the dual task.
(A) The event-related potential (ERP) waveforms for SP components. The shaded rectangle represents the defined time windows, and the shading above and below the ERP waveform represents the 95% confidence intervals. (B) Topographic distributions of average amplitude for each condition within the time window (650–950 ms) and the amplitude differences between congruent and incongruent trials in single and dual tasks. (C) Raincloud plots of amplitude for SP across conditions. n.s., not significant, *p<0.05, **p<0.01.
Figure 5 with 1 supplement

Multivariate pattern analysis (MVPA) results for (A) the theta band, (B) the alpha band, and (C) the beta band.
Dots denote significant differences from chance (p<0.01). Shading represents clusters of significant time points (cluster-corrected).
Figure 5—figure supplement 1
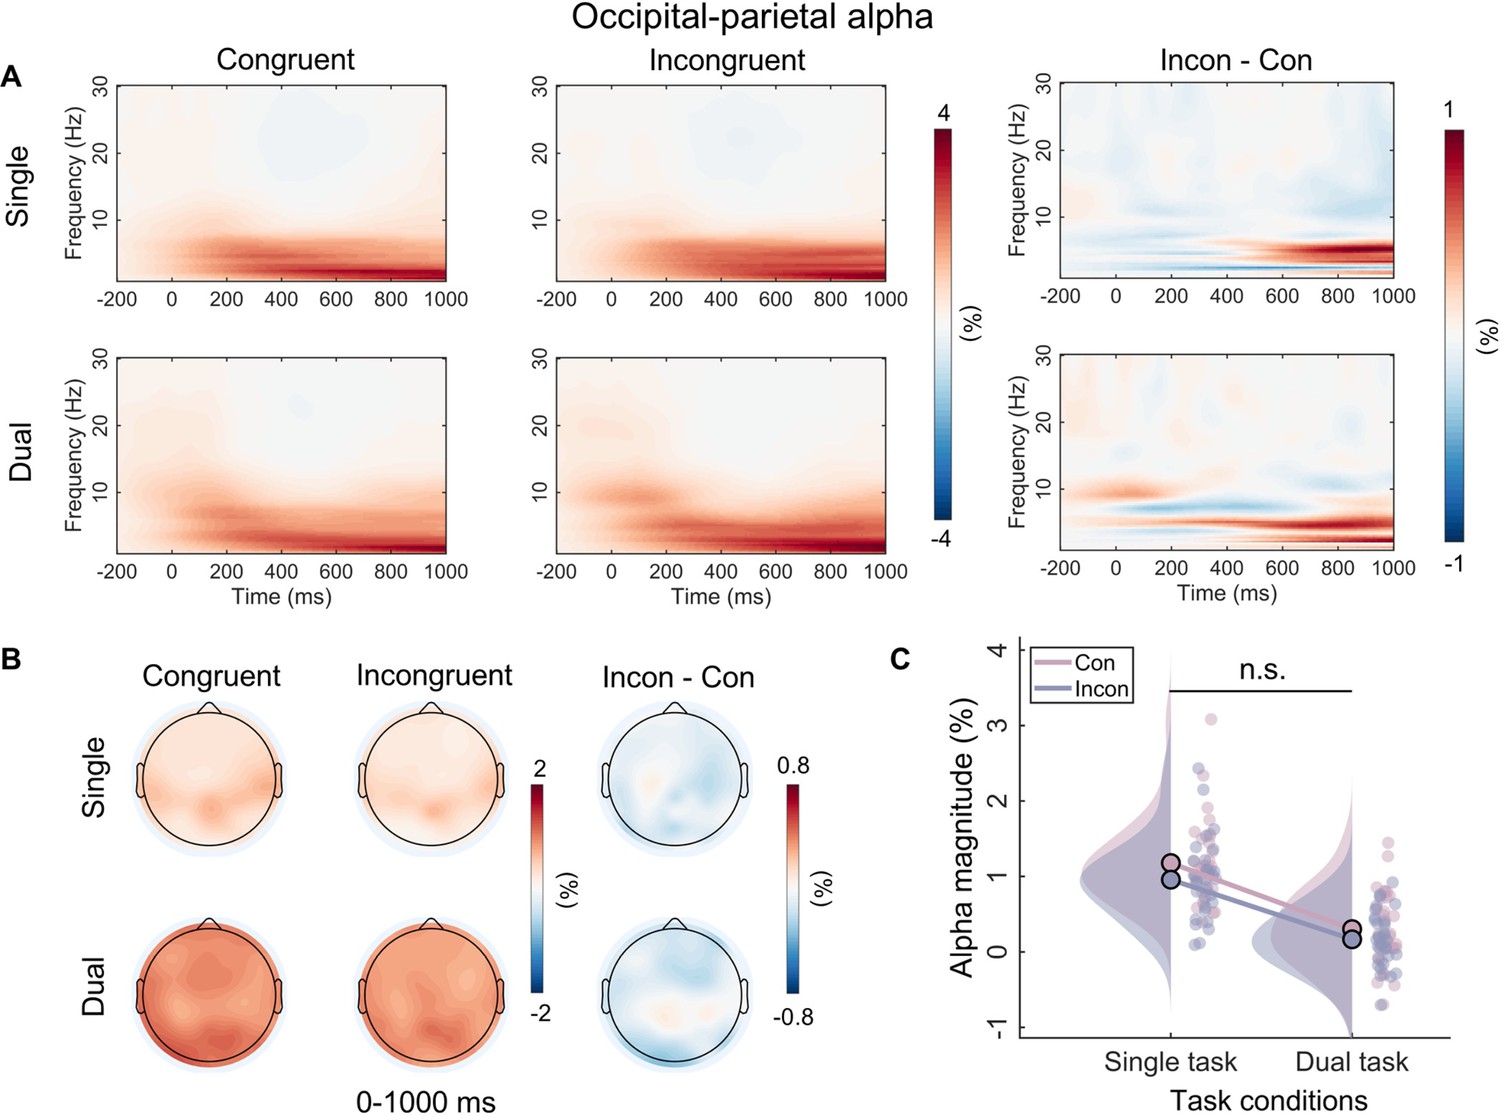
Time-frequency results for the alpha band.
(A) Grand-average time-frequency representations for the alpha band over the occipital-parietal area (POz, Oz, PO3, PO4, PO7, PO8, O1, O2) for each condition, and the difference activity between congruent and incongruent trials in single and dual tasks. (B) Topographic distributions of average amplitude for each condition within the defined time-frequency region of interest (8–13 Hz, 0–1000 ms) and the magnitude differences between congruent and incongruent trials in single and dual tasks. (C) Raincloud plots of event-related spectral perturbation (ERSP) magnitudes for the alpha band across conditions. n.s., not significant.
Figure 6
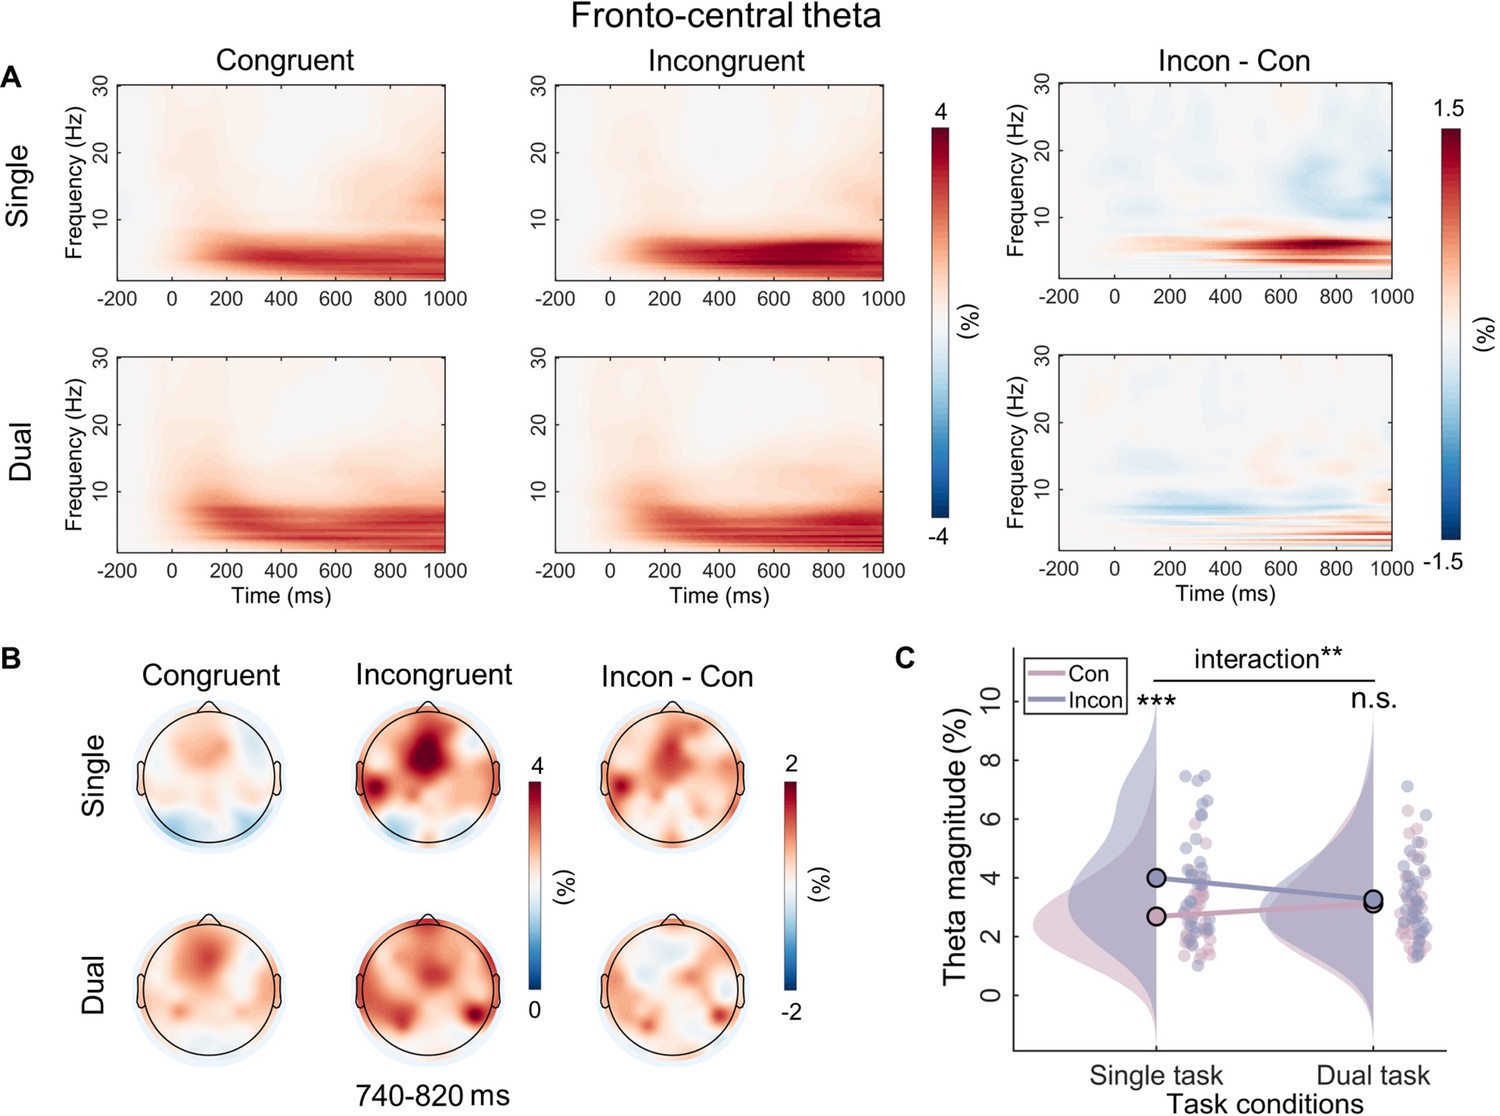
Time-frequency results for the theta band.
(A) Grand-average time-frequency representations for the theta band over fronto-central area (Fz, FCz, Cz) for each condition, and the difference activity between congruent and incongruent trials in single and dual tasks. (B) Topographic distributions of average amplitude for each condition within the defined time-frequency region of interest (4–7 Hz, 740–820 ms) and the magnitude differences between congruent and incongruent trials in single and dual tasks. (C) Raincloud plots of event-related spectral perturbation (ERSP) magnitudes for theta band across conditions. n.s., not significant. **p<0.01, ***p<0.001.
Figure 7
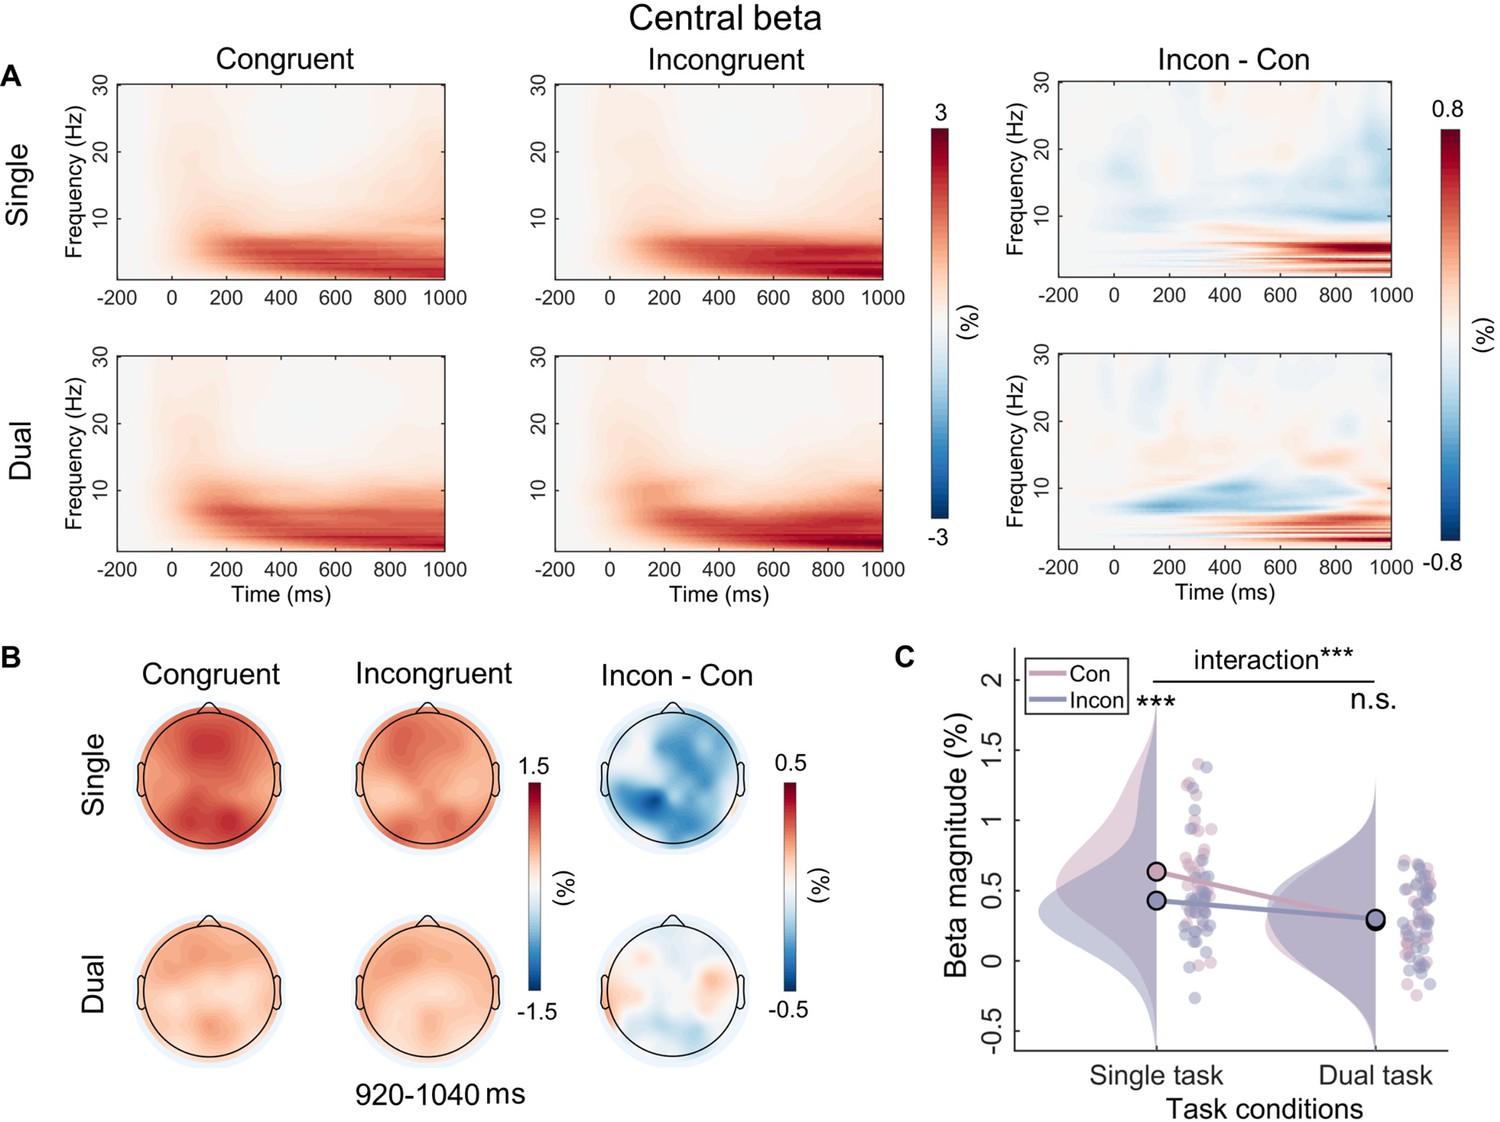
Time-frequency results for the beta band.
Figure 8
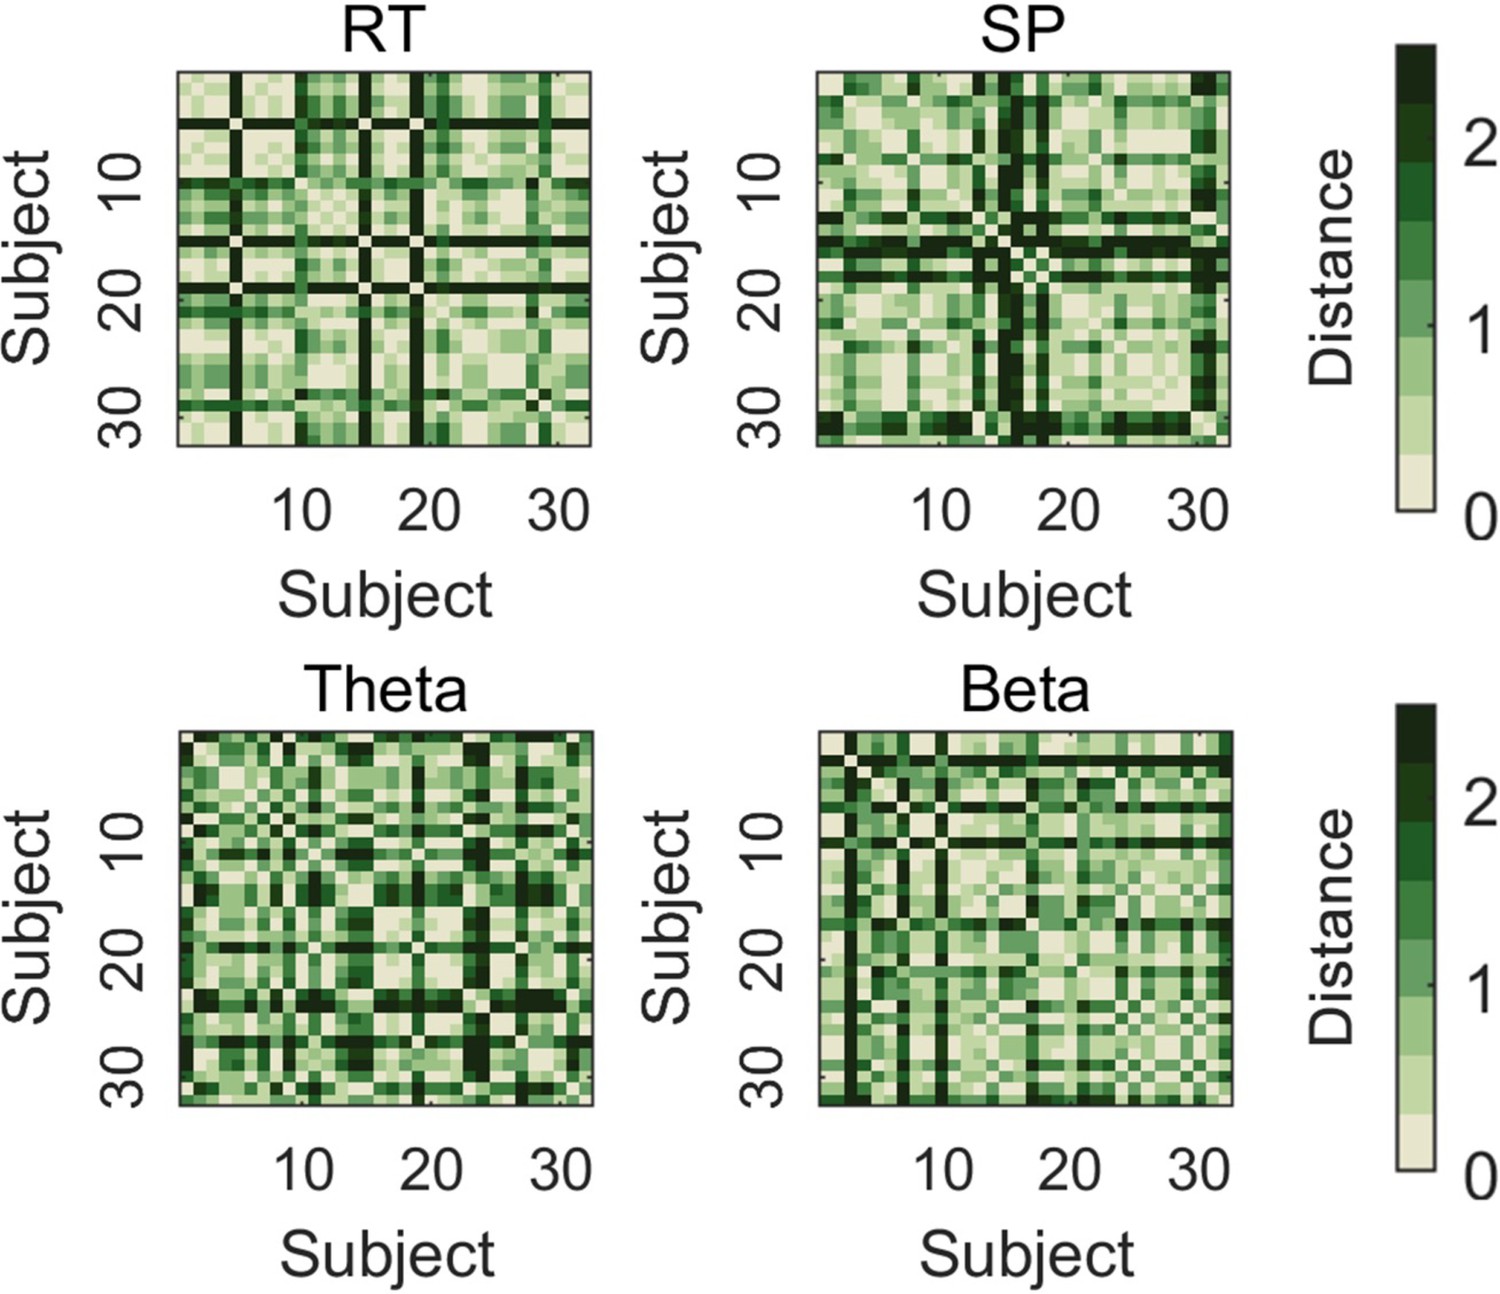
Representational dissimilarity matrices (RDMs) for the interaction pattern in response time (RT), sustained potential (SP), theta, and beta.
Each RDM is calculated as the Euclidean distances of data reflecting interaction pattern from 32 subjects.
Figure 9

Schematic illustration of experimental trial structures and stimuli types.
(A) Dual-task structure. (B) Single-task structure. (C) Representative stimuli for congruent and incongruent conditions.
Additional files
Download links
A two-part list of links to download the article, or parts of the article, in various formats.
Downloads (link to download the article as PDF)
Open citations (links to open the citations from this article in various online reference manager services)
Cite this article (links to download the citations from this article in formats compatible with various reference manager tools)
Temporal dynamics analysis reveals that concurrent working memory load eliminates the Stroop effect through disrupting stimulus-response mapping
eLife 13:RP100918.
https://doi.org/10.7554/eLife.100918.3


