Ferroptosis-related genes mediate tumor microenvironment and prognosis in triple-negative breast cancer via integrated RNA-seq analysis
- Department of Ultrasound, National Cancer Center/National Clinical Research Center for Cancer/Cancer Hospital, Chinese Academy of Medical Sciences and Peking Union Medical College, China
- Department of Ultrasound, Beijing Hospital of Traditional Chinese Medicine, Capital Medical University, China
- Department of Ultrasound, Affiliated Cancer Hospital of Zhengzhou University, China
- Key Laboratory of Cancer and Microbiome, State Key Laboratory of Molecular Oncology, National Cancer Center/National Clinical Research Center for Cancer/Cancer Hospital, Chinese Academy of Medical Sciences and Peking Union Medical College, China
- Department of Ultrasound, The First Affiliated Hospital of China Medical University, Shenyang, China
Figures
Figure 1 with 1 supplement
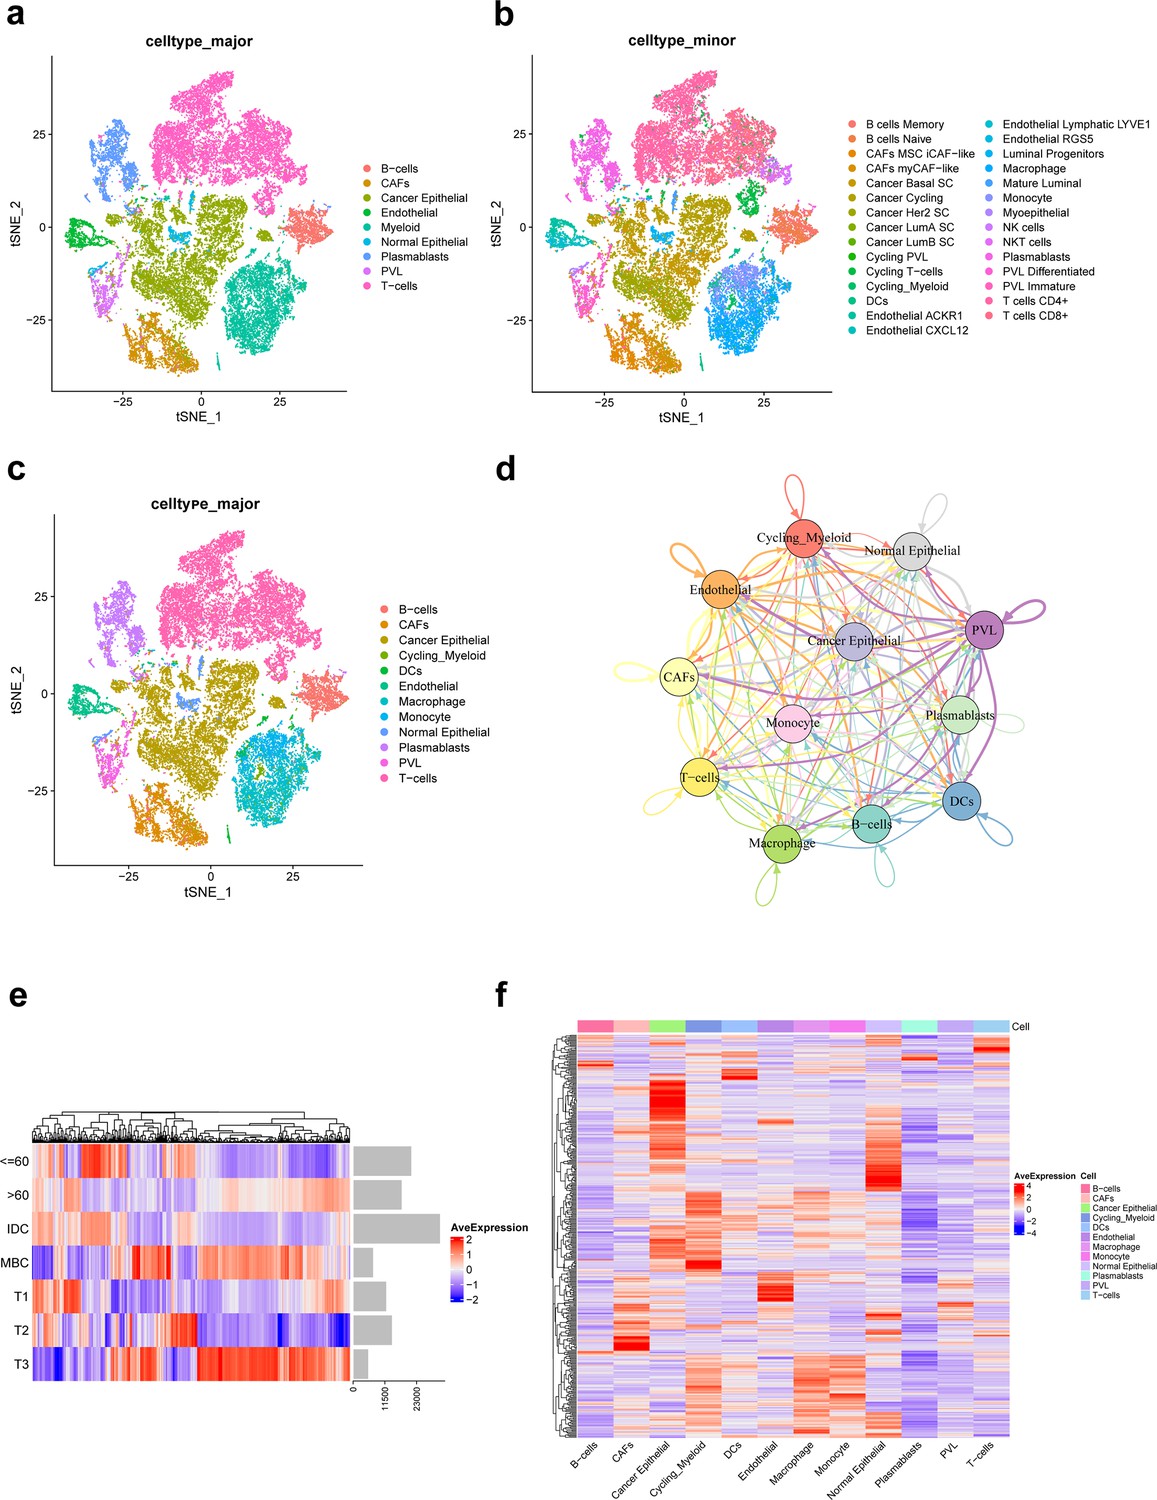
Integration and clustering of scRNA-seq data from triple-negative breast cancer.
(a) t-SNE plot of the nine major cell clusters. (b) t-SNE plot of the 29 minor cell clusters. (c) t-SNE plot of the 12 major cell clusters. (d) The number of ligand–receptor interactions of different major cell clusters in cellcell communication network, different colors represent different cell clusters, and arrows represent ligandreceptor orientation. (e) Heat map showing the average expression of ferroptosis-related genes in different clinicopathological classifications. (f) Heat map showing the average expression of ferroptosis-related genes in different major cell clusters.
-
Figure 1—source code 1
Single-cell RNA-seq data preprocessing in triple-negative breast cancer.
- https://cdn.elifesciences.org/articles/100923/elife-100923-fig1-code1-v1.zip
Figure 1—figure supplement 1
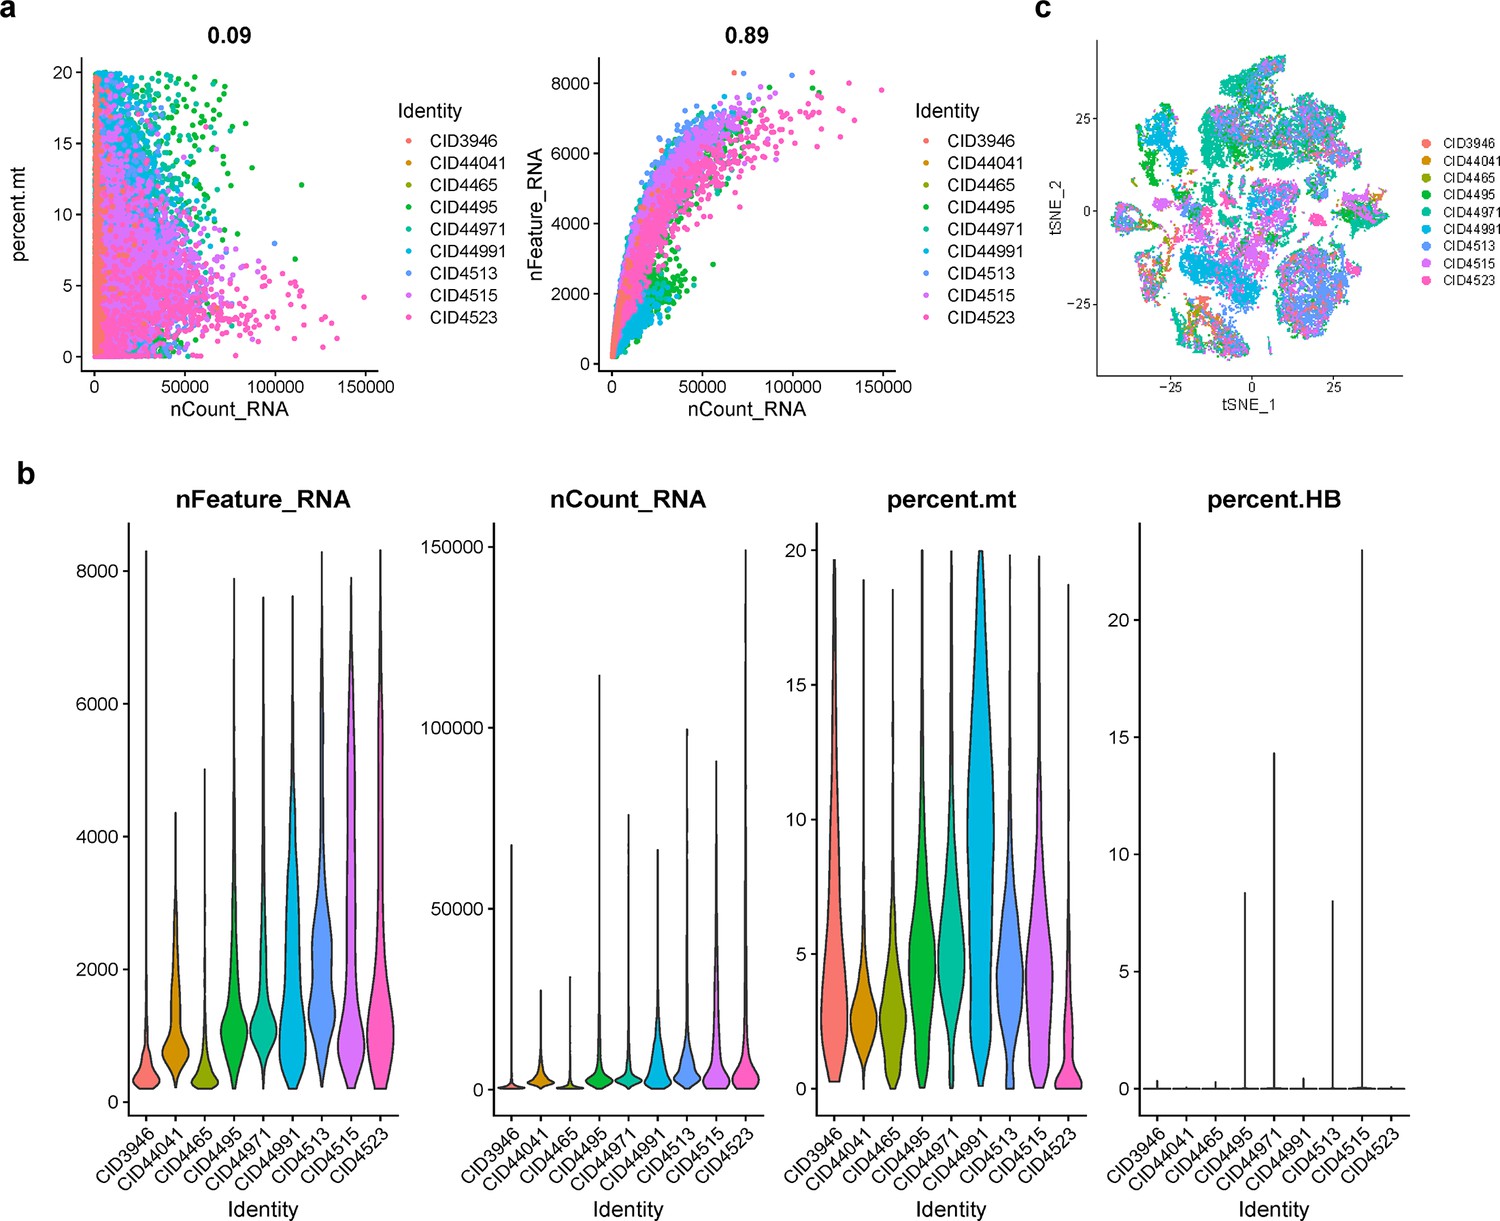
Single-cell RNA-seq data preprocessing in triple-negative breast cancer.
(a) Correlation analysis between the number of genes detected per cell and the total RNA molecule count, as well as the proportion of mitochondrial gene expression. (b) Violin plots visualizing statistical distributions of gene counts, total RNA molecule counts, mitochondrial gene proportion, and hemoglobin gene proportion across triple-negative breast cancer samples. (c) t-SNE plot of samples after batch effect correction.
Figure 2
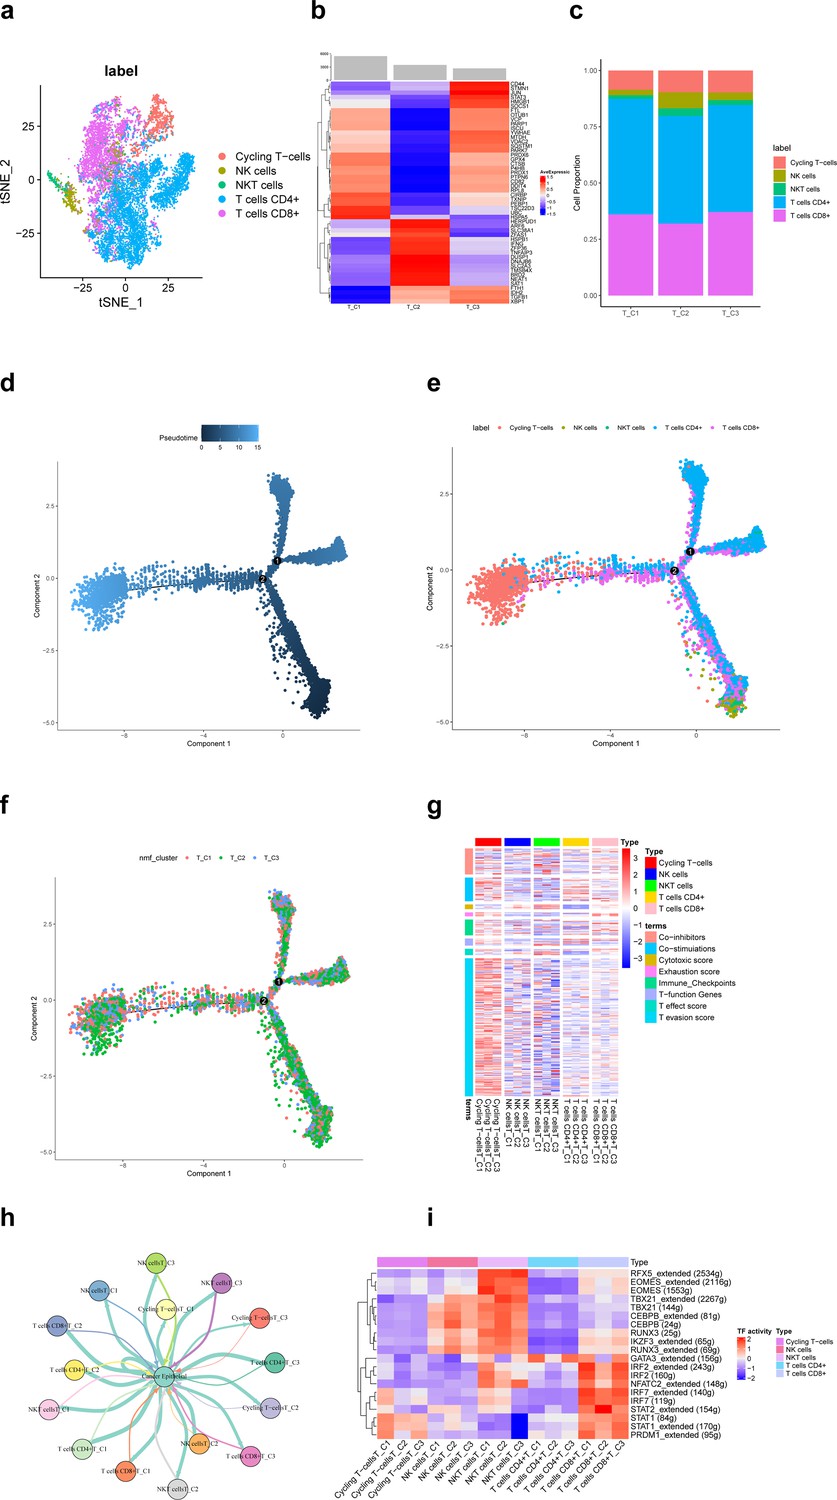
Ferroptosis-related subpopulations of T cells in triple-negative breast cancer.
(a) t-SNE plot of the five identified clusters of T cells. (b) Heat map showing the expression of ferroptosis-related genes (top 50) in three subpopulations of T cells. (c) Demonstration of the proportion of clusters of T cells in ferroptosis-related subpopulations. (d) Pseudotime trajectories showing the developmental time course of T cells. (e) Pseudotime trajectories of the five identified clusters of T cells. (f) Pseudotime trajectories of ferroptosis-related subpopulations of T cells. (g) Heat map showing the average expression of signature genes associated with 8 functions in 15 subpopulations of T-cells. (h) Network diagram of the cell–cell communication between cancer epithelial cells and T cells. (i) Heat map for differential analysis of transcription factors activity.
-
Figure 2—source code 1
Ferroptosis-related subpopulations of T cells in triple-negative breast cancer.
- https://cdn.elifesciences.org/articles/100923/elife-100923-fig2-code1-v1.zip
Figure 3 with 1 supplement
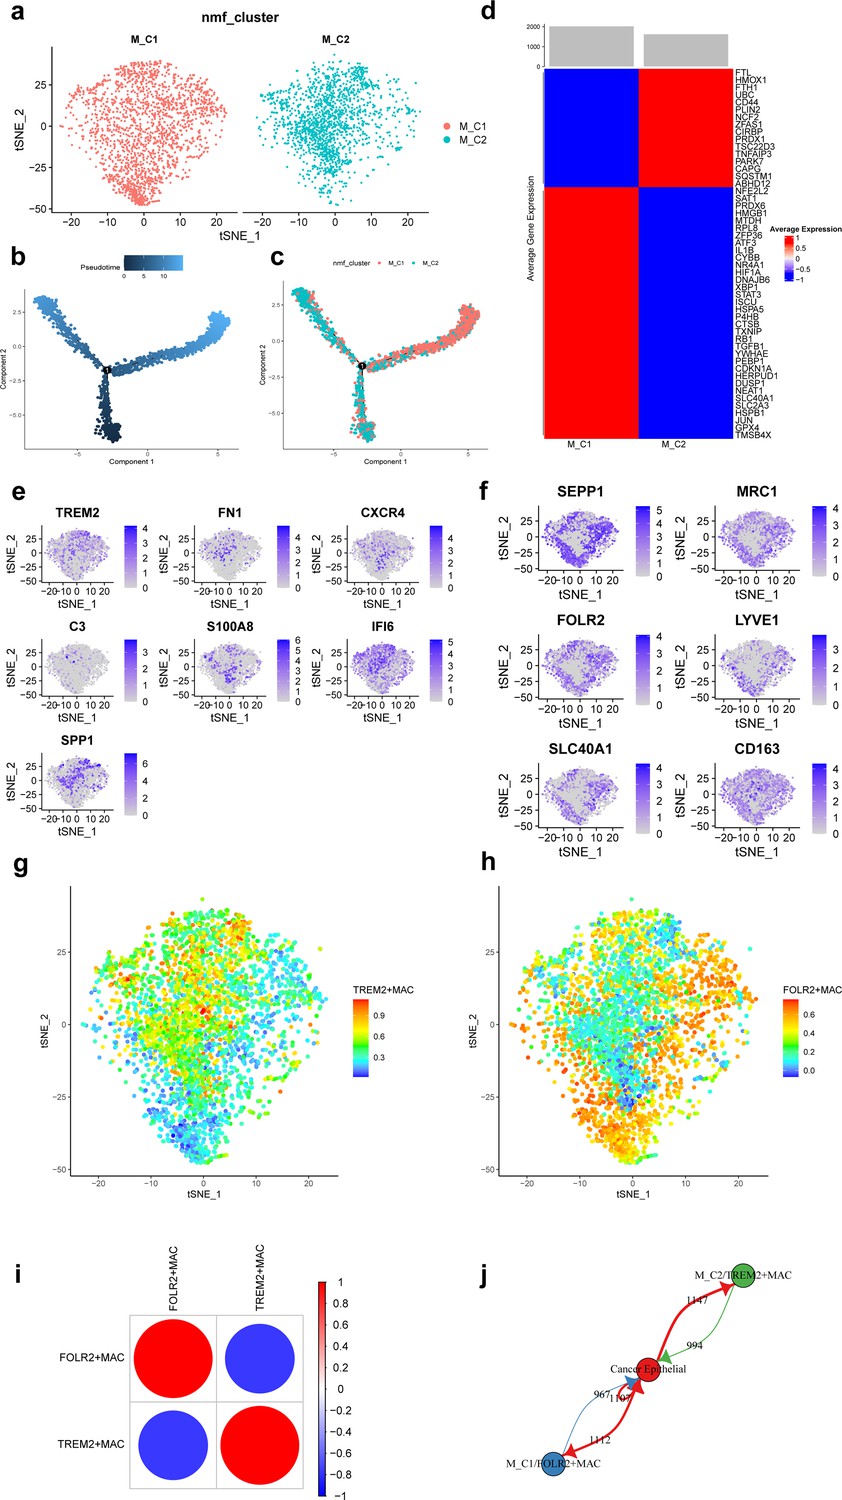
Ferroptosis-related subpopulations of macrophages in triple-negative breast cancer.
(a) t-SNE plot of two ferroptosis-related subpopulations of macrophages. (b) Pseudotime trajectories showing the developmental time course of macrophages. (c) Pseudotime trajectories of two ferroptosis-related subpopulations of macrophages. (d) Heat map showing the average expression of ferroptosis-related genes in two subpopulations of macrophages. (e) t-SNE plot showing the expression patterns of marker genes in M_C2. (f) t-SNE plot showing the expression patterns of marker genes in M_C1. (g) t-SNE plot showing the enrichment score of the TREM2 + MAC in each cell. (h) t-SNE plot showing the enrichment score of the FOLR2 + MAC in each cell. (i) Bubble plot showing the correlation of enrichment score between TREM2 + MAC and FOLR2 + MAC. (j) Network diagram of the cell-cell communication between cancer epithelial cells and ferroptosis-related subpopulations of macrophages.
-
Figure 3—source code 1
Ferroptosis-related subpopulations of macrophages in triple-negative breast cancer.
- https://cdn.elifesciences.org/articles/100923/elife-100923-fig3-code1-v1.zip
Figure 3—figure supplement 1
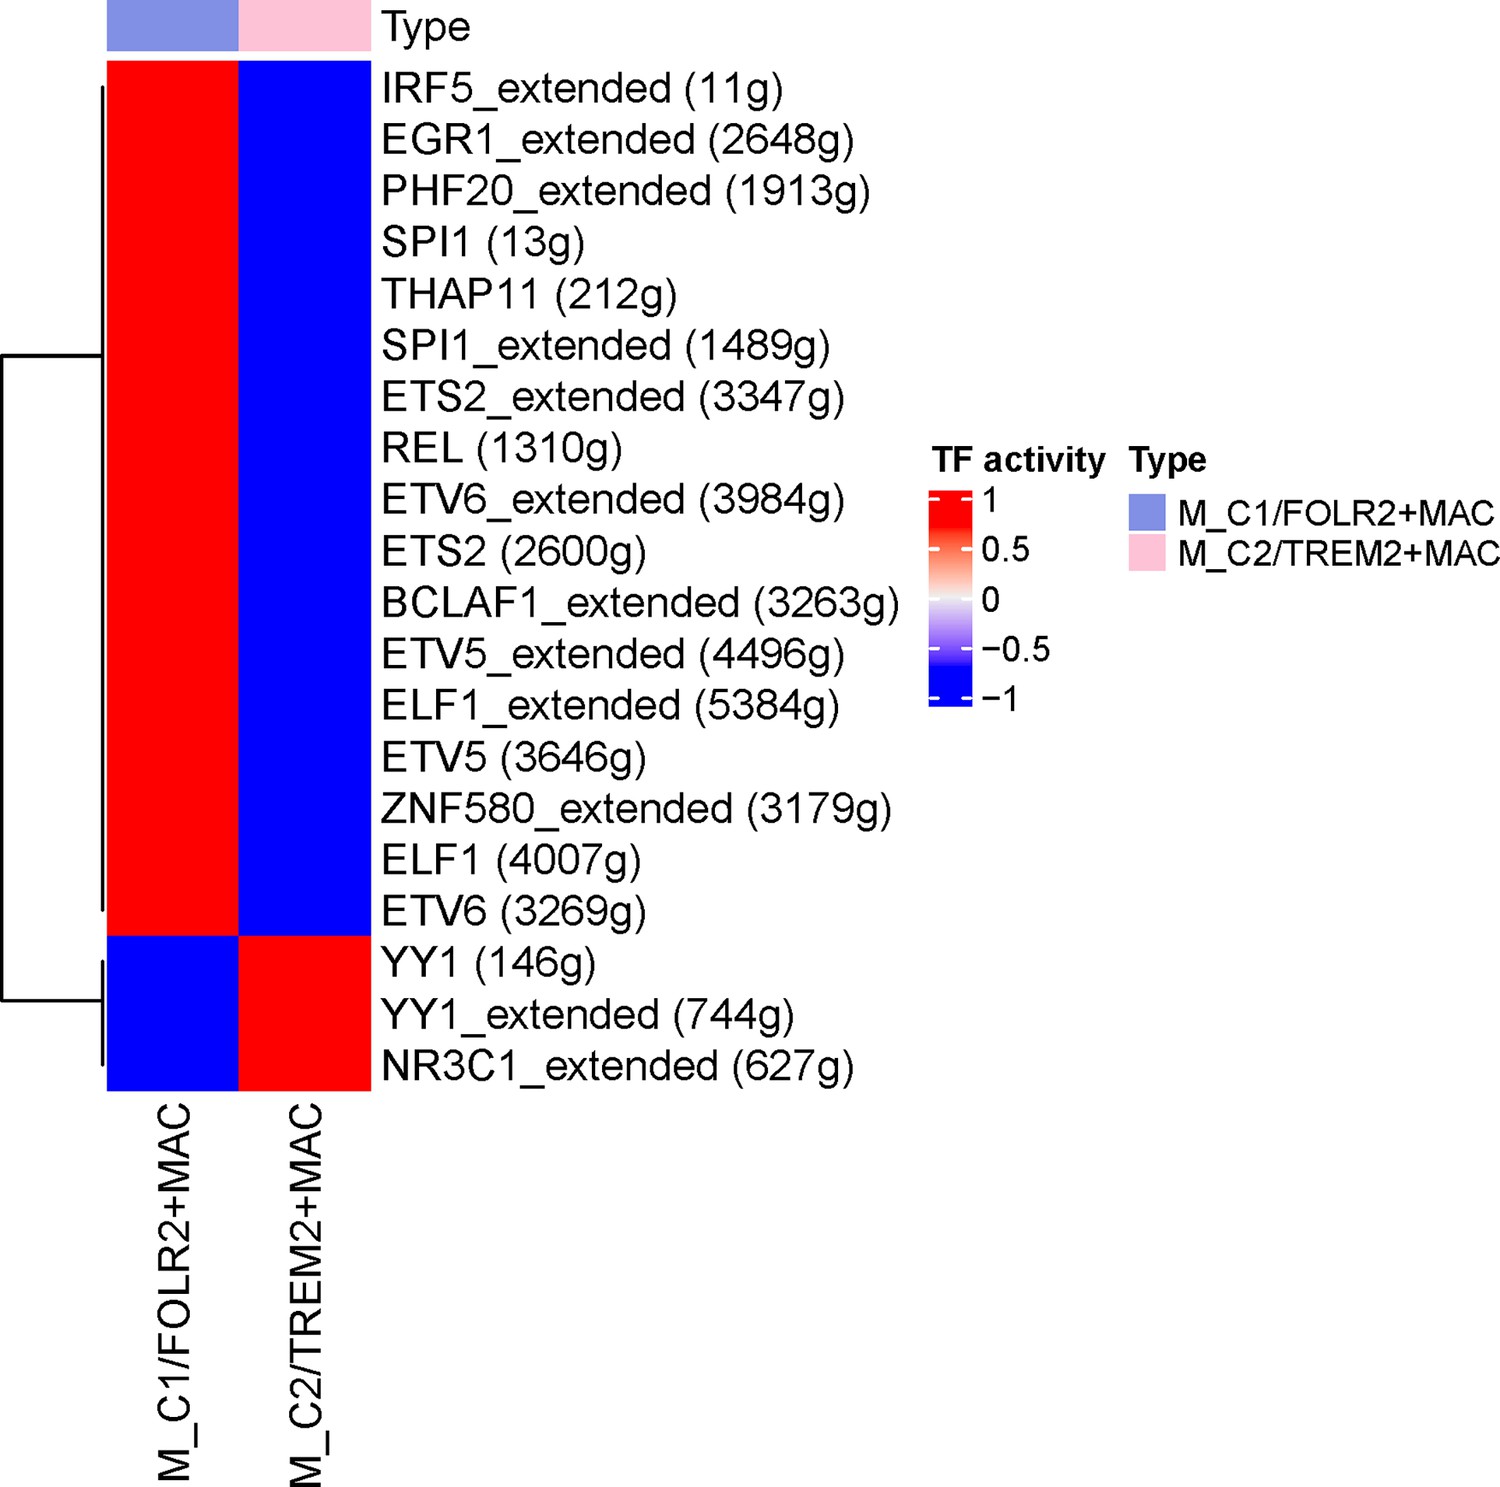
Heat map for differential analysis of transcription factors activity among different subpopulations of macrophages in the triple-negative breast cancer.
Figure 4 with 1 supplement
Prognostic differences in triple-negative breast cancer with ferroptosis-related subpopulations.
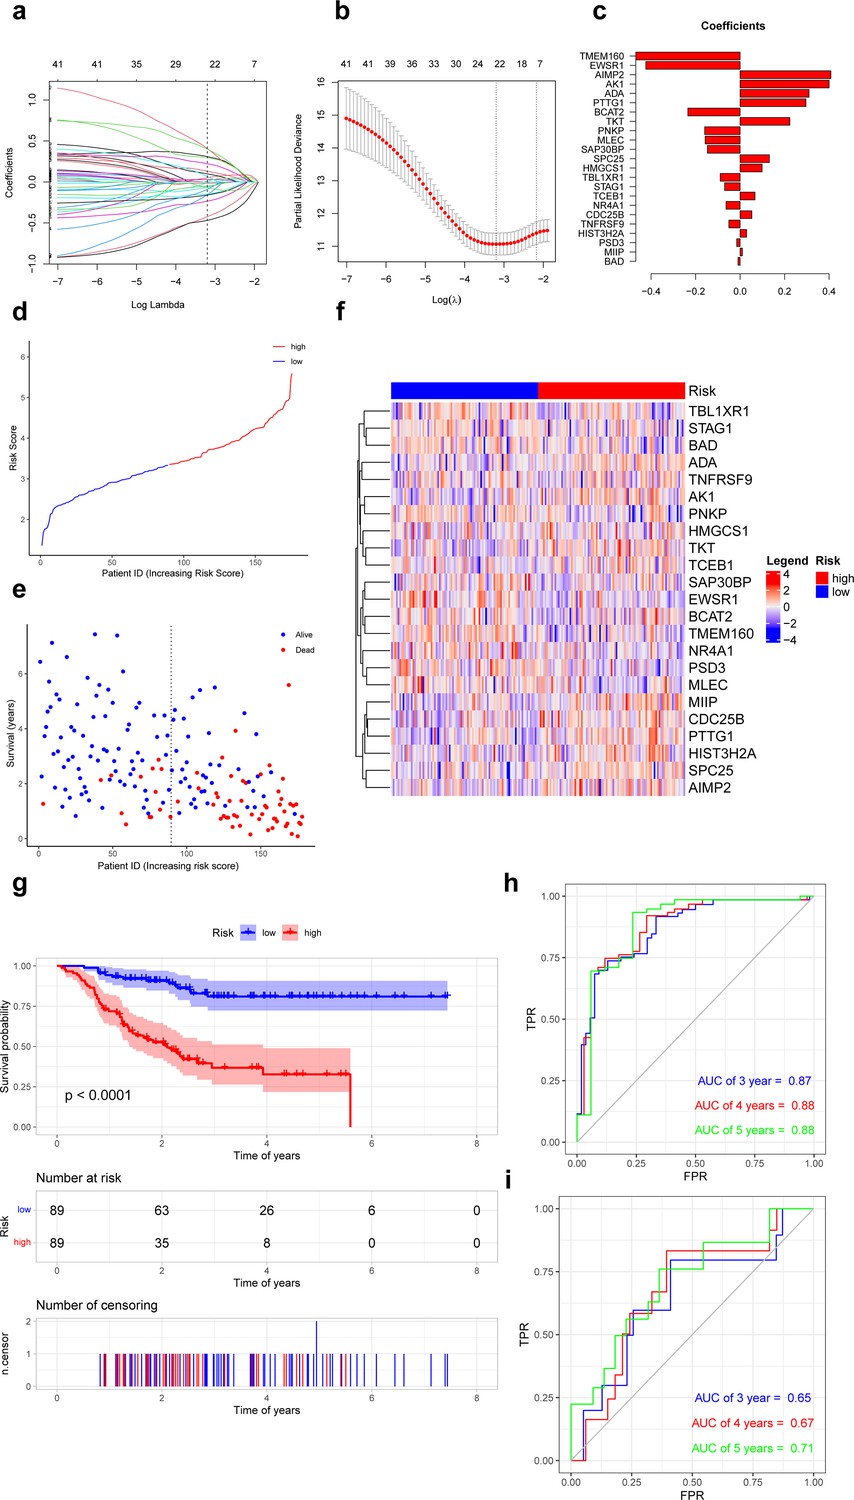
(a) Least Absolute Shrinkage and Selection Operator (LASSO) regression of 23 ferroptosis-related genes. (b) Cross-validation for optimizing the parameter in LASSO regression. (c) Demonstration of regression coefficients corresponding to 23 genes. (d) Graph showing risk scores for all samples. (e) Scatterplot showing recurrence-free survival for all samples. (f) Heat map showing the average expression of 23 genes in the low- and high-risk groups. (g) Kaplan–Meier curves of survival analysis in the low- and high-risk groups. (h) Receiver operating characteristic curves for predicting the recurrence-free survival at 3, 4, and 5 years in training set. (i) Receiver operating characteristic curves for predicting the recurrence-free survival at 3, 4 and 5 years in external validation set.
-
Figure 4—source code 1
Prognostic differences in triple-negative breast cancer with ferroptosis-related subpopulations.
- https://cdn.elifesciences.org/articles/100923/elife-100923-fig4-code1-v1.zip
Figure 4—figure supplement 1
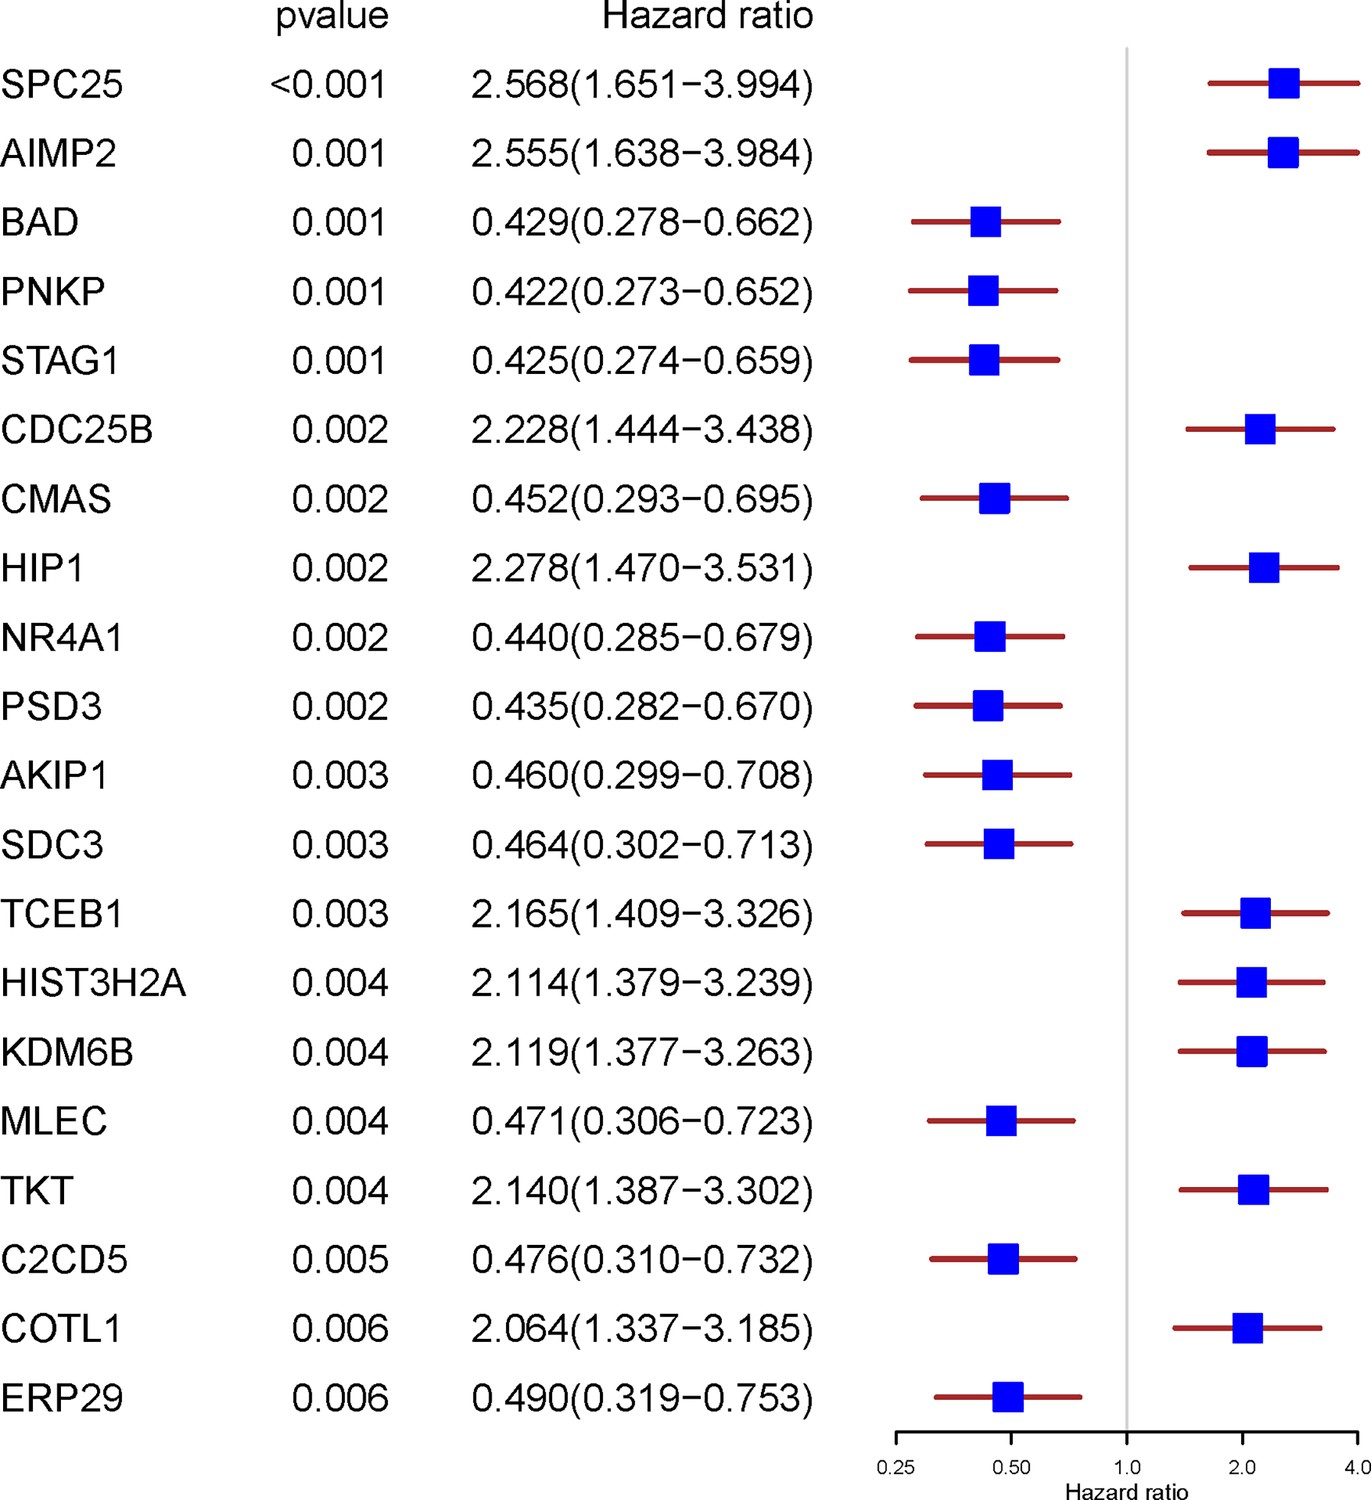
The forest plot of the top 20 ferroptosis-related genes significantly associated with disease-free survival based on univariate Cox regression analysis (p0.01).
Figure 5
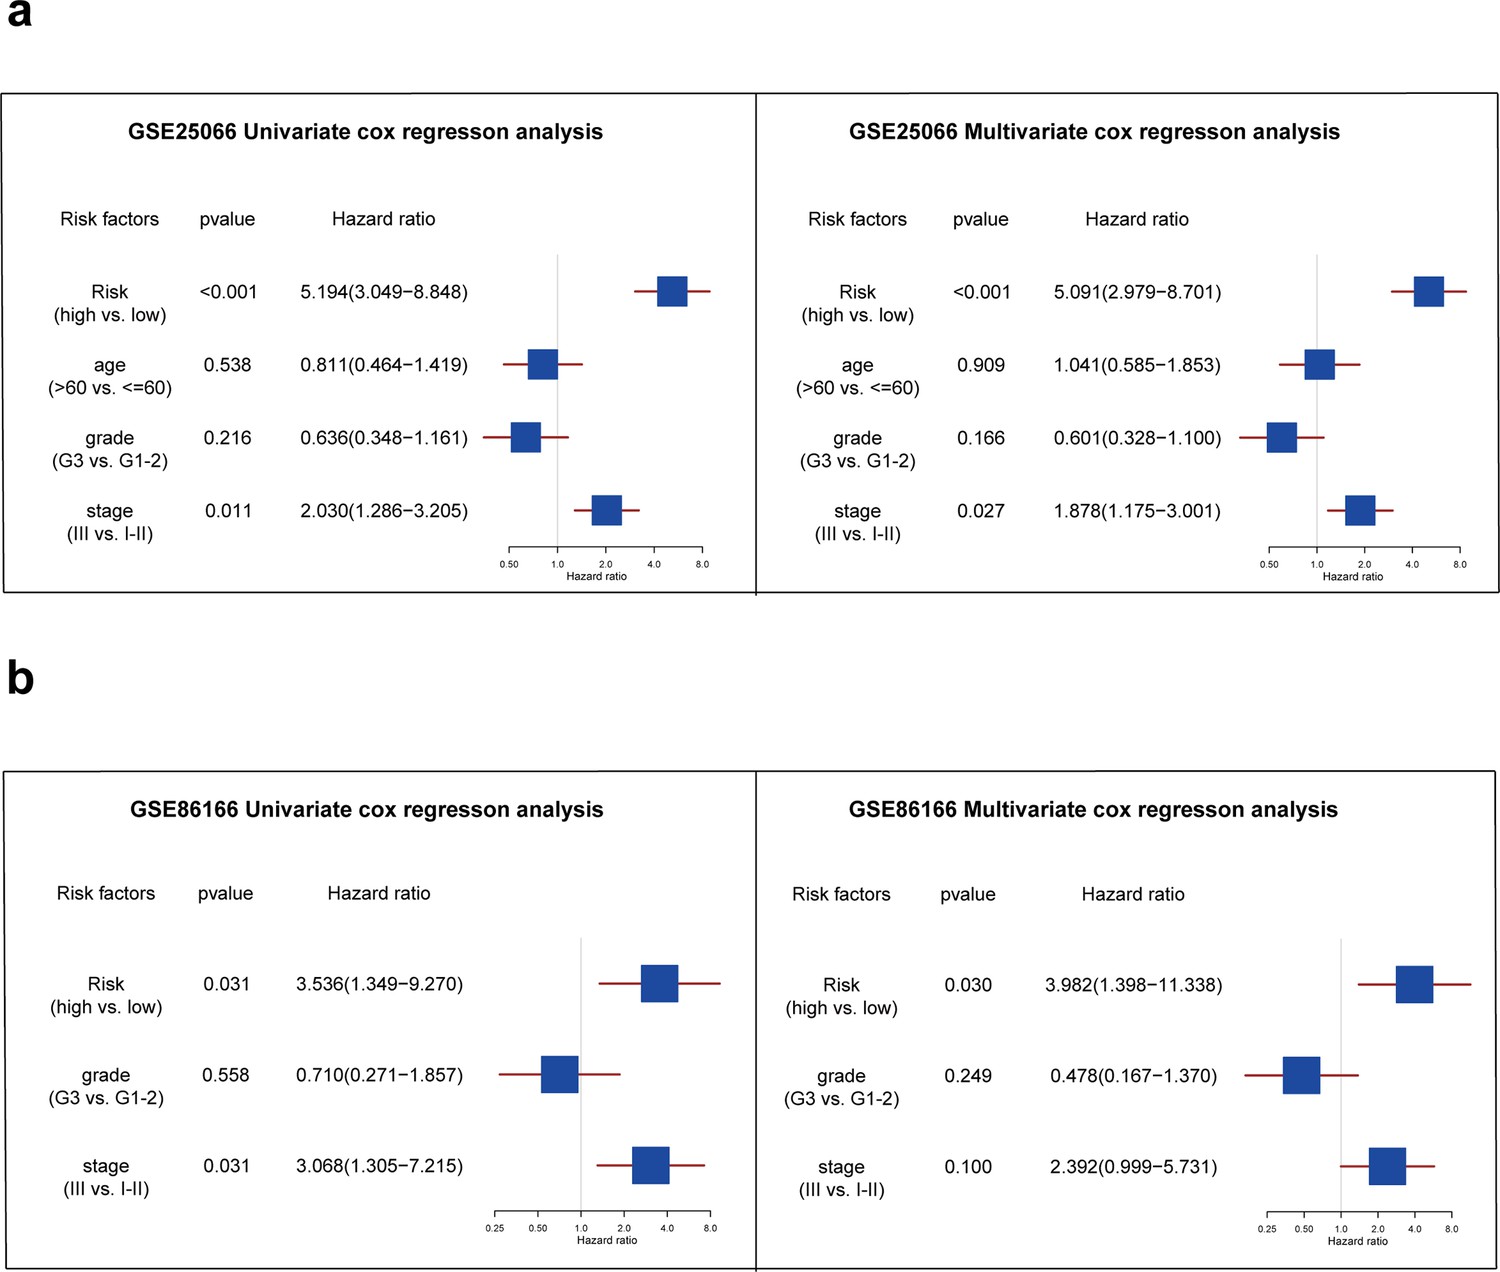
Analysis of independent prognostic factors for triple-negative breast cancer patients.
(a) The forest plot showing the results of univariate and multivariate COX regression analysis of risk score, age, grade, and stage in the GSE25066 database. (b) The forest plot showing the results of univariate and multivariate COX regression analysis of risk score, grade, and stage in the GSE86166 database.
-
Figure 5—source code 1
Analysis of independent prognostic factors for triple-negative breast cancer patients.
- https://cdn.elifesciences.org/articles/100923/elife-100923-fig5-code1-v1.zip
Figure 6
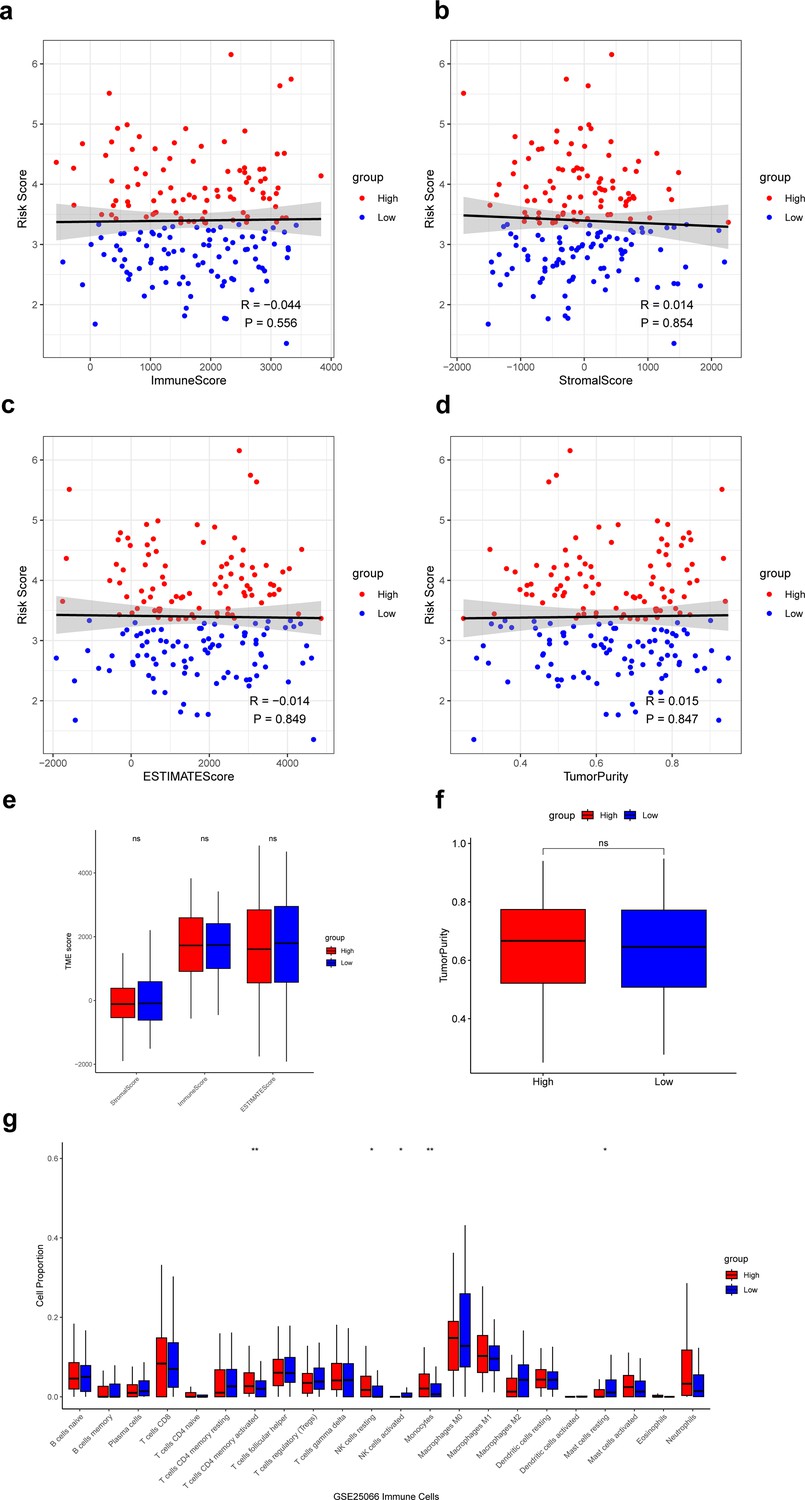
Analysis of immune microenvironment in low- and high-risk groups.
(a–d) Correlation of the risk score with the ImmuneScore, StromalScore, ESTIMATEScore, and TumorPurity. (e) Difference of ImmuneScore, StromalScore, and ESTIMATEScore in low- and high-risk groups. (f) Difference of TumorPurity in low- and high-risk groups. (g) Difference of immune infiltration score between low- and high-risk groups calculated by CIBERSORT. *p<0.05, **p<0.01, ns: p>0.05.
-
Figure 6—source code 1
Analysis of immune microenvironment in low- and high-risk groups.
- https://cdn.elifesciences.org/articles/100923/elife-100923-fig6-code1-v1.zip
Figure 7
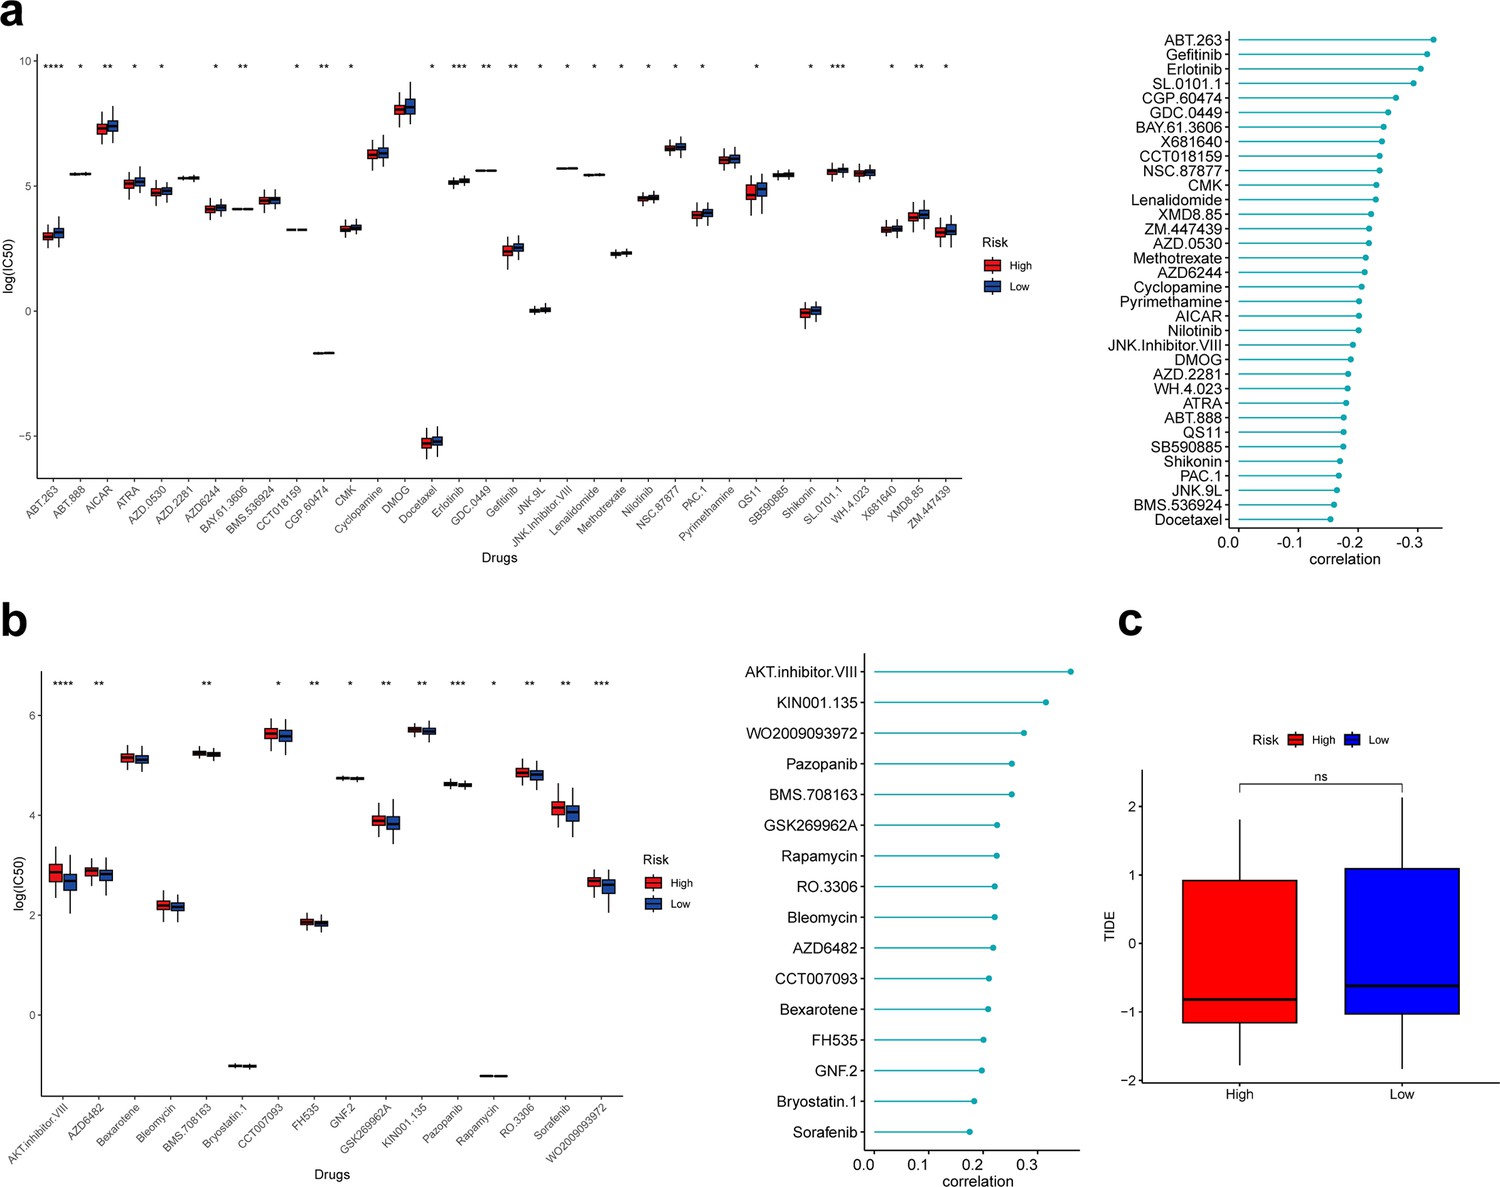
Correlation analysis between risk score and drug sensitivity.
(a) Box plot showing differences of IC50 for drugs negatively associated with risk scores in different groups. (b) Box plot showing differences of IC50 for drugs positively associated with risk scores in different groups. (c) Box plot showing differences of TIDE scores in different groups. *p<0.05, **p<0.01, ***p<0.001, ****p<0.0001, ns: p>0.05.
-
Figure 7—source code 1
Correlation analysis between risk score and drug sensitivity.
- https://cdn.elifesciences.org/articles/100923/elife-100923-fig7-code1-v1.zip
Tables
Key resources table
| Reagent type (species) or resource | Designation | Source or reference | Identifiers | Additional information |
|---|---|---|---|---|
| Software, algorithm | R package Seurat | Microsoft | N/A | Version 4.1.1 |
Table 1
Sample information for triple-negative breast cancer in GSE176078.
| Case ID | Gender | Age | T_Stage | Subtype by IHC | |
|---|---|---|---|---|---|
| 3946 | Female | 52 | T2 | TNBC | |
| 44041 | Female | 35 | T2 | TNBC | |
| 4465 | Female | 54 | T2 | TNBC | |
| 4495 | Female | 63 | T1 | TNBC | |
| 44971 | Female | 49 | T2 | TNBC | |
| 44991 | Female | 47 | NA | TNBC | |
| 4513 | Female | 73 | T3 | TNBC | |
| 4515 | Female | 67 | T1 | TNBC | |
| 4523 | Female | 52 | T2 | TNBC | |
-
IHC, immunohistochemistry; TNBC, triple-negative breast cancer.
Additional files
-
Supplementary file 1
Univariate Cox regression analysis of ferroptosis-related genes and disease-free survival in patients with triple-negative breast cancer.
- https://cdn.elifesciences.org/articles/100923/elife-100923-supp1-v1.xlsx
-
Supplementary file 2
Ferroptosis-related genes.
- https://cdn.elifesciences.org/articles/100923/elife-100923-supp2-v1.xlsx
-
MDAR checklist
- https://cdn.elifesciences.org/articles/100923/elife-100923-mdarchecklist1-v1.docx
Download links
A two-part list of links to download the article, or parts of the article, in various formats.
Downloads (link to download the article as PDF)
Open citations (links to open the citations from this article in various online reference manager services)
Cite this article (links to download the citations from this article in formats compatible with various reference manager tools)
Ferroptosis-related genes mediate tumor microenvironment and prognosis in triple-negative breast cancer via integrated RNA-seq analysis
eLife 13:RP100923.
https://doi.org/10.7554/eLife.100923.3


