Somatodendritic orientation determines tDCS-induced neuromodulation of Purkinje cell activity in awake mice
- Department of Physiology, Anatomy and Cell Biology, Pablo de Olavide University, Ctra. de Utrera, Spain
- Department of Neurology and Neurobiology, University of California, Los Angeles, United States
- Department of Psychiatry, University of California, Los Angeles, United States
- Department of Pharmacology, University of the Basque Country (UPV/EHU), Spain
- Department of Neuroscience, Baylor College of Medicine, United States
Figures
Figure 1
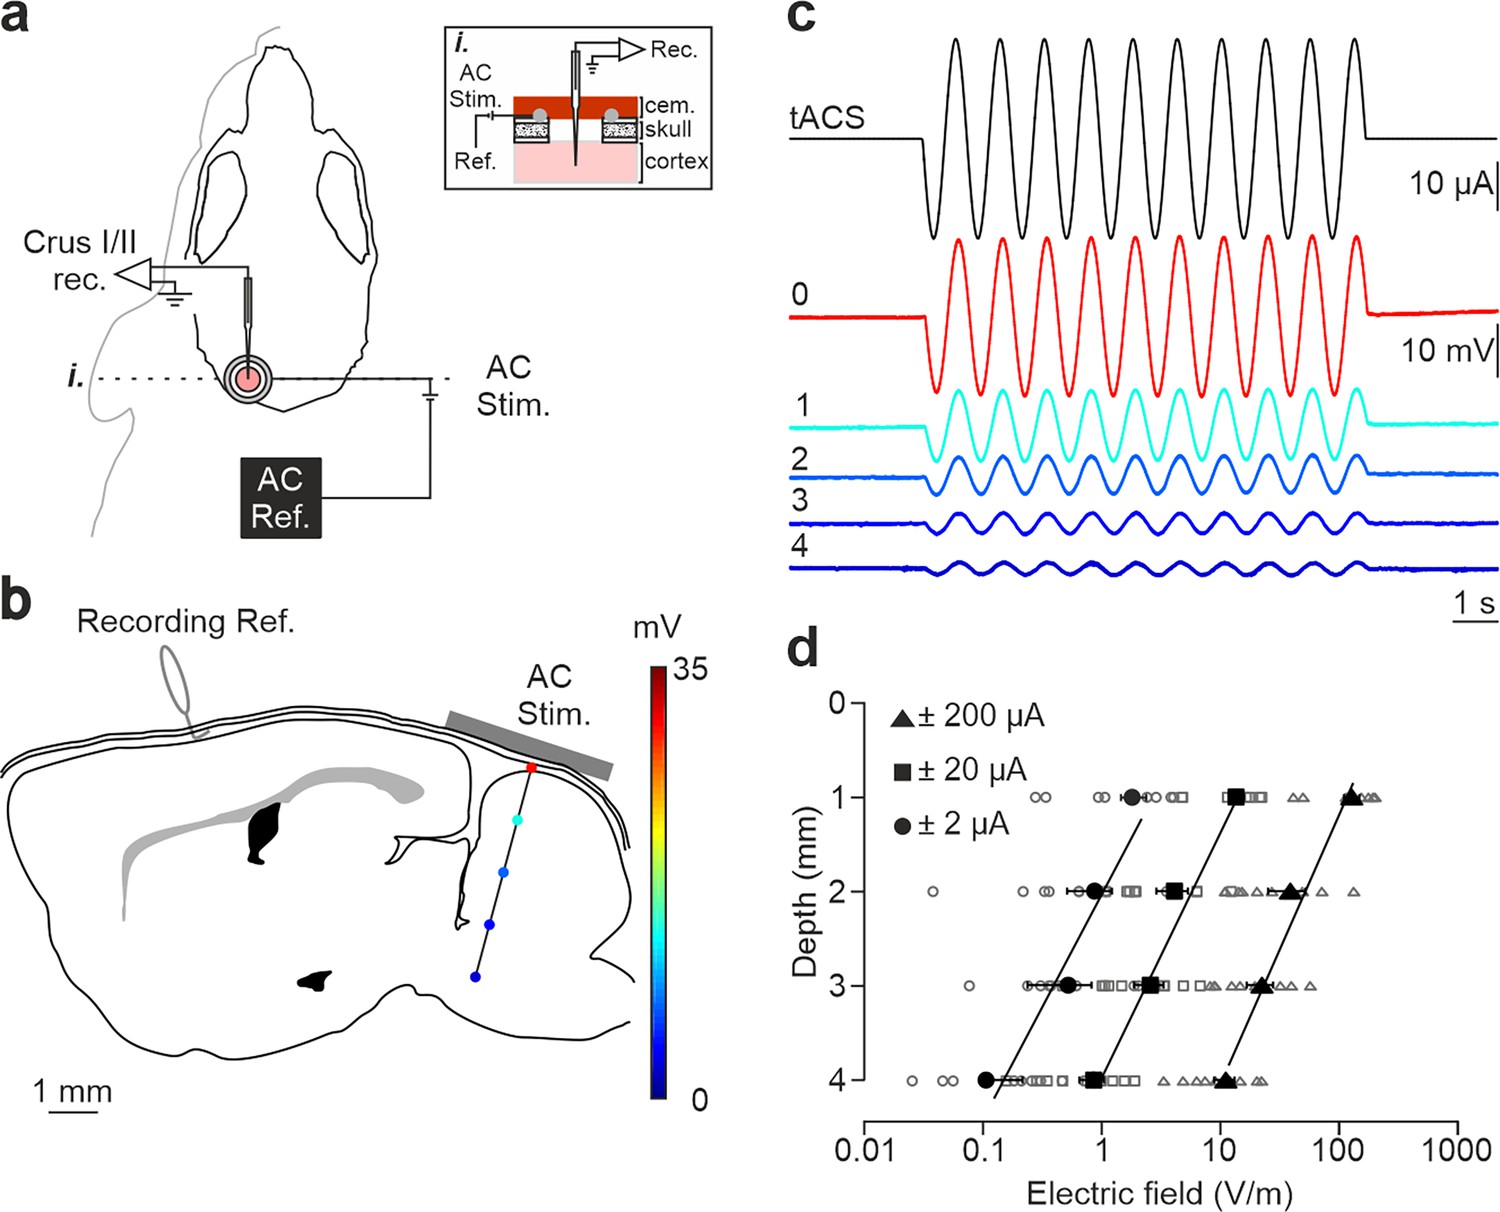
Intracranial electric fields induced by Cb-tACS.
(a) Experimental design for combined in vivo electrophysiology and transcranial alternating current stimulation (tACS) in crus I-II of cerebellar cortex in awake mice, showing silver-ring active and reference (AC Ref.) electrode locations. Inset (i.) shows a schematic sagittal view of the recording chamber design. (b) Schematic representation of a sagittal section of the brain showing the reference used for electrophysiological recordings (Recording Ref.), the location of the active electrodes (gray bar), and a representative track in the lateral cerebellum highlighting the depths where the electric field was measured (color dots). (c) tACS stimulation (top trace) applied over the scalp and exemplary recording of the actual field potentials generated at different depths (from 0 to 4 mm) in a representative animal. The traces were overlapped to facilitate amplitude comparison. (d) Average (filled symbols) and individual (empty symbols) electric field strength recorded at different depths for ±2 (circles), ±20 (squares), and ±200 μA (triangles) tACS.
Figure 2 with 2 supplements
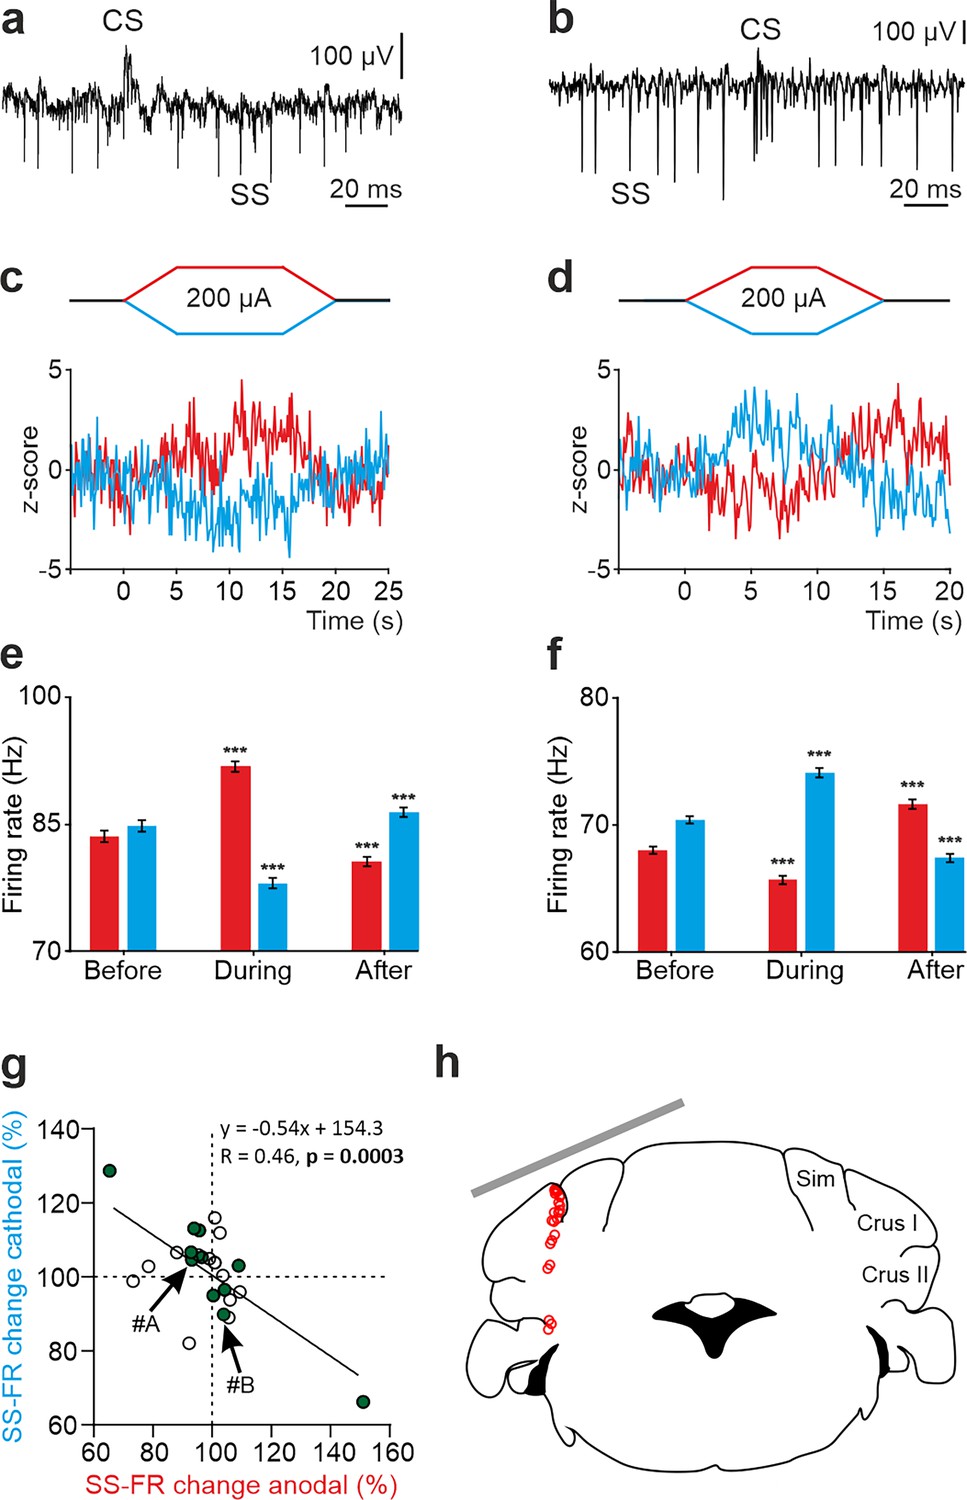
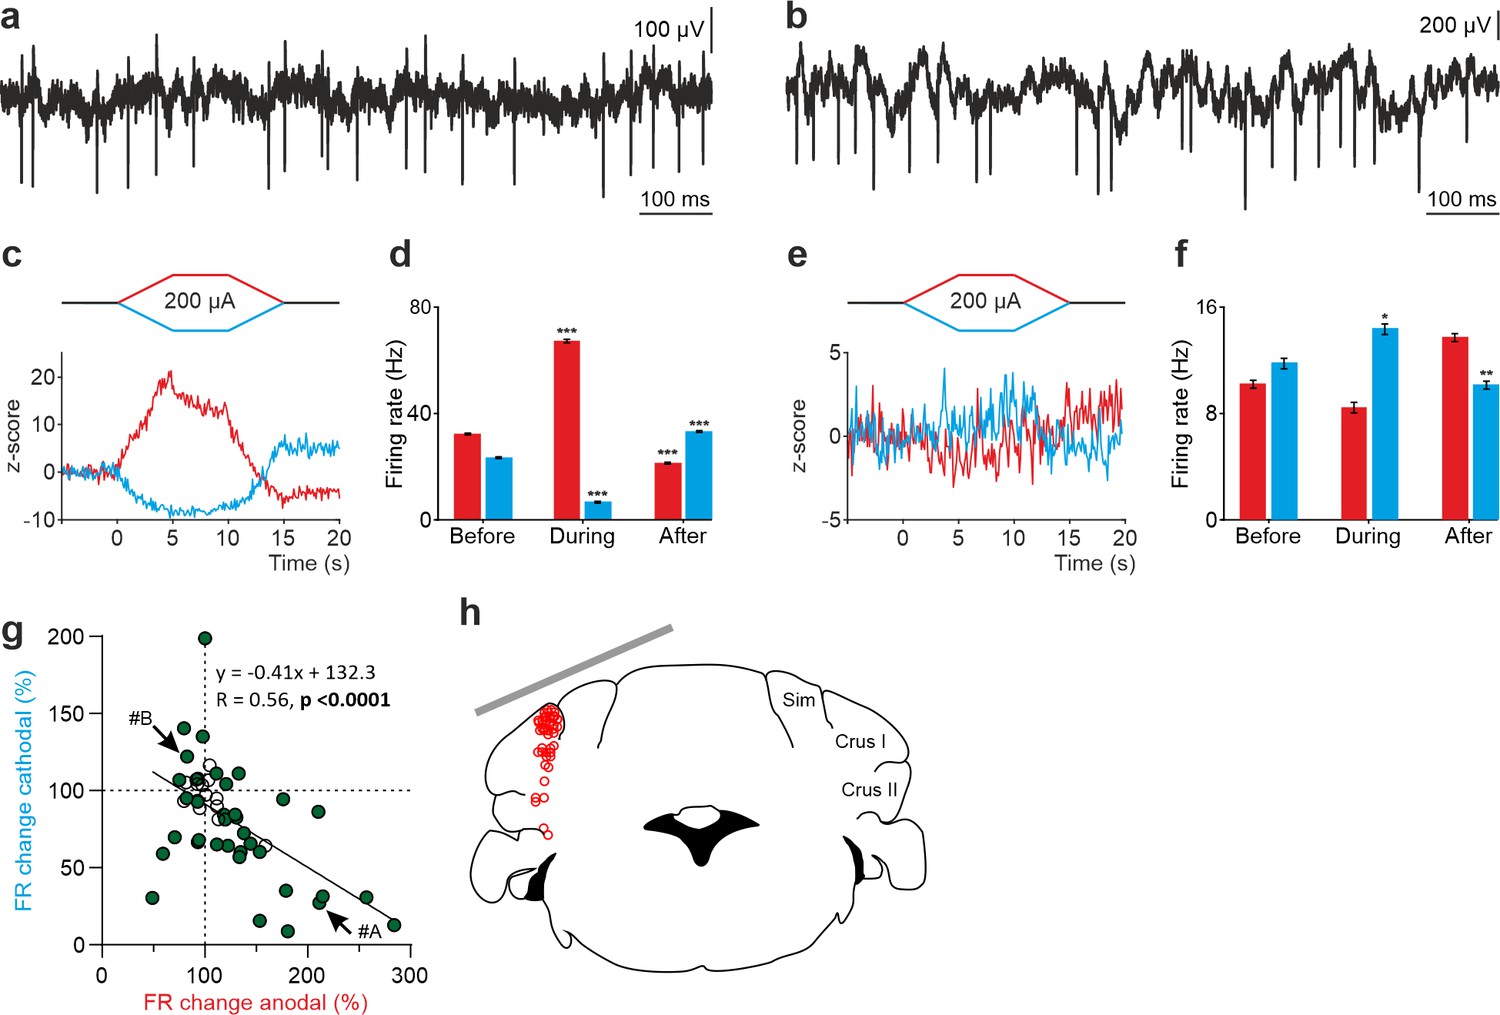
tDCS modulation of PC activity in crus I/II of awake mice.
(a, b) Recording of spontaneous firing activity of two PCs showing the presence of SS and CS. (c,d) Z-score-transformed average PSTH (bin size: 0.1 s) of the SS activity of the 2 PCs shown in a,b before, during and after anodal (red trace) or cathodal (blue trace) tDCS. (e,f) Statistical comparison of the SS firing rate of the 2 PCs shown in a,b, measured in 5 s windows before, during and after tDCS (e): Anodal: RM-ANOVA, F (3, 196)=61.305, N=50, p<0.001; Cathodal: Friedman, χ2 (3, 147)=76.316, N=50, p<0.001; (f): Anodal: Friedman, χ2 (2, 98)=68.593, N=50, p<0.001; Cathodal: RM-ANOVA, F (2, 147)=107.859, N=50, p<0.001. Error bars represent SEM. **p < 0.01; ***p < 0.001. (g) Modulation of SS of individual PCs (circles) during anodal (red) and cathodal (blue) tDCS. Filled circles represent statistically significant modulation during tDCS (n=24, RM-ANOVA or Friedman tests, p<0.05). Arrows indicate data from the example neurons shown in panels A and B. (h) Schematic representation of the recording sites and active electrode location (gray bar) during tDCS.
Figure 2—figure supplement 1
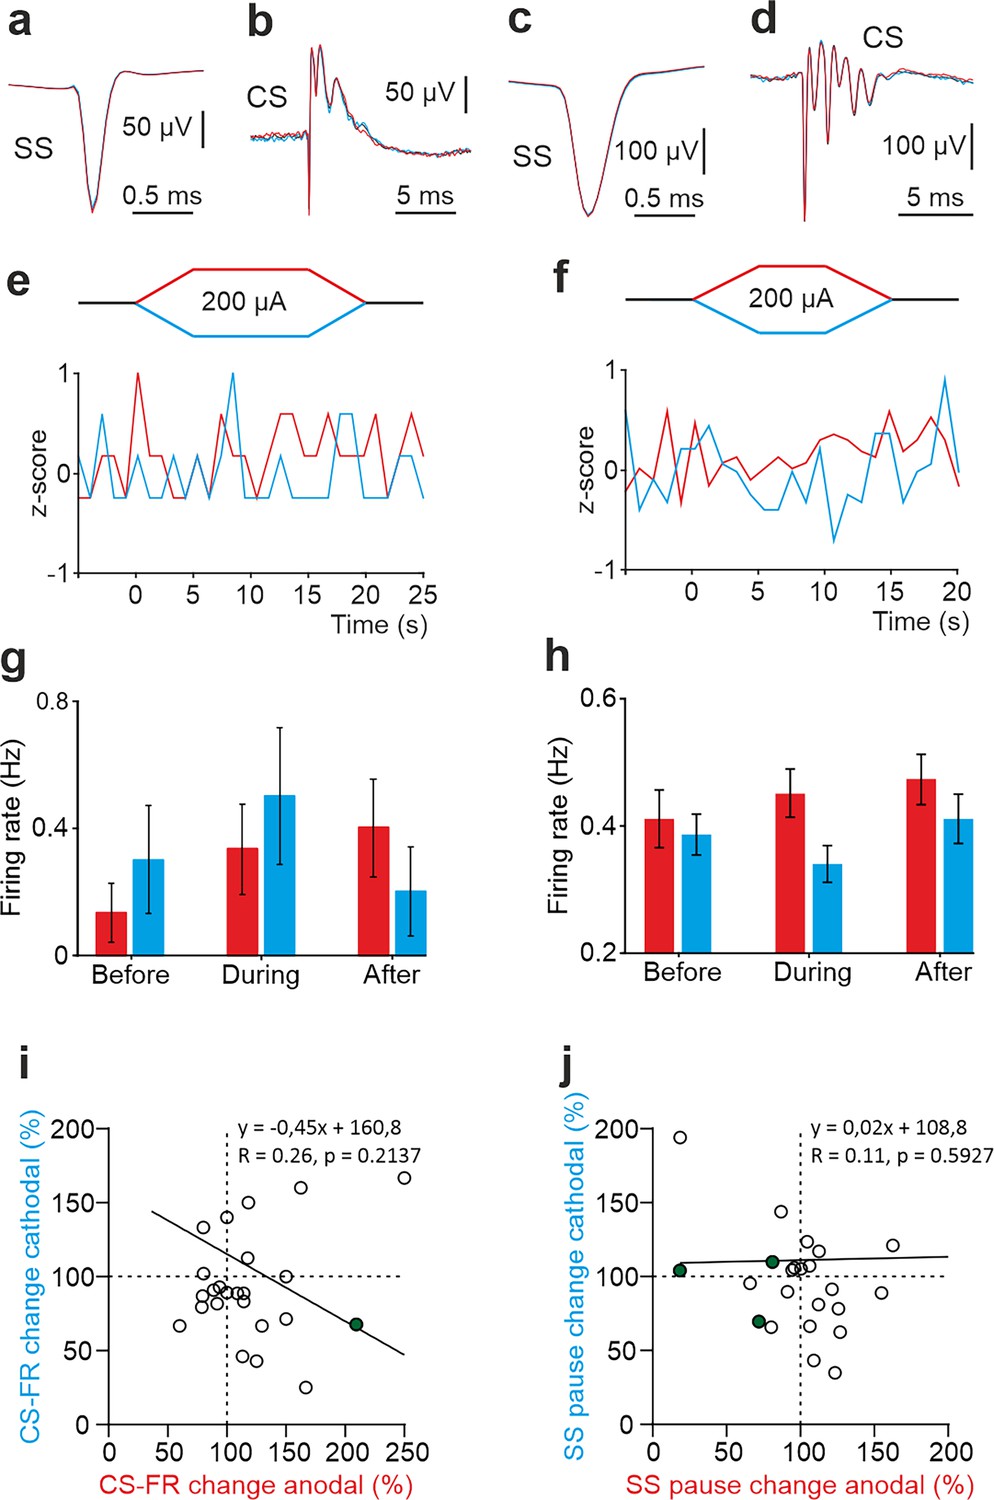
tDCS does not modulate PC waveform or complex spikes in the awake mouse.
(a‐d) Superimposed averaged SS (a, c) and CS (b, d) waveforms under control (black), anodal (red) and cathodal (blue) tDCS. (e,f) Z‐score‐transformed average PSTH (bin size: 1 s) of CS activity before, during and after anodal (red trace) or cathodal (blue trace) tDCS corresponding to PC showed in Figure 2a and b in the main text, respectively. (g,h) Statistical comparison of CS firing rate between 5 s windows before, during, and after tDCS (g): Anodal: Friedman, χ2 (3, 30)=2.790, N=11, p=0.425; Cathodal: Friedman, χ2 (3, 21)=2.739, N=8, p=0.434; (h): Anodal: Friedman, χ2 (2, 108)=2.045, N=55, p=0.359; Cathodal: RM-ANOVA, F (2, 110)=1.706, N=56, p=0.426. Error bars represent SEM. **p<0.01; ***p<0.001. (i‐j) Modulation of CS (i) firing rate and SS silence after a CS (j) of individual neurons (circles) during anodal (red) and cathodal (blue) tDCS. Filled circles represent statistically significant modulation during tDCS (n=24, RM‐ANOVA or Friedman tests, p<0.05).
Figure 2—figure supplement 2
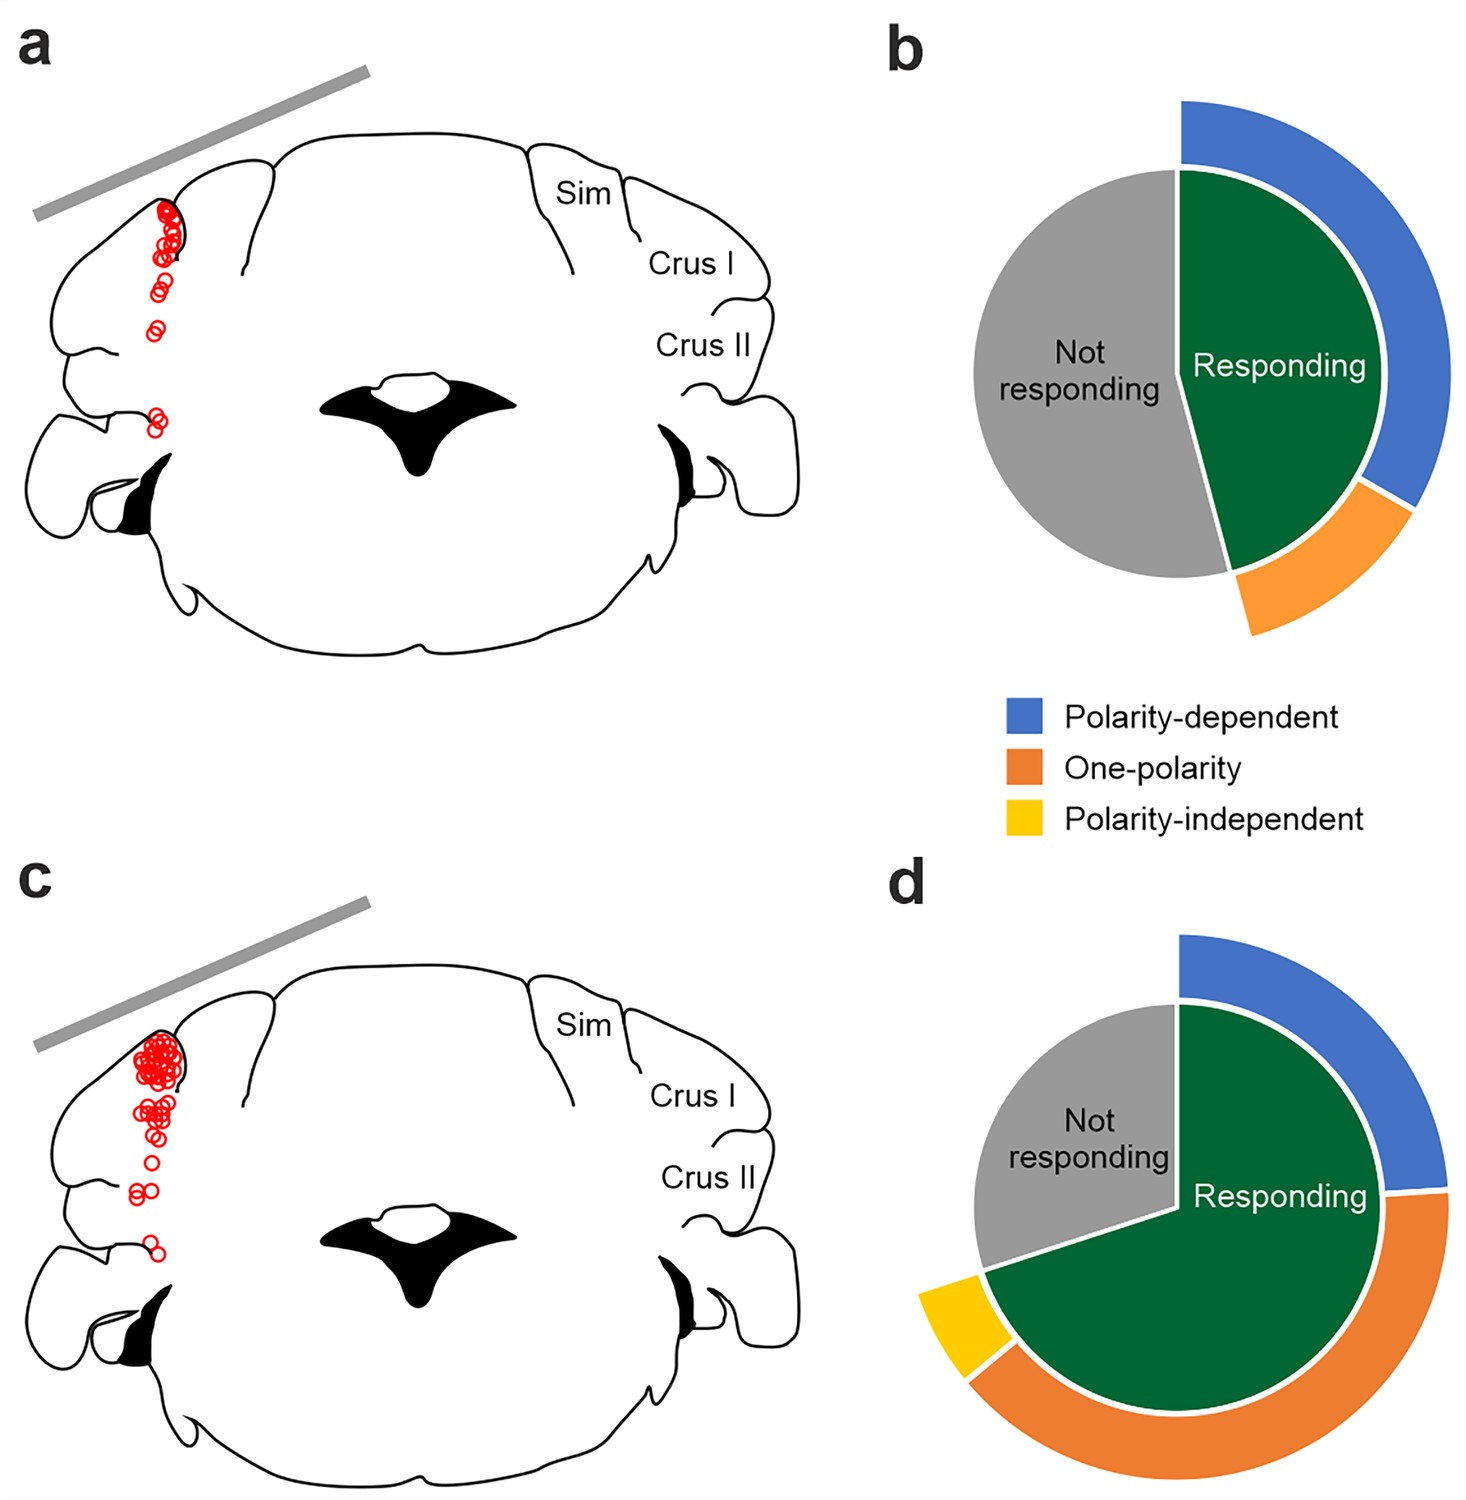
Summary of firing rate modulation for all recorded PCs and non‐PCs during tDCS over crus I‐II cerebellar region.
(a) Schematic representation of the recording sites of PCs and active electrode location (gray bar) during tDCS. (b) 45.8% of the recorded PC significantly modified their SS firing rate during tDCS (n=11 PCs; green bar). The observed modulation consisted of a heterogeneous effect, with 12.5% of neurons significantly responding in a polarity‐dependent manner to anodal and cathodal tDCS, with opposing firing rate changes (n=3 PCs; blue bar) and 33.3% of the neurons significantly responding only to one tDCS polarity (n=8 PCs; orange bar). (c) Schematic representation of the recording sites of non‐PCs and active electrode location (gray bar) during tDCS. (d) 70% of recorded non‐PC neurons significantly modified their firing rate during simultaneous tDCS (n=35 non‐PCs, green bar). Similar to PC, the observed modulation consisted of a heterogeneous effect, with 24% of neurons significantly responding in a polarity‐dependent manner to both anodal and cathodal tDCS with opposing firing changes (n=12 non‐PCs; blue bar), 40% of the neurons significantly responding only to one tDCS polarity (n=20 non‐PCs; orange bar) and 6% significantly responding homogeneously to both tDCS polarities (n=3 PCs; yellow bar i). (RM‐ANOVA or Friedman tests, p<0.05).
Figure 3
tDCS modulation of non-PC activity in crus I/II of awake mice.
(a, b) Recording of spontaneous firing activity of two non-PCs. (c, e) Z-score-transformed average PSTH (bin size: 0.1 s) of firing rate for the 2 neurons in a,b, before, during and after anodal (red trace) or cathodal (blue trace) tDCS. (d, f) Statistical comparison of the firing rate of the 2 neurons in a,b, measured in 5 s windows before, during and after tDCS (d): Anodal: Friedman, χ2 (2, 98)=100, N=50, p<0.001; Cathodal: Friedman, χ2 (2, 98)=100, N=50, p<0.001; (f): Anodal: RM-ANOVA, F (2, 147)=64.656, N=50, p<0.001; Cathodal: Friedman, χ2 (2, 98)=36.765, N=50, p<0.001. Error bars represent SEM. *p < 0.05; **p < 0.01; ***p < 0.001. (g) Modulation of firing rate of individual neurons (circles) during anodal (red) and cathodal (blue) tDCS. Filled circles represent statistically significant modulation during tDCS (n=50, RM-ANOVA or Friedman tests, p<0.05). Arrows indicate data from the example neurons shown in panels A and B. (h) Schematic representation of the recording sites and active electrode (gray bar) location during tDCS.
Figure 4 with 1 supplement

tDCS modulation of PC and non-PC activity in the vermis of anesthetized mice.
(a) Schematic representation of the recording sites and active electrode (gray bar) location during tDCS. (b) A representative coronal section of the vermis immunofluorescently stained with Calbindin (green). The magnification inset highlights the distinct orientation of PCs in different layers, which is indicated by the drawings of PC somas and dendrites (with dendrites always extending into the molecular layer, shown in green). (c,d) Modulation of SS firing rate of individual PCs (c) and firing rate of individual non-PCs (d) during anodal (red) and cathodal (blue) tDCS over cerebellar vermis. Filled circles represent statistically significant modulation during tDCS (n=31 PCs and 25 non-PCs, RM-ANOVA or Friedman tests, p<0.05). GCL: granular cell layer, ML: molecular layer, PCL: Purkinje cell layer.
Figure 4—figure supplement 1
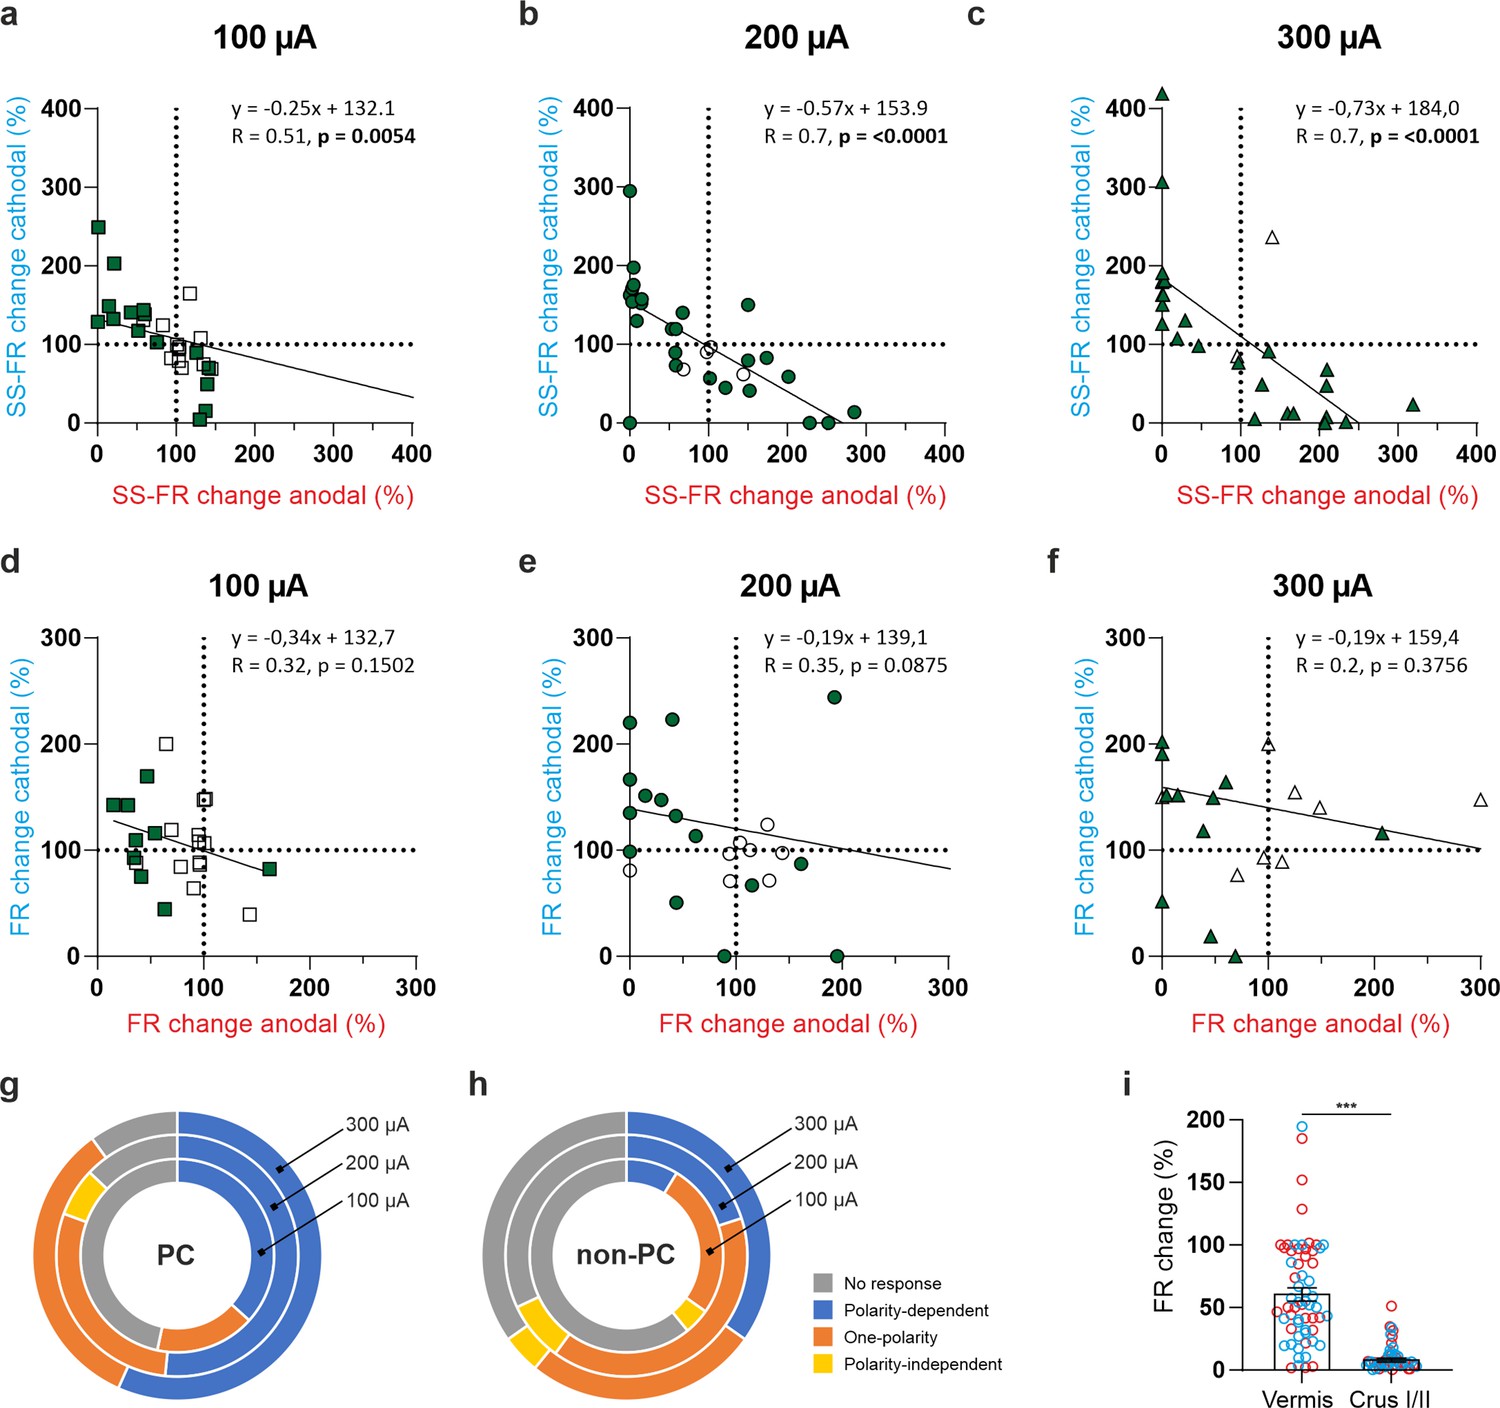
tDCS modulation of PC and non‐PC activity at different intensities in anesthetized mice.
(a‐c) Modulation of SS firing rate of the same individual PC during anodal (red) and cathodal (blue) tDCS over cerebellar vermis at different intensities (±100 μA, ±200 μA, and ±300 μA). Filled circles represent statistically significant modulation during tDCS (n=31 PCs, RM‐ANOVA or Friedman tests, p<0.05). (d‐f) Modulation of SS firing rate of the same individual non‐PC during anodal (red) and cathodal (blue) tDCS over cerebellar vermis at different intensities (±100 μA,±200 μA, and ±300 μA). Filled circles represent statistically significant modulation during tDCS (n=25 non‐PCs, RM‐ANOVA or Friedman tests, p<0.05). (g,h) Summary of SS firing rate modulation for all recorded PCs (g) and non‐PCs (h) during tDCS over vermis cerebellar region. Neurons are grouped according to their modulatory response to tDCS. (i) Absolute firing rate modulation during anodal (red circles) and cathodal (blue circles) tDCS over Vermis and Crus I/II. Error bars represent SEM. ***p<0.001 (Mann-Whitney test). (b) and (e) Figures correspond to Figure 4c and d, respectively.
Figure 5
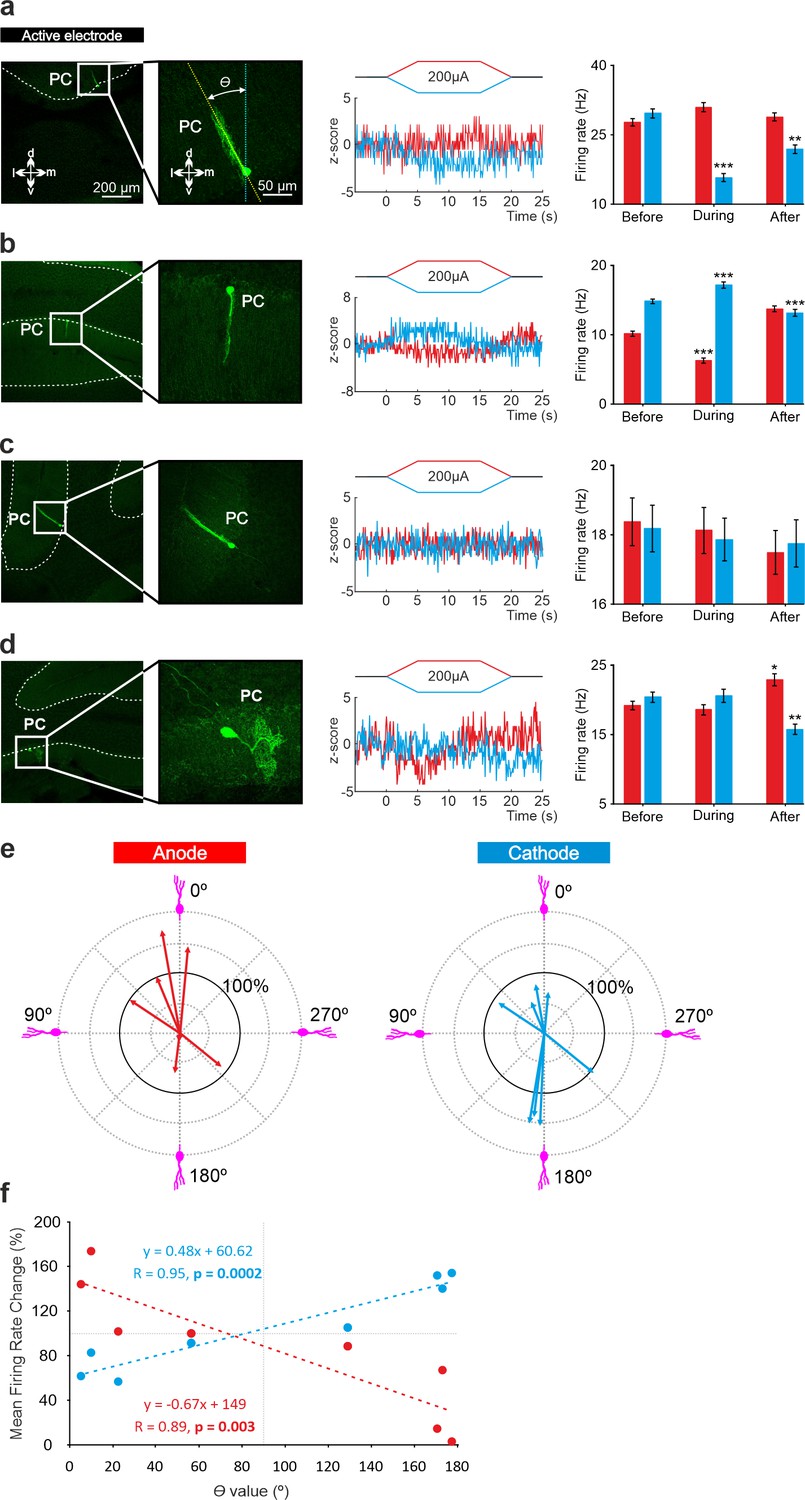
Relationship between tDCS-driven modulation of PC firing rate and somatodendritic axis orientation in anesthetized mice.
(a-d) (Left) Confocal images of labeled neurons with different somatodendritic angles relative to the electric field (dotted white vertical line), (Right) z-score of their firing rate modulation during anodal (red) or cathodal (blue) tDCS and statistical analysis (a): Anodal: Friedman, χ2 (3, 147)=5.482, N=50, p=0.139; Cathodal: Friedman, χ2 (3, 147)=71.544, N=50, p<0.001; (b): Anodal: Friedman, χ2 (3, 147)=93.289, N=50, p<0.001; Cathodal: Friedman, χ2 (3, 147)=81.428, N=50, p<0.001; (c): Anodal: Friedman, χ2 (3, 147)=2.348, N=50, p=0.503; Cathodal: Friedman, χ2 (3, 147)=3.065, N=50, p=0.382; (d): Anodal: Friedman, χ2 (3, 147)=29.904, N=50, p<0.001; Cathodal: Friedman, χ2 (3, 147)=23.385, N=50, p<0.001. Error bars represent SEM. *p < 0.05; **p < 0.01; ***p < 0.001. (e) Relationship between firing rate modulation and somatodendritic angle for all juxtacellularly-labeled PCs (n=8). Arrow length represents firing rate modulation during anodal (red arrows, at left) or cathodal (blue arrows, at right) tDCS at 200 μA, relative to the firing rate during control condition (represented by 100% solid circle). Densely packed lines and suppressed activity of two neurons under anodal tDCS reduce the visibility of their responses. (f) Average change in firing rate during anodal (red) and cathodal (blue) tDCS for individual PCs with different somatodendritic orientations.
Figure 6 with 1 supplement
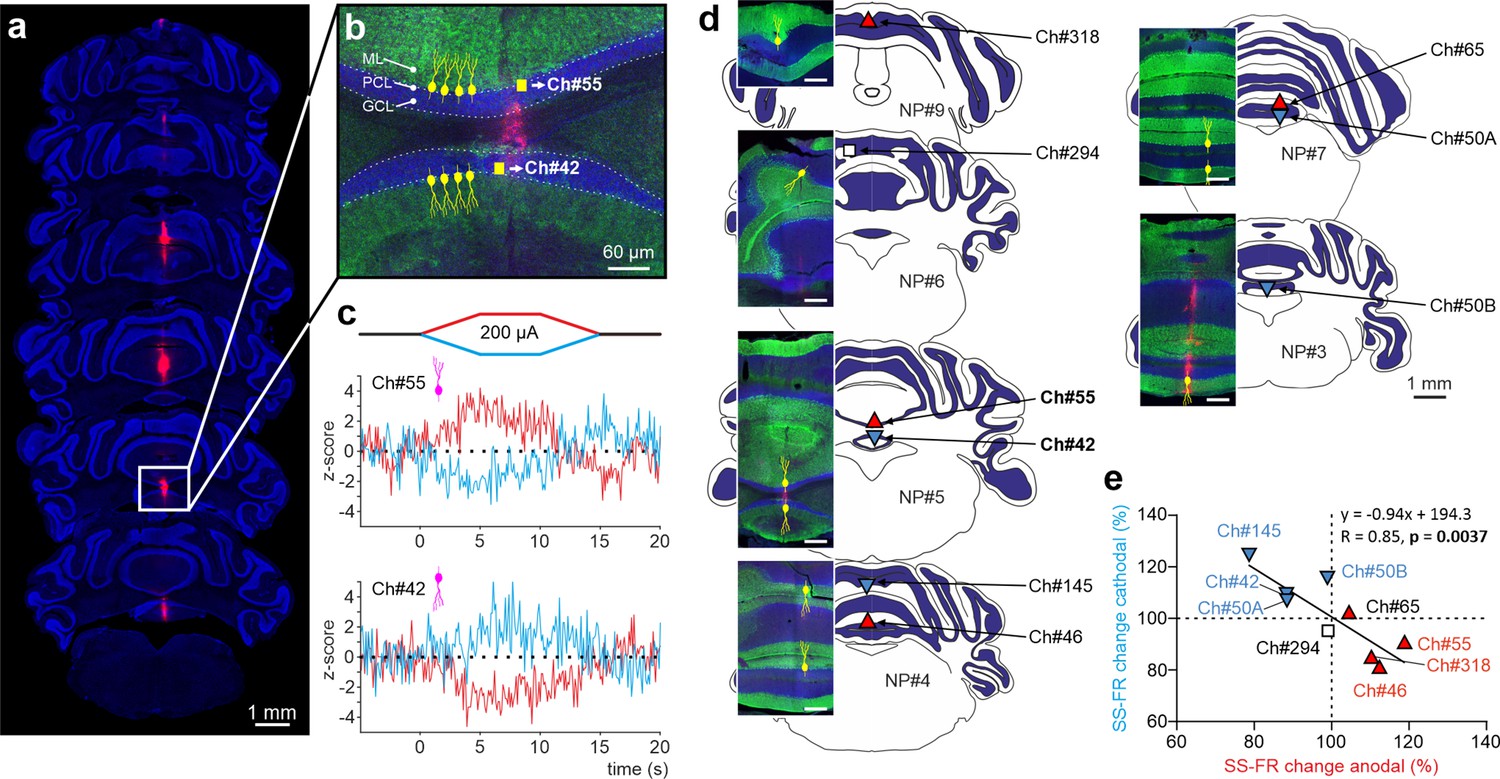
Impact of tDCS on PCs with opposite somatodendritic orientations simultaneously recorded in the awake mice.
(a) Probe location marked with Dil in the cerebellar vermis stained with Hoechst 33342 dye. (b) Magnification of square area in ‘a’ showing the location of two oppositely oriented PCs recorded at Ch#55 and Ch#42. The orientation of the PCs in each of the two layers is indicated with drawings of PC soma and dendrites (yellow), in which the soma appears at the interface between the granule cell layer (GCL, shown in blue) and the molecular layer (ML, shown in green). (c) Z-score-transformed average PSTH (bin size: 0.1 s for SS) of the SS activity before, during and after anodal and cathodal tDCS pulses for each of the two simultaneously recorded PCs shown in b (Ch#55: Anodal: Friedman, χ2 (2, 98)=67.647, N=50, p<0.001; Cathodal: Friedman, χ2 (2, 98)=54.576, N=50, p<0.001; Ch#42: Anodal: RM-ANOVA, F (2, 147)=123.947, N=50, p<0.001; Cathodal: RM-ANOVA, F (2, 147)=63.076, N=50, p<0.001). (d) Anatomical localization of the different PCs recorded. The inset shows the recorded places marked with Dil (red) and stained with anti-Calbindin antibody (green, molecular layer) and Hoechst 33342 (blue, granule layer; scale bar: 300 µm). PCs in which dendrites are pointed toward or away from the active tDCS electrode are denoted with triangles pointing upward or downward respectively. The color of the triangle indicates whether the modulation was an increase (red) or a decrease (blue) in firing rate. (e) Modulation of SS firing rate of individual PCs during anodal and cathodal tDCS. Filled symbols represent statistically significant modulation during tDCS, with the meaning of color and shape as in d (n=9, RM-ANOVA or Friedman tests, p<0.05). ML: molecular layer, PCL: Purkinje cell layer, GCL: granular cell layer.
Figure 6—figure supplement 1

tDCS modulation of PCs at different PC layers in the awake mice.
The figure displays Z‐score‐transformed average PSTH (bin size: 0.1 s for SS) of the spontaneous SS recorded before, during and after anodal and cathodal tDCS pulses for each the recorded PCs included in the Figure 6. Additionally, a statistical comparison of the SS firing rates during 5‐second windows before, during, and after tDCS is presented for each recorded PC (#9-Ch318: Anodal: RM-ANOVA, F (2, 147)=302.050, N=50, p<0.001; Cathodal: RM-ANOVA, F (2, 147)=495.481, N=50, p<0.001; #4-Ch46: Anodal: RM-ANOVA, F (2, 147)=30.325, N=50, p<0.001; Cathodal: RM-ANOVA, F (2, 147)=40.236, N=50, p<0.001; #5-Ch55: Anodal: Friedman, χ2 (2, 98)=67.647, N=50, p<0.001; Cathodal: Friedman, χ2 (2, 98)=54.576, N=50, p<0.001; #7-Ch65: Anodal: RM-ANOVA, F (2, 147)=28.562, N=50, p<0.001; Cathodal: RM-ANOVA, F (2, 147)=9.282, N=50, p<0.001; #4-Ch145: Anodal: RM-ANOVA, F (2, 147)=55.200, N=50, p<0.001; Cathodal: RM-ANOVA, F (2, 147)=38.199, N=50, p<0.001; #3-Ch50: Anodal: RM-ANOVA, F (2, 147)=6.257, N=50, p=0.003; Cathodal: RM-ANOVA, F (2, 147)=86.379, N=50, p<0.001; #5-Ch42: Anodal: RM-ANOVA, F (2, 147)=123.947, N=50, p<0.001; Cathodal: RM-ANOVA, F (2, 147)=63.076, N=50, p<0.001; #7-Ch50: Anodal: Friedman, χ2 (2, 98)=73.156, N=50, p<0.001; Cathodal: Friedman, χ2 (2, 98)=32.827, N=50, p<0.001; #6-Ch294: Anodal: RM-ANOVA, F (2, 147)=11.444, N=50, p<0.001 Cathodal: Friedman, χ2 (2, 98)=4.135, N=50, p=0.127). The error bars represent SEM. Significance levels are denoted as follows: *p<0.05; ***p<0.001.
Author response image 1
Author response image 2

Author response image 3
Author response image 4
Author response image 5
Author response image 6
Author response image 7

Superimposed averaged SS waveforms under control (black), anodal (red) and cathodal (blue) tDCS from the example neurons shown in panels A and B in Figure 3.
Tables
Author response table 1
| Anodal 200uA | Cathodal 200uA | Anodal 100uA | Cathodal 100uA | Anodal 300uA | Cathodal 300uA | |
|---|---|---|---|---|---|---|
| Goodness of Fit | ||||||
| R squared | 0.02502 | 0.1451 | 0.1759 | 0.1393 | 0.07669 | 0.03640 |
| Sy.x | 13.44 | 8.150 | 9.884 | 15.24 | 24.73 | 18.60 |
| Is slope significantly non-zero? | ||||||
| F | 0.4876 | 3.226 | 0.6404 | 0.4854 | 0.2492 | 0.1133 |
| DFn, DFd | 1,19 | 1,19 | 1,3 | 1,3 | 1,3 | 1,3 |
| P value | 0.4934 | 0.0884 | 0.4821 | 0.5361 | 0.6520 | 0.7586 |
| Deviation from zero? | Not Significant | Not Significant | Not Significant | Not Significant | Not Significant | Not Significant |
| Runs test | ||||||
| Points above line | 2 | 1 | 2 | 2 | ||
| Points below line | 3 | 4 | 3 | 3 | ||
| Number of runs | 4 | 3 | 3 | 3 | ||
| P value (runs test) | 0.9000 | > 0.9999 | 0.5000 | 0.5000 | ||
| Deviation from linearity | Not Significant | Not Significant | Not Significant | Not Significant | ||
| Equation | Y=-4.355^(**)X +18.63 | Y=-6.794^(**)X +22.22 | Y=-6.863^(**)X +19.39 | Y=-9.211^(**)X +27.75 | Y=-10.71^(**)X +43.67 | Y=-5.433^(**)X +26.07 |
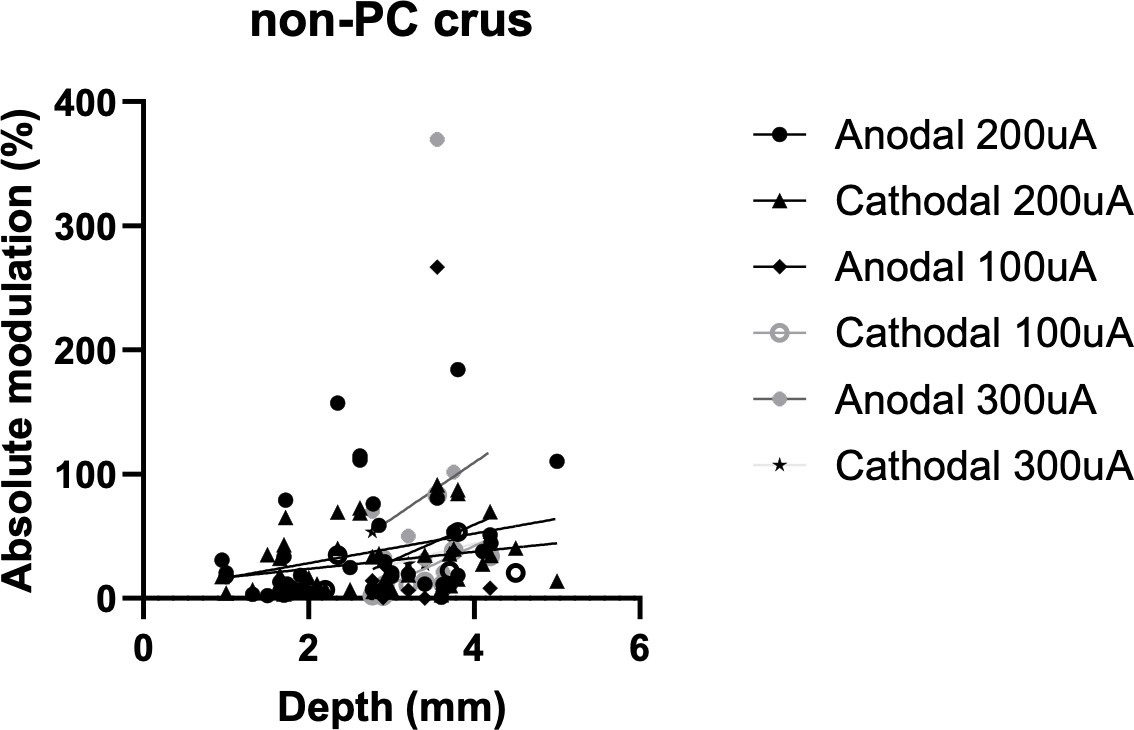
Author response table 2
| Anodal 200uA | Cathodal 200uA | Anodal 100uA | Cathodal 100uA | Anodal 300uA | Cathodal 300uA | |
|---|---|---|---|---|---|---|
| Goodness of Fit | ||||||
| R squared | 0.08524 | 0.07646 | 0.02507 | 0.2985 | 0.03554 | 0.08955 |
| Sy.x | 40.74 | 24.92 | 90.34 | 23.16 | 117.4 | 26.77 |
| Is slope significantly non-zero? | ||||||
| F | 4.007 | 3.560 | 0.1800 | 2.979 | 0.2579 | 0.6885 |
| DFn, DFd | 1,43 | 1,43 | 1,7 | 1,7 | 1,7 | 1,7 |
| P value | 0.0517 | 0.0660 | 0.6841 | 0.1280 | 0.6271 | 0.4341 |
| qquad | Not Significant | Not Significant | Not Significant | Not Significant | Not Significant | Not Significant |
| Runs test | ||||||
| Points above line | 1 | 3 | 3 | 3 | ||
| Points below line | 8 | 6 | 6 | 6 | ||
| Number of runs | 3 | 7 | 6 | 6 | ||
| P value (runs test) | > 0.9999 | > 0.9999 | 0.8810 | 0.8810 | ||
| Deviation from linearity | Not Significant | Not Significant | Not Significant | Not Significant | ||
| Equation | Y=11.91^(**)X+ 4.489 | Y=6.869^(**)X+ 10.01 | Y=29.18^(**)X- 57.44 | Y=30.44^(***)X- 79.64 | Y=45.38^(**)X- 72.17 | Y=16.91^(**)X- 23.60 |
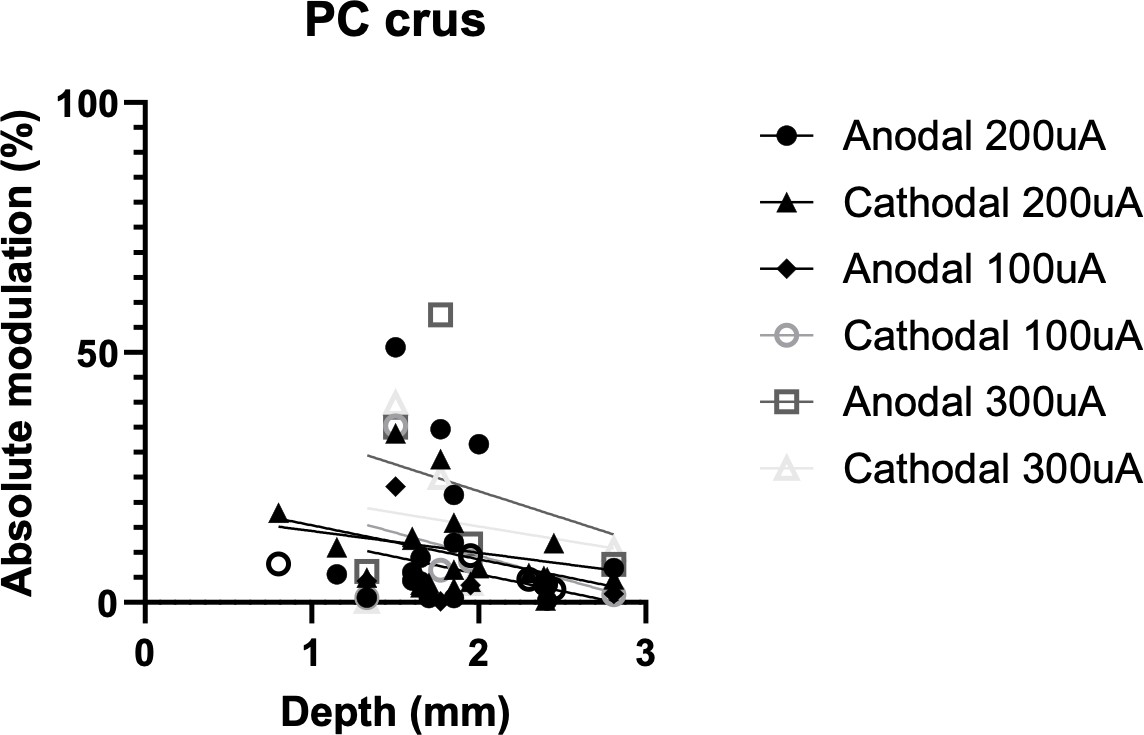
Author response table 3
| Anodal 200uA | Cathodal 200uA | Anodal 100uA | Cathodal 100uA | Anodal 300uA | Cathodal 300uA | |
|---|---|---|---|---|---|---|
| Goodness of Fit | ||||||
| R squared | 0.02341 | 0.02422 | 0.0007774 | 0.03864 | 0.005197 | 5.765e-006 |
| Sy.x | 43.85 | 38.85 | 93.44 | 34.07 | 45.65 | 65.50 |
| Is slope significantly non-zero? | ||||||
| F | 0.6713 | 0.7199 | 0.02023 | 1.085 | 0.1306 | 0.0001499 |
| DFn, DFd | 1,28 | 1,29 | 1,26 | 1,27 | 1,25 | 1,26 |
| P value | 0.4195 | 0.4031 | 0.8880 | 0.3068 | 0.7208 | 0.9903 |
| Deviation from zero? | Not Significant | Not Significant | Not Significant | Not Significant | Not Significant | Not Significant |
| Runs test | ||||||
| Points above line | ||||||
| Points below line | ||||||
| Number of runs | ||||||
| P value (runs test) | ||||||
| qquad | ||||||
| Equation | Y=-7.697^(**)X +81.16 | Y=-6.829^(**)X +62.28 | Y=-2.886^(**)X +58.77 | Y=-7.682^(**)X +47.56 | Y=3.645^(**)X +78.34 | Y=0.1767^(**)X +76.78 |
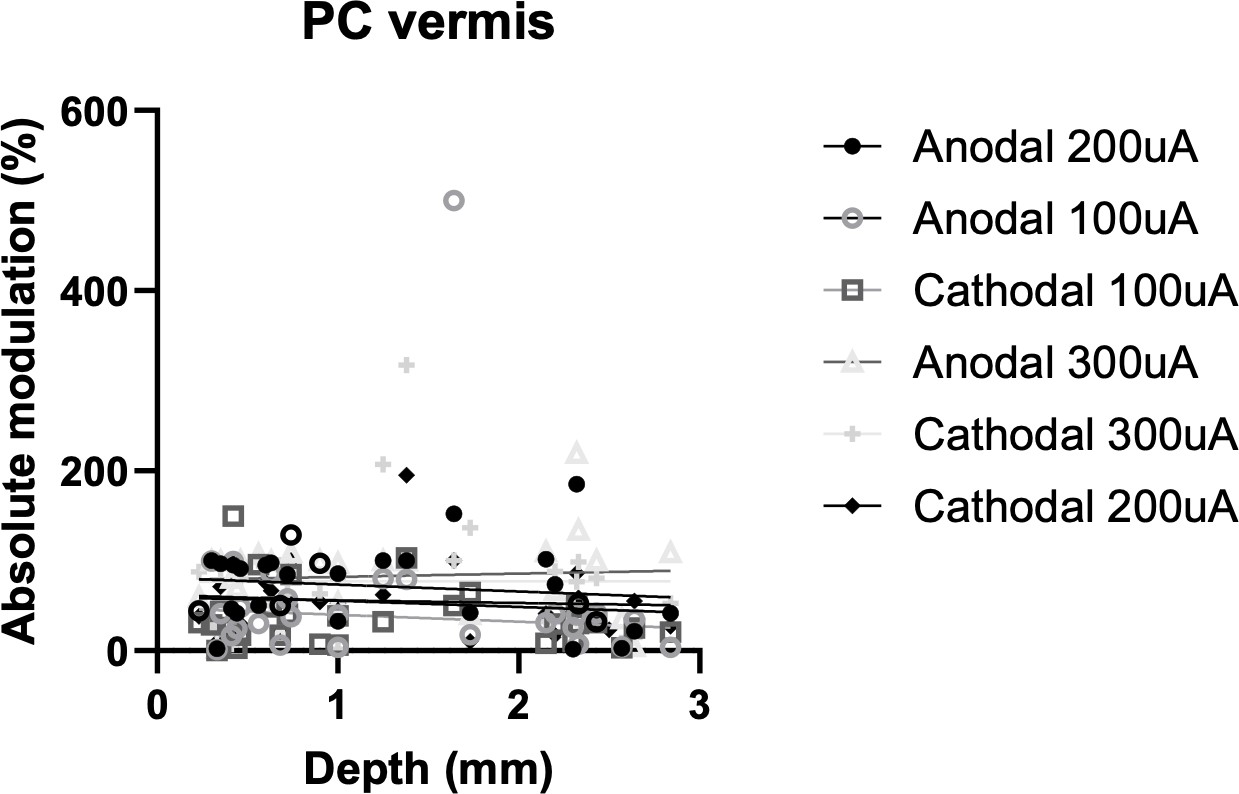
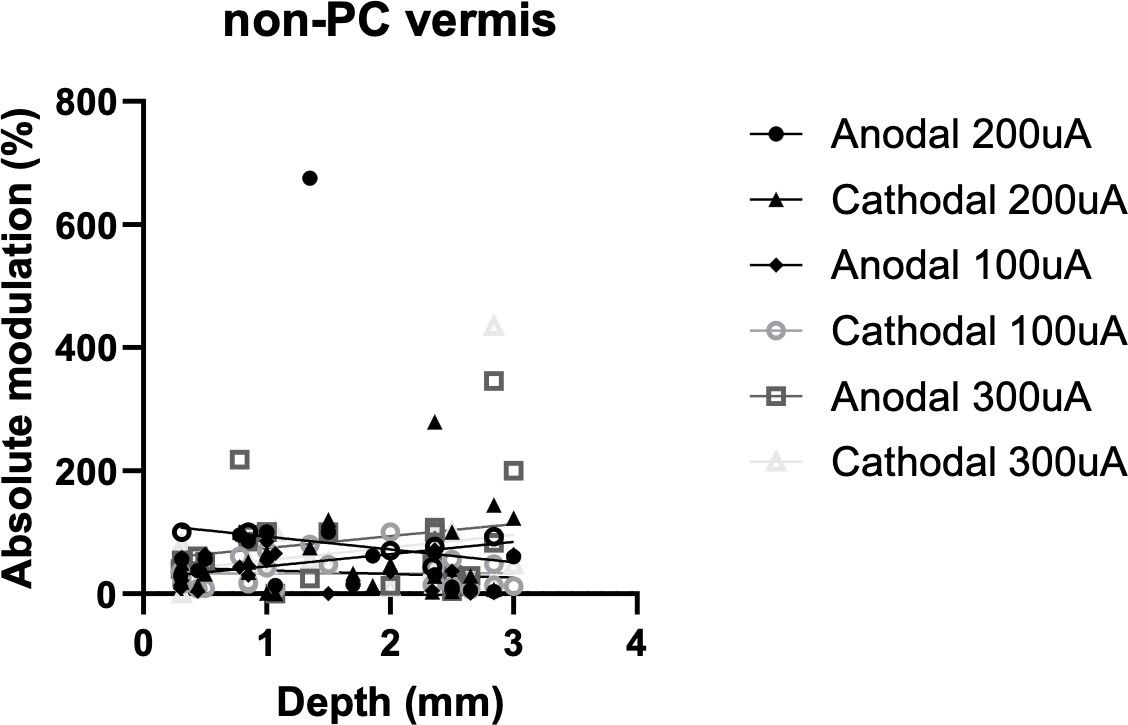
Author response table 4
| Anodal 200uA | Cathodal 200uA | Anodal 100uA | Cathodal 100uA | Anodal 300uA | Cathodal 300uA | |
|---|---|---|---|---|---|---|
| Goodness of Fit | ||||||
| R squared | 0.02210 | 0.08475 | 0.04235 | 7.561e-005 | 0.05198 | 0.05177 |
| Sy. X | 129.9 | 61.06 | 28.04 | 26.90 | 79.95 | 87.77 |
| Is slope significantly non-zero? | ||||||
| F | 0.5199 | 2.130 | 0.8845 | 0.001588 | 1.097 | 1.092 |
| DFn, DFd | 1,23 | 1,23 | 1,20 | 1,21 | 1,20 | 1,20 |
| P value | 0.4782 | 0.1580 | 0.3582 | 0.9686 | 0.3075 | 0.3085 |
| qquad | Not Significant | Not Significant | Not Significant | Not Significant | Not Significant | Not Significant |
| Runs test | ||||||
| Points above line | ||||||
| Points below line | ||||||
| Number of runs | ||||||
| P value (runs test) | ||||||
| qquad | ||||||
| Equation | Y=-20.88^(**)X +113.8 | Y=19.87^(**)X+ 24.76 | Y=-5.902^(**)X +44.05 | Y=0.2396^(**)X +32.62 | Y=19.52^(**)X+ 54.69 | Y=20.83^(**)X+ 33.52 |
Additional files
Download links
A two-part list of links to download the article, or parts of the article, in various formats.
Downloads (link to download the article as PDF)
Open citations (links to open the citations from this article in various online reference manager services)
Cite this article (links to download the citations from this article in formats compatible with various reference manager tools)
Somatodendritic orientation determines tDCS-induced neuromodulation of Purkinje cell activity in awake mice
eLife 13:RP100941.
https://doi.org/10.7554/eLife.100941.3


