Molecular and mechanical signatures contributing to mouse epidermal differentiation and barrier formation
- Department of Dermatology, Duke University Medical Center, United States
- Department of Cell Biology, Duke University Medical Center, United States
Figures
Figure 1 with 1 supplement
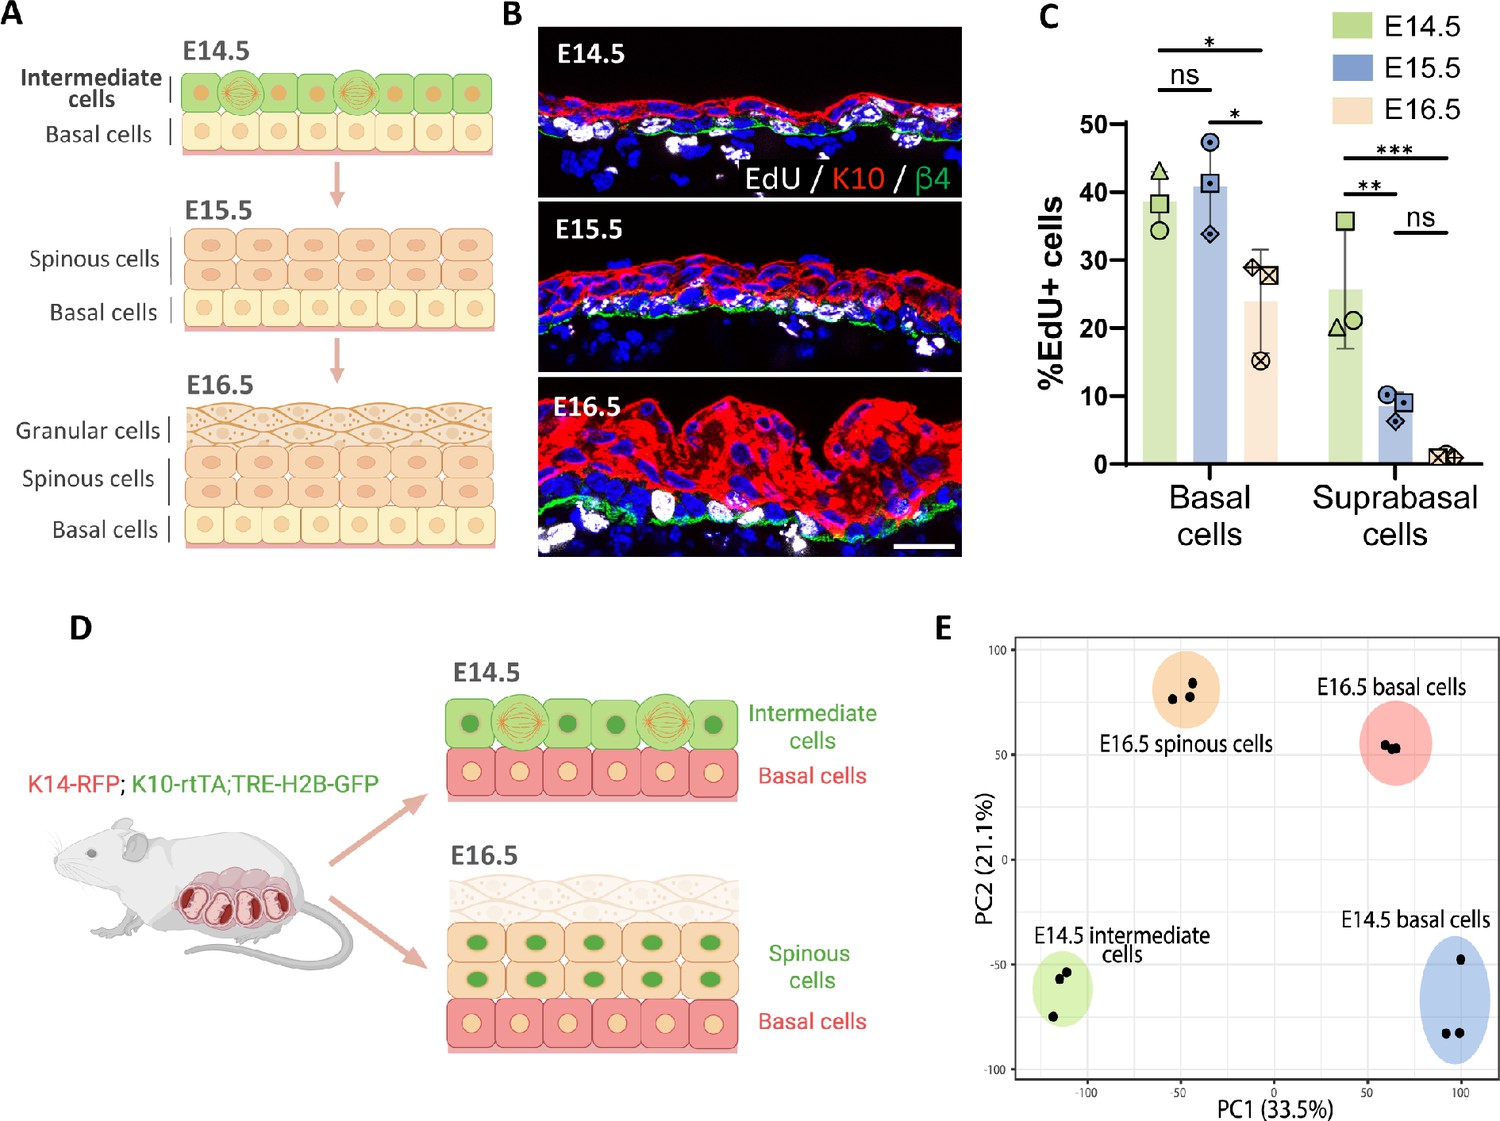
Transcriptomic analysis of embryonic epidermal cell populations.
(A) Diagram depicting the stratification process and different cell populations (basal and K10+ suprabasal layers) existing in the epidermis from embryonic day (E) 14.5 to E16.5. Created with BioRender.com. (B) Images of EdU staining (white) at E14.5, E15.5, and E16.5. Immunofluorescence of suprabasal cells labeled with keratin 10 (K10) in red and the basement membrane, with β4-integrin in green. Scale bars: 20 μm. (C) Quantification of the percentage of EdU+ cells in the basal and the first two layers of suprabasal cells at E14.5, E15.5, and E16.5. n=3 embryos/time point. Different shapes represent different embryos. Data are presented as mean ± standard deviation (SD). Ordinary two-way ANOVA (p=0.0003), Tukey’s multiple comparisons test, ns: not significant, *: p<0.05, **: p<0.01, ***: p<0.001. (D) Schematic showing basal and suprabasal cell populations collected for RNA sequencing: K14-RFP;K10-rtTA;TRE-H2B-GFP pregnant dams were all fed with doxycycline from E12.5 and then sacrificed at either E14.5 or E16.5. The E14.5 intermediate cells (K10-GFP+;K14-RFP-), E16.5 spinous cells (K10-GFP+;K14-RFP-), and basal cells at E14.5 and E16.5 (K10-GFP-;K14-RFP+) cells were collected separately and sent for RNA sequencing. Granular cells were excluded from E16.5 samples. Created with BioRender.com. (E) Principal component analysis (PCA) score plot of the first two principal components (PC1: 33.5% variance and PC2: 21.1% variance) for gene expression levels from samples of cell populations indicated in (D) (n=3 embryos/cell population).
Figure 1—figure supplement 1
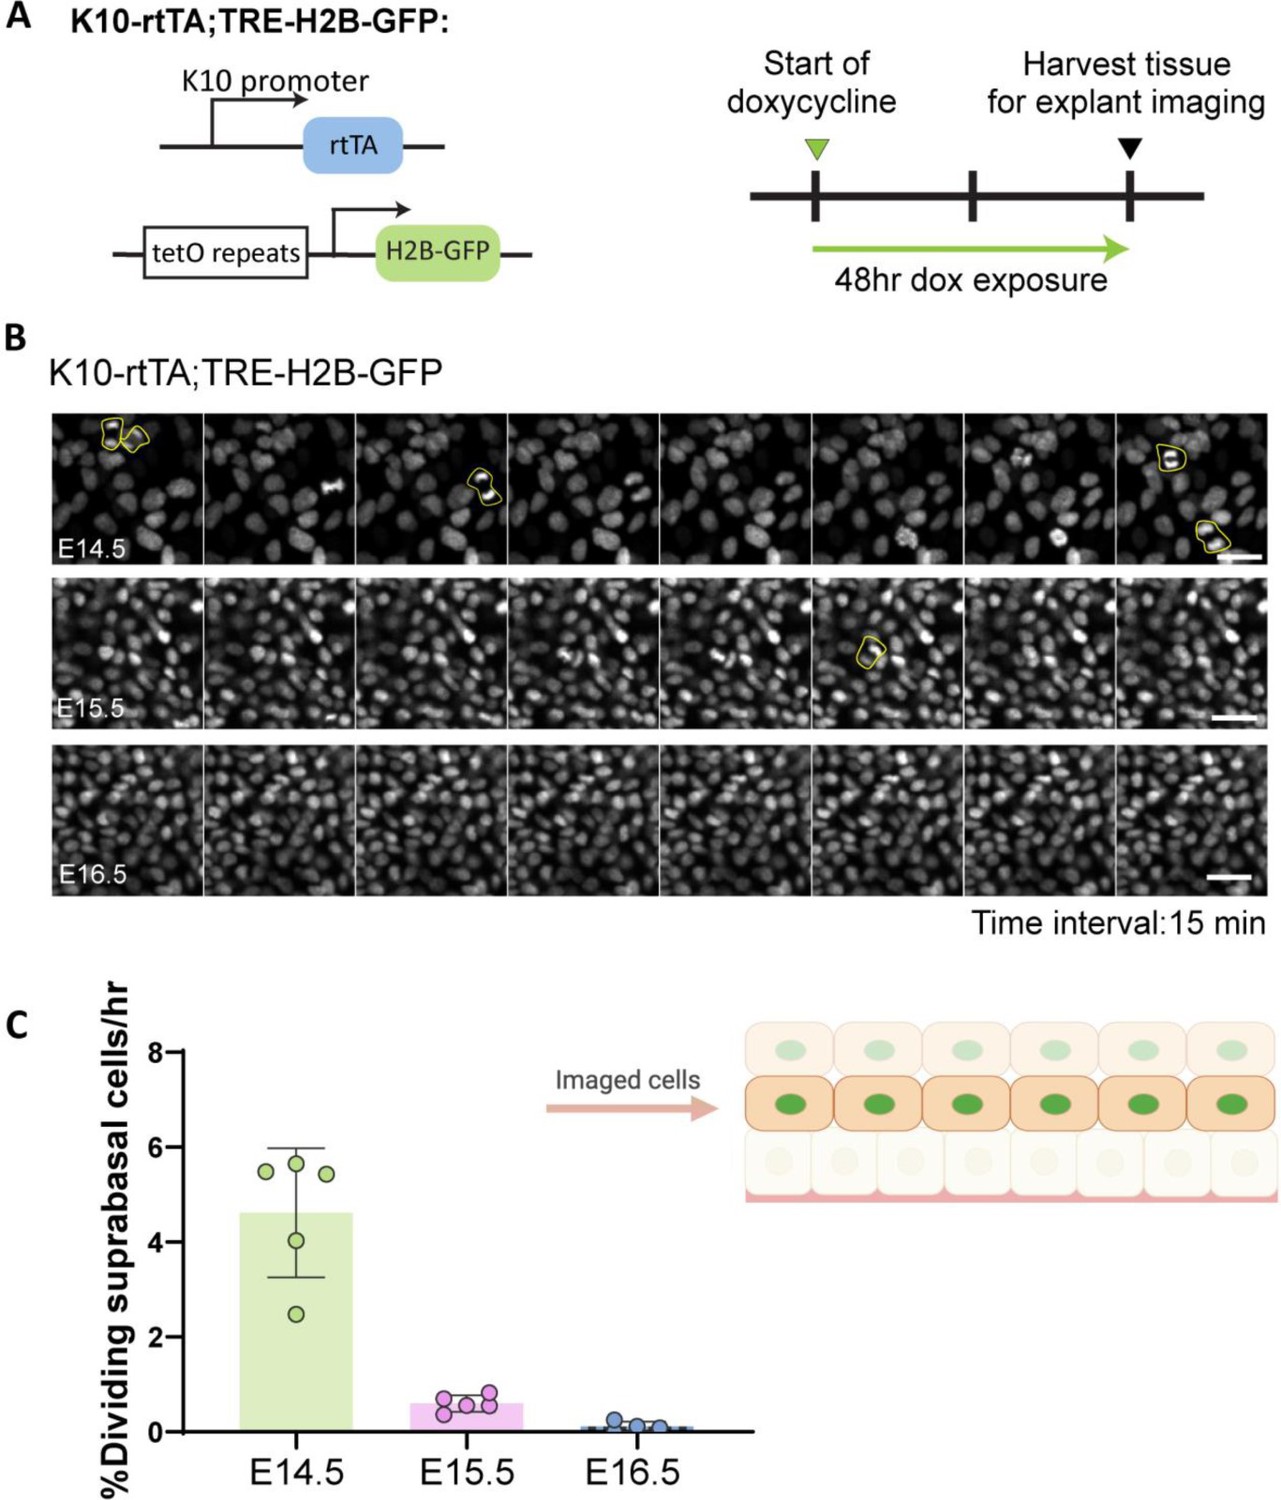
Live imaging of mitotic suprabasal cells during early epidermal stratification.
(A) Diagram depicting alleles used for live imaging of suprabasal cells and treatment timeline: Pregnant dams were doxycycline fed 48 hr before embryos were collected and their tissue harvested for explant imaging. (B) Snapshots from live imaging of back skin explants from embryonic day (E) 14.5, E15.5, and E16.5 K10-rtTA;TRE-H2B-GFP embryos, which express H2B-GFP in suprabasal cells. Images are from the first plane of H2B-GFP+ cells, corresponding to the suprabasal layer immediately on top of basal cells from E14.5, E15.5, and E16.5 explants. Time interval between snapshots: 15 min. Scale bars: 20 μm. (C) Percentage of mitotic events counted during 2 hr of live imaging. Only suprabasal cells from layers on top of basal cells were quantified. n=5 different fields for E14.5 and E15.5, and n=4 different fields for E16.5 from at least 2 embryos for each time point were analyzed. Created with BioRender.com.
Figure 2 with 2 supplements
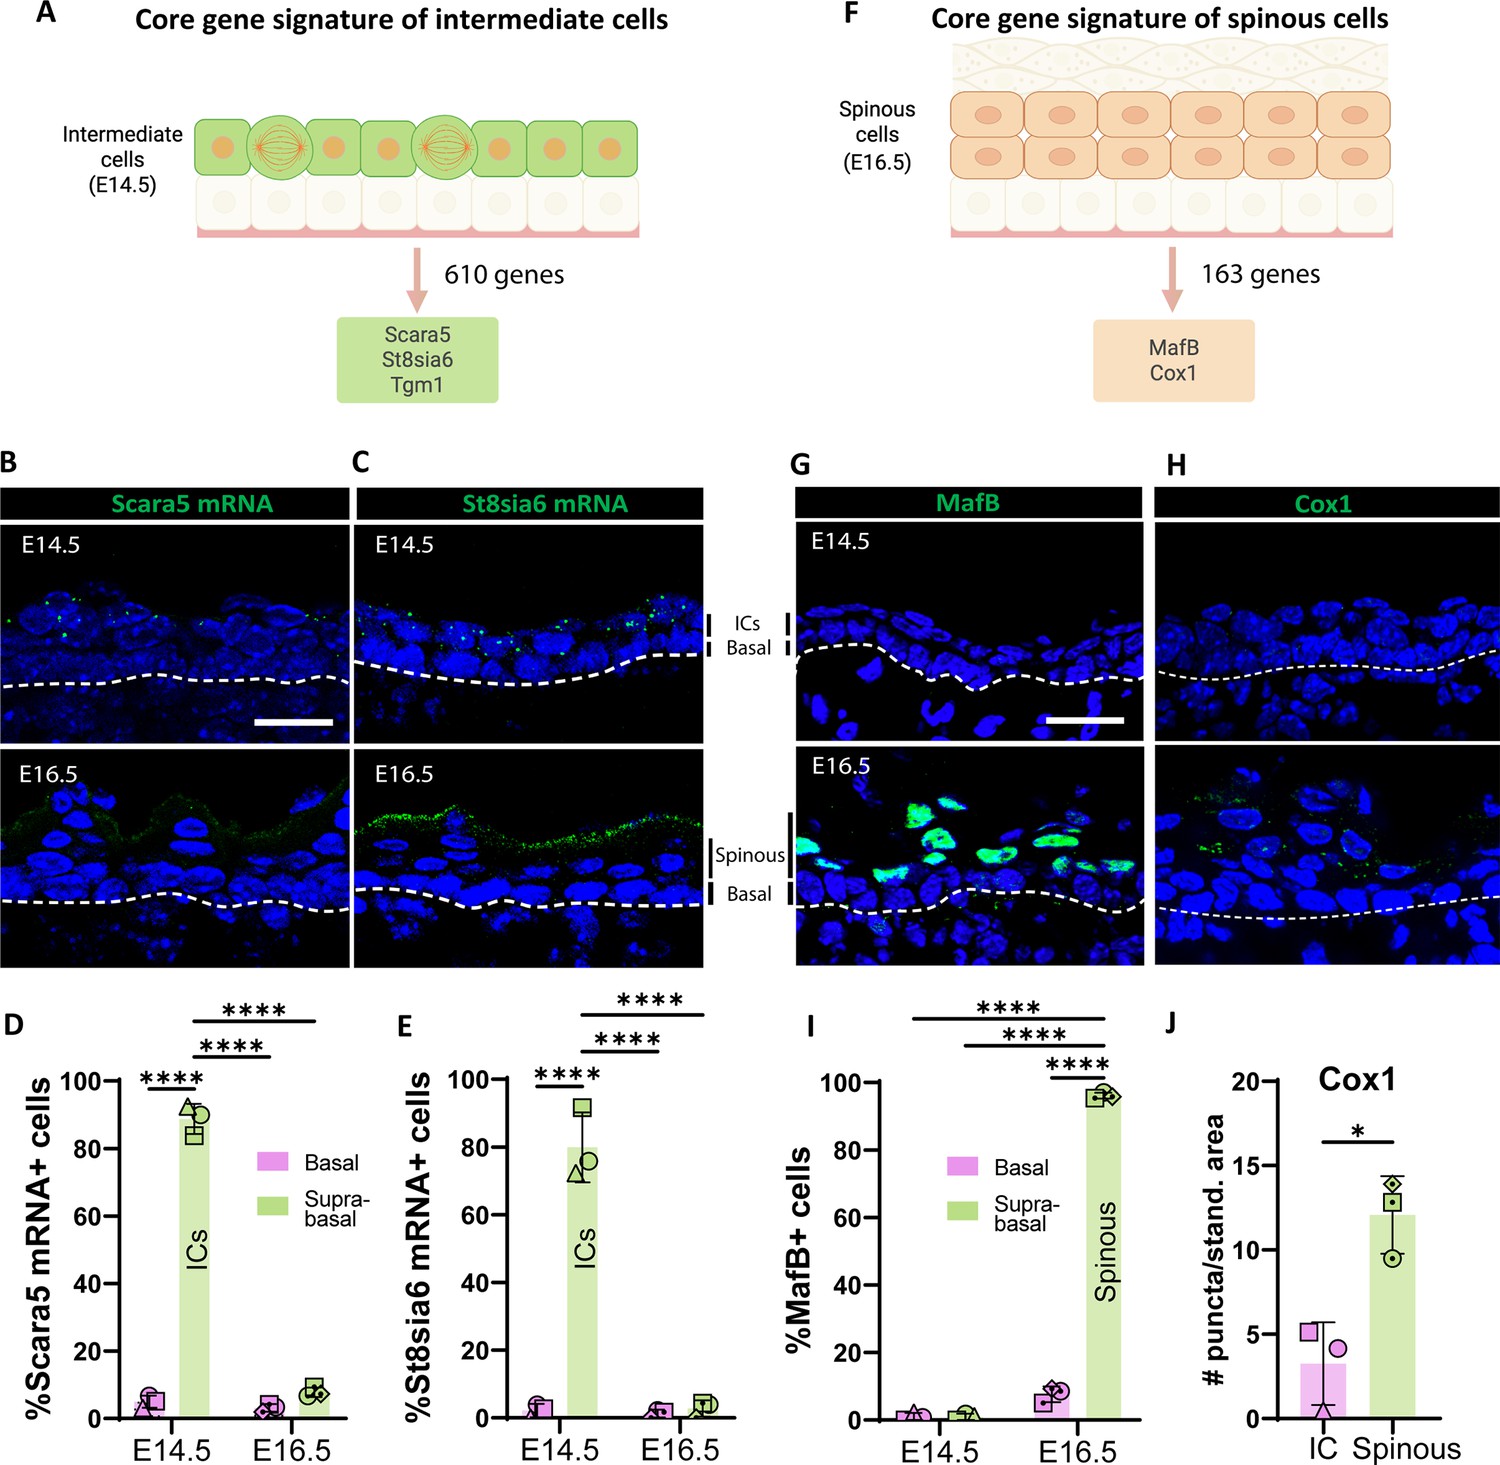
Identifying markers for intermediate (ICs) and spinous cells.
(A) The core gene signature of ICs was obtained from the list of genes only upregulated in ICs (log2 fold change > 1, p<0.05; as compared with both basal cells at embryonic day [E] 14.5 and spinous cells at E16.5). Total genes in the IC signature were 610. From this list, Scara5 and St8sia6 were two of the most highly upregulated genes compared to spinous cells at E16.5. (B and C) RNAscope of Scara5 (B) and St8sia6 (C) in WT embryos at E14.5 and E16.5. Basement membrane is indicated as a dotted line. Scale bars: 20 μm. (D and E) Quantification of the percentage of Scara5+ (D) and St8sia6+ (E) basal and suprabasal cells at E14.5 and E16.5. n=3 embryos/time point. Different shapes represent different embryos. Data are presented as the mean ± SD. ****: p<0.0001, ordinary two-way ANOVA (p<0.0001), Sidak’s multiple comparisons test. (F) The core gene signature of spinous cells was obtained from the list of genes only upregulated in spinous cells (log2 fold change > 1, p<0.05 compared with both basal cells at E16.5 and ICs at E14.5). Total genes in the spinous cell signature were 163. (G and H) Immunofluorescence staining of MafB (G) and Cox1 (H) in WT embryos at E14.5 and E16.5. Basement membrane is indicated as a dotted line. Scale bars: 20 μm. (I) Quantification of the percentage of MafB+ basal and suprabasal cells at E14.5 and E16.5. n=3 embryos/time point. Data are presented as the mean ± SD. ****: p<0.0001, ordinary two-way ANOVA (p<0.0001), Sidak’s multiple comparisons test. (J) Quantification of Cox1 puncta/standardized area in ICs at E14.5 was compared to the first two layers of spinous cells at E16.5. n=3 embryos/time point. Data are presented as the mean ± SD. *: p<0.05, two-tailed unpaired t-test. Created with BioRender.com.
Figure 2—figure supplement 1
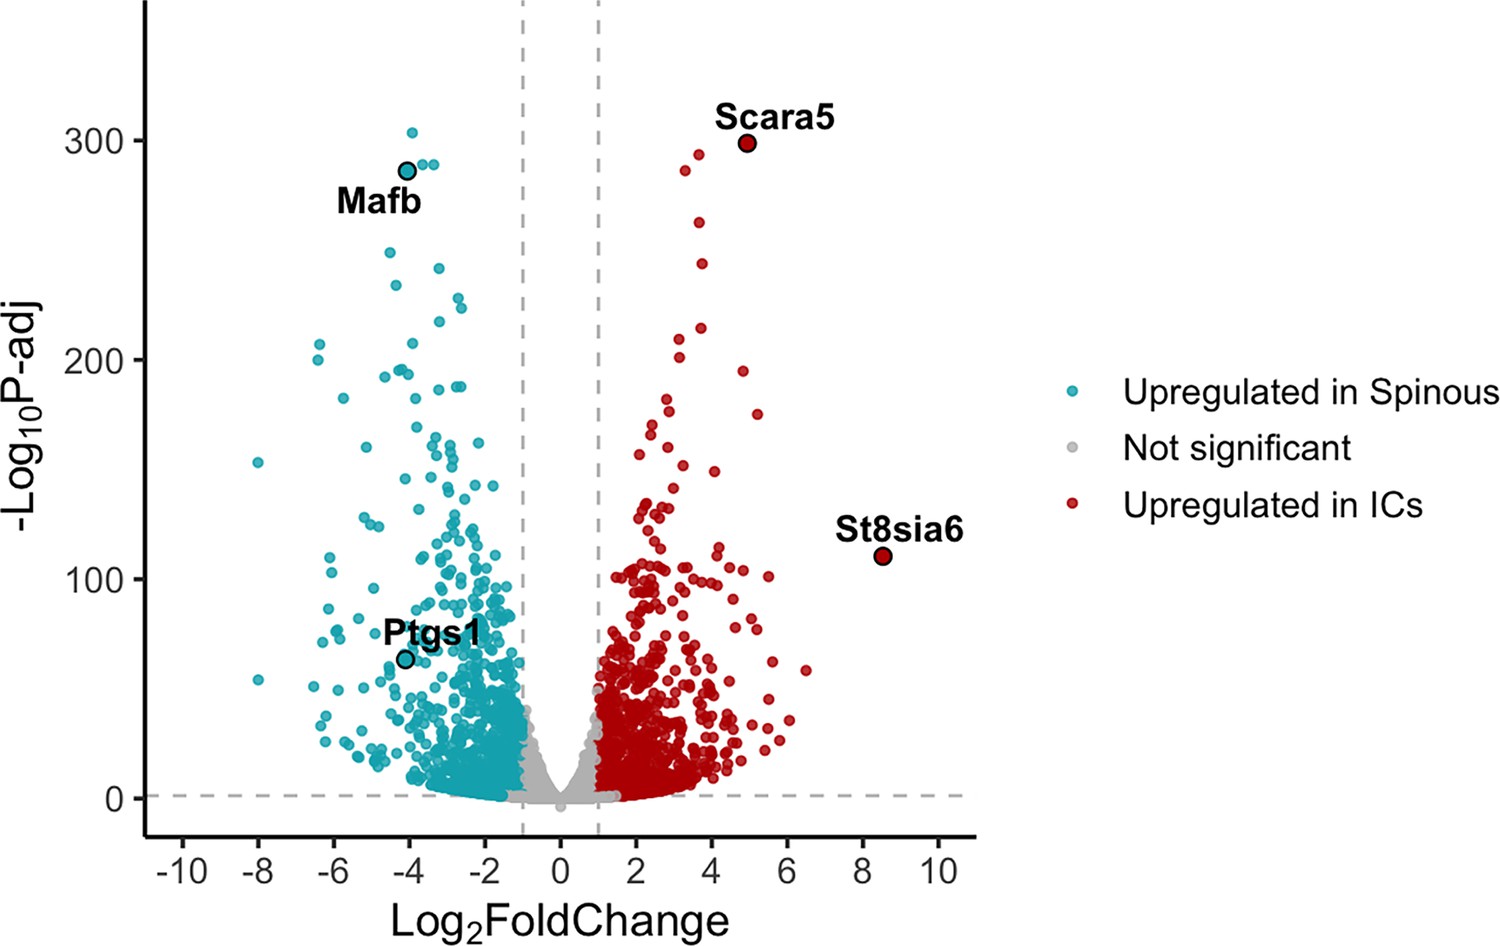
Genes upregulated in intermediate cells and spinous cells.
Volcano plot depicting differentially expressed genes in embryonic day (E) 14.5 vs E16.5 depicted in red (enriched in intermediate cells) or blue (enriched in spinous cells). Labeled genes represent candidate marker genes for each population.
Figure 2—figure supplement 2
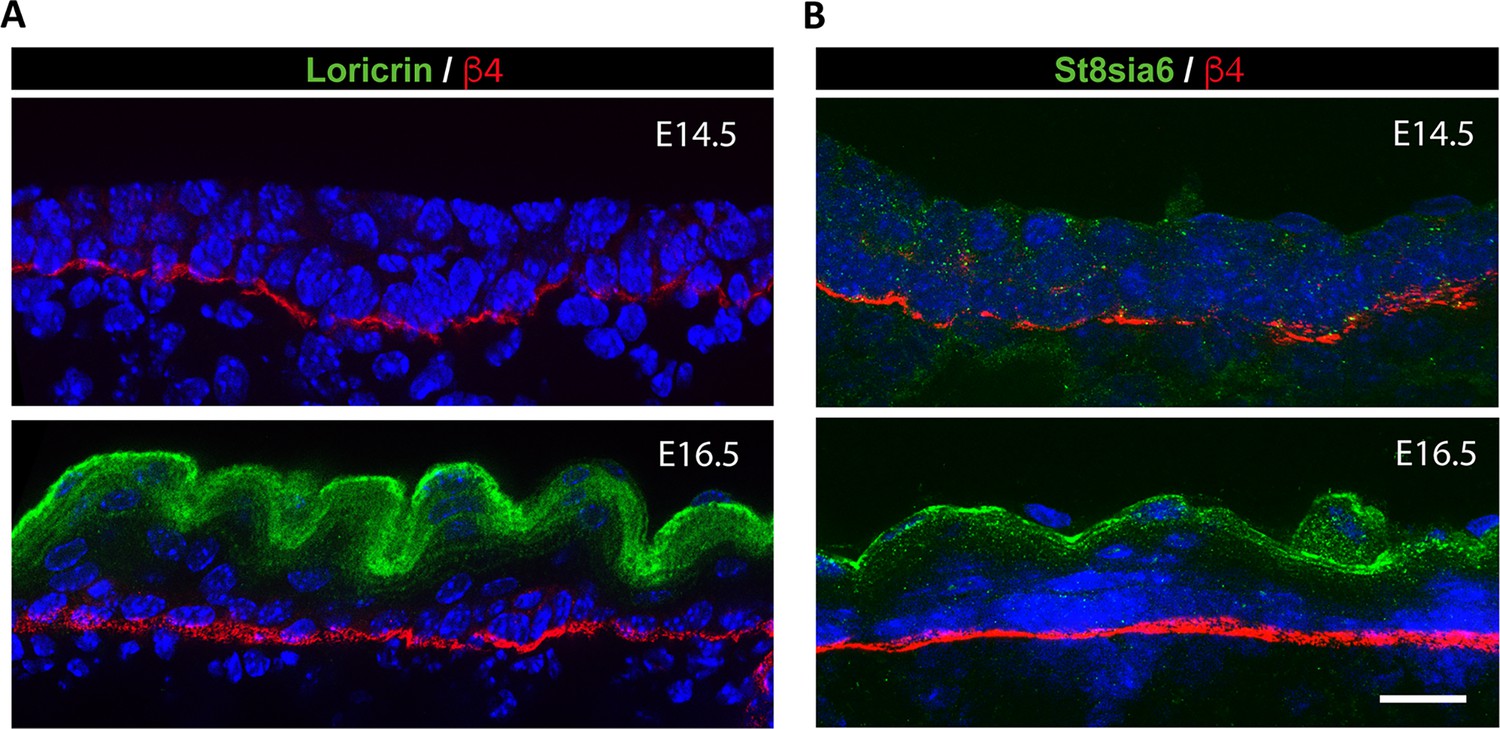
Intermediate cells do not express some granular markers at the protein level.
(A and B) Immunofluorescence staining of Loricrin (A) or St8sia6 (B) in green labeling granular cells at embryonic day (E) 16.5 but not in intermediate cells at E14.5. Basement membrane is marked with β4-integrin in red. Images representative of at least two mice. Scale bars: 20 μm.
Figure 3 with 1 supplement
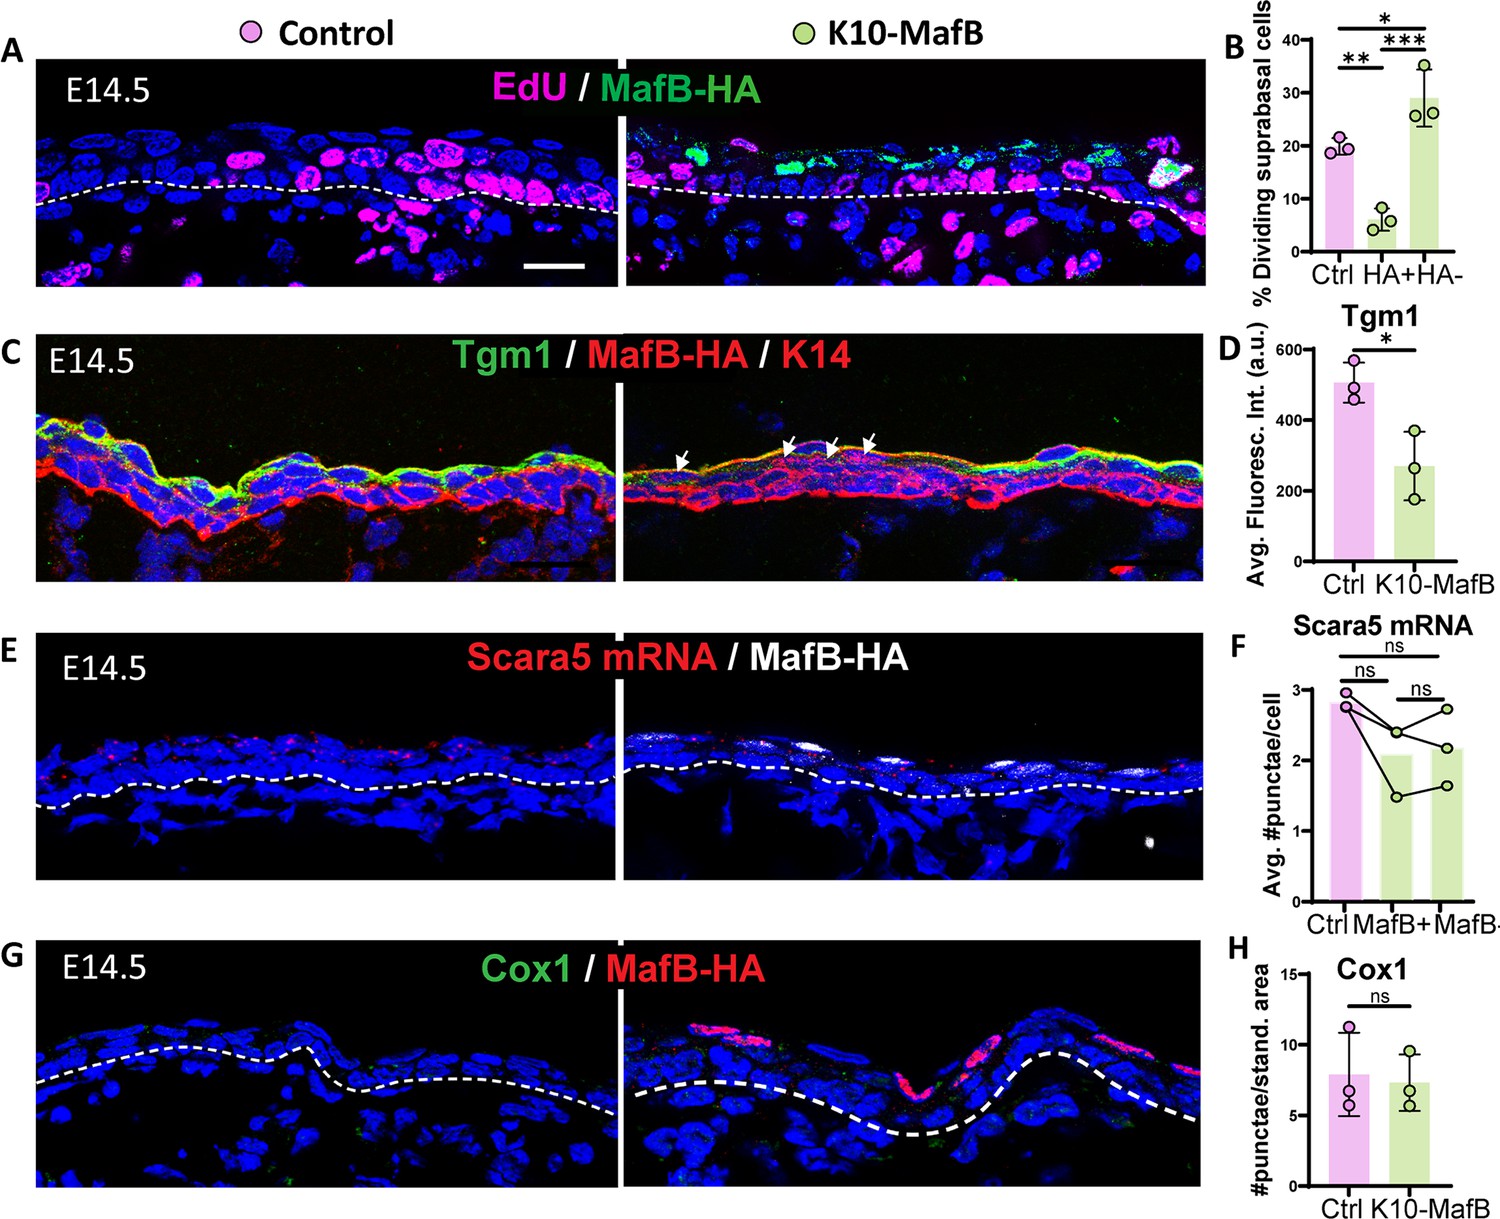
Mis-expression of MafB in intermediate cells (ICs) is sufficient to reduce proliferation but not to induce spinous fate.
(A) Image of EdU staining (magenta) and MafB-expressing ICs immunolabeled with HA (green) in K10-MafB and control mice at embryonic day (E) 14.5, doxycycline fed since E12. All scale bars in this figure: 20 μm. Dotted lines represent the basement membrane. (B) Percentage of EdU+ dividing suprabasal cells in control (pink bars), and HA+ and HA– cells in K10-MafB mice (green bars) at E14.5 (n=3 embryos/genotype). Data are presented as the mean ± SD. *: p<0.05, **: p<0.01, ***: p<0.001, ordinary one-way ANOVA (p=0.0006), Tukey’s multiple comparisons test. (C) Immunofluorescence staining of Tgm1 in K10-MafB vs control mice at E14.5. Arrows indicate HA+ cells in K10-MafB embryo. (D) Quantification of Tgm1 average fluorescence in suprabasal cells of control vs K10-MafB at E14.5 (n=3 embryos/genotype). Data are presented as the mean ± SD. *: p<0.05, two-tailed unpaired t-test. (E) RNAscope of Scara5 in red and immunostaining with MafB in white. (F) Quantification of the average number of Scara5 RNAscope puncta per cell in suprabasal layers of control, and MafB+ and MafB- cells of K10-MafB mice at E14.5 (n=3 embryos/genotype). Data are presented as the mean. ns: not significant, Friedman test (p=0.194), Dunn’s multiple comparisons test. (G) Immunofluorescence staining of Cox1 in K10-MafB vs control mice at E14.5. (H) Quantification of number of Cox1 puncta per standardized area of suprabasal layer in K10-MafB vs control mice at E14.5. n=3 embryos/genotype. Data are presented as the mean. ns: not significant, two-tailed unpaired t-test.
Figure 3—figure supplement 1
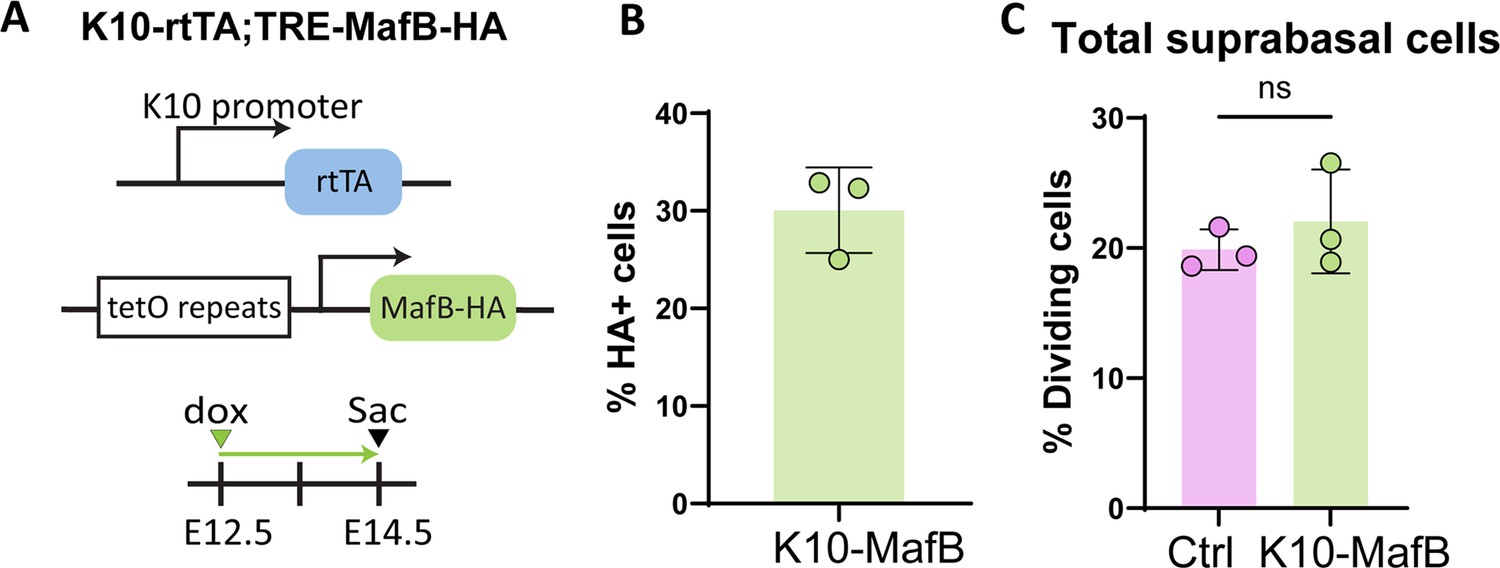
The overall rate of suprabasal cell proliferation in K10-MafB is not significantly different from controls.
(A) Diagram depicting alleles in K10-MafB used to induce MafB expression in intermediate cells. Pregnant dams were fed with doxycycline chow from embryonic day (E) 12.5 and sacrificed at E14.5. (B) Percentage of suprabasal cells expressing MafB (HA+) in K10-MafB mice at E14.5. (C) Percentage of dividing cells among all suprabasal cells at E14.5 in K10-MafB vs controls is not significantly different. n=3 embryos/genotype. Data are presented as the mean. ns: not significant, two-tailed unpaired t-test.
Figure 4 with 1 supplement
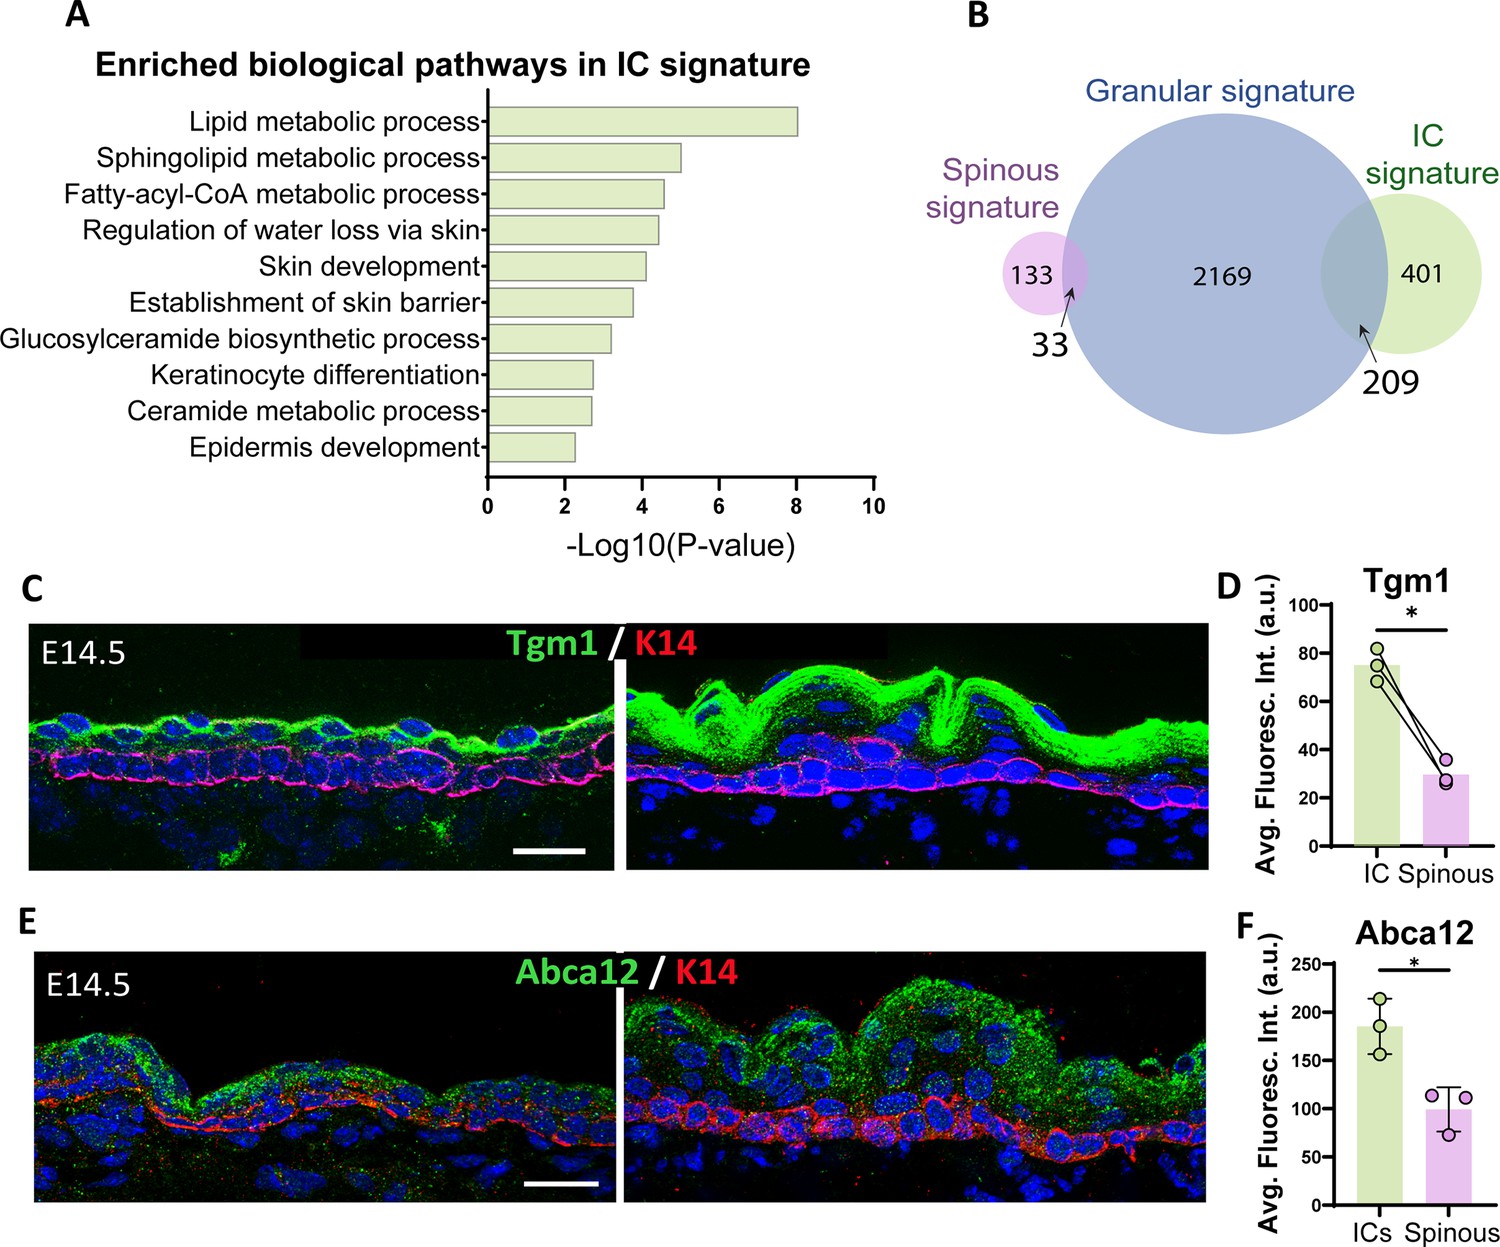
Intermediate cells (ICs) are transcriptionally similar to granular cells and express granular markers.
(A) Gene Ontology (GO) term enrichment analysis of genes in the IC signature. (B) Venn diagram illustrating the number of genes in the IC signature compared with the granular signature (log2 fold change > 1, p<0.05) for each cell population. A total of 209 genes were commonly enriched in ICs and granular cells, which represents 34% of the total IC signature. (C and E) Immunofluorescence staining of Tgm1 (C) and Abca12 (E) in green and K14 (red) to mark basal cells in WT embryos at embryonic day (E) 14.5 vs E16.5. Scale bars: 20 μm. (D) Quantification of Tgm1 average fluorescence intensity at suprabasal cells at E14.5 (IC) vs the first two layers of suprabasal cells at E16.5 (spinous cells). n=3 embryos/time point. Bar represents the mean. *: p<0.05, two-tailed paired t-test. (F) Quantification of Abca12 average fluorescence intensity at suprabasal cells at E14.5 (ICs) vs the first two layers of suprabasal cells at E16.5 (spinous cells). n=3 embryos/time point. Data are presented as the mean ± SD. *: p<0.05, two-tailed unpaired t-test.
Figure 4—figure supplement 1
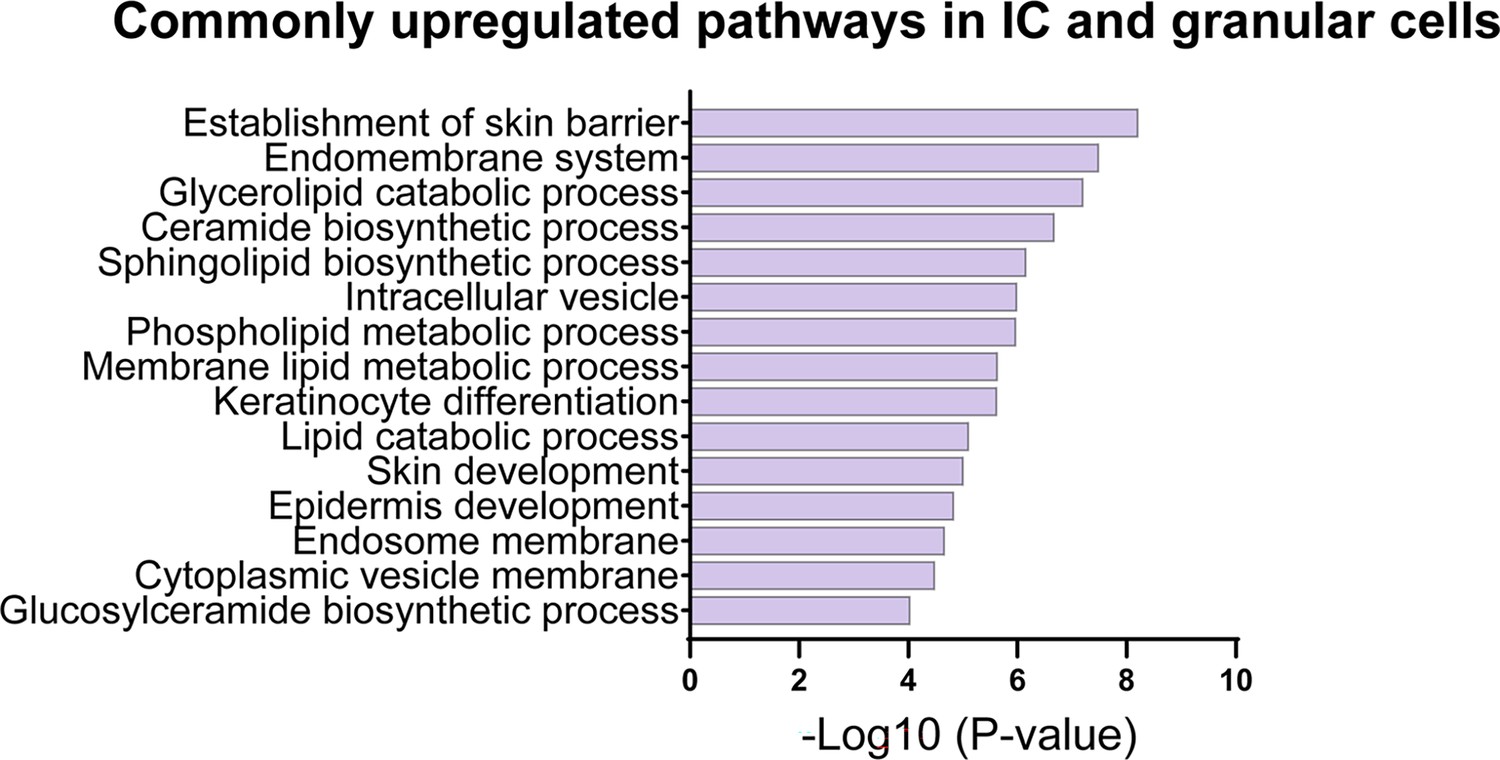
Intermediate and granular cells shared pathways related to lipid biosynthetic processes and endomembrane systems.
Gene Ontology (GO) analysis from commonly enriched genes in intermediate and granular cell signatures.
Figure 5 with 2 supplements
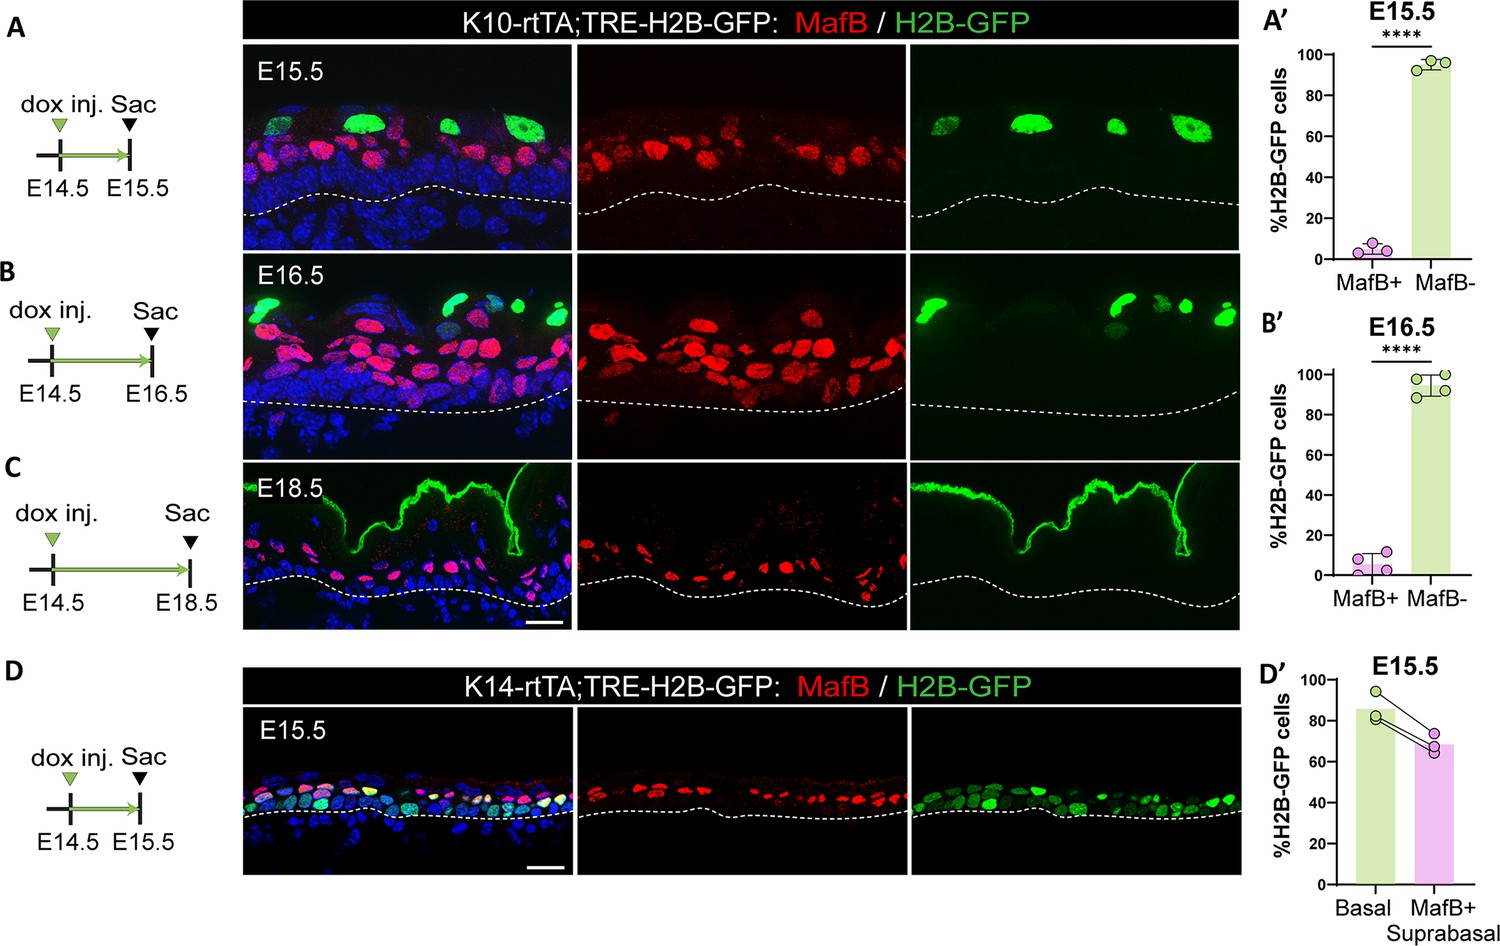
Intermediate cells (ICs) do not differentiate into spinous cells.
(A, B, and C) Immunofluorescence staining of spinous cells with MafB in red and labeled cells with H2B-GFP from K10-rtTA;TRE-H2B-GFP mice that were injected with a low dose of doxycycline at embryonic day (E) 14.5 to label only ICs and sacrificed at E15.5 (A), E16.5 (B), or E18.5 (C). Basement membrane is indicated as a dotted line. Scale bars: 20 μm. (A’ and B’) Percentage of MafB+ and MafB- suprabasal cells expressing H2B-GFP at E15.5 (n=3 embryos) (A) and E16.5 (n=4 embryos) (B). Data are presented as the mean ± SD. ****: p<0.0001, two-tailed unpaired t-test. (D) Immunofluorescence staining of spinous cells with MafB in red and labeled cells with H2B-GFP in K14-rtTA;TRE-H2B-GFP mice that were injected with a low dose of doxycycline at E14.5 and sacrificed at E15.5. Scale bar: 20 μm. (D’) Percentage of basal cells and MafB+ suprabasal cells expressing H2B-GFP. Paired samples are quantifications from the same mouse (n=3 K14-rtTA;TRE-H2B-GFP embryos).
Figure 5—figure supplement 1
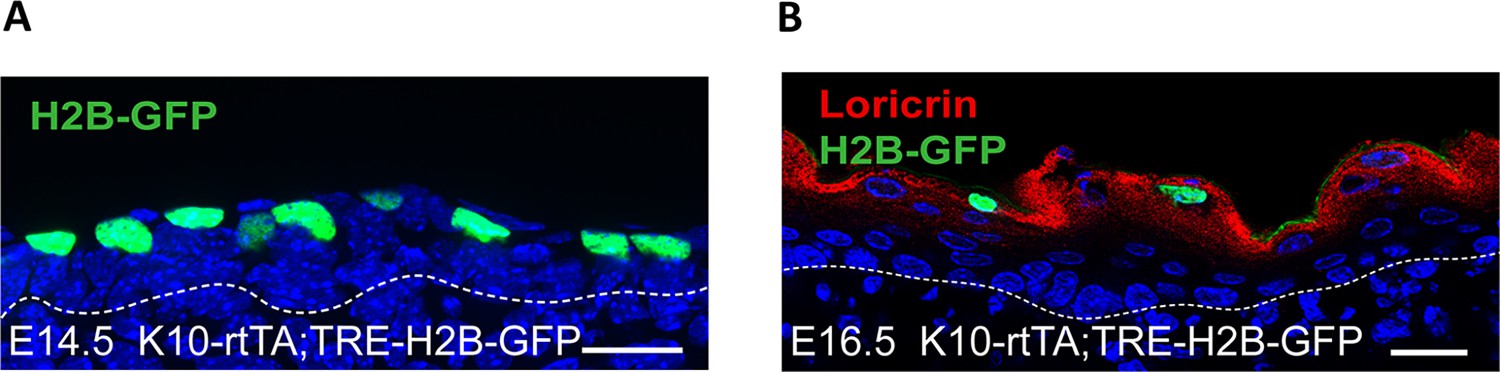
Intermediate cells differentiate into granular cells.
(A) Image showing H2B-GFP expression in intermediate cells in an embryonic day (E) 14.5 K10-rtTA;TRE-H2B-GFP mouse fed with doxycycline from E12.5. Basement membrane is indicated as a dotted line. Scale bar: 20 μm. (B) Immunofluorescence staining of Loricrin in red colocalizing with H2B-GFP-labeled cells in K10-rtTA;TRE-H2B-GFP mice injected with a low dose of doxycycline at E14.5 and sacrificed at E16.5. Scale bar: 20 μm.
Figure 5—figure supplement 2
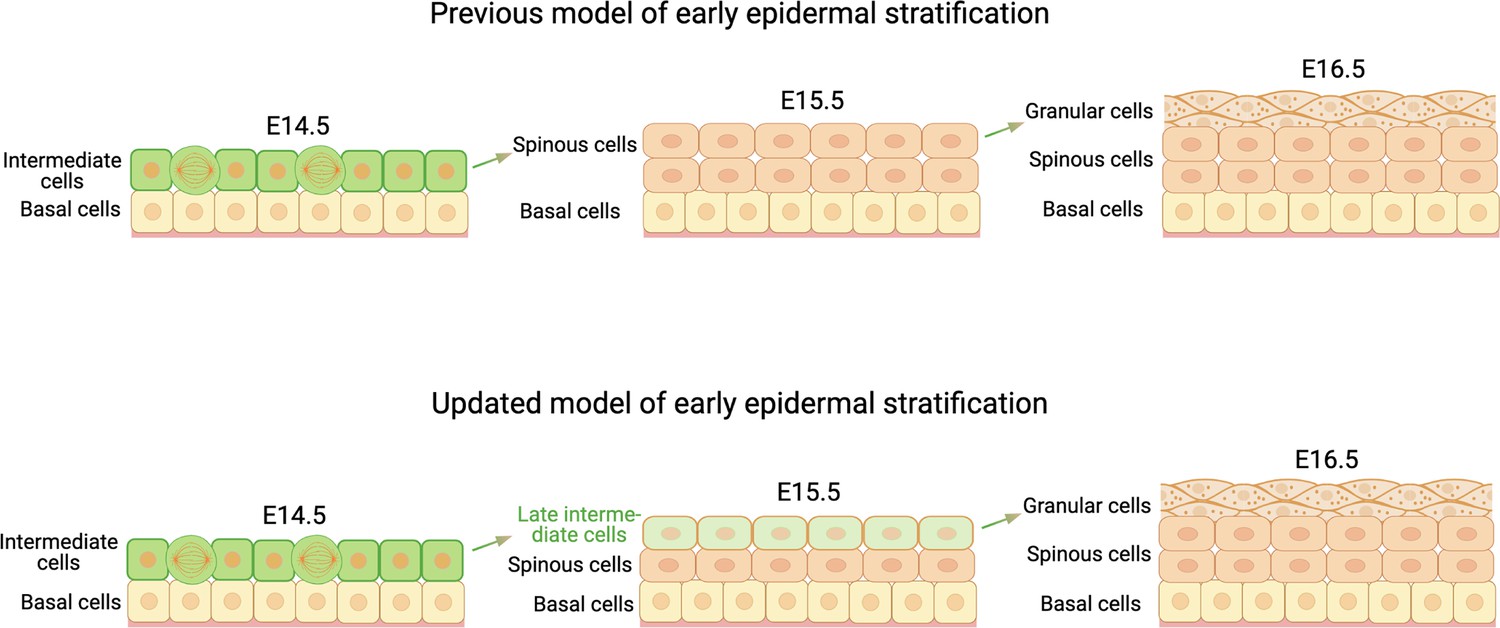
Updated model of early epidermal stratification.
Diagram comparing the previous and updated models of early epidermal stratification. Based on our data, we propose that intermediate cells do not give rise to spinous cells as previously thought, but instead transition directly into granular cells. Created with BioRender.com.
Figure 6 with 2 supplements
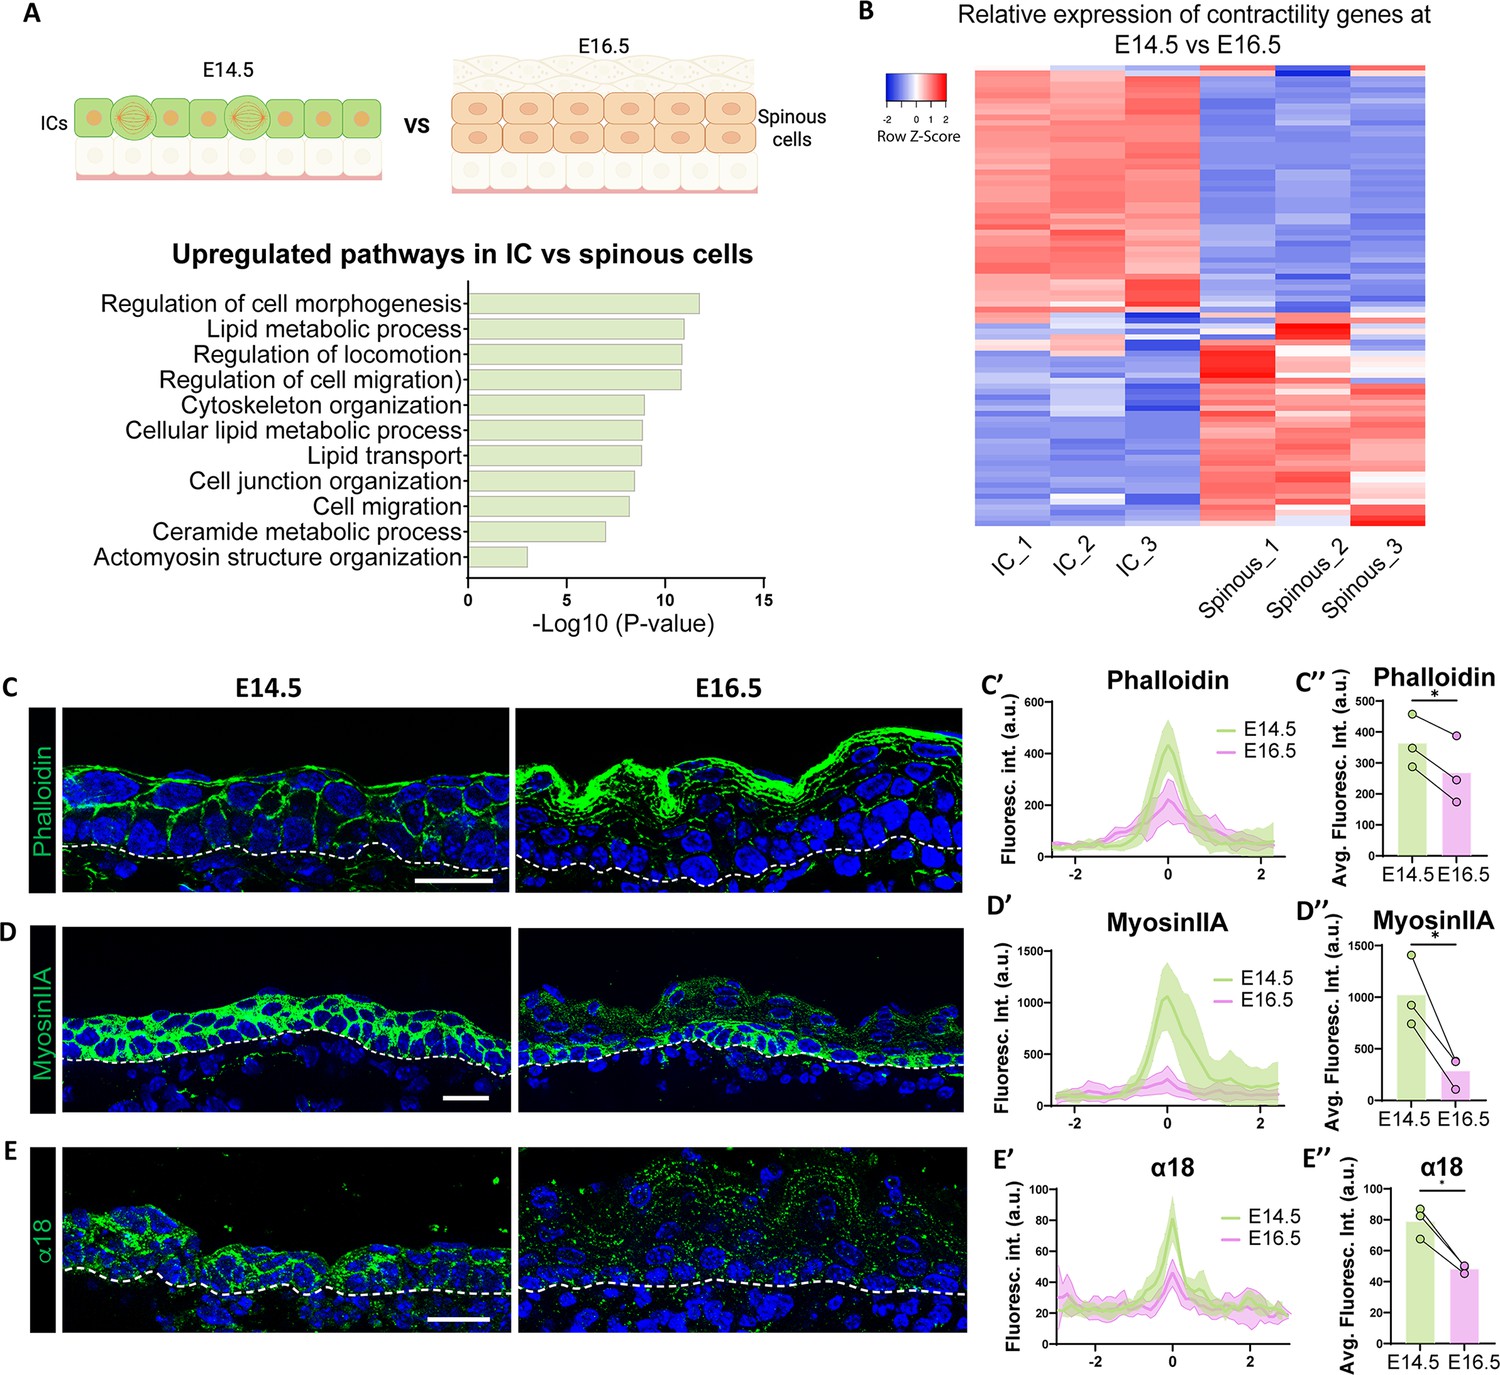
Intermediate cells show upregulation of contractility markers as compared to spinous cells.
(A) Gene Ontology (GO) term enrichment analysis of genes upregulated in intermediate cells vs spinous cells at embryonic day (E) 16.5, as shown in the above diagram, regardless of their expression in basal cells (log2 fold change > 1, p<0.05) reveals upregulation of biological processes related to cytoskeleton organization. Created with BioRender.com. (B) RNA-Seq heatmap depicting differential expression of contractome genes in intermediate and spinous cells at E16.5. Gene expression by FPKM was log2-transformed. (C, D, and E) Immunofluorescence staining of Phalloidin (C), Myosin IIA (D), and α18 (E) in green at E14.5 vs E16.5. Basement membrane is indicated as a dotted line. Scale bars: 20 μm. (C’, D’, and E’) Fluorescence intensity of suprabasal-suprabasal cell boundaries in the first two layers of suprabasal cells. Line scans were performed in WT embryos at E14.5 (between intermediate cells) and E16.5 (between spinous cells). Line scan graphs show centered measurements across six cell-cell boundaries at each time point. Data are presented as the mean ± SD (shown as colored shadows in green at E14.5 and pink at E16.5). Scale bars: 20 μm. (C’’, D’’, and E’’) Quantification of average fluorescence intensity from the line scan maximum values at suprabasal-suprabasal cell boundaries in WT E14.5 and E16.5. For bar plots, bars represent the mean, joined dots are paired samples from each time point. n=3 embryos/time point, average maximum values of at least 15 line scans at suprabasal cell boundaries in each embryo were calculated. *: p<0.05, two-tailed paired t-test.
Figure 6—figure supplement 1
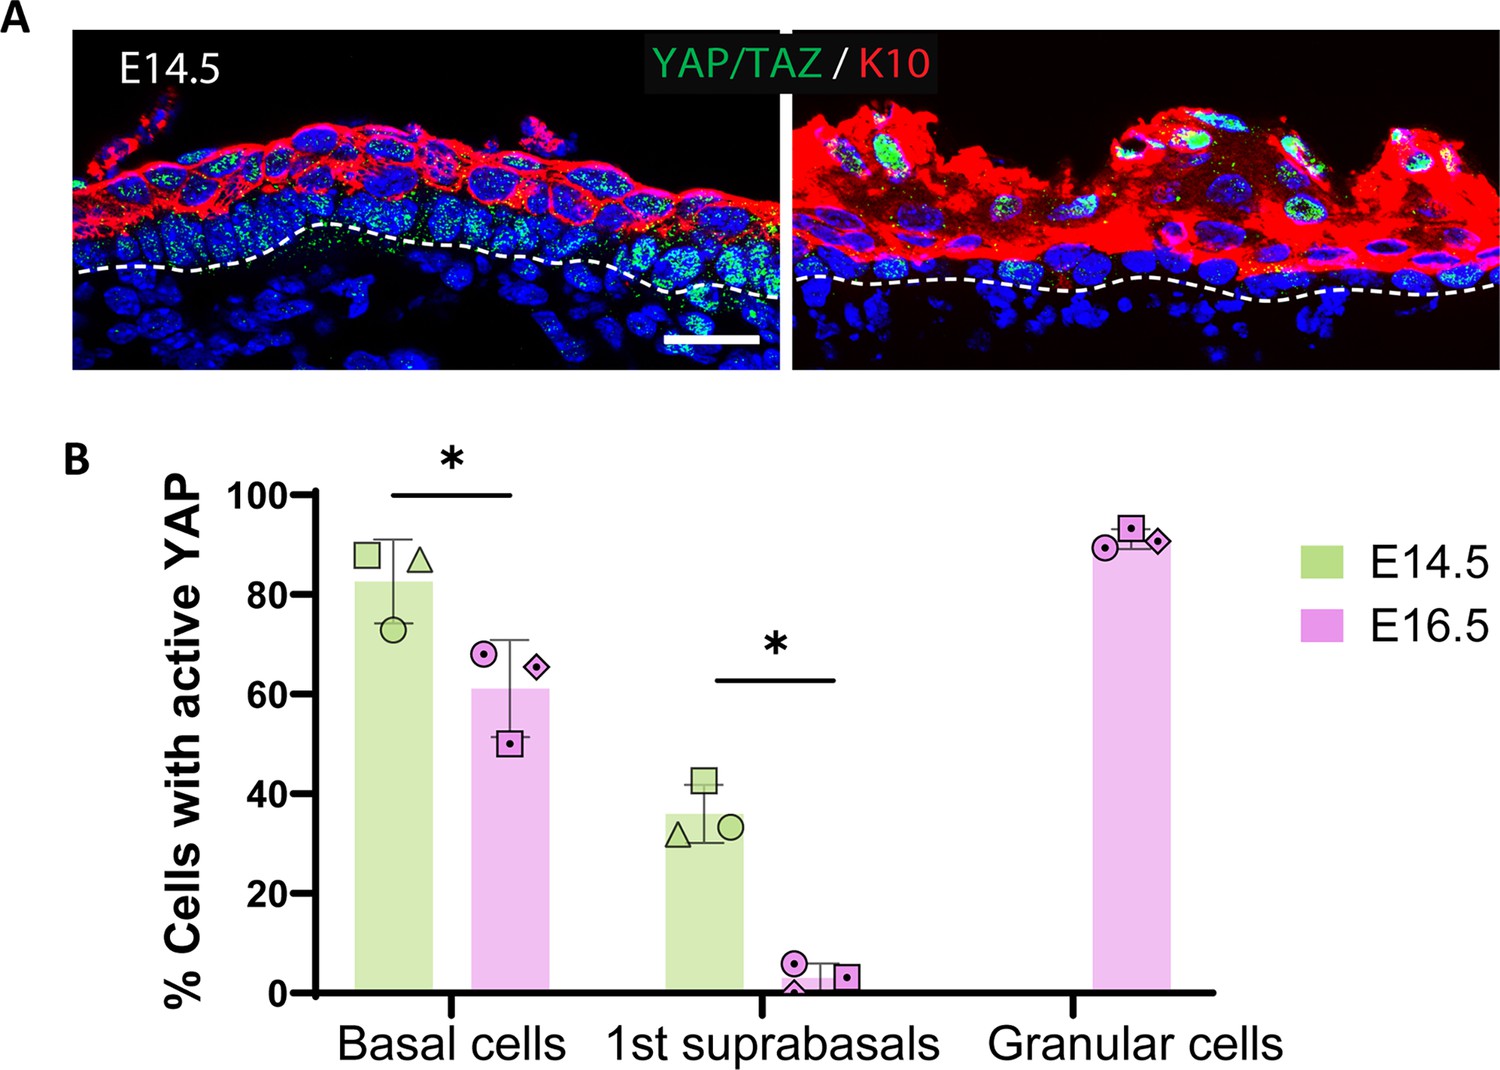
Like granular cells, more intermediate cells have nuclear YAP than spinous cells.
(A) Immunofluorescence staining of YAP/TAZ at embryonic day (E) 14.5 and E16.5. Scale bars: 20 μm. (B) Percentage of nuclear active YAP in basal cells and in the first two suprabasal layers at E14.5 and E16.5. Active YAP was also quantified in granular cells at E16.5. Different shapes represent different embryos. *: p<0.05, multiple unpaired t-test, Holm-Sidak’s multiple comparison test. n=3 embryos/time point.
Figure 6—figure supplement 2
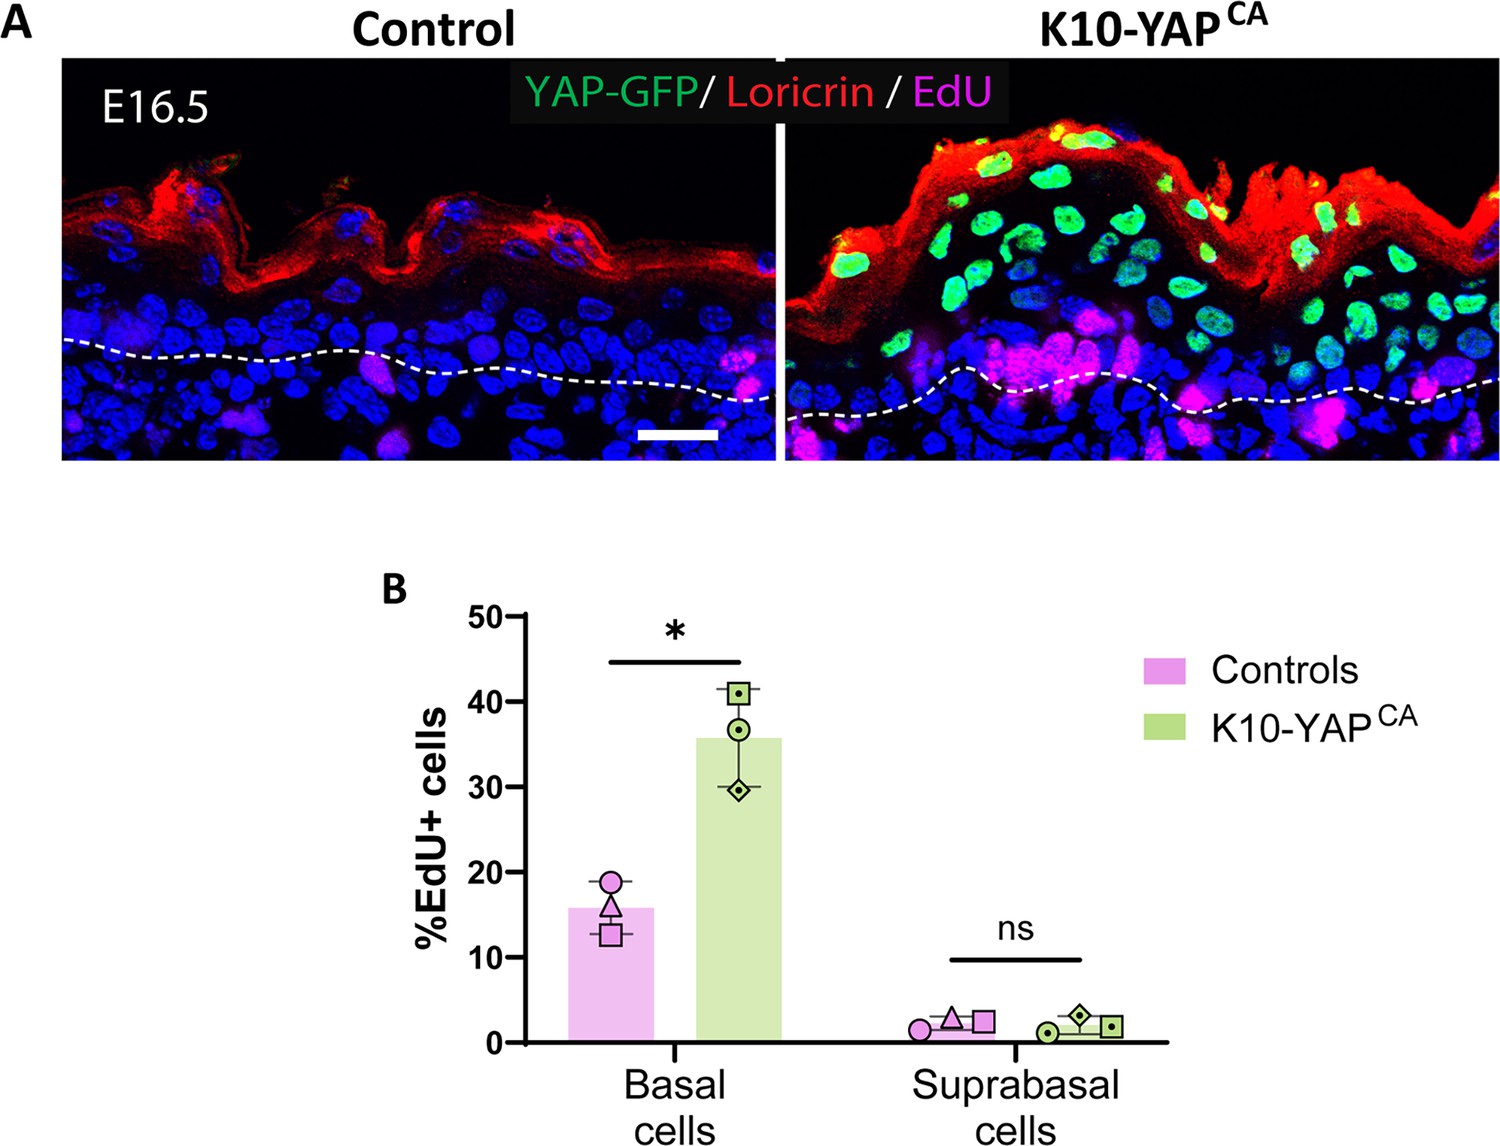
Inducing constitutively active YAP in spinous cells does not increase their proliferation.
(A) Image of EdU staining in magenta and immunofluorescence of Loricrin in red from control and K10-YAPCA embryos at embryonic day (E) 16.5. Cells expressing constitutively active nuclear YAP are labeled with H2B-GFP in green. Mice were fed with doxycycline from E13.5. Scale bars: 20 μm. (B) Percentage of dividing cells in control vs K10-YAPCA. n=3 embryos/genotype. For all plots in this panel, cells located in the first two layers of suprabasal cells immediately above the basal layer were considered for quantification. Different shapes represent different mice. *: p<0.05, ns: not significant, multiple unpaired t-test, Holm-Sidak’s multiple comparison test.
Figure 7 with 5 supplements
Increased contractility in spinous cells is sufficient to induce many granular genes.
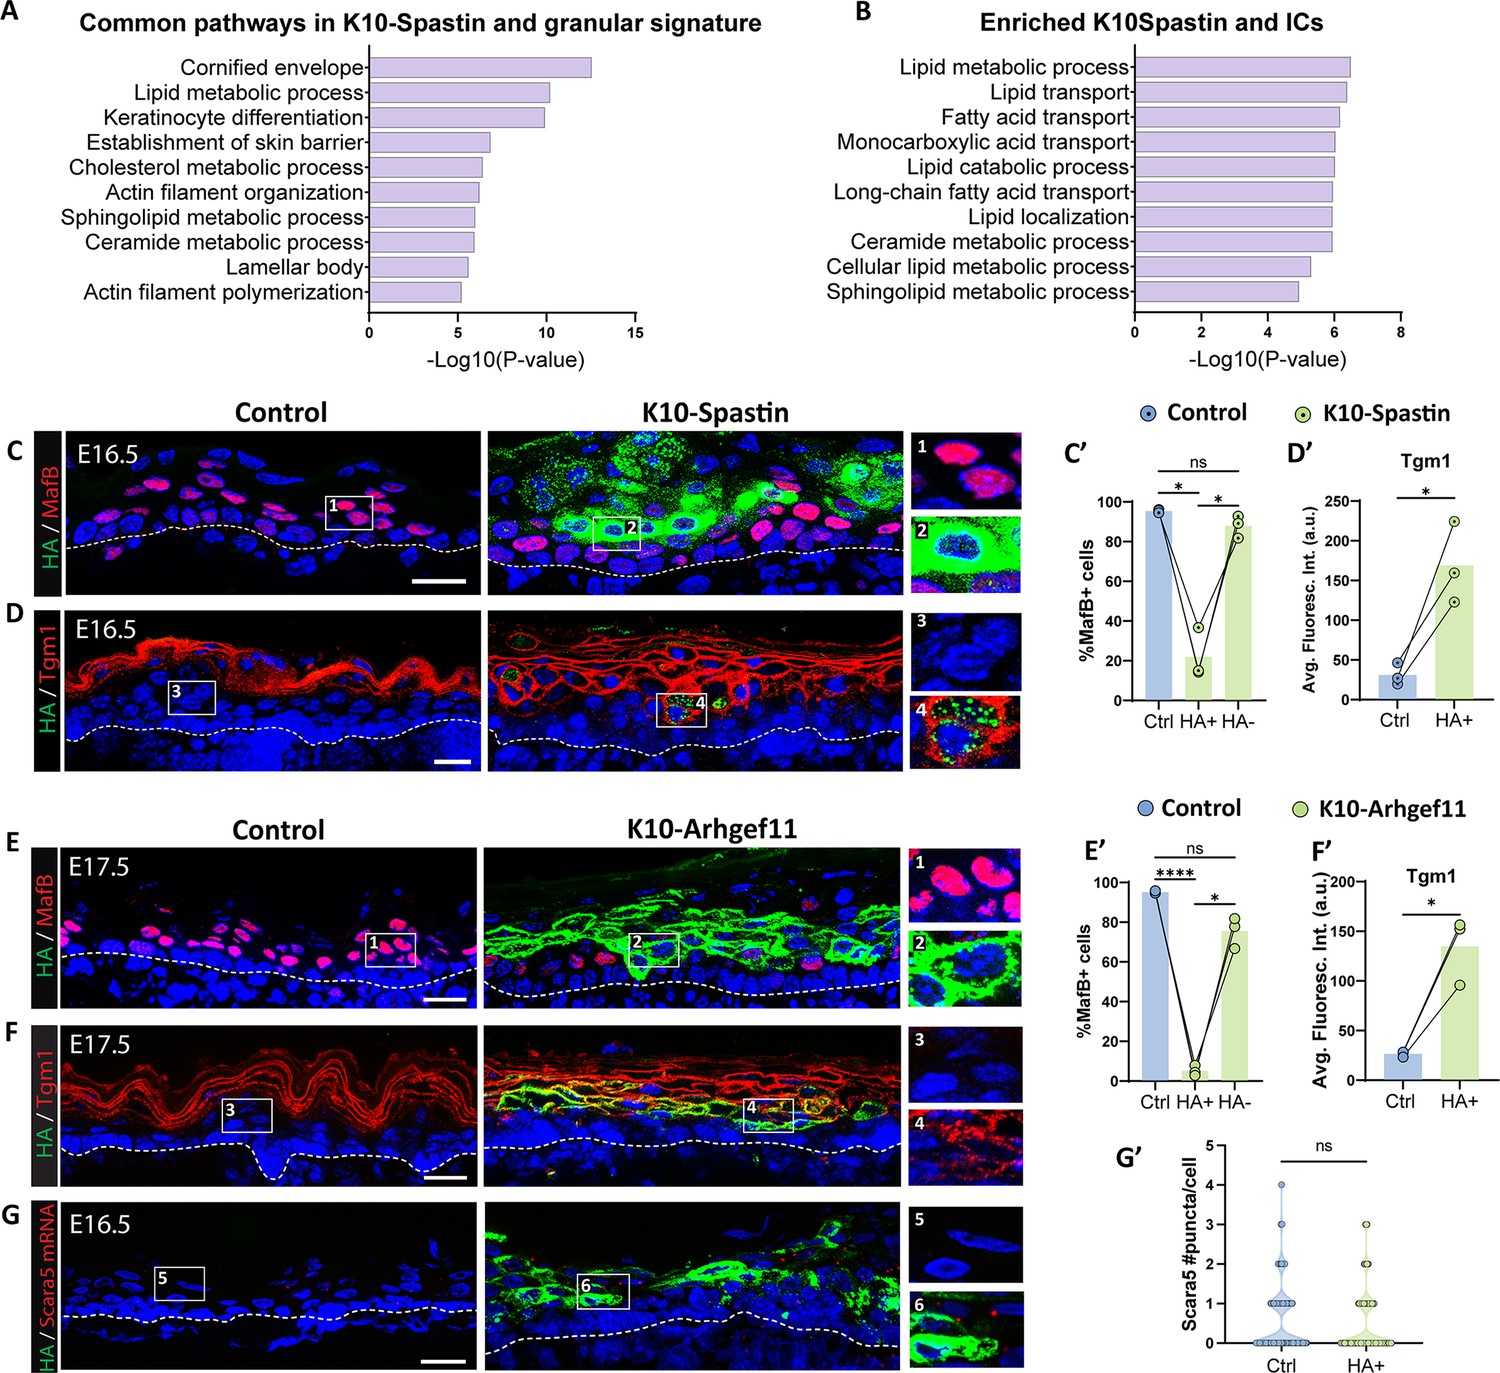
(A and B) Gene Ontology (GO) term analysis of the list of genes commonly upregulated in suprabasal K10-Spastin (vs control spinous cells at embryonic day [E] 16.5, log2 fold change > 1, p<0.05) and granular cell signature (A) or intermediate cell signature (B). (C and D) Immunofluorescence staining of MafB (C) or Tgm1 (D) in red, and suprabasal cells expressing Spastin marked by HA (green) in K10-Spastin and controls. Images of E16.5 embryos, doxycycline fed starting at E14.5. Insets to the left of all images in this panel show close-ups of HA+ cells in suprabasal layers adjacent to basal cells. Scale bars: 20 μm. (E and F) Immunofluorescence staining of MafB (F) or Tgm1 (H) in red, and suprabasal cells expressing Arhgef11CA marked by HA (green) in K10-Arhgef11 and controls. Images of E17.5 embryos, doxycycline fed from E10.5. Scale bars: 20 μm. (C’ and E’) Percentage of MafB+ suprabasal cells in controls, and in HA+ and HA- cells in K10-Spastin at E16.5 (C’) or K10-Arhgef11CA at E17.5 (E’). Total number of mice analyzed was three embryos per genotype. Data are presented as the mean ± SD. *: p<0.05, ****: p<0.0001, repeated-measures one-way ANOVA (p=0.0174 (C’) and p=0.0041 (E’)), Tukey’s multiple comparisons test. For all plots in this panel, cells located in the first two layers of suprabasal cells immediately above the basal layer were considered for quantification. (D’ and F’) Quantification of average fluorescence intensity of Tgm1 in suprabasal cells of control and HA+ cells in K10-Spastin at E16.5 (D’) or K10-Arhgef at E17.5 (F’). Total number of mice analyzed was three embryos per genotype. *: p<0.05, two-tailed paired t-test. (G) RNAscope of Scara5 in red and immunostaining with HA in green in control and K10-Arhgef11. Images of E16.5 embryos, doxycycline fed starting at E14.5. Scale bars: 20 μm. (G’) Violin plot of number of Scara5 puncta per suprabasal cell in control, and HA+ cells and neighbor HA- cells in K10-Spastin at E16.5. n=224 HA+ cells and 160 WT cells from two embryos per genotype. ns: not significant, Mann-Whitney test.
Figure 7—figure supplement 1
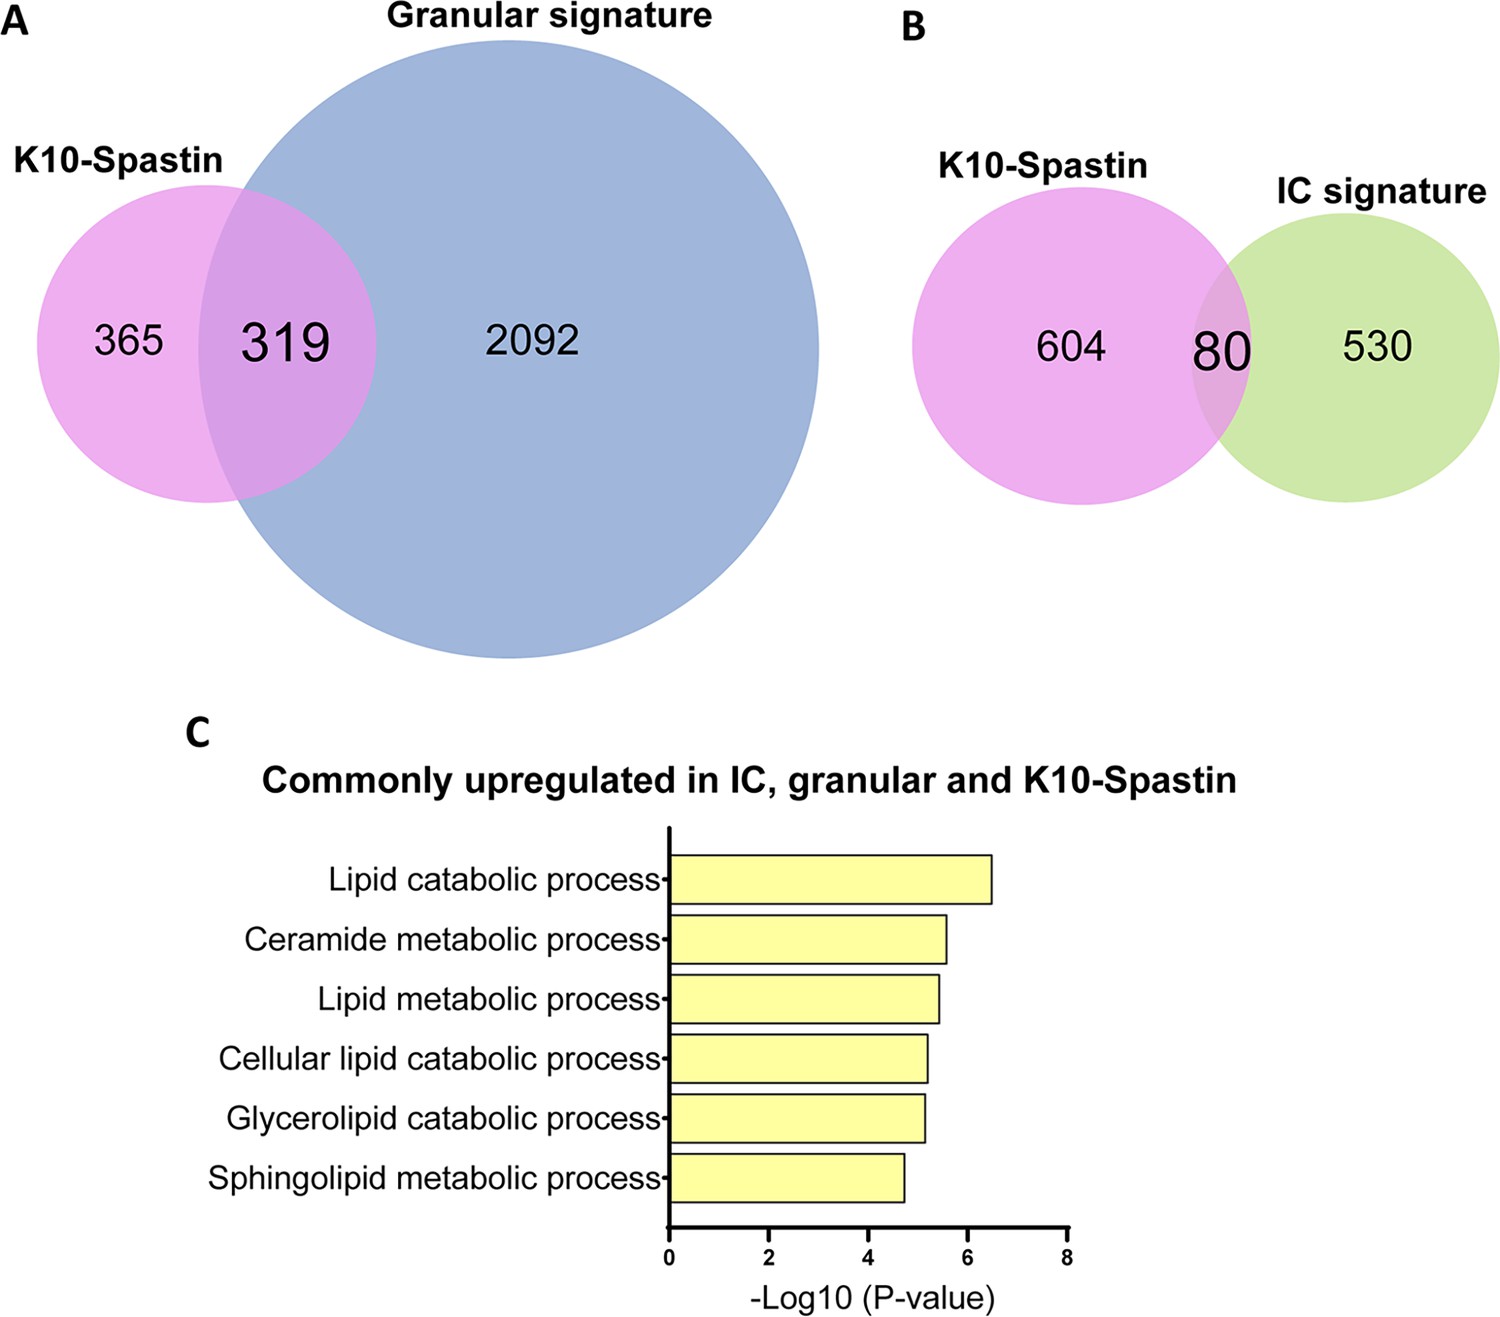
K10-Spastin cells are more granular-like than intermediate-like, and lipid metabolic processes are commonly upregulated among K10-Spastin, intermediate cells (ICs), and granular cells.
(A and B) Size-proportional Venn diagrams show that K10-Spastin cells are more granular-like (A: 46.6% similarity) than intermediate-like (B: 11.7% similarity). Pink: genes enriched in K10-Spastin vs WT embryos at E16.5; green: genes in IC signature, blue: genes in granular signature. (C) Gene Ontology (GO) term analysis of genes commonly upregulated in ICs, granular cells, and K10-Spastin (total: 50 genes) reveals lipid metabolic processes.
Figure 7—figure supplement 2
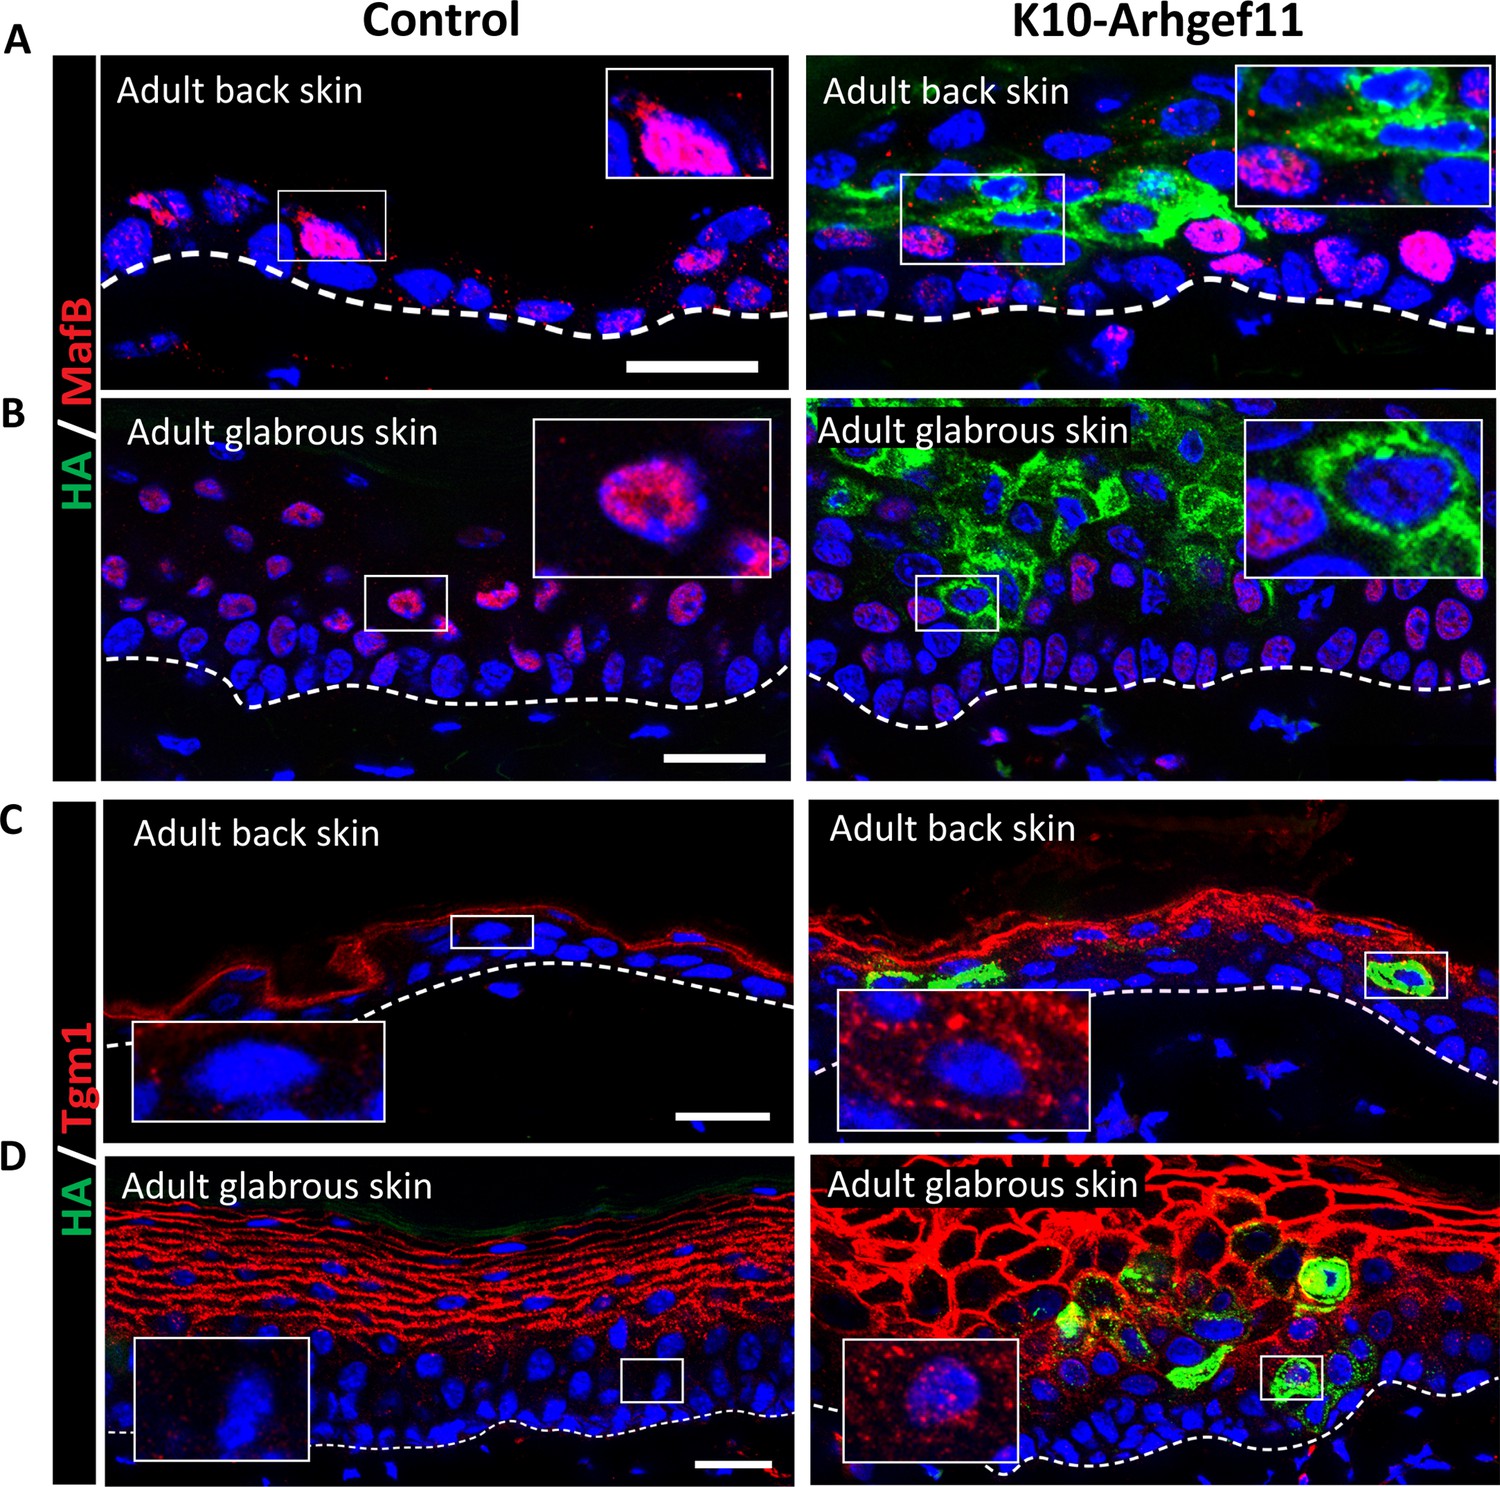
Increased contractility in spinous cells of adult epidermis induces some granular markers in adult epidermis.
(A and B) Immunofluorescence staining of MafB in back skin (A) or glabrous skin (B) in red, and suprabasal cells expressing Arhgef11CA marked by HA (green) in adult K10-Arhgef11 and controls. Mice were fed with doxycycline since adulthood. Insets show close-ups of HA+ cells in suprabasal layers adjacent to basal cells. Scale bars: 20 μm. (C and D) Immunofluorescence staining of Tgm1 in back skin (C) or glabrous skin (D) in red, and suprabasal cells expressing Arhgef11CA marked by HA (green) in adult K10-Arhgef11 and controls. Insets show close-ups of HA+ cells in suprabasal layers adjacent to basal cells. Mice were fed with doxycycline since adulthood. Scale bars: 20 μm.
Figure 7—figure supplement 3
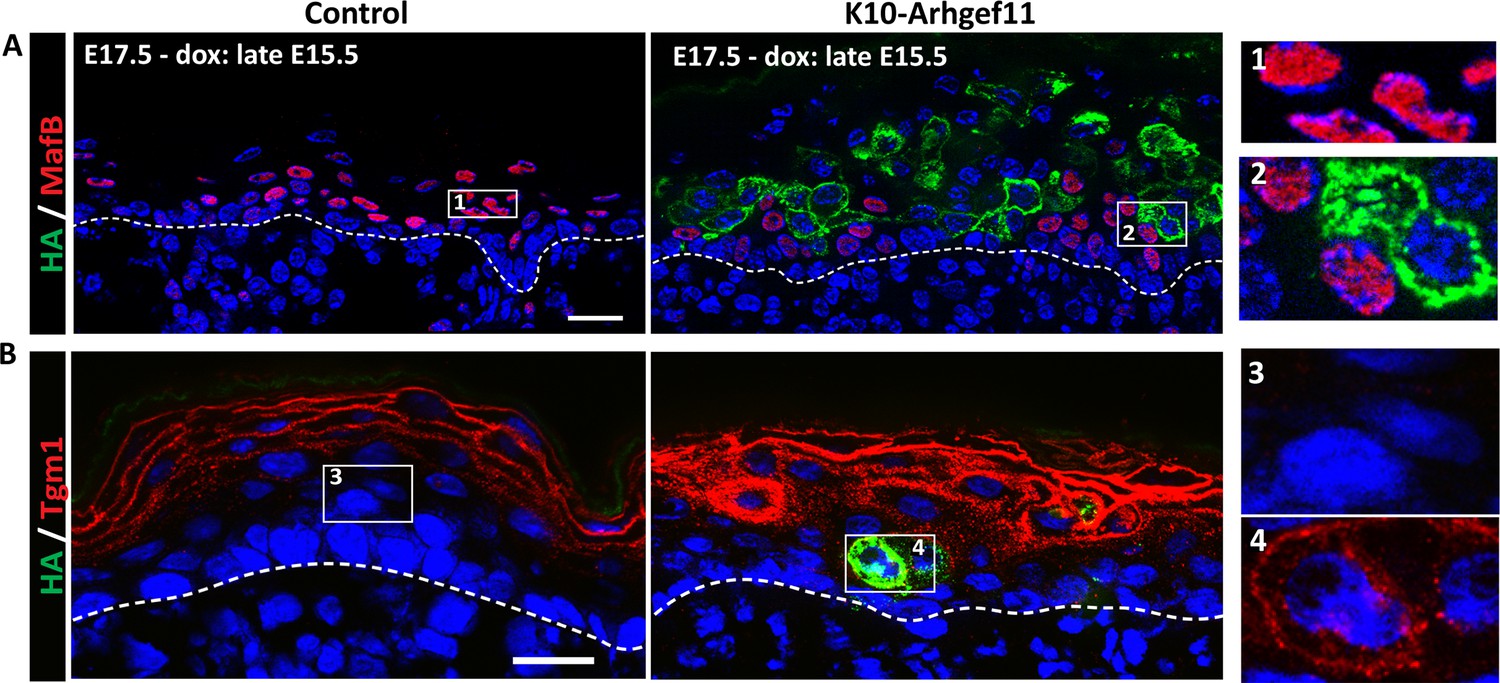
Increased contractility in spinous cells accelerates acquisition of granular markers.
(A and B) Immunofluorescence staining of MafB (A) or Tgm1 (B) in red, and suprabasal cells expressing Arhgef11CA marked by HA (green) in adult K10-Arhgef11 and controls. Images from embryonic day (E) 17.5 embryos, fed with doxycycline starting at E15.5. Insets show close-ups of HA+ cells in suprabasal layers adjacent to basal cells. Scale bars: 20 μm.
Figure 7—figure supplement 4
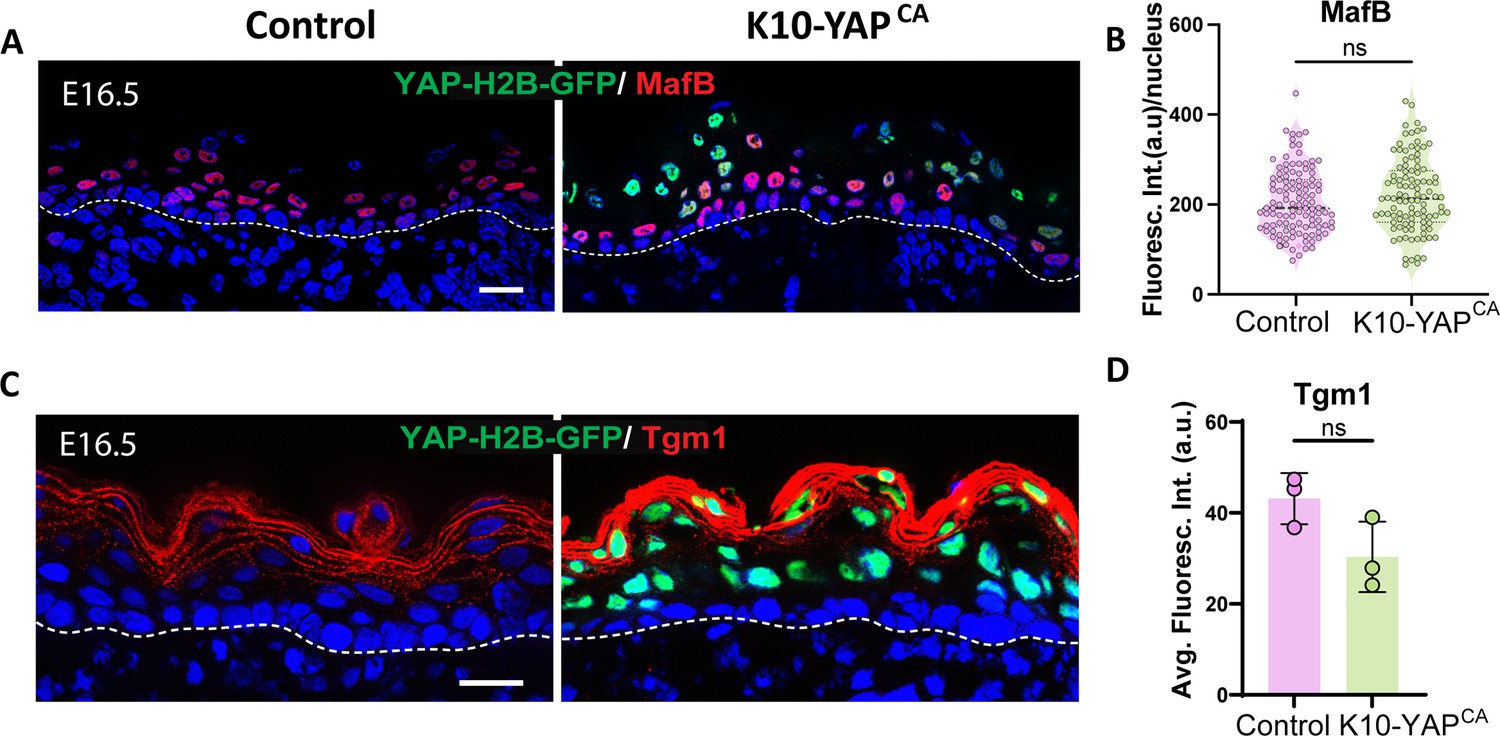
Inducing constitutively active YAP in spinous cells does not induce granular markers.
(A and C) Immunofluorescence of MafB (A) or Tgm1 (C) in red, active YAP in green (YAP-H2B-GFP) in control, and K10-YAPCA at embryonic day (E) 16.5. Scale bars: 20 μm. (B) Average MafB fluorescence intensity per cell in control and K10-YAPCA. n=113 suprabasal cells from three control embryos and 103 from three K10-YAPCA embryos. ns: not significant, Mann-Whitney test. (D) Average fluorescence intensity of suprabasal cells, area above basal cells, in control and K10-YAPCA embryos at E16.5 was measured. n=3 embryos/genotype. ns: not significant, two-tailed unpaired t-test.
Figure 7—figure supplement 5
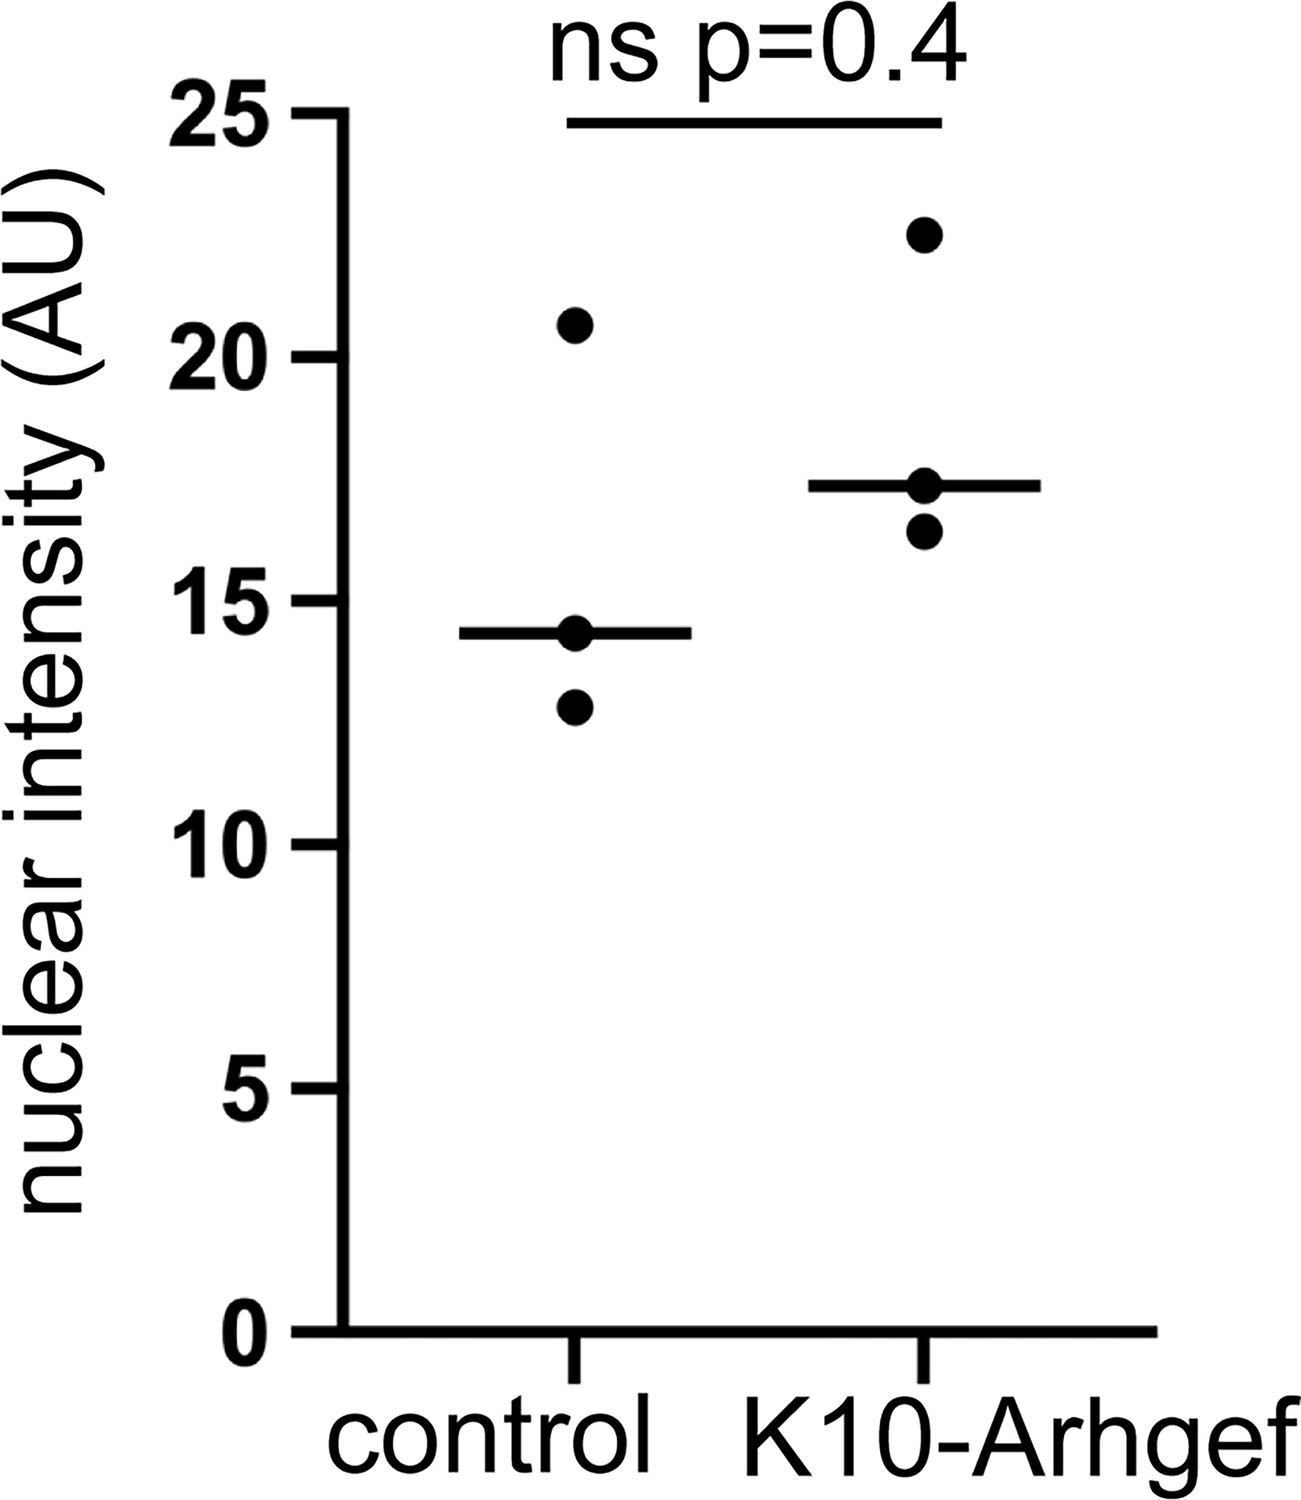
Increased contractility does not alter H3K27me3 levels.
Quantifications of nuclear H3K27me3 levels in control spinous and K10-Arhgef-expressing spinous cells.
Additional files
-
Supplementary file 1
Table of gene signatures.
- https://cdn.elifesciences.org/articles/100961/elife-100961-supp1-v1.xlsx
-
Supplementary file 2
Epidermal differentiation complex gene expression levels.
- https://cdn.elifesciences.org/articles/100961/elife-100961-supp2-v1.xlsx
Download links
A two-part list of links to download the article, or parts of the article, in various formats.
Downloads (link to download the article as PDF)
Open citations (links to open the citations from this article in various online reference manager services)
Cite this article (links to download the citations from this article in formats compatible with various reference manager tools)
Molecular and mechanical signatures contributing to mouse epidermal differentiation and barrier formation
eLife 13:RP100961.
https://doi.org/10.7554/eLife.100961.3


