APP β-CTF triggers cell-autonomous synaptic toxicity independent of Aβ
- Interdisciplinary Research Center on Biology and Chemistry, Shanghai Institute of Organic Chemistry, Chinese Academy of Sciences, China
- University of Chinese Academy of Sciences, China
Figures
Figure 1 with 1 supplement
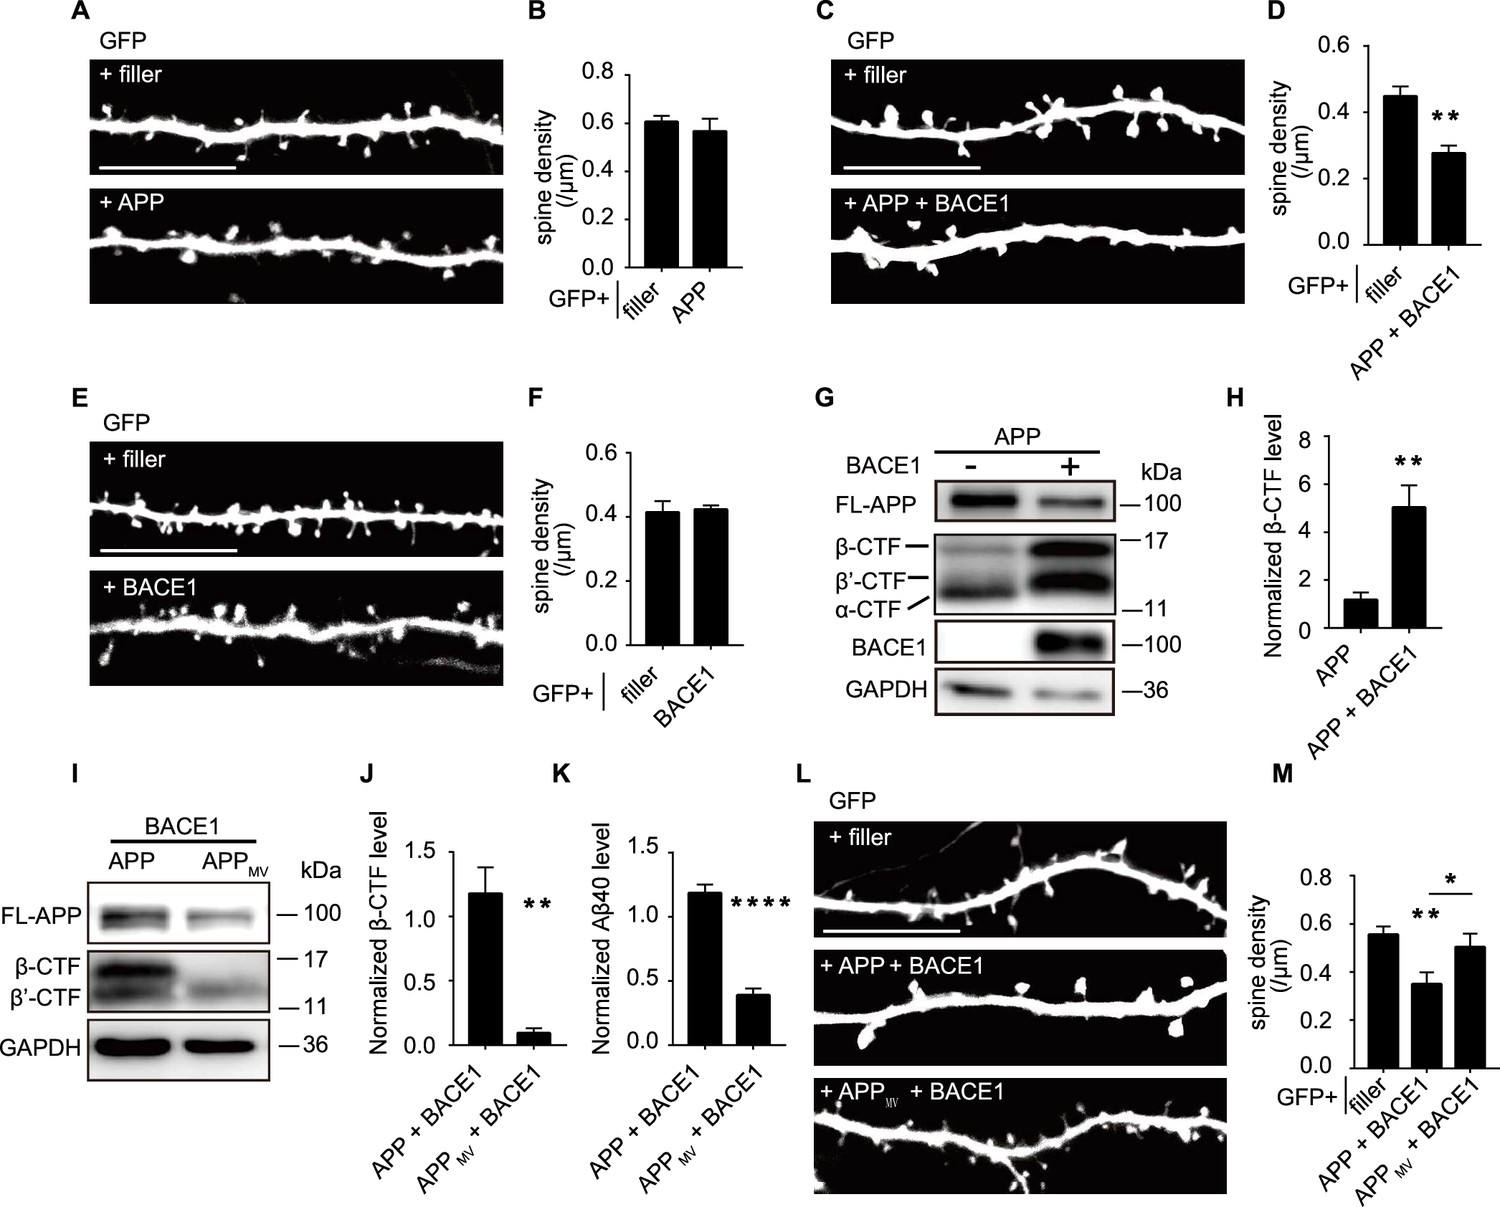
APP only led to spine loss when co-expressed with BACE1.
(A, B) Representative images and spine density of basal dendrites from CA1 pyramidal neurons transiently expressing GFP alone or together with APP. filler, n=21; APP, n=16. (C, D) Representative images and spine density of basal dendrites from CA1 pyramidal neurons transiently expressing GFP alone or together with APP and BACE1 with a ratio of 15:1. filler, n=8; APP plus BACE1, n=5. (E, F) Representative images and spine density of basal dendrites from CA1 pyramidal neurons transiently expressing GFP alone or together with BACE1. filler, n=15; BACE1, n=15. (G) Western blot and corresponding statistical analysis of APP (Y188), BACE1, and GAPDH from HEK293T cells expressing APP or APP plus BACE1 with a ratio of 15:1. GAPDH was measured as a loading control. (H) Measurement of APP β-CTF (β C-terminal fragment) level from HEK293T cells expressing APP alone or APP and BACE1 with a ratio of 15:1. n=4. (I) Western blot and corresponding statistical analysis of APP fragments (Y188) from HEK293T cells expressing APP plus BACE1 or APPMV plus BACE1. (J) Measurement of APP β-CTF levels from HEK293T cells expressing APP plus BACE1 or APPMV plus BACE1. n=4. (K) Measurement of Aβ40 levels from HEK293T cells expressing APP plus BACE1 or APPMV plus BACE1. n=4. (L, M) Representative images and spine density of basal dendrites from CA1 pyramidal neurons transiently expressing GFP alone or together with APP and BACE1 or APPMV and BACE1. filler, n=12; APP plus BACE1, n=14; APPMV plus BACE1, n=10. All dendritic images were acquired from rat organotypic hippocampal slice cultures after transfection for 6–7 days. Statistics: one-way ANOVA or Student’s t-test. *p<0.05, **p<0.01, ***p<0.001, ****p<0.0001. Error bars show SEM. Scale bars, 10 μm.
-
Figure 1—source data 1
Original files for western blots shown in Figure 1.
- https://cdn.elifesciences.org/articles/100968/elife-100968-fig1-data1-v2.zip
-
Figure 1—source data 2
Original files for western blots shown in Figure 1, indicating relevant bands.
- https://cdn.elifesciences.org/articles/100968/elife-100968-fig1-data2-v2.zip
-
Figure 1—source data 3
Excel file containing numeric values for Figure 1.
- https://cdn.elifesciences.org/articles/100968/elife-100968-fig1-data3-v2.xlsx
Figure 1—figure supplement 1
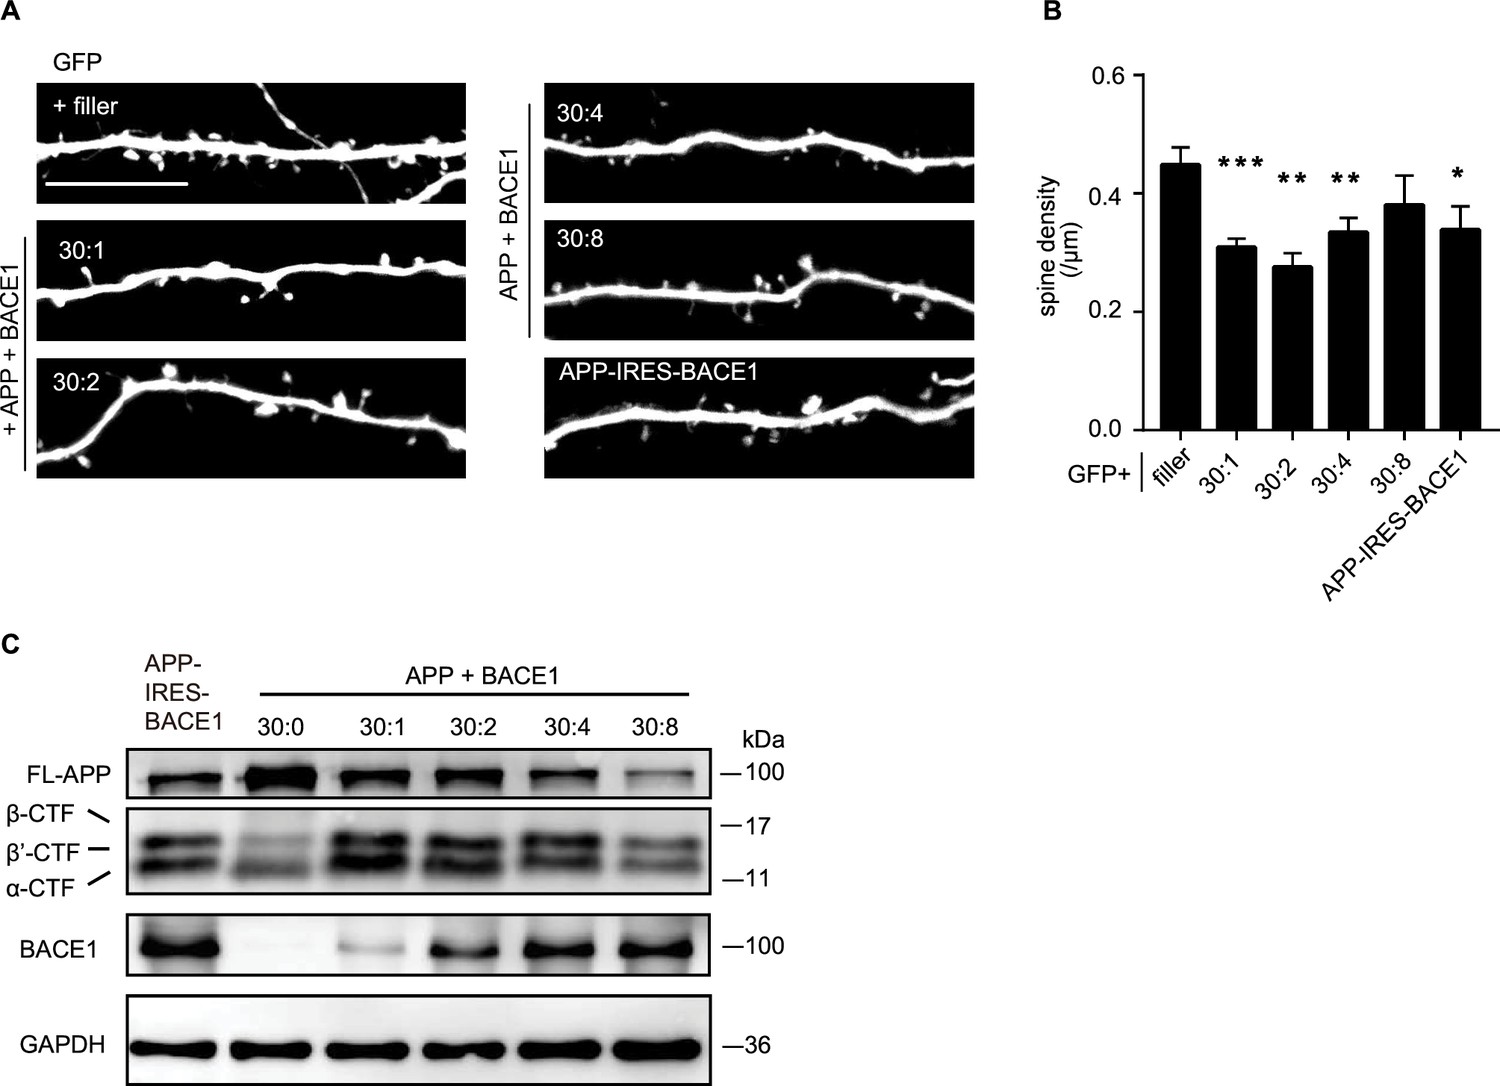
Different APP and BACE1 expression ratios impacted spine density differently.
(A, B) Representative images and measurements of the spine density from CA1 pyramidal neurons transiently expressing GFP or together with APP and BACE1 at different molecular ratios for 6–7 days in rat organotypic hippocampal slice cultures. filler, n=8; 30:1, n=12; 30:2, n=5; 30:4, n=9; 30:8, n=6; APP-IRES-BACE1, n=9. (C) Western blot of APP fragments (Y188) and BACE1 from HEK293T cells expressing APP and BACE1 at different ratios or APP-IRES-BACE1. Scale bar, 10 μm. Statistics: one-way ANOVA. *p<0.05, **p<0.01, ***p<0.001, ****p<0.0001. Error bars show SEM.
-
Figure 1—figure supplement 1—source data 1
Original files for western blots shown in Figure 1—figure supplement 1.
- https://cdn.elifesciences.org/articles/100968/elife-100968-fig1-figsupp1-data1-v2.zip
-
Figure 1—figure supplement 1—source data 2
Original files for western blots shown in Figure 1—figure supplement 1, indicating relevant bands.
- https://cdn.elifesciences.org/articles/100968/elife-100968-fig1-figsupp1-data2-v2.zip
-
Figure 1—figure supplement 1—source data 3
Excel file containing numeric values for Figure 1—figure supplement 1.
- https://cdn.elifesciences.org/articles/100968/elife-100968-fig1-figsupp1-data3-v2.xlsx
Figure 2 with 1 supplement
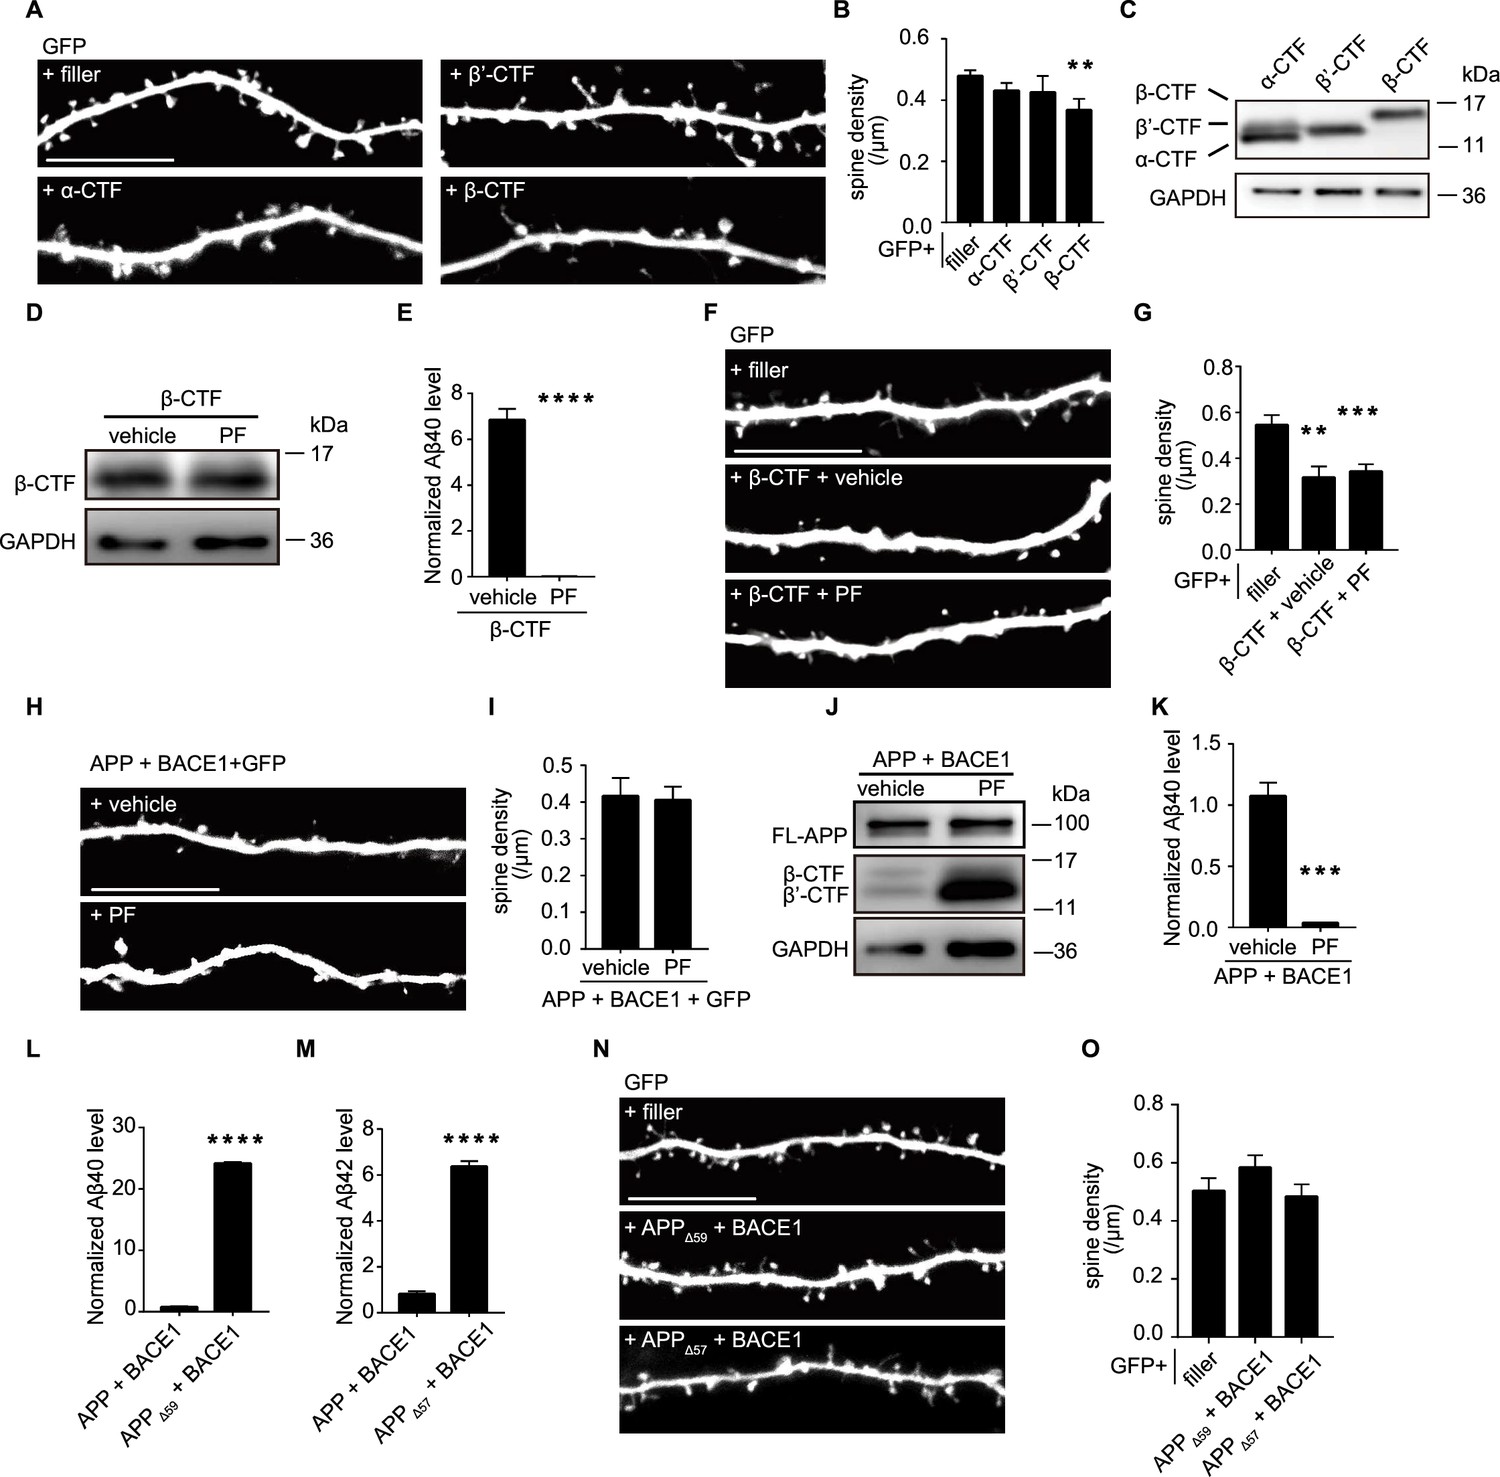
β-CTF induced spine loss independent of Aβ.
(A, B) Representative images and spine density of basal dendrites from CA1 pyramidal neurons transiently expressing GFP alone or together with α-CTF, β’-CTF, or β-CTF. filler, n=19; α-CTF, n=7; β’-CTF, n=8; β-CTF, n=7. (C) Western blot of APP fragments from HEK293T cells expressing α-CTF-flag, β’-CTF-flag, and β-CTF-flag (flag antibody). (D) Western blot of APP fragments from HEK293T cells expressing β-CTF-flag treatment with vehicle or PF (flag antibody). (E) Measurement of Aβ40 secreted from HEK293T cells expressing β-CTF treatment with vehicle or PF. n=4. (F, G) Representative images and spine density of basal dendrites from CA1 pyramidal neurons transiently expressing GFP alone or together with β-CTF after treated with vehicle or PF. filler, n=11; β-CTF, n=7, β-CTF plus PF, n=14. (H, I) Representative images and spine density of basal dendrites from CA1 pyramidal neurons transiently expressing GFP together with APP and BACE1 after treated with vehicle or PF. APP plus BACE1 with vehicle, n=9; APP plus BACE1 with PF, n=14. (J) Western blot of APP fragments (Y188) from HEK293T cells co-expressing APP and BACE1 after treated with vehicle or PF. (K) Measurements of Aβ40 from HEK 293T cells expressing APP and BACE1 after treated with vehicle or PF. n=4. (L) Measurements of Aβ40 from HEK293T cells expressing APP and BACE1 or APPΔ59 and BACE1. n=4. (M) Measurements of Aβ42 from HEK293T cells expressing APP and BACE1 or APPΔ57 and BACE1. n=4. (N, O) Representative images and spine density of basal dendrites from CA1 pyramidal neurons transiently expressing GFP alone or together with APPΔ59/Δ57 and BACE1. filler, n=9; APPΔ59 and BACE1, n=7; APPΔ57 and BACE1, n=6. All dendritic images were acquired from rat organotypic hippocampal slice cultures after transfection for 6–7 days. PF, PF03084014, a γ secretase inhibitor. Statistics: one-way ANOVA or Student’s t-test. *p<0.05, **p<0.01, ***p<0.001, ****p<0.0001. Error bars show SEM. Scale bars, 10 μm.
-
Figure 2—source data 1
Original files for western blots shown in Figure 2.
- https://cdn.elifesciences.org/articles/100968/elife-100968-fig2-data1-v2.zip
-
Figure 2—source data 2
Original files for western blots shown in Figure 2, indicating relevant bands.
- https://cdn.elifesciences.org/articles/100968/elife-100968-fig2-data2-v2.zip
-
Figure 2—source data 3
Excel file containing numeric values for Figure 2.
- https://cdn.elifesciences.org/articles/100968/elife-100968-fig2-data3-v2.xlsx
Figure 2—figure supplement 1
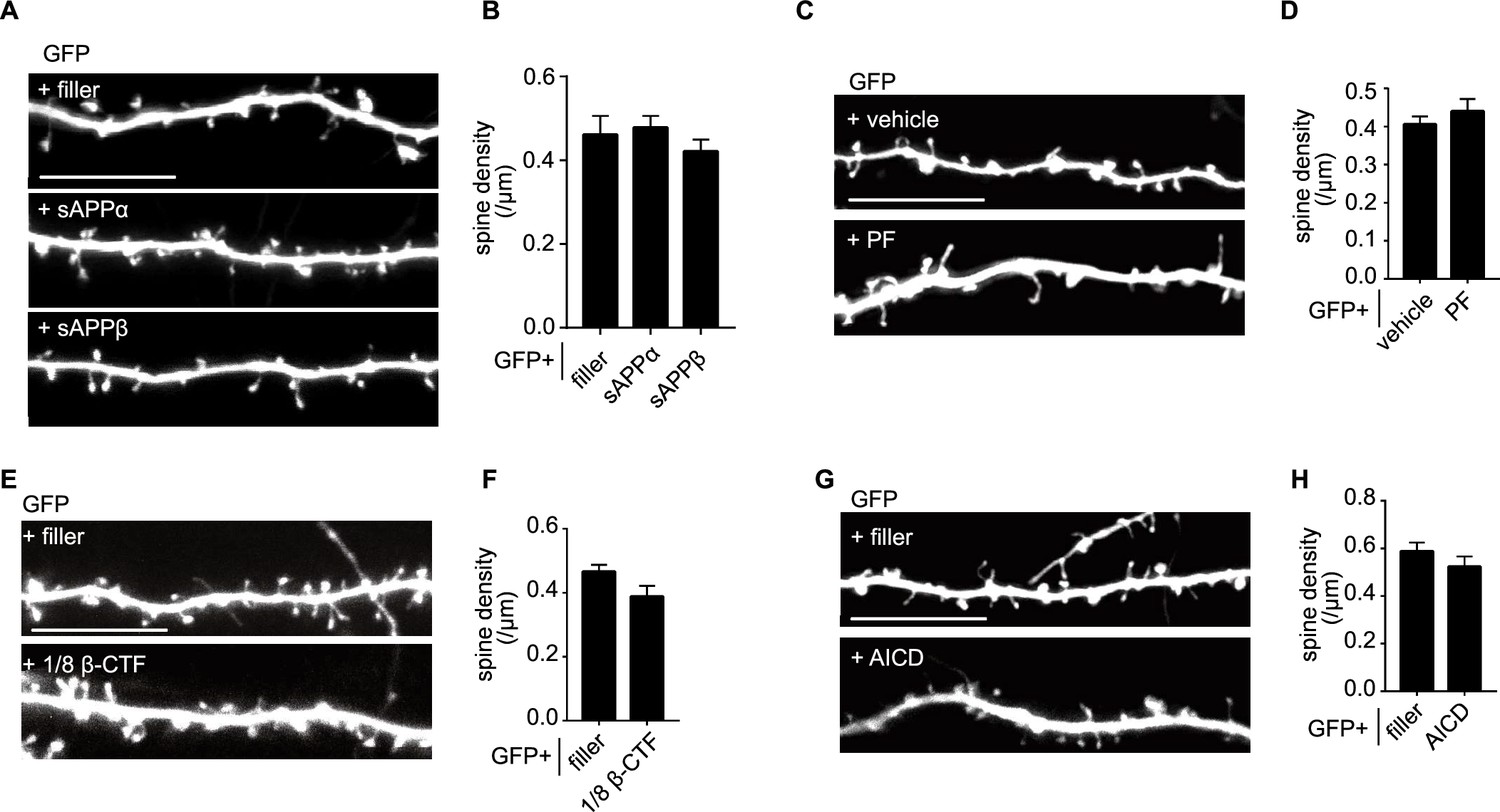
sAPP or APP intracellular domain (AICD) expression and γ-secretase inhibition did not affect dendritic spines.
(A, B) Representative images and spine density of basal dendrites from CA1 pyramidal neurons transiently expressing GFP alone or together with sAPPα or sAPPβ. filler, n=10; sAPPα, n=13; sAPPβ, n=19. (C, D) Representative images and spine density of basal dendrites from CA1 pyramidal neurons transiently expressing GFP treatment with vehicle or PF. vehicle, n=13; PF, n=9. (E, F) Representative images and spine density of basal dendrites from CA1 pyramidal neurons transiently expressing GFP alone or together with β-CTF (1/8 of the original plasmid amount). filler, n=10; 1/8 β-CTF, n=11. (G, H) Representative images and spine density of basal dendrites from CA1 pyramidal neurons transiently expressing GFP alone or together with AICD. filler, n=6; AICD, n=10. All dendritic images were acquired from rat organotypic hippocampal slice cultures after transfection for 6–7 days. PF, PF03084014, a γ secretase inhibitor. Statistics: one-way ANOVA or Student’s t-test. *p<0.05, **p<0.01, ***p<0.001, ****p<0.0001. Error bars show SEM. Scale bars, 10 μm.
-
Figure 2—figure supplement 1—source data 1
Excel file containing numeric values for Figure 2—figure supplement 1.
- https://cdn.elifesciences.org/articles/100968/elife-100968-fig2-figsupp1-data1-v2.xlsx
Figure 3
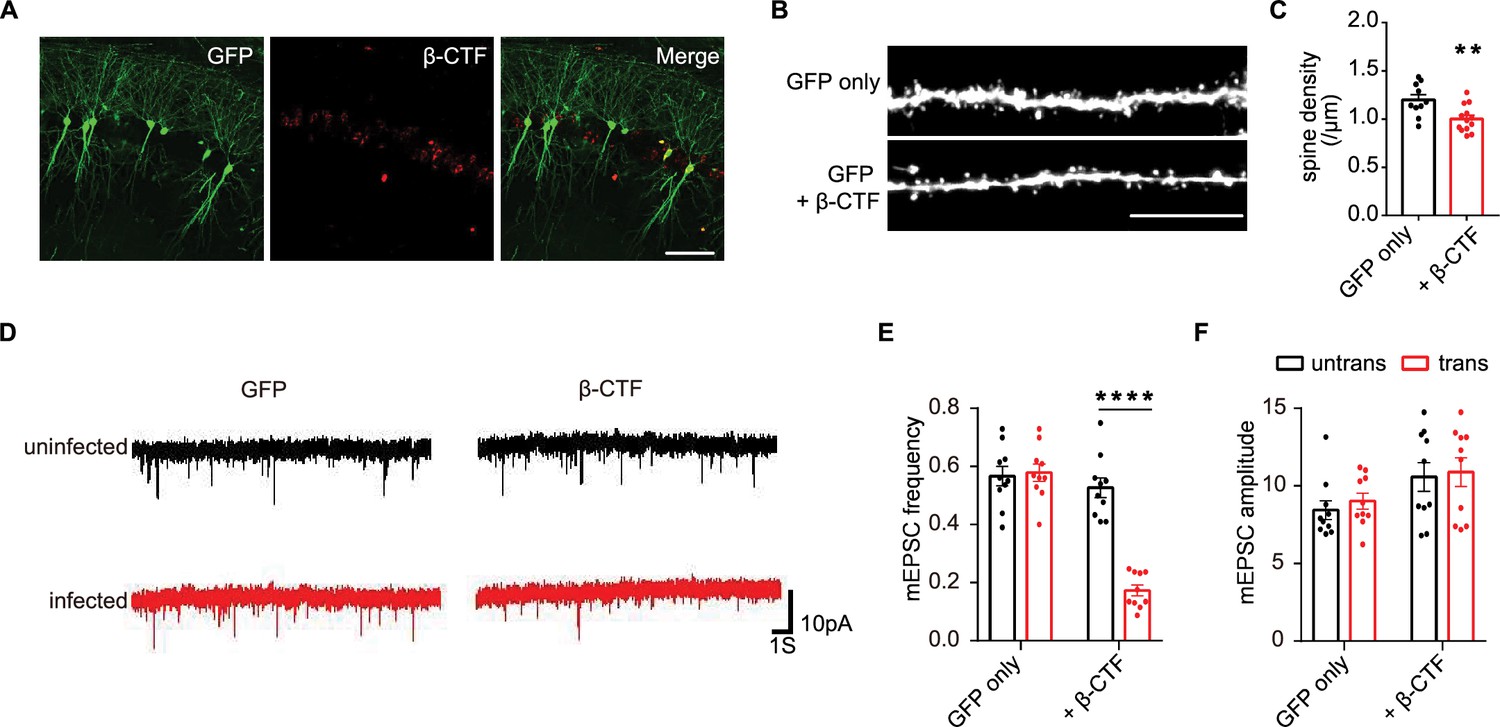
Expression of β-CTF damaged synapses in mouse brains.
(A) Representative images of adult mouse CA1 pyramidal neurons infected with lentivirus expressing GFP and β-CTF. Scale bar, 100 μm. (B, C) Representative images from basal dendrites and quantitation of their spine density in CA1 pyramidal neurons infected with lentivirus expressing GFP alone or GFP with β-CTF in mouse hippocampi. Scale bar, 10 μm. GFP only, n=10; GFP plus β-CTF, n=13. (D–F) Representative recording traces and quantitations of miniature excitatory postsynaptic currents (mEPSCs) from adult mouse hippocampal neurons infected with lentivirus (identified with GFP signal) and neighboring uninfected neurons. n=10. Statistics: two-way ANOVA or Student’s t-test. *p<0.05, **p<0.01, ***p<0.001, ****p<0.0001. Error bars show SEM.
-
Figure 3—source data 1
Excel file containing numeric values for Figure 3.
- https://cdn.elifesciences.org/articles/100968/elife-100968-fig3-data1-v2.xlsx
Figure 4 with 1 supplement
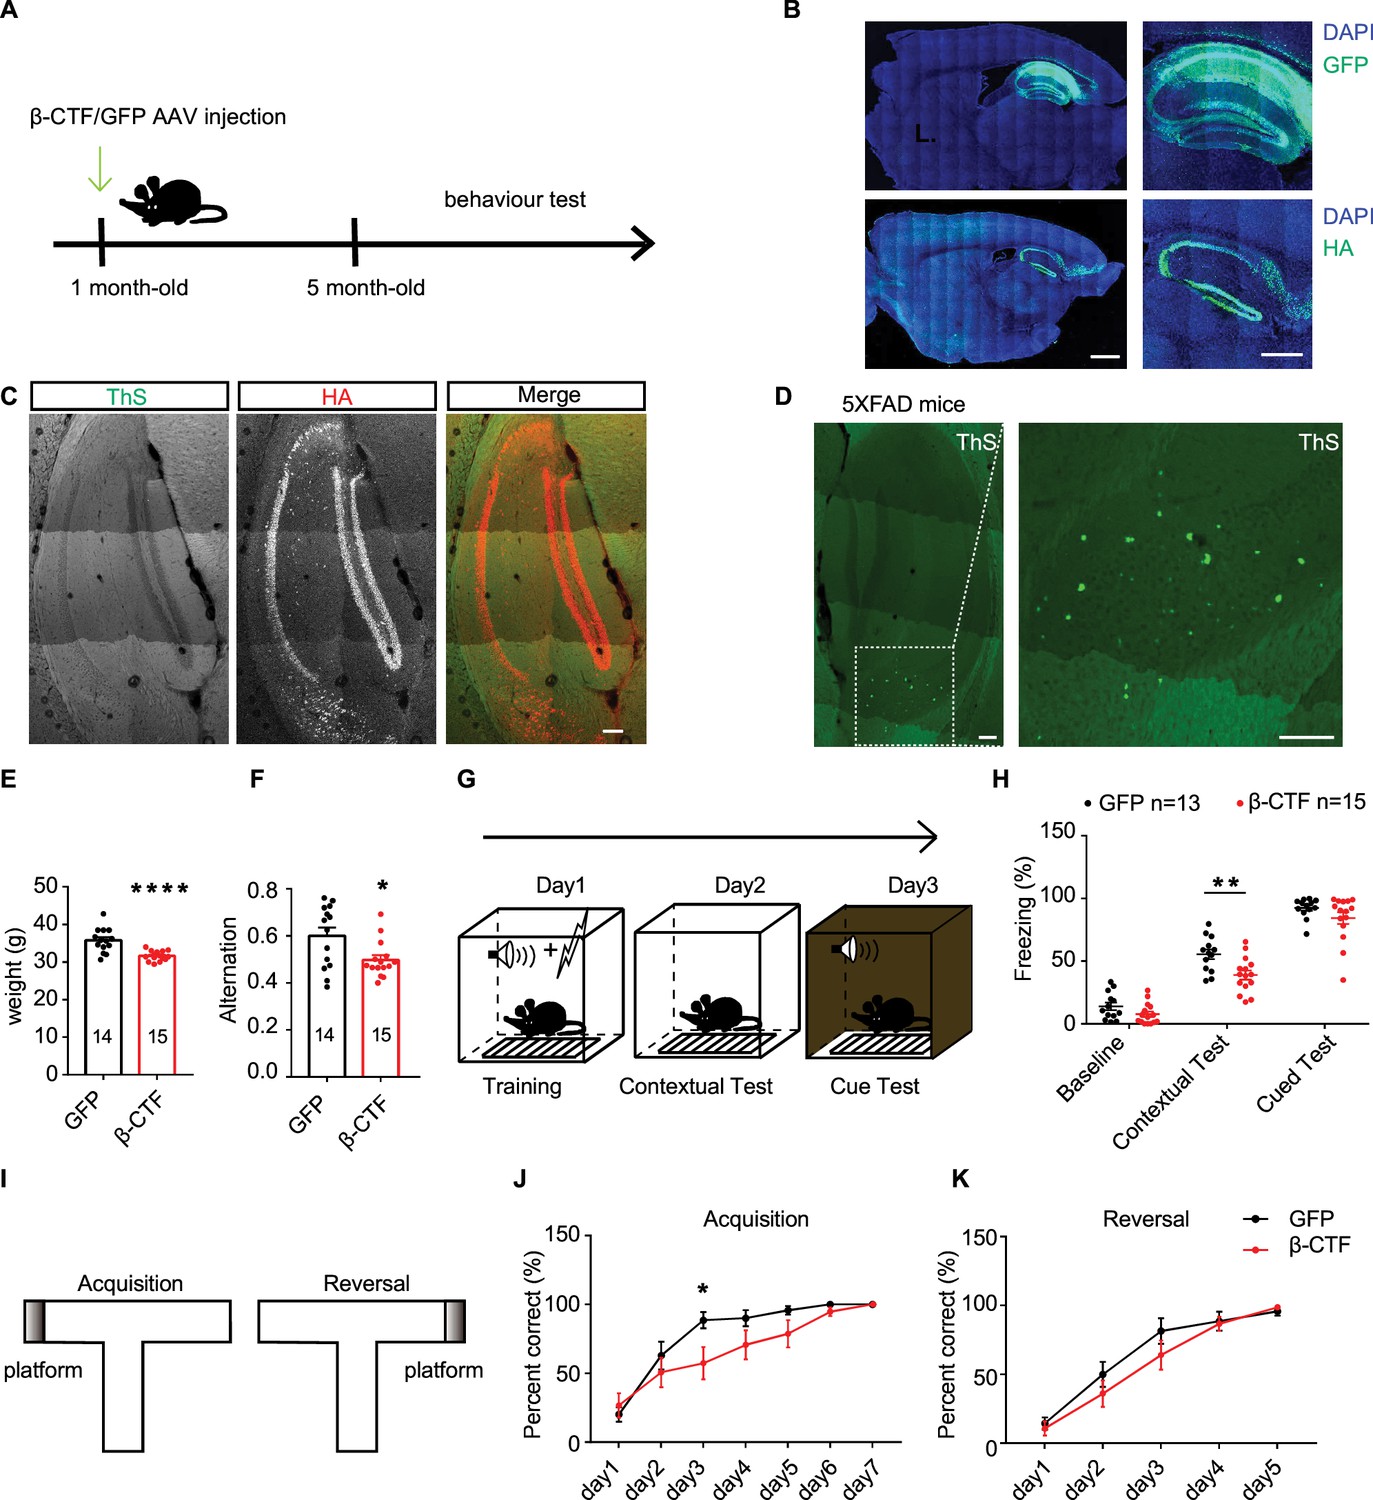
Expression of β-CTF damaged cognitive function in mice in the absence of plaque formation.
(A) Schematic diagram showing the time line for stereotactic injection of adeno-associated viruses (AAV), behavioral training, and tests. (B) Representative images showing immunofluorescence staining of expressed GFP or β-CTF-HA by AAV in mouse hippocampi (WT). Scare bars represent 1000 μm (left) and 500 μm (right). (C) Images of mouse hippocampus (WT) stained with ThS and HA antibody after infected with AAV encoding β-CTF-HA. Scale bar, 100 µm. (D) Representative image of ThS staining of a 5XFAD mice hippocampal slice. Scale bar, 100 μm. (E) Weight of mice infected with AAV encoding GFP or β-CTF in their hippocampi. GFP, n=14; β-CTF, n=15. (F) Quantitations of spontaneous alternation in Y maze from mice infected with AAV encoding GFP or β-CTF. GFP, n=14; β-CTF, n=15. (G) Schematic diagram showing fear conditioning test design. (H) Quantitation of freezing in contextual and cued fear conditioning tests from mice infected with AAV encoding GFP and β-CTF in their hippocampi. GFP, n=13; β-CTF, n=15. (I) Schematic diagram showing water T maze test design. (J, K) The percentage of correct responses across the five trials of water T maze test was quantified in each day of acquisition (J) or reversal (K). GFP, n=14; β-CTF, n=15. Statistics: repeated measures two-way ANOVA or Student’s t-test. *p<0.05, **p<0.01, ***p<0.001, ****p<0.0001. Error bars show SEM.
-
Figure 4—source data 1
Excel file containing numeric values for Figure 4.
- https://cdn.elifesciences.org/articles/100968/elife-100968-fig4-data1-v2.xlsx
Figure 4—figure supplement 1
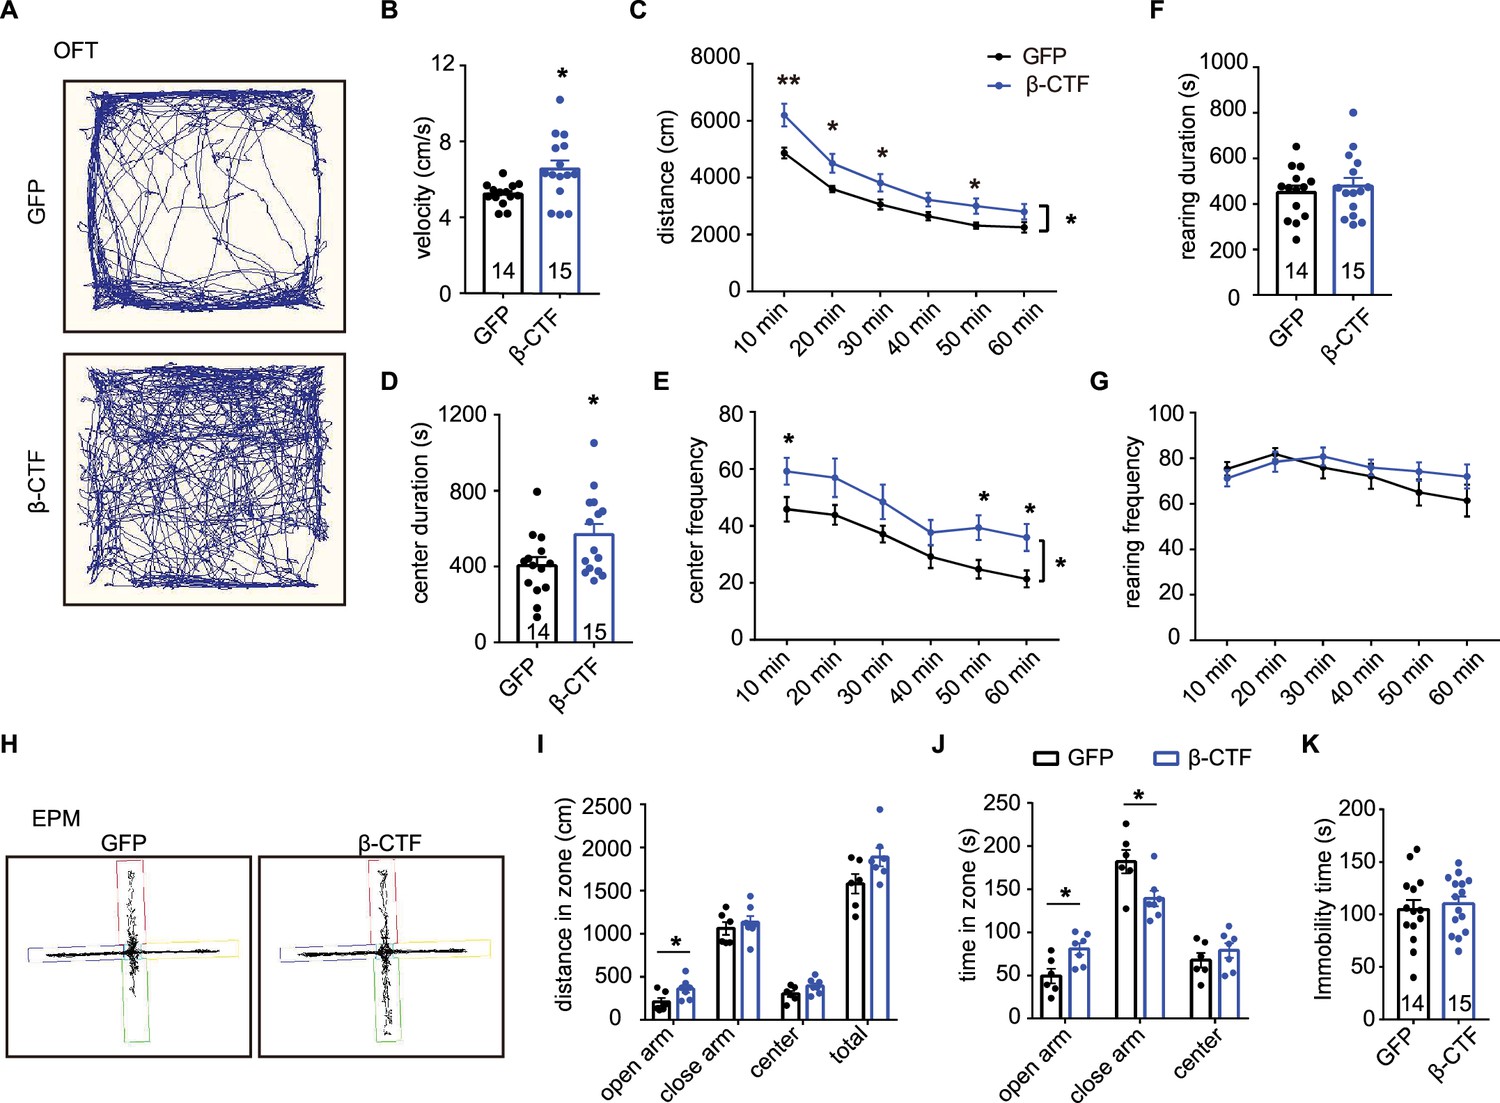
Additional neurobehavioral tests of mice expressing β-CTF in their brains.
(A) Representative travel traces of the open-field tests from adult mice infected with AAV encoding GFP or β-CTF in their hippocampi. (B–G) Quantitation of open-field tests from adult mice infected with AAV encoding GFP or β-CTF in hippocampus. GFP, n=14; β-CTF, n=15. (H) Representative traces of elevated plus maze tests from the mice infected with AAV encoding GFP or β-CTF in their hippocampi. (I) Quantitation of elevated plus maze tests. GFP, n=6; β-CTF, n=7. (J) Analysis of time spent in different arms of elevated plus maze. GFP, n=6; β-CTF, n=7. (K) Immobility time from tail suspension tests. GFP, n=14; β-CTF, n=15. Statistics: repeated measures two-way ANOVA or Student’s t-test. *p<0.05, **p<0.01, ***p<0.001, ****p<0.0001. Error bars show SEM.
-
Figure 4—figure supplement 1—source data 1
Excel file containing numeric values for Figure 4—figure supplement 1.
- https://cdn.elifesciences.org/articles/100968/elife-100968-fig4-figsupp1-data1-v2.xlsx
Figure 5 with 1 supplement
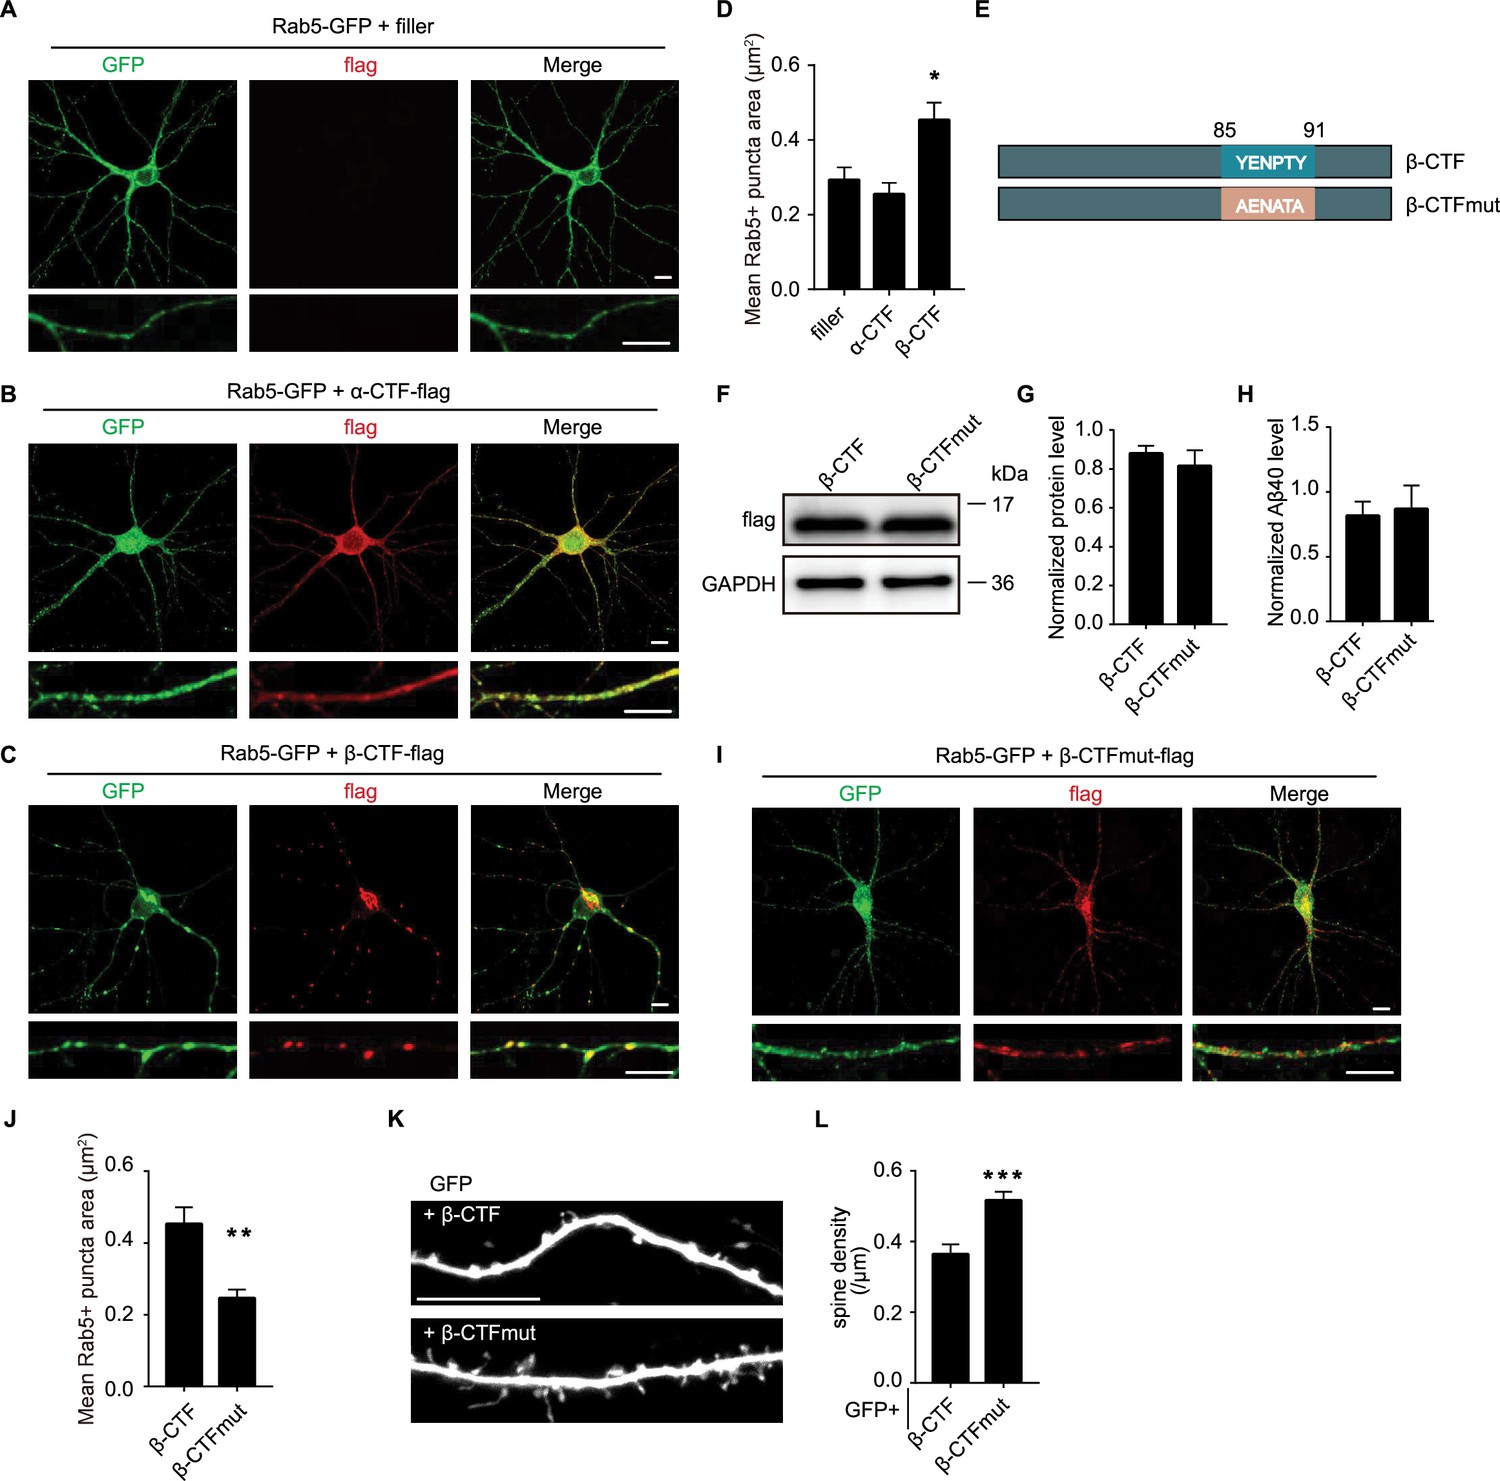
The C-terminal YENPTY motif was necessary for β-CTF to induce endosomal dysfunction and synapse loss.
(A) Immunofluorescent staining of GFP (green) from dissociated rat hippocampal neurons expressing Rab5-GFP. (B) Immunofluorescent staining of GFP (green) and flag (red) from dissociated rat hippocampal neurons expressing Rab5-GFP and α-CTF-flag. (C) Immunofluorescent staining of GFP (green) and flag (red) from dissociated rat hippocampal neurons expressing Rab5-GFP and β-CTF-flag. (D) Quantitation of average Rab5+puncta size of neurons expressing Rab5-GFP only or co-expressing α/β-CTF-flag and Rab5-GFP. filler, n=9; α-CTF, n=9; β-CTF, n=11. (E) Schematic diagram of the β-CTF and β-CTFmut. (F) Western blot of APP fragments from HEK293T cells expressing β-CTF-flag and β-CTFmut-flag with a flag antibody. (G) Quantitations of APP fragments from HEK293T cells expressing β-CTF-flag and β-CTFmut-flag. n=4. (H) Measurement of Aβ40 from HEK 293T cells expressing β-CTF or β-CTFmut. n=5. (I) Immunofluorescent staining of GFP (green) and flag (red) from dissociated rat hippocampal neurons expressing Rab5-GFP and β-CTFmut-flag. (J) Quantitation of average Rab5+puncta size of neurons co-expressing β-CTF-flag or β-CTFmut-flag and Rab5-GFP. β-CTF, n=11; β-CTFmut, n=9. (K, L) Representative images and spine density of basal dendrites from CA1 pyramidal neurons transiently expressing GFP together with β-CTF or β-CTFmut for 6–7 days in rat organotypic hippocampal slice cultures. β-CTF, n=12; β-CTFmut, n=15. Scale bar, 10 μm. Statistics: one-way ANOVA or Student’s t-test. *p<0.05, **p<0.01, ***p<0.001, ****p<0.0001. Error bars show SEM.
-
Figure 5—source data 1
Original files for western blots shown in Figure 5.
- https://cdn.elifesciences.org/articles/100968/elife-100968-fig5-data1-v2.zip
-
Figure 5—source data 2
Original files for western blots shown in Figure 5, indicating relevant bands.
- https://cdn.elifesciences.org/articles/100968/elife-100968-fig5-data2-v2.zip
-
Figure 5—source data 3
Excel file containing numeric values for Figure 5.
- https://cdn.elifesciences.org/articles/100968/elife-100968-fig5-data3-v2.xlsx
Figure 5—figure supplement 1
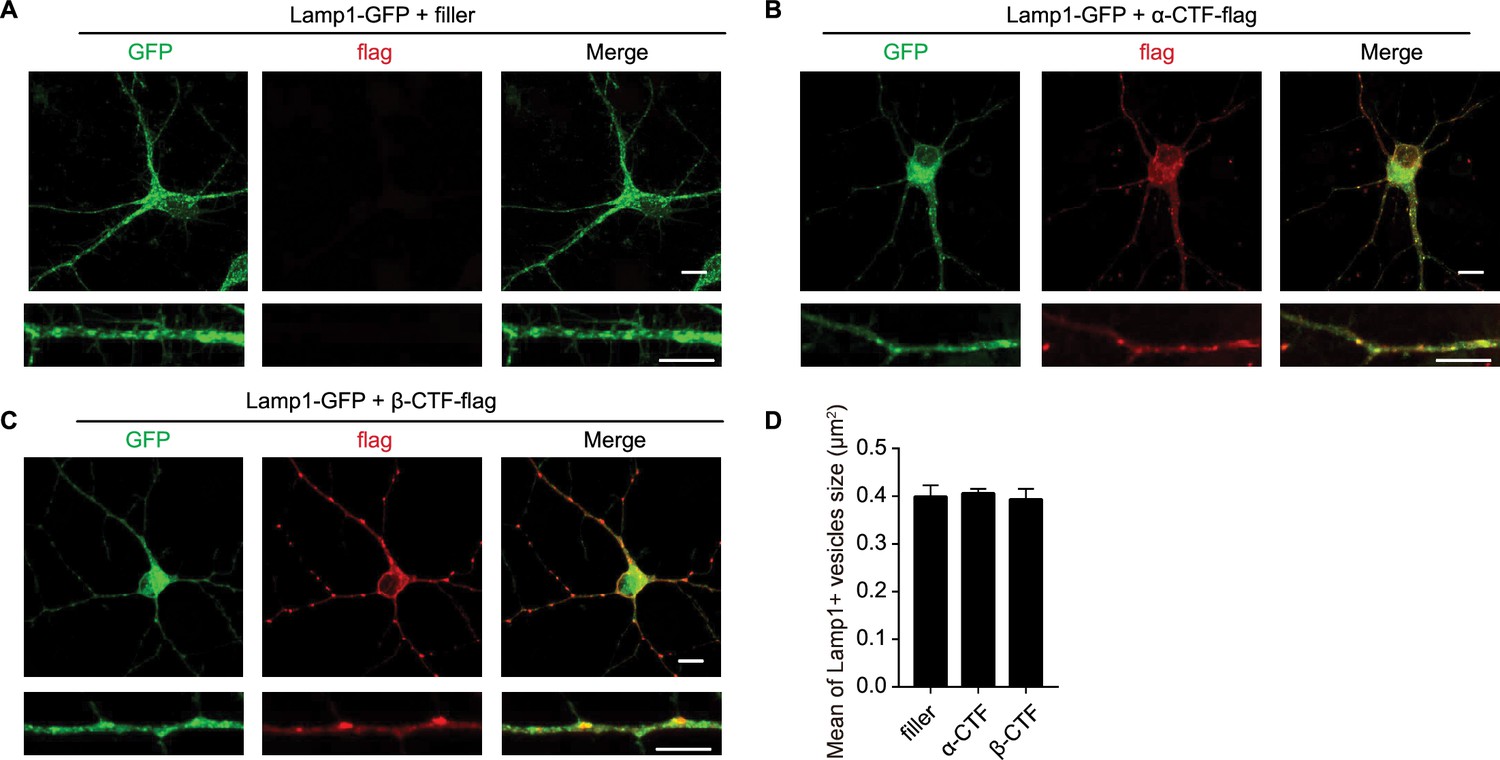
Co-immunostaining of APP CTFs and a lysosomal marker.
(A) Immunofluorescence staining of GFP (green) from dissociated rat hippocampal neurons expressing Lamp1-GFP. (B) Immunofluorescence staining of GFP (green) and flag (red) from neurons expressing Lamp1-GFP and α-CTF-flag. (C) Immunofluorescence staining of GFP (green) and flag (red) from neurons expressing Lamp1-GFP and β-CTF-flag. (D) Quantitation of average Lamp1 +vesicles size of neurons expressing Lamp1-GFP only or co-expressing α/β-CTF-flag and Lamp1-GFP. filler, n=6; α-CTF, n=7; β-CTF, n=7. Scale bar, 10 μm. Statistics: one-way ANOVA. *p<0.05, **p<0.01, ***p<0.001, ****p<0.0001. Error bars show SEM.
-
Figure 5—figure supplement 1—source data 1
Excel file containing numeric values for Figure 5—figure supplement 1.
- https://cdn.elifesciences.org/articles/100968/elife-100968-fig5-figsupp1-data1-v2.xlsx
Figure 6 with 1 supplement
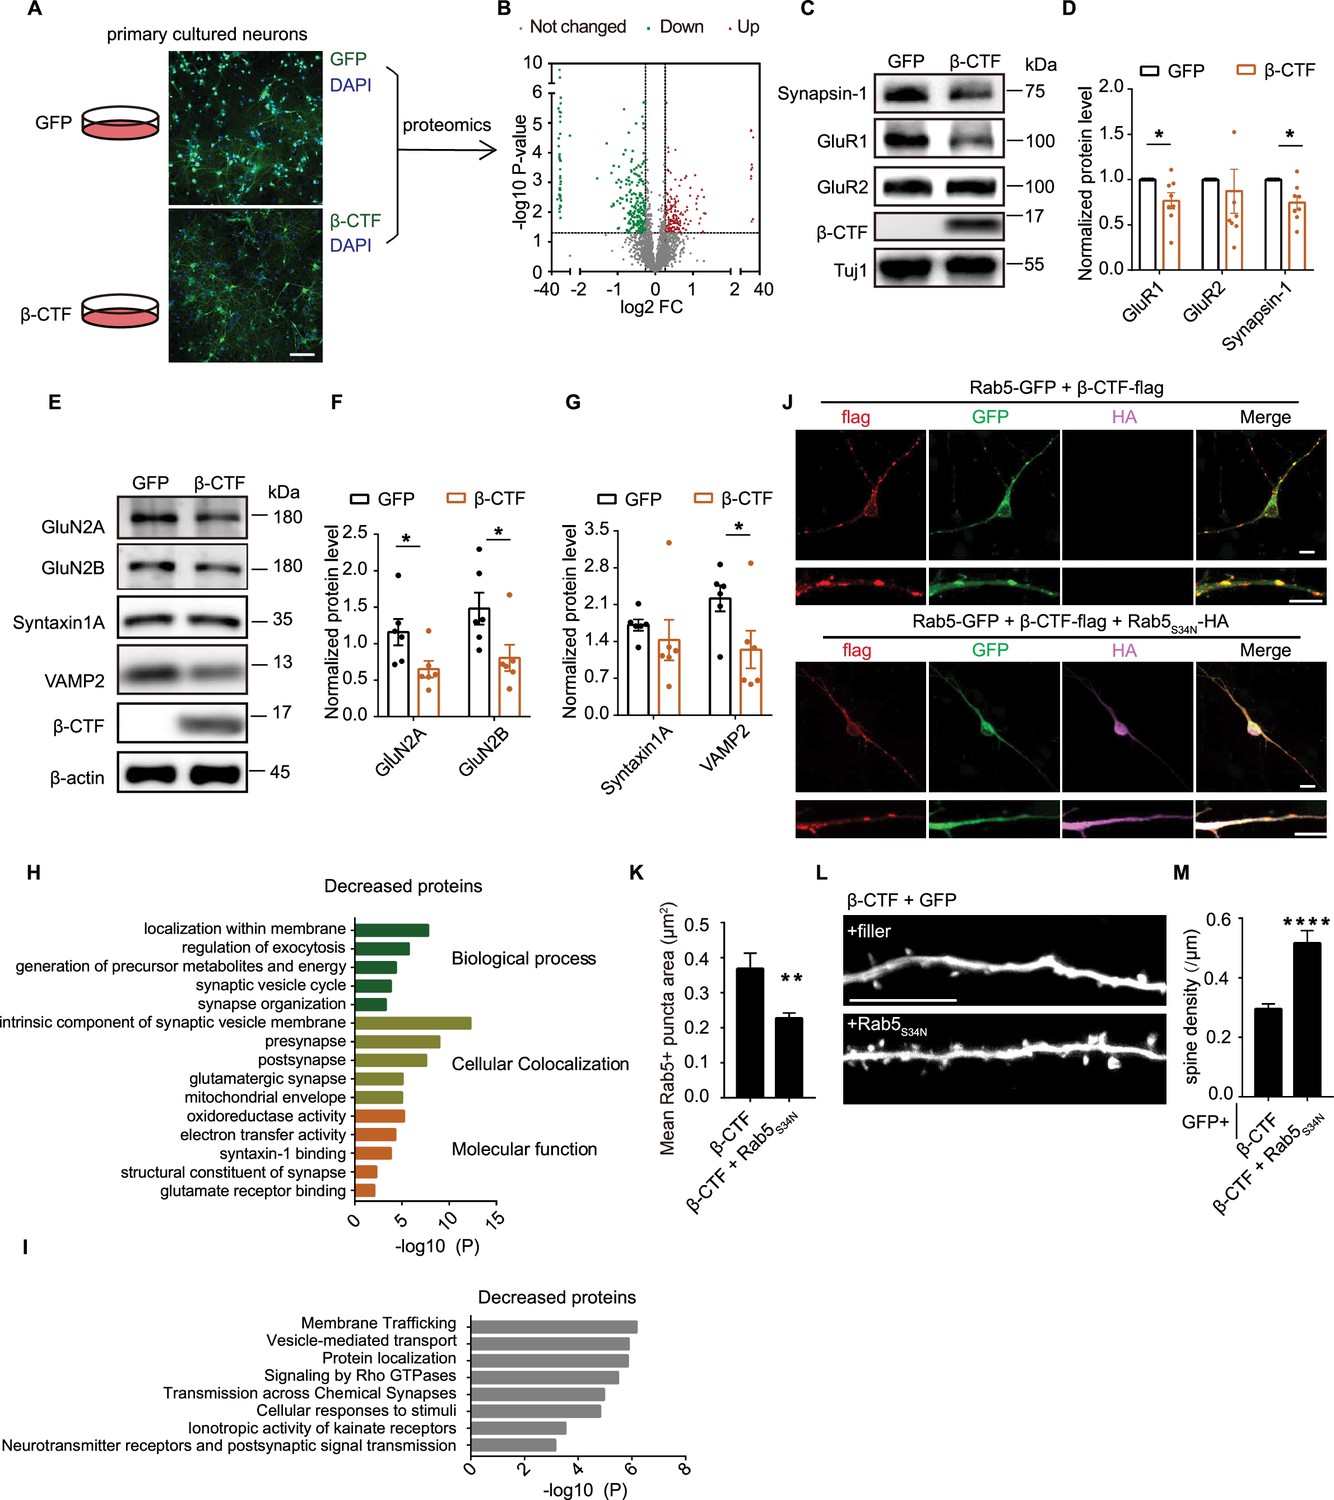
Spine loss induced by β-CTF was prevented by Rab5 inhibition.
(A) Representative images of dissociated rat hippocampal neurons infected with lentivirus encoding GFP or β-CTF. Scale bar, 100 μm. (B) Volcano plot of quantitative mass spectrometry analysis showing protein omics changes in neurons infected with lentivirus encoding β-CTF v.s. GFP. Proteins with fold change >1.2 or <0.83 and p-value<0.05 are colored. (C, D) Western blot and corresponding statistic analysis of Synapsin-1, GluR1, GluR2 in dissociated hippocampal neurons infected with lentivirus expressing GFP or β-CTF. Tuj 1 was used as an internal control. n=8. (E–G) Western blot and corresponding statistic analysis of GluN2A, GluN2B, Syntaxin1A, VAMP2 in dissociated hippocampal neurons infected with lentivirus expressing GFP or β-CTF. β-actin was used as an internal control. n=6. (H) The Gene Ontology (GO) processes analysis of decreased proteins by Metascape. (I) The Reactome Gene Sets processes analysis of decreased protein by Metascape. (J) Immunofluorescent staining of GFP (green), flag (red) and HA (magenta) from dissociated rat hippocampal neurons expressing Rab5-GFP and β-CTF-flag or together with Rab5S34N-HA. Scale bar, 10 μm. (K) Quantitation of average Rab5+puncta size from dissociated rat hippocampal neurons expressing Rab5-GFP and β-CTF-flag or together with Rab5S34N-HA. β-CTF, n=5; β-CTF + Rab5S34N, n=9. (L, M) Representative images and measurements of spine density of basal dendrites from CA1 pyramidal neurons transiently expressing GFP and β-CTF with or without Rab5S34N for 6–7 days in rat organotypic hippocampal slice cultures. Scale bar, 10 μm. β-CTF, n=17; β-CTF plus Rab5S34N, n=11. Statistics: Student’s t-test. *p<0.05, **p<0.01, ***p<0.001, ****p<0.0001. Error bars show SEM.
-
Figure 6—source data 1
Original files for western blots shown in Figure 6.
- https://cdn.elifesciences.org/articles/100968/elife-100968-fig6-data1-v2.zip
-
Figure 6—source data 2
Original files for western blots shown in Figure 6, indicating relevant bands.
- https://cdn.elifesciences.org/articles/100968/elife-100968-fig6-data2-v2.zip
-
Figure 6—source data 3
Excel file containing numeric values for Figure 6.
- https://cdn.elifesciences.org/articles/100968/elife-100968-fig6-data3-v2.xlsx
Figure 6—figure supplement 1
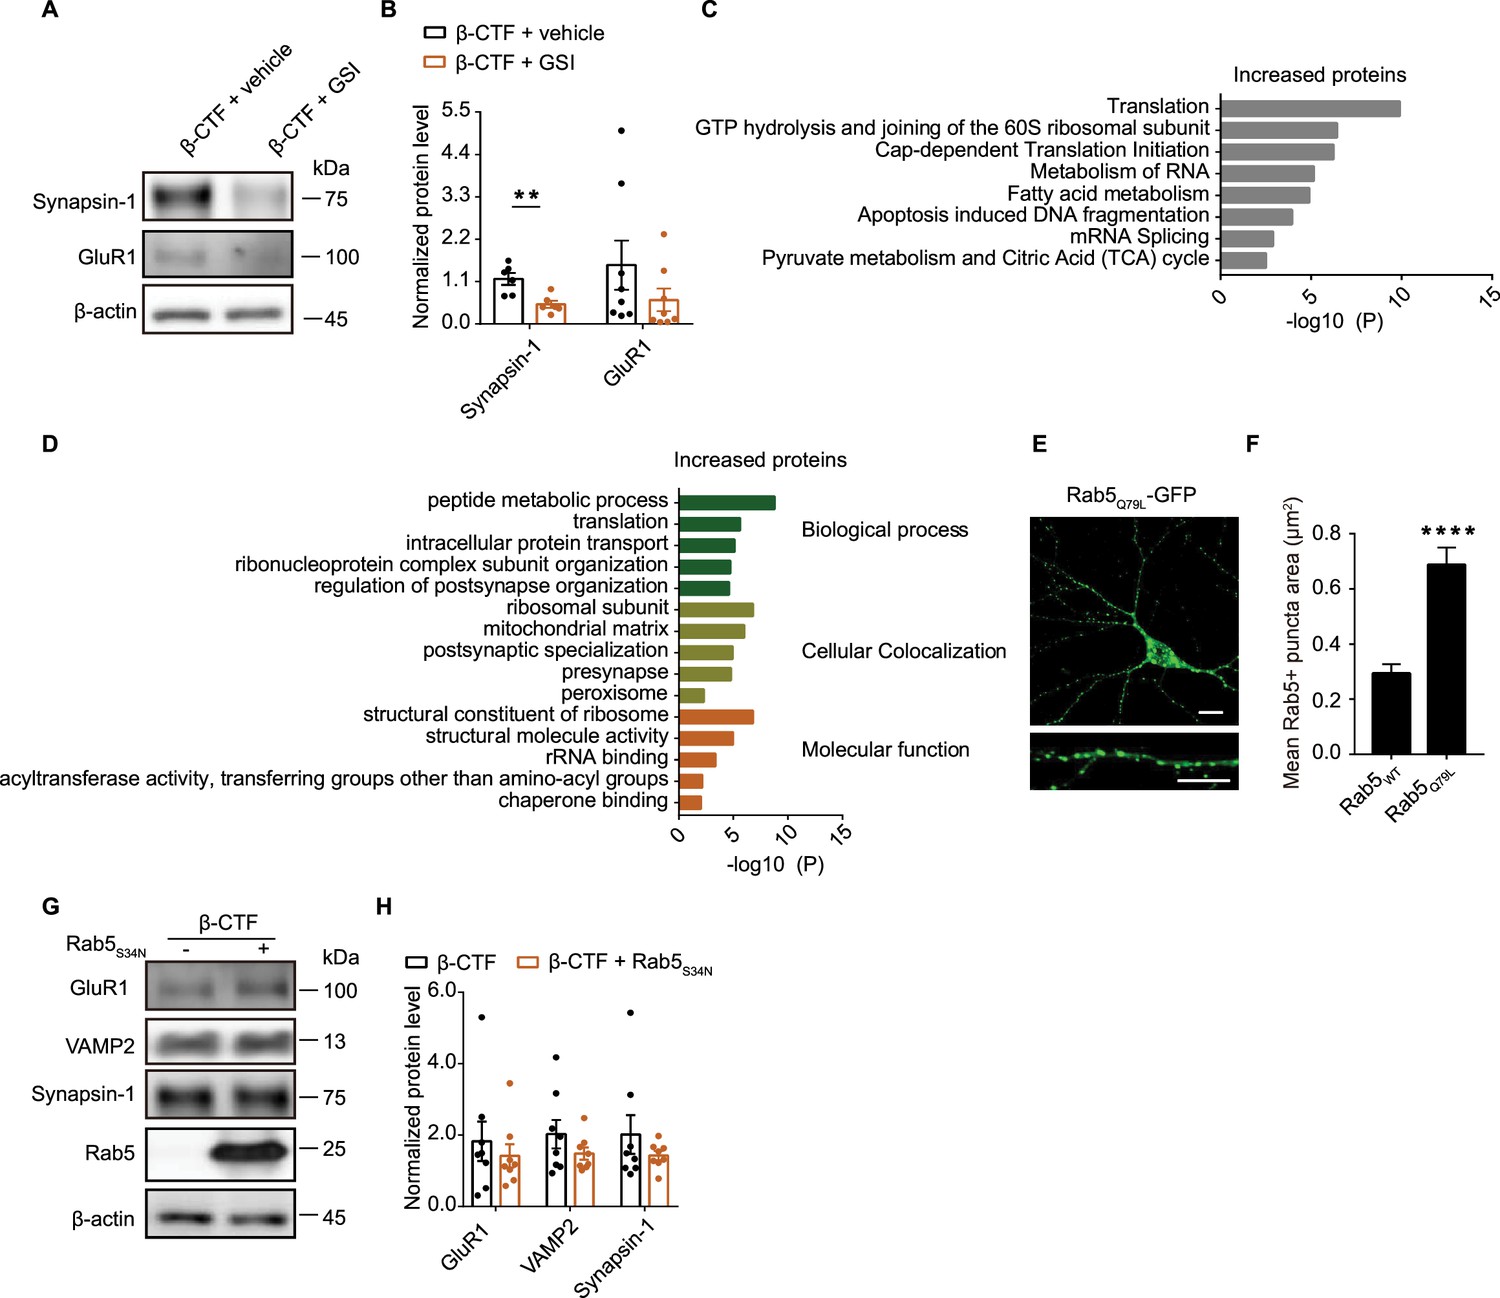
GO and Reactome Gene sets analysis of β-CTF-upregulated proteins in neurons.
(A, B) Western blot and corresponding statistic analysis of Synapsin-1 and GluR1 in dissociated hippocampal neurons infected with lentivirus expressing β-CTF treated with vehicle or PF. β-actin was used as an internal control. n=6/8. (C) The Gene Ontology (GO) processes analysis of increased protein by Metascape. (D) The Reactome Gene Sets processes analysis of increased protein by Metascape. (E) Immunofluorescence staining of GFP (green) from dissociated rat hippocampal neurons expressing Rab5Q79L-GFP. (F) Quantitation of average Rab5+puncta size from dissociated rat hippocampal neurons expressing Rab5 WT-GFP or Rab5Q79L-GFP. Rab5WT, n=9; Rab5Q79L, n=5. (G, H) Western blot and corresponding statistic analysis of GluR1, VAMP2, and Synapsin-1 in dissociated hippocampal neurons infected with lentivirus expressing β-CTF or co-expressing β-CTF and Rab5S34N. β-actin was used as an internal control. n=8. Statistics: Student’s t-test. *p<0.05, **p<0.01, ***p<0.001, ****p<0.0001. Error bars show SEM. Scale bar, 10 μm.
-
Figure 6—figure supplement 1—source data 1
Original files for western blots shown in Figure 6—figure supplement 1.
- https://cdn.elifesciences.org/articles/100968/elife-100968-fig6-figsupp1-data1-v2.zip
-
Figure 6—figure supplement 1—source data 2
Original files for western blots shown in Figure 6—figure supplement 1, indicating relevant bands.
- https://cdn.elifesciences.org/articles/100968/elife-100968-fig6-figsupp1-data2-v2.zip
-
Figure 6—figure supplement 1—source data 3
Excel file containing numeric values for Figure 6—figure supplement 1.
- https://cdn.elifesciences.org/articles/100968/elife-100968-fig6-figsupp1-data3-v2.xlsx
Additional files
Download links
A two-part list of links to download the article, or parts of the article, in various formats.
Downloads (link to download the article as PDF)
Open citations (links to open the citations from this article in various online reference manager services)
Cite this article (links to download the citations from this article in formats compatible with various reference manager tools)
APP β-CTF triggers cell-autonomous synaptic toxicity independent of Aβ
eLife 13:RP100968.
https://doi.org/10.7554/eLife.100968.3


