Mistargeted retinal axons induce a synaptically independent subcircuit in the visual thalamus of albino mice
- John F Hardesty, MD Department of Ophthalmology and Visual Sciences, Washington University School of Medicine, United States
- Department of Neuroscience, Washington University School of Medicine, United States
- Hope Center for Neurological Disorders, Washington University School of Medicine, United States
- Biomedical Engineering, Washington University School of Medicine, United States
Figures
Figure 1 with 1 supplement
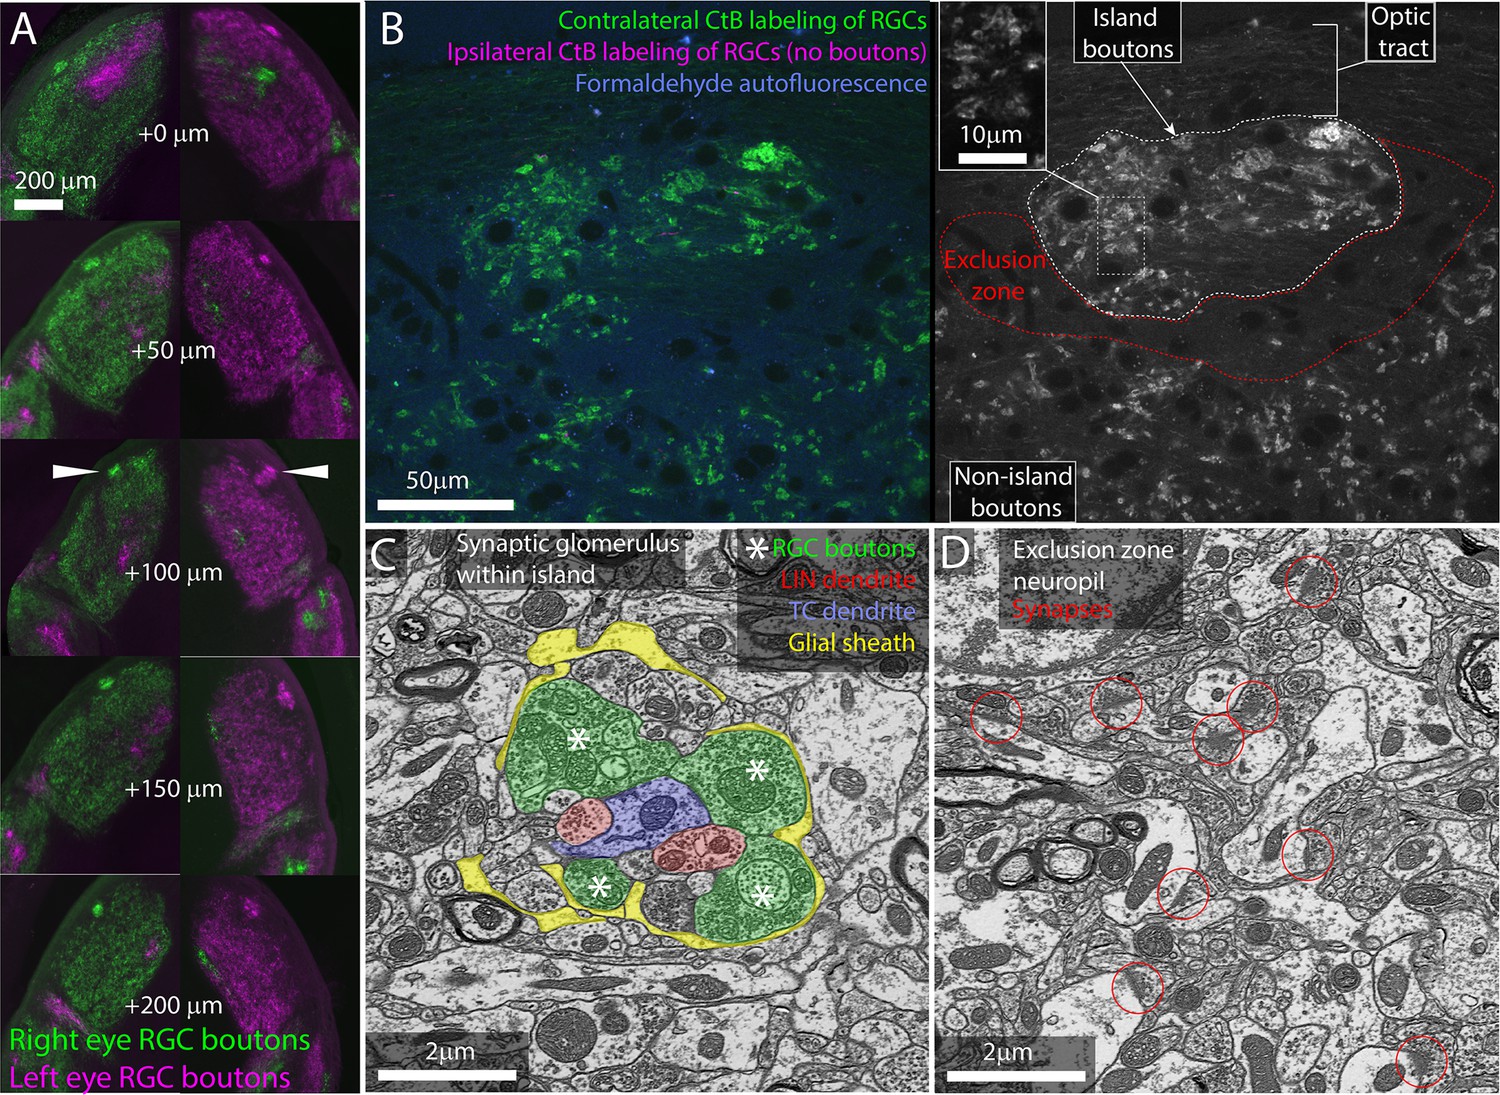
The island of retinal ganglion cell (RGC) boutons represents a segregation and concentration of a subset of otherwise normal retinogeniculate connections.
(A) Serial vibratome sections through the left and right dorsal lateral geniculate nuclei (dLGN) of an albino mouse. From top to bottom, section progress rostral to caudal. Choleratoxin-B (CtB) labeling of RGCs from the left (magenta) and right (green) eyes. White arrowheads indicate island. (B) Single confocal section through CtB-labeled albino island. Left shows background fluorescence (blue), contralateral RGC boutons (green), and an absence of ipsilateral axons (magenta). Right shows CtB-labeled RGC boutons from contralateral eye only. Inset shows enlarged view of RGC boutons. (C) Electron micrograph of retinogeniculate glomerulus in the albino island. RGC boutons are indicated by asterisks. (D) Electron micrograph of non-glomerular neuropil of the exclusion zone. Red circles indicate non-glomerular synapses. Both the synaptic glomerulus in the island and the feedback synapses in the exclusion zone appear ultrastructurally normal.
Figure 1—figure supplement 1
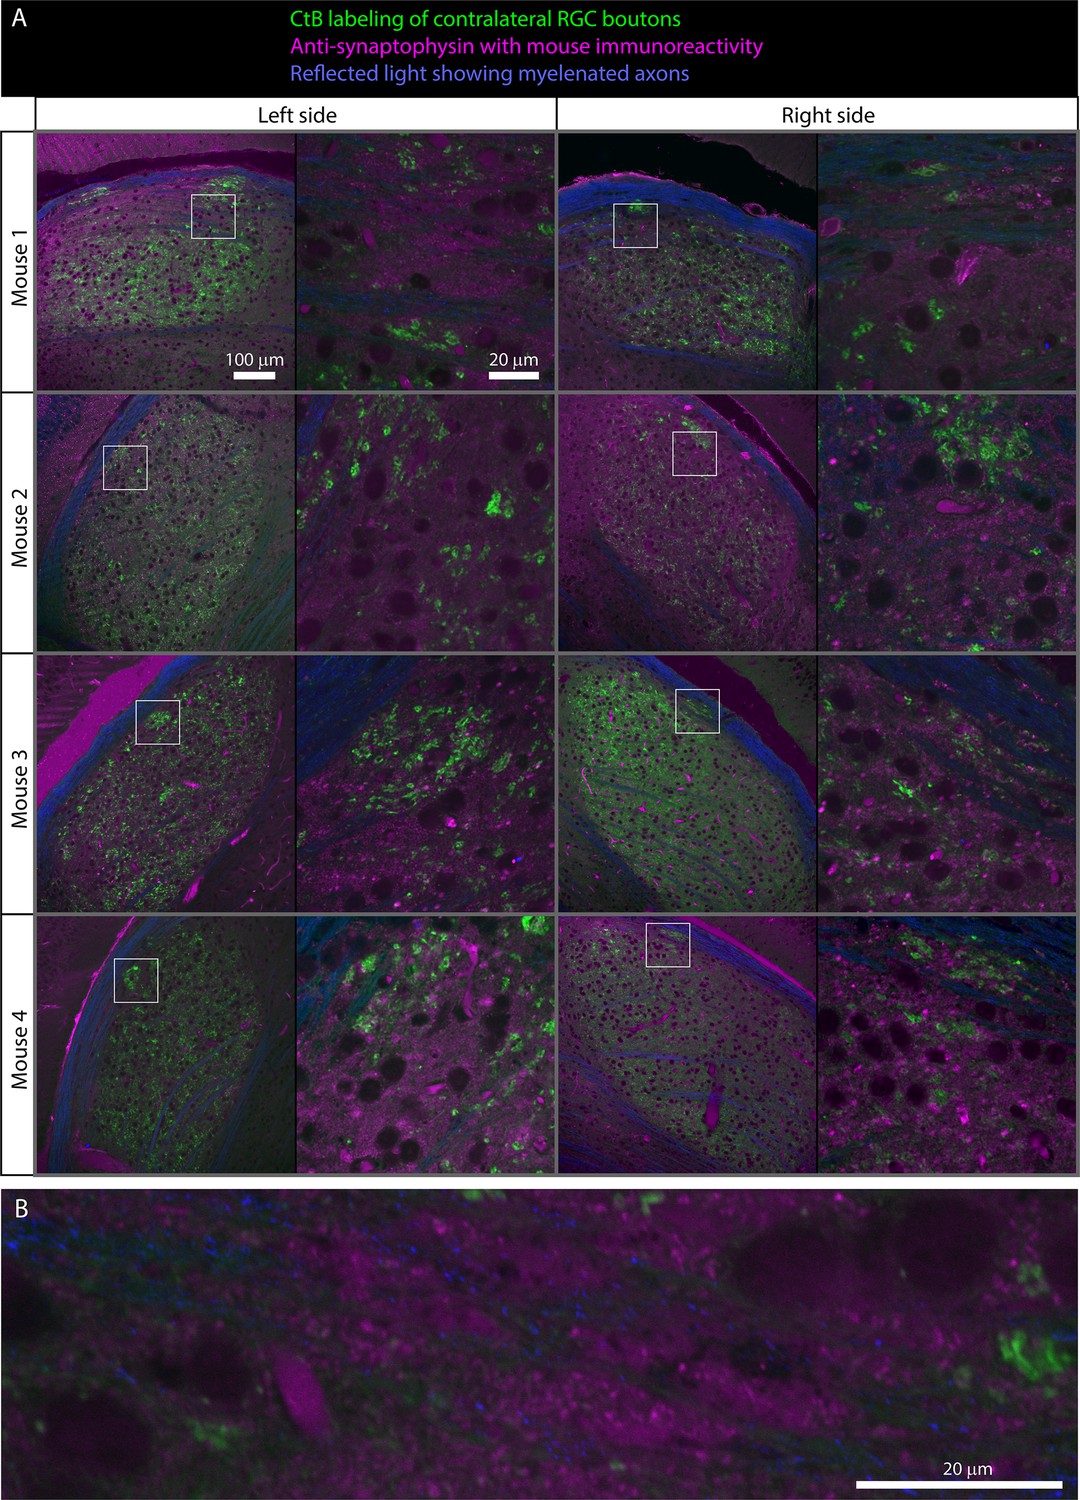
Synaptophysin labeling of dorsal lateral geniculate nuclei (dLGN) synapses shows synaptic neuropil is present in the retinal ganglion cell (RGC) bouton exclusion zone.
(A) Each row shows the left and right dLGN for each mouse. Contralateral projecting RGC terminals labeled with choleratoxin-B (CtB) (488 or 555) are shown in green. Mouse anti-synaptophysin immunoreactivity is shown in magenta. Anti-mouse secondary antibody labels blood vessels as well as anti-synaptophysin primary antibody. Reflected light highlighting myelinated axons is shown in blue. (A) For each dLGN, as single plane of a confocal scan of the full dLGN (left) and exclusion zone (right) is shown. The white box indicates the position of the high-resolution image relative to the full dLGN. Bright punctate immune artifacts are visible in some panels. (B) Closer look at the exclusion zone of left dLGN from mouse 1 shown in (A). The immunolabeling showing synaptic neuropil in the exclusion zone is consistent with our examination of the EM volume.
Figure 2 with 3 supplements
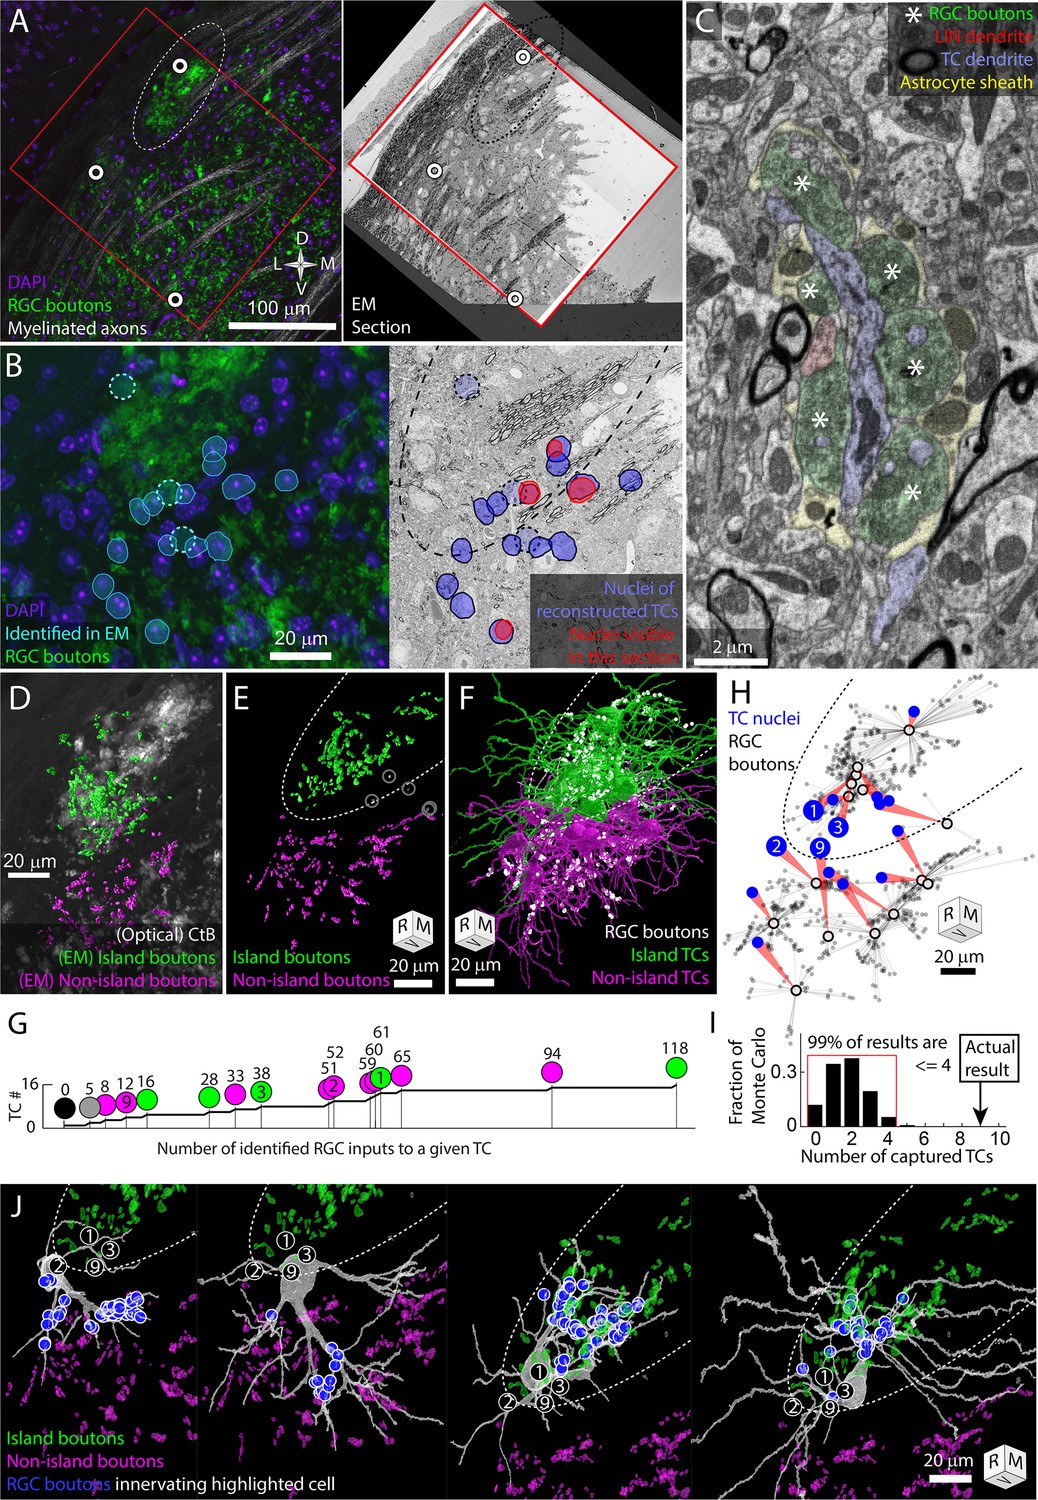
The retinal ganglion cell (RGC) island represents a segregation of retinogeniculate synaptic connectivity.
Thalamocortical cells are either innervated by island RGC boutons or non-island RGC boutons. Dotted oval indicates the boundary of the RGC island in multiple panels. Four cells (TC1, TC2, TC3, TC9) are identified in (B, G, H, I). Tissue orientation is indicated by compass rose or rotation cube (rostral/medial/ventral). (A) Matching of optical images and EM section overview. Red rectangles indicate the boundaries of the EM volume used to trace thalamocortical cells (TCs). White circles indicate blood vessels matched between optical images and EM images. (B) Closer view of light and EM images showing nuclei of EM-reconstructed TCs. In the optical image (left), DAPI-labeled nuclei (blue) of reconstructed TCs are outlined (cyan) relative to RGC boutons (green). The position of reconstructed TCs that are not visible in the confocal image stack is indicated by circles. The nuclei labels are mapped onto the EM section (right). The nuclei of reconstructed TCs visible in the EM section are highlighted in red. (C) Example of electron micrograph with 20 nm pixel size in which TC dendrite and associated glomerulus are annotated. RGC boutons are indicated by asterisks. (D) EM reconstructed island (green) and non-island (magenta) RGC boutons that were found innervating reconstructed TCs. EM boutons are overlayed on the corresponding optical image of choleratoxin-B (CtB)-labeled RGC boutons. (E) Rotation of EM-labeled RGC boutons to show the clearest separation between island (green) and non-island boutons (magenta). Boutons innervating the one TC without a clear island or non-island identity are highlighted in white. (F) Partial reconstructions of TCs indicated in (B). TCs are color coded by whether the receive their input from the island or non-island RGC boutons. Positions of RGC inputs are indicated by white dots. (G) Cumulative curve of the number of RGC boutons innervating reconstructed TCs. Circles indicate island/non-island identity. Numbers above the circles are the number of RGC boutons innervating the TC. Number within the circle indicates TC IDs used in other panels. (H) Plot of the relationship between TC body (blue circle) and the location of the RGC inputs that innervate it (gray dots). Average synapse position is indicated by a black circle. (I) Results of Monte Carlo simulation predicting how many TCs would be innervated only by island or only by non-island RGC boutons if TC dendrites are independent of one another. Red bracket encloses 99% of results. (J) EM reconstructions of the four example TCs highlighted in previous panels. Circled numbers indicate the relative position of the four example cells. The location of RGC inputs is indicated by blue circles. Island and non-island RGC boutons innervating other TCs shown in green and magenta. TCs with soma in the exclusion zone have asymmetric dendritic arbors that reflect their exclusive connectivity to either the island or non-island RGC boutons.
Figure 2—figure supplement 1
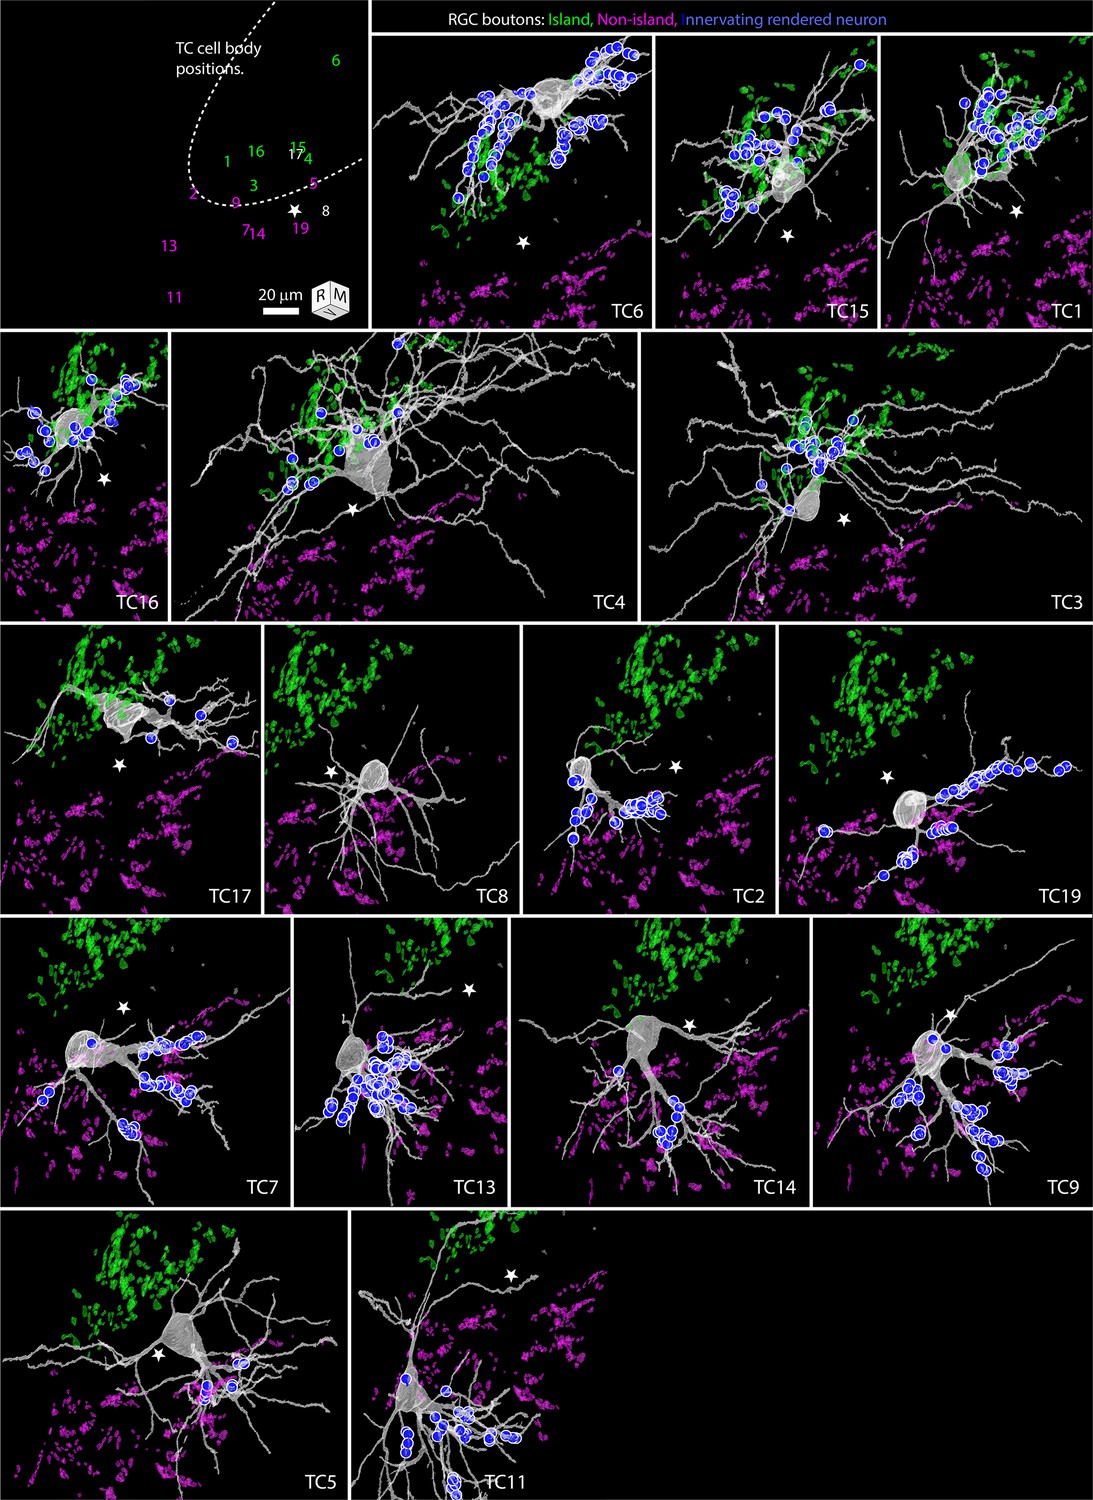
Thalamocortical cells (TCs) surrounding the exclusion zone are captured by either the island or non-island retinal ganglion cell (RGC) boutons.
The TC dendritic arbors reflect this capture. Panels show renderings of partially reconstructed TCs. The top-left key shows the position of the nuclei of the reconstructed TCs relative to the boundary of the RGC island (dotted white line). The color of the cell IDs indicates whether they received RGC input from the island or non-island RGC boutons. The star indicates a common reference position for all panels. RGC inputs innervating the TC highlighted in each panel are shown as blue circles. The TC connectivity and morphologies are consistent with Hebbian rules shaping retinogeniculate circuit structure.
Figure 2—figure supplement 2
Proximal dendrites of thalamocortical cells (TCs) are usually thick and innervated by retinal ganglion cell (RGC) boutons.
Proximal dendrites of TCs that extend into the exclusion zone are noticeably thinner, similar to distal dendrites. Panels show four example TCs where dendrites were observed extending into the exclusion zone. Neurites in the exclusion zone are indicated with stars. The location of RGC boutons innervating the TC is indicated by circles (green = island, magenta = non-island).
Figure 2—video 1
3D rotation of thalamocortical cells (TCs) shown in Figure 2—figure supplement 1.
TCs surrounding the exclusion zone are captured by either the island (green) or non-island (magenta) retinal ganglion cell (RGC) boutons. All reconstructed TCs are shown in light gray. TCs are sequentially highlighted with white dendrites and red RGC inputs (circles).
Figure 3
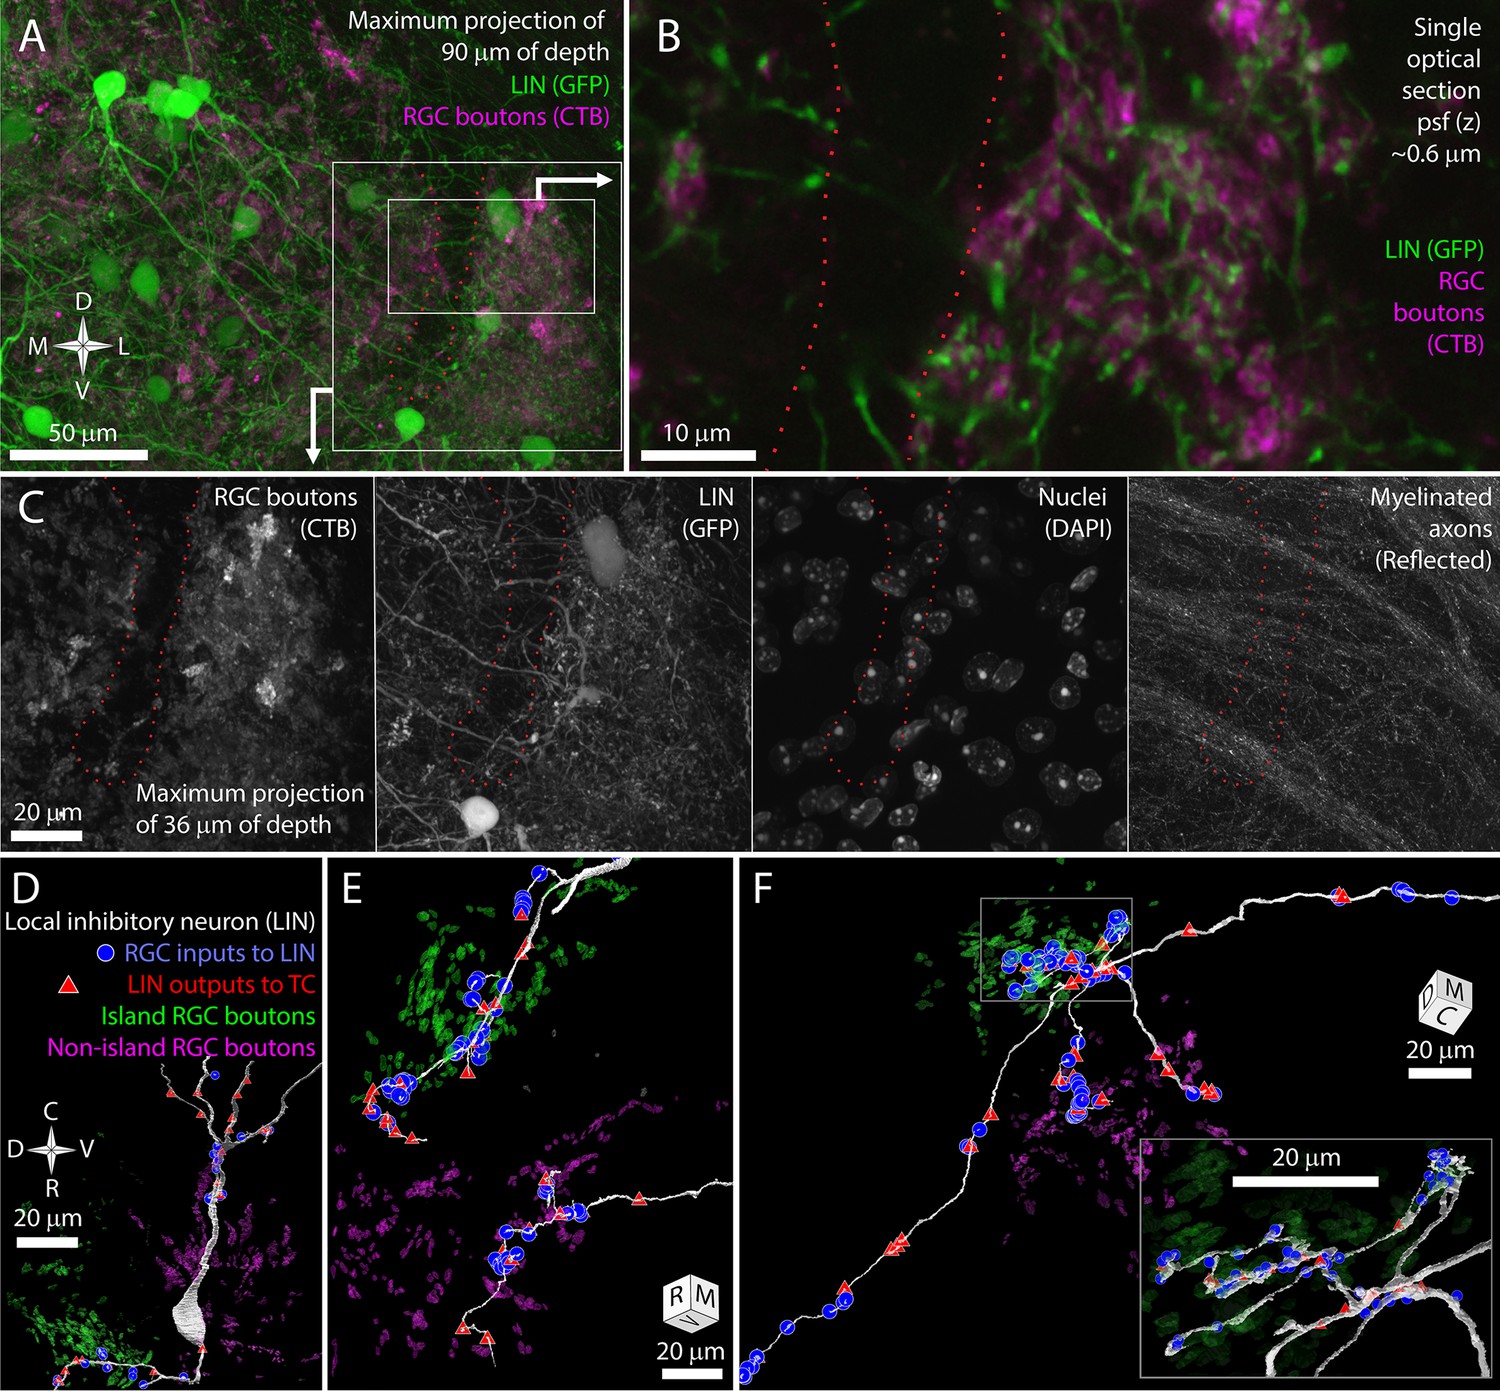
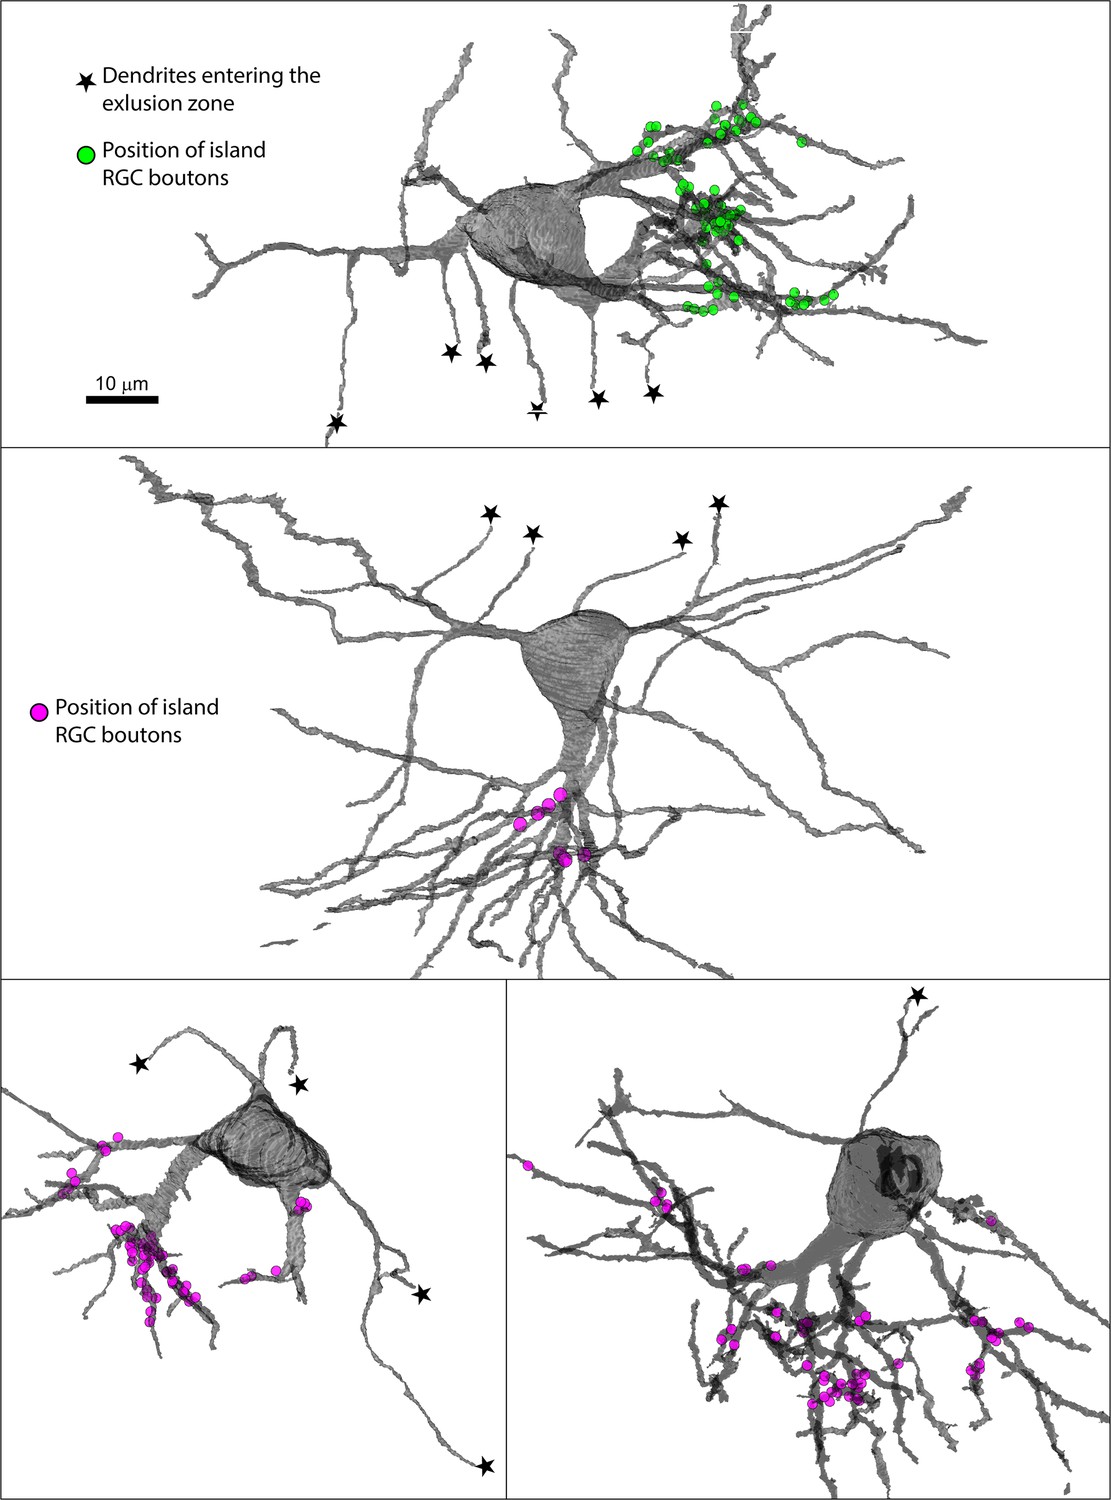
The long shaft dendrites of LINs cross the exclusion zone while the individual targeted dendrites of LINs have distinct island or non-island synaptic identities.
(A) Reference image for (B, C) showing LINs (green) and choleratoxin-B (CtB) labeling of retinal ganglion cell (RGC) terminals (magenta). (B) Close association between targeted neurites of LINs (green) and RGC terminals (magenta). (C) Four channels of confocal stack showing RGC bouton exclusion zone relative to LINs, cell nuclei, and reflective fibers. (D) EM reconstruction of LIN relative to island (green) and non-island (magenta) RGC boutons. Input synapses from RGCs (blue circles) and output synapses (red triangles) are labeled. (E) Two LIN dendrites labeled as in (D). (F) LIN dendrite labeled as in (D). Inset shows a magnified view of branch points. The functional identities of LINs are, therefore, likely to be locally, but not globally, specific to island or non-island boutons.
Additional files
Download links
A two-part list of links to download the article, or parts of the article, in various formats.
Downloads (link to download the article as PDF)
Open citations (links to open the citations from this article in various online reference manager services)
Cite this article (links to download the citations from this article in formats compatible with various reference manager tools)
Mistargeted retinal axons induce a synaptically independent subcircuit in the visual thalamus of albino mice
eLife 13:RP100990.
https://doi.org/10.7554/eLife.100990.3


