AgRP1 modulates breeding season-dependent feeding behavior in female medaka
- Graduate School of Science, The University of Tokyo, Japan
- Department of Applied Physics, The University of Tokyo, Japan
- Atmosphere and Ocean Research Institute, The University of Tokyo, Japan
- Graduate School of Agriculture, Tokyo University of Agriculture and Technology, Japan
Figures
Figure 1 with 2 supplements

Reproductive female medaka show larger amount of food intake.
(A) Light conditions for breeding and non-breeding status. (B) Food intake (10 min) of female medaka in long day (LD) (orange; n=7) and SD (blue; n=7) conditions, normalized to the amount of artemia eaten by medaka in LD (breeding) condition (p=0.02519, U=42.5). (C) Food intake (10 min) of male medaka in LD (orange; n=7) and short day (SD) (blue; n=7) conditions, normalized to the amount of artemia eaten by medaka in LD (breeding) condition (p=0.6540, U=20.5). Mann–Whitney U test, *p<0.05. n.s., not significant.
-
Figure 1—source code 1
The code of ‘Shrimp-counter’ system.
- https://cdn.elifesciences.org/articles/100996/elife-100996-fig1-code1-v1.zip
-
Figure 1—source data 1
The numerical data for Figure 1.
- https://cdn.elifesciences.org/articles/100996/elife-100996-fig1-data1-v1.xlsx
Figure 1—figure supplement 1

'Wanko-soba’ method for calculation of the amount of food intake of fish.
(A) One medaka is put into a white cup with 100 mL breeding water and is habituated for 5 min. (B) Medaka is fed by application of 200 μL aliquots of food water containing brine shrimp in all-you-can-eat style and serve another aliquot once done with it, which is repeated N times (like the Japanese ‘Wanko soba’). (C) Stop feeding 10 min after the start, take 10 mL out of the breeding water and transfer it to a conical tube. The conical tube is frozen overnight and the leftover brine shrimp sunk in the bottom are counted by ‘shrimp-counter’. The food intake is calculated as follows (also see ‘Materials and methods’). (Food Intake) = (The average number of brine shrimp in the solution) * (number of aliquots, N) – (number of leftover brine shrimp sunk in the bottom) * 10. Food intake was normalized by the average of LD medaka.
Figure 1—figure supplement 2
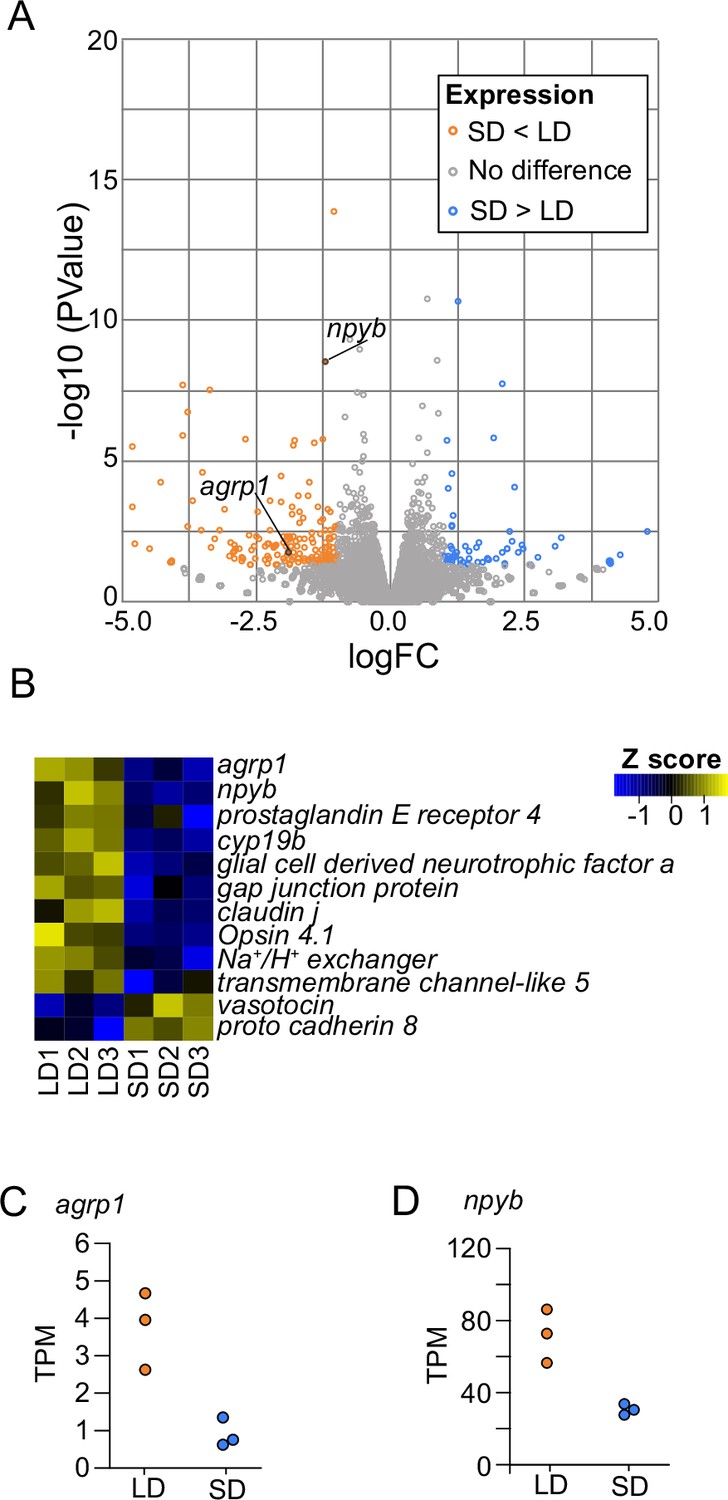
Whole-brain gene expression in long day (LD) (n=3) and short day (SD) (n=3) female medaka.
(A) Volcano plot comparing whole-brain gene expression in LD (n=3) and SD (n=3) female medaka. Genes with higher expression in LD than in SD (p-value<0.05 and logFC<–1) are shown in orange, and those with higher expression in SD than in LD (p-value<0.05 and logFC>1) are shown in blue. (B) Heatmap of representative genes, which are mainly related to neuroendocrine functions and show different expression patterns between LD and SD. (C, D) Transcripts per million (TPM) value of agrp1 and npyb.
-
Figure 1—figure supplement 2—source data 1
The numerical data for Figure 1—figure supplement 2.
- https://cdn.elifesciences.org/articles/100996/elife-100996-fig1-figsupp2-data1-v1.xlsx
Figure 2 with 1 supplement
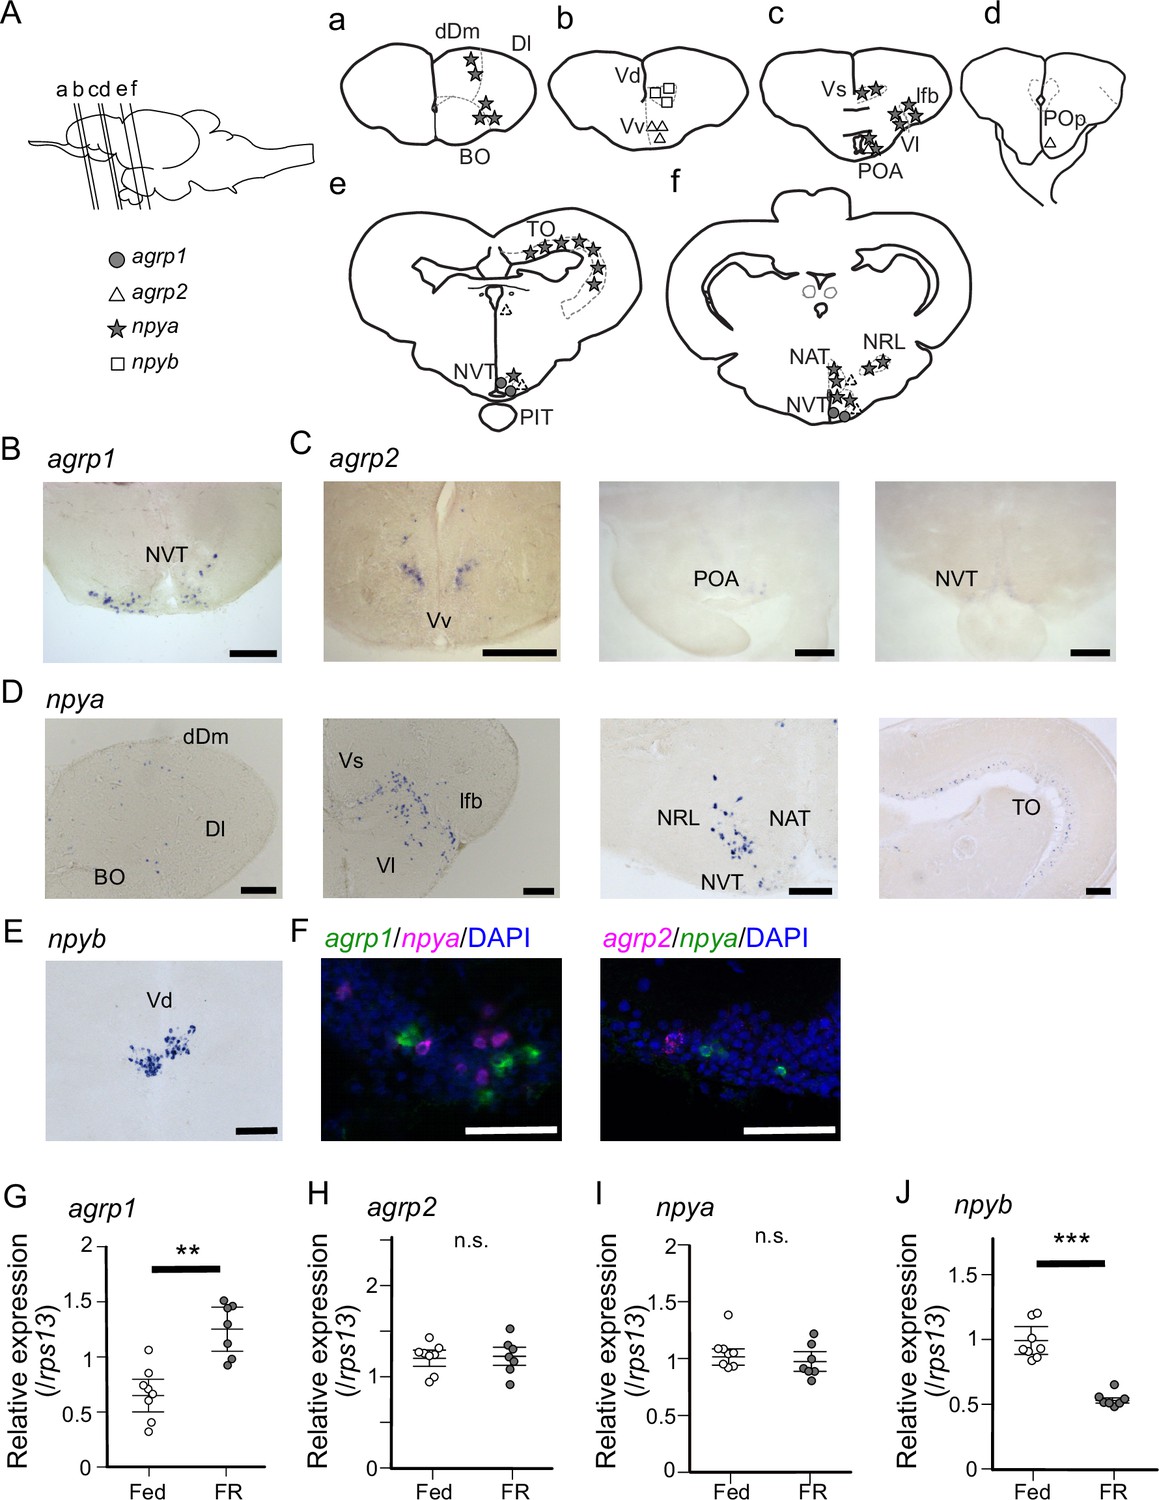
agrp1- and npyb-expressing neurons are distributed locally, while npya- and agrp2-expressing neurons are distributed more widely in the brain.
(A) Illustration of the lateral view of medaka brain and distributions of cell bodies expressing each agrp or npy gene. The oblique lines labeled with (a–e) indicate the level of the frontal sections in (a–e). (a–e) Illustrations of frontal sections showing the distribution of neurons expressing each gene. The localization of neurons is indicated in the right half of the illustrations. BO, bulbus olfactorius; dDm, dorsal region of area dorsalis telencephali pars medialis; Dl, area dorsalis telencephali pars lateralis; lfb, lateral forebrain bundle; NAT, nucleus anterior tuberis; NRL, nucleus recessus lateralis; NVT, nucleus ventralis tuberis; PIT, pituitary; POA, area preoptica; POp, nucleus preopticus pars paravocellularis; TO, tectum opticum; Vd, area ventralis telencephali pars dorsalis; Vl, area ventralis telencephali pars lateralis; Vs, area ventralis telencephali pars supracommissuralis; Vv, area ventralis telencephali pars ventralis; agrp1 (gray circle), agrp2 (open triangle: high expression, dotted triangle: low expression), npya (star), npyb (open square). (B) agrp1-expressing neurons are localized in NVT. Scale bar: 100 μm. (C) agrp2-expressing neurons are observed in Vv, POA, and NVT. Scale bar: 100 μm. (D) npya-expressing neurons are distributed in dDm, Dl, BO, Vs, Vl, lfb, NRL, NAT, NVT, and TO. Scale bar: 100 μm. (E) npyb-expressing neurons are localized in Vd. Scale bar: 100 μm. (F) Left: agrp1 (green) and npya (magenta) are distributed in NVT, but the two genes are not co-expressed. Right: agrp2 (magenta) and npya (green) are distributed in NVT, but the two genes are not co-expressed. Scale bars: 50 μm. (G–J) agrp and npy expressions in the whole brain of female medaka under normally fed condition (Fed; white; n=7) or 2-week food restricted (FR; gray; n=8). (G) agrp1 (p=0.001243, U=2), (H) agrp2 (p=0.9551, U=29), (I) npya (p=0.2319, U=39), and (J) npyb (p=0.0003108, U=56). Mann–Whitney U test, **p<0.01, ***p<0.001. n.s., not significant.
-
Figure 2—source data 1
The numerical data for Figure 2.
- https://cdn.elifesciences.org/articles/100996/elife-100996-fig2-data1-v1.xlsx
Figure 2—figure supplement 1
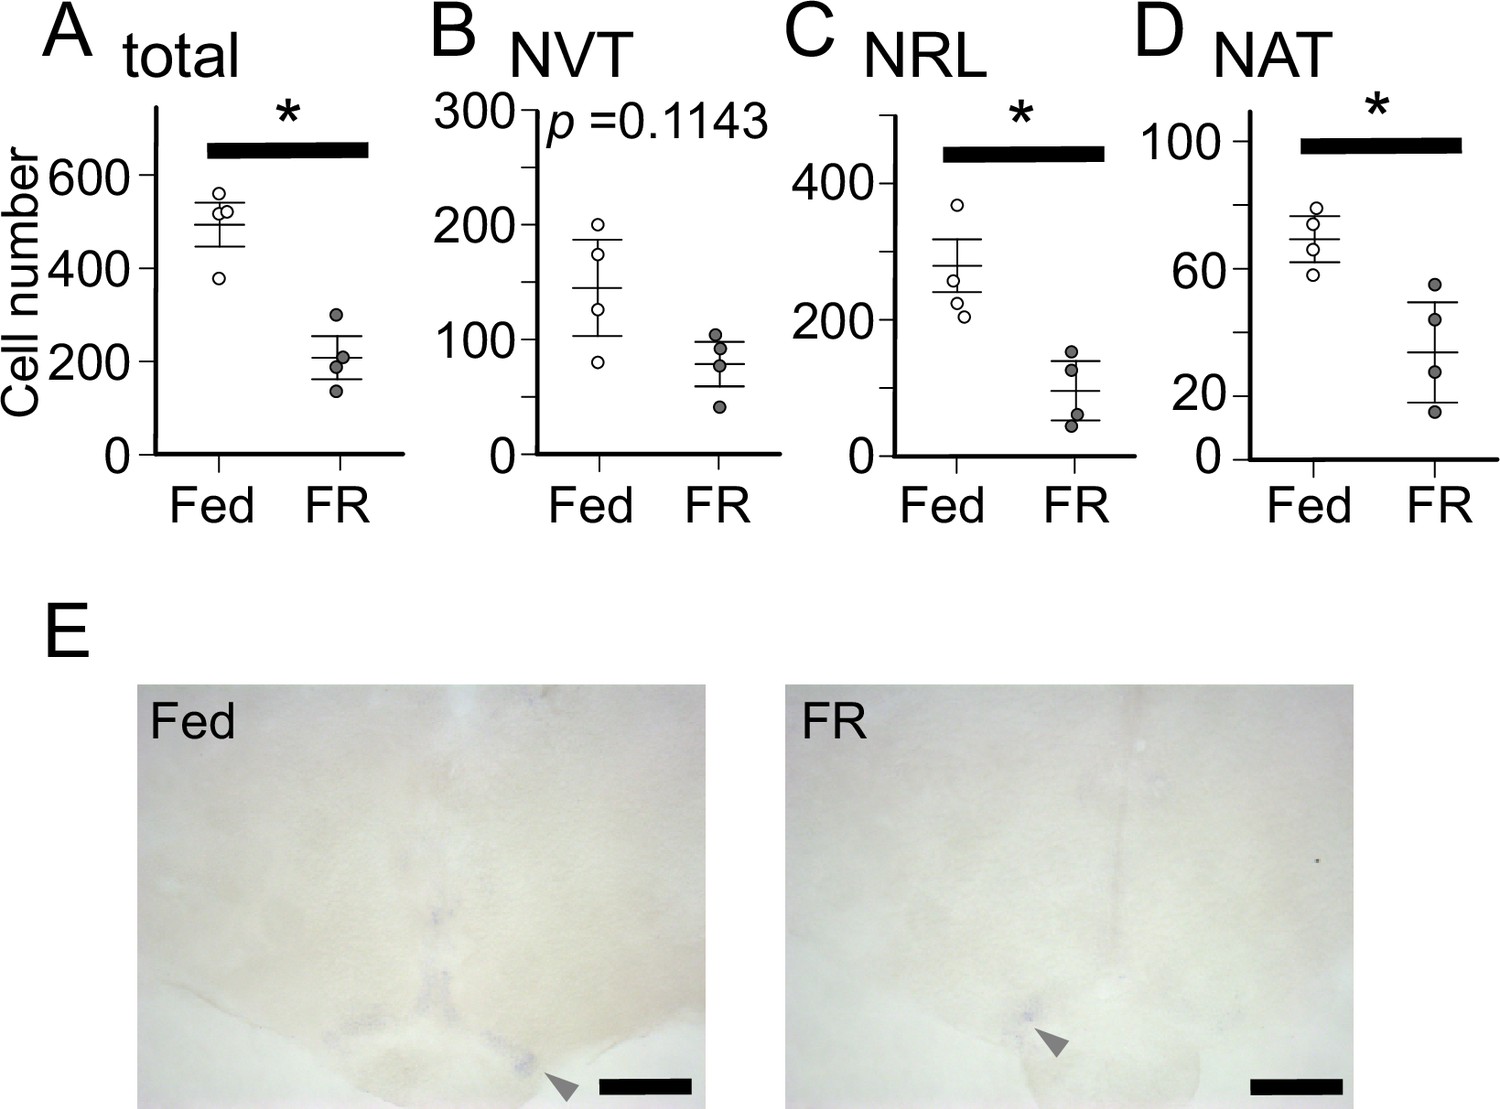
The number of npya-expressing neurons and the expression of agrp2 in the hypothalamus of fed and food-restricted (FR) medaka.
(A) Total number of npya-expressing neurons in the hypothalamus of female medaka under normal fed condition (Fed; white; n=4) or 2 weeks food restriction (FR; gray; n=4). p=0.02857, U=16. (B) The number of npya-expressing neurons in the NVT of female medaka under normal fed condition (Fed; white; n=4) or 2 weeks food restriction (FR; gray; n=4). p=0.1143, U=14. (C) The number of npya-expressing neurons in the NRL of female medaka under normal fed condition (Fed; white; n=4) or 2 weeks food restriction (FR; gray; n=4). p=0.02857, U=16. (D) The number of npya-expressing neurons in the NAT of female medaka under normal fed condition (Fed; white; n=4) or 2 weeks food restriction (FR; gray; n=4). p=0.02857, U=16. Mann–Whitney U test, *p<0.05. (E) agrp2 expression of female medaka under normal fed condition (Fed) or 10 days food restriction (FR). Arrowheads indicate cell bodies of agrp2-expressing neurons. Scale bar: 100 μm.
-
Figure 2—figure supplement 1—source data 1
The numerical data for Figure 2—figure supplement 1.
- https://cdn.elifesciences.org/articles/100996/elife-100996-fig2-figsupp1-data1-v1.xlsx
Figure 3 with 1 supplement
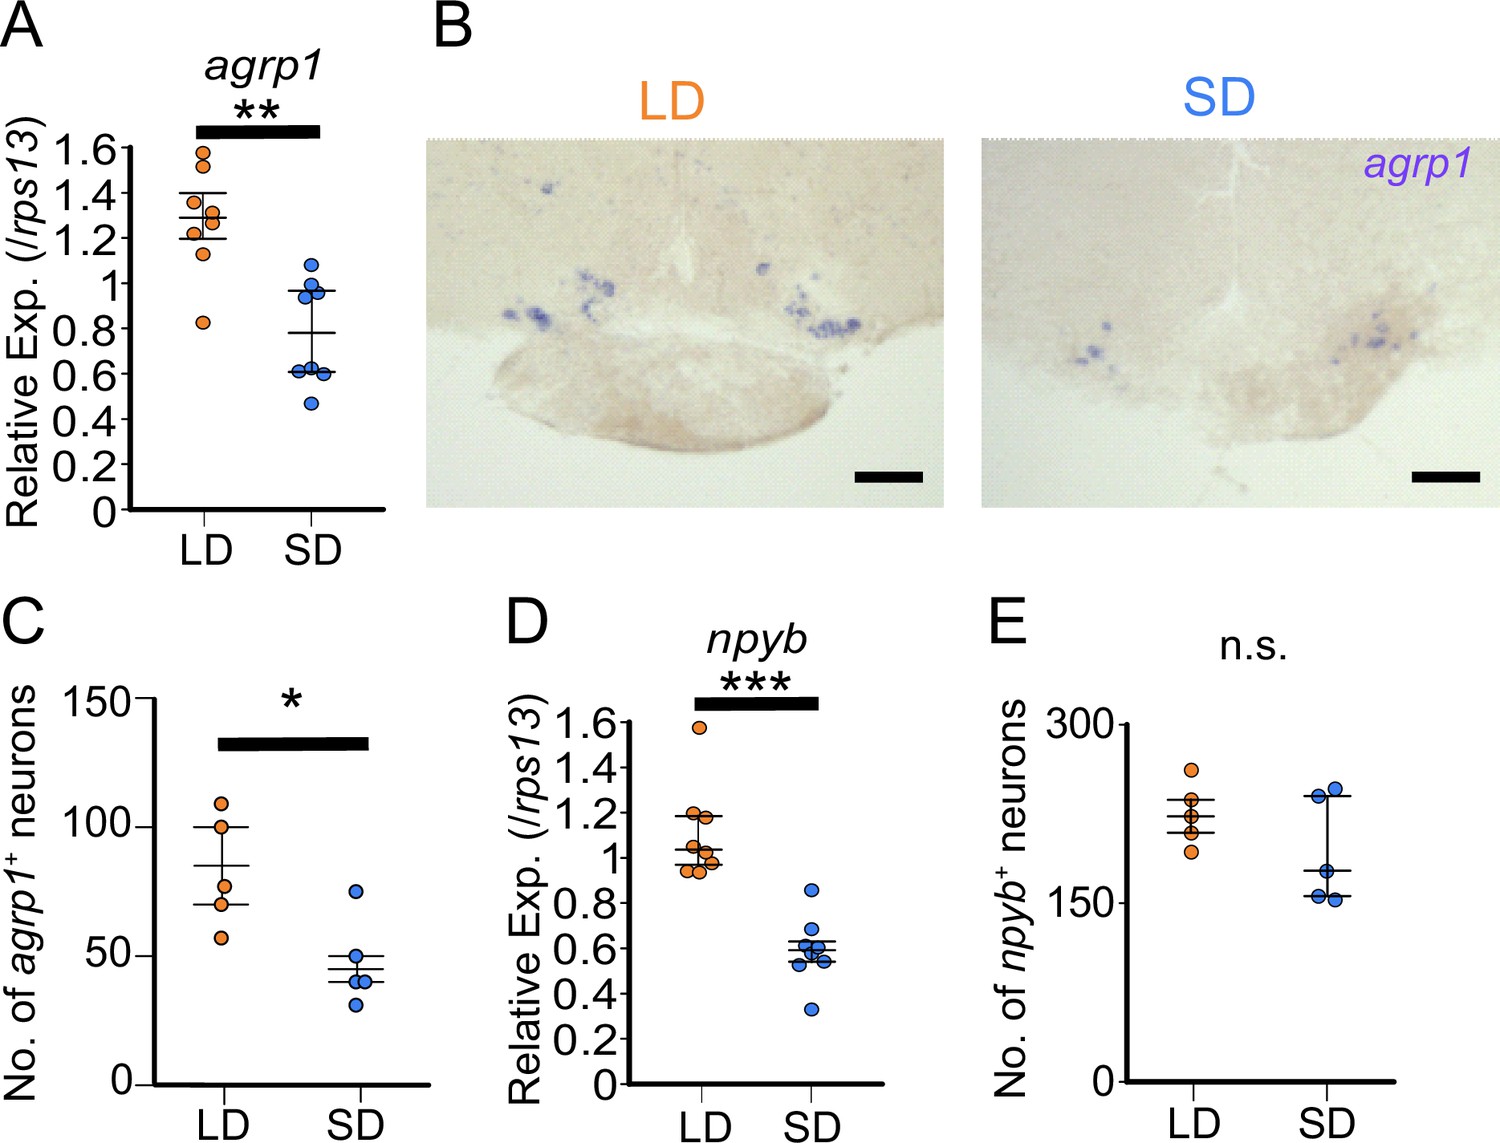
agrp1 and npyb show higher expression levels in long day (LD) than in short day (SD) female.
(A) agrp1 expression in the whole brain of LD (orange; n=8) and SD (blue; n=8) female medaka (p=0.001865, U=60). (B) In situ hybridization (ISH) of agrp1-expressing neurons in LD and SD female medaka. Scale bar: 100 μm. (C) The number of neurons expressing agrp1 in LD (orange; n=5) and SD (blue; n=5) (p=0.02828, U=23). (D) npyb expression in the whole brain of LD (orange; n=8) and SD (blue; n=8) female medaka (p=0.0001554, U=64). (E) The number of neurons expressing npyb in LD (orange; n=5) and SD (blue; n=5) (p=0.4206, U=17). The upper, middle, and lower bars show the third quartile, median, and the first quartile, respectively. Mann–Whitney U test, *p<0.05, **p<0.01, ***p<0.001. n.s., not significant.
-
Figure 3—source data 1
The numerical data for Figure 3.
- https://cdn.elifesciences.org/articles/100996/elife-100996-fig3-data1-v1.xlsx
Figure 3—figure supplement 1

Time course of the number of neurons showing in situ hybridization (ISH) signals for agrp1.
(A) Time course of the number of neurons showing ISH signals for agrp1 at each 30 min time point from the beginning of the chromogenic reaction in long day (LD) (orange; n=5) and short day (SD) (blue; n=5). The positive neurons were counted from 0 min to 300 min after application of NBT/BCIP (see ‘Materials and methods’), and the reaction saturated at 300 min onward. (B) Ratio of cell number at 90 min divided by that at 300 min. The relative cell number was not significantly different between LD and SD (p=0.2948, U=18).
-
Figure 3—figure supplement 1—source data 1
The numerical data for Figure 3—figure supplement 1.
- https://cdn.elifesciences.org/articles/100996/elife-100996-fig3-figsupp1-data1-v1.xlsx
Figure 4 with 1 supplement
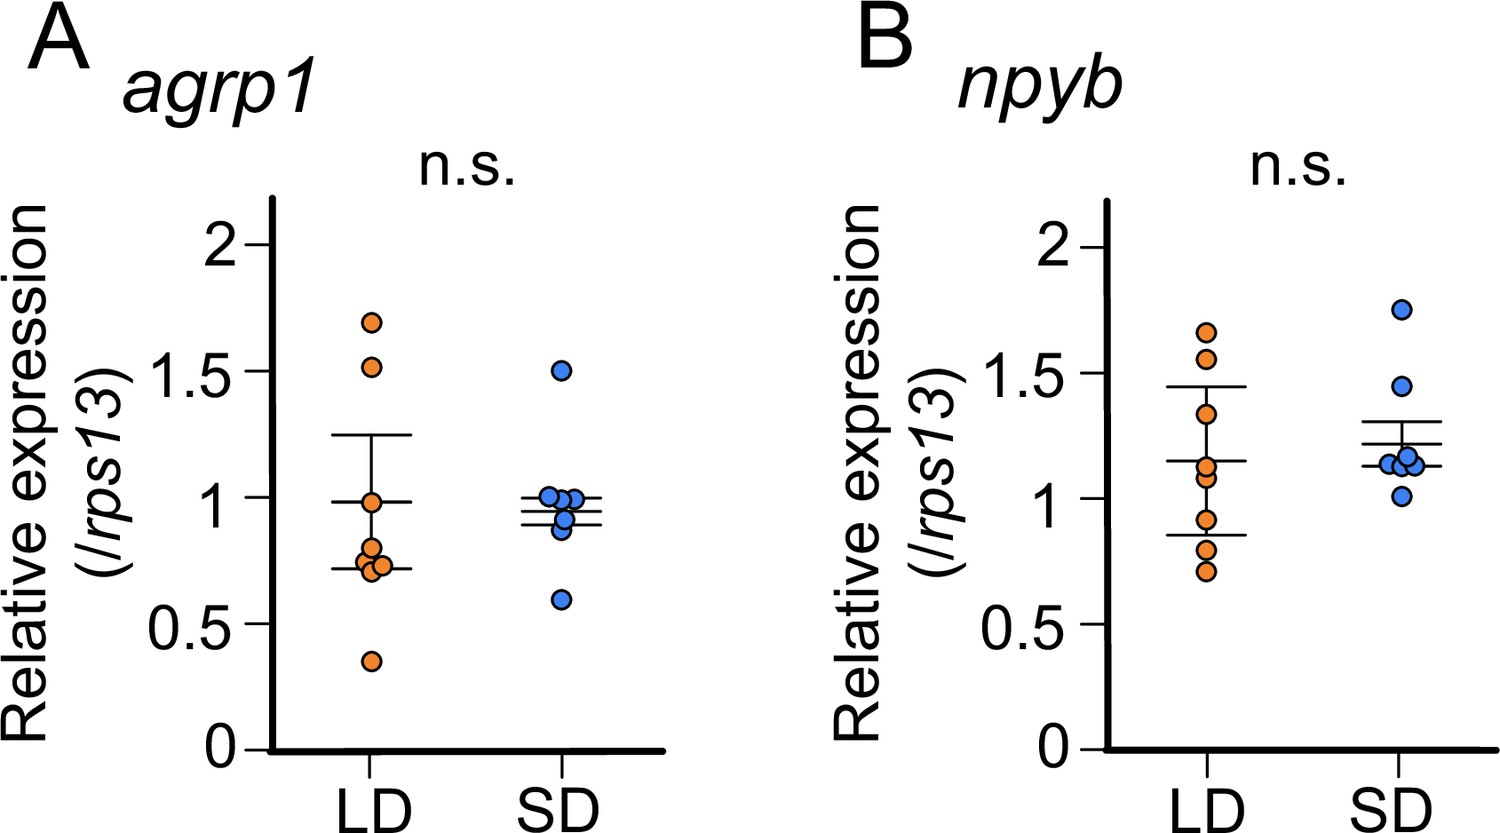
In juvenile female medaka, expression levels of neither agrp1 nor npyb show significant change according to the day-length.
(A) agrp1 expression in the brain of juvenile female medaka (p=0.4179, U=21). (B) npyb expression in the brain of juvenile female medaka (p=0.3357, U=19). Long day (LD): orange, n=8; short day (SD): blue, n=7. The upper, middle, and lower bars show the third quartile, median, and the first quartile, respectively. Mann–Whitney U test. n.s., not significant.
-
Figure 4—source data 1
The numerical data for Figure 4.
- https://cdn.elifesciences.org/articles/100996/elife-100996-fig4-data1-v1.xlsx
Figure 4—figure supplement 1

Food intake of juvenile female does not show significant change according to the day-length.
(A) Method for counting food intake of juvenile. A fish was placed in a white cup containing 50 mL breeding water. After 5 min habituation, 200 µL shrimp water was applied. Fish was picked up 10 min later by a dropper, and its fin was cut for the genotype of sex. The food intake was calculated by subtraction from the number of applied shrimps to that of the leftover shrimps. (B) Food intake of juvenile female medaka in long day (LD) (n=9) and short day (SD) (n=10) conditions. Each food intake was normalized to the average food intake of LD fish (p=0.7197, U=50). Mann–Whitney U test. n.s., not significant.
-
Figure 4—figure supplement 1—source data 1
The numerical data for Figure 4—figure supplement 1.
- https://cdn.elifesciences.org/articles/100996/elife-100996-fig4-figsupp1-data1-v1.xlsx
Figure 5 with 1 supplement

Estrogen, which is secreted from mature ovary, may affect the expression of agrp1.
(A) Relative expression of agrp1 in Sham (white; n=6), OVX (ovariectomized medaka, gray; n=6), and OVX+E (OVX medaka kept in the tank containing E2, yellow; n=7). Sham vs OVX: p=0.04310, OVX vs OVX+E: p=0.05790, Sham vs OVX+E: p=0.2000. (B) Relative expression of npyb in Sham, OVX, and OVX+E. Sham vs OVX: p=0.1386, OVX vs OVX+E: p=0.9991, Sham vs OVX+E: p=0.08120. The upper, middle, and lower bars show the third quartile, median, and the first quartile, respectively. Steel–Dwass test, *p<0.05. n.s., not significant. (C) Photographs of brain slices after experiments of double in situ hybridization (agrp1 [green] and estrogen receptors [magenta]). (D) Expanded photograph of agrp1 and esr2a co-expressing neurons (white arrowhead). Scale bars: 50 µm.
-
Figure 5—source data 1
The numerical data for Figure 5.
- https://cdn.elifesciences.org/articles/100996/elife-100996-fig5-data1-v1.xlsx
Figure 5—figure supplement 1
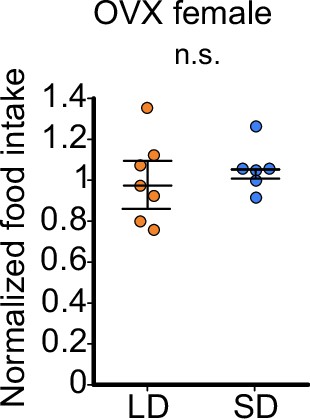
Food intake of OVX female does not show significant change according to the day-length.
Food intake of OVX female medaka in long day (LD) (n=7) or short day (SD) (n=6) conditions. Food intake was normalized to the average food intake of LD fish (p=0.7308, U=18). Mann–Whitney U test. n.s., not significant.
-
Figure 5—figure supplement 1—source data 1
The numerical data for Figure 5—figure supplement 1.
- https://cdn.elifesciences.org/articles/100996/elife-100996-fig5-figsupp1-data1-v1.xlsx
Figure 6 with 2 supplements

agrp1−/− female medaka show decrease in food intake and the number of fertilized eggs.
(A) Lateral views of representative agrp1+/+ and agrp1−/− female medaka (left), and body weight, body length, and abdominal height (right) of agrp1+/+ (white; n=6) and agrp1−/− (gray; n=6). All the fish are 4-month-old adult medaka. Scale bar: 1 cm. body weight: p=0.04113, U=31; body length: p=0.3939, U=24; abdominal height: p=0.002165, U=36. (B) Food intake (10 min) of agrp1+/+ (white; n=6) and agrp1−/− (gray; n=6) female medaka. Each amount of food intake is normalized by the average number of that of agrp1+/+ medaka (p=0.004329, U=35). (C) Food intake (10 min) of LD agrp1−/− (white; n=9) and SD agrp1−/− (gray; n=7) female medaka. Each amount of food intake is normalized by the average number of that of LD agrp1−/− medaka (p=0.5953, U=37). (D) The number of eggs spawned by agrp1+/+ (white; n=6) and agrp1−/− (gray; n=5) female medaka in a day. Each female was paired with a wildtype male (p=0.008658, U=28.5). (E) Photograph of ovary in representative agrp1+/+ and agrp1−/− female (left) and the gonado-somatic index (GSI, right). n=6 of each group (p=0.06494, U=30). Scale bar: 1 mm. (F) Expression of gonadotropin genes (lhb and fshb) in the pituitary of agrp1+/+ (white; n=6) and agrp1−/− (gray; n=6) female medaka. lhb: (p=0.008658, U=34); fshb: (p=0.02597, U=32). The upper, middle, and lower bars show the third quartile, median, and the first quartile, respectively. Mann–Whitney U test, *p<0.05, **p<0.01. n.s., not significant.
-
Figure 6—source data 1
The numerical data for Figure 6.
- https://cdn.elifesciences.org/articles/100996/elife-100996-fig6-data1-v1.xlsx
Figure 6—figure supplement 1
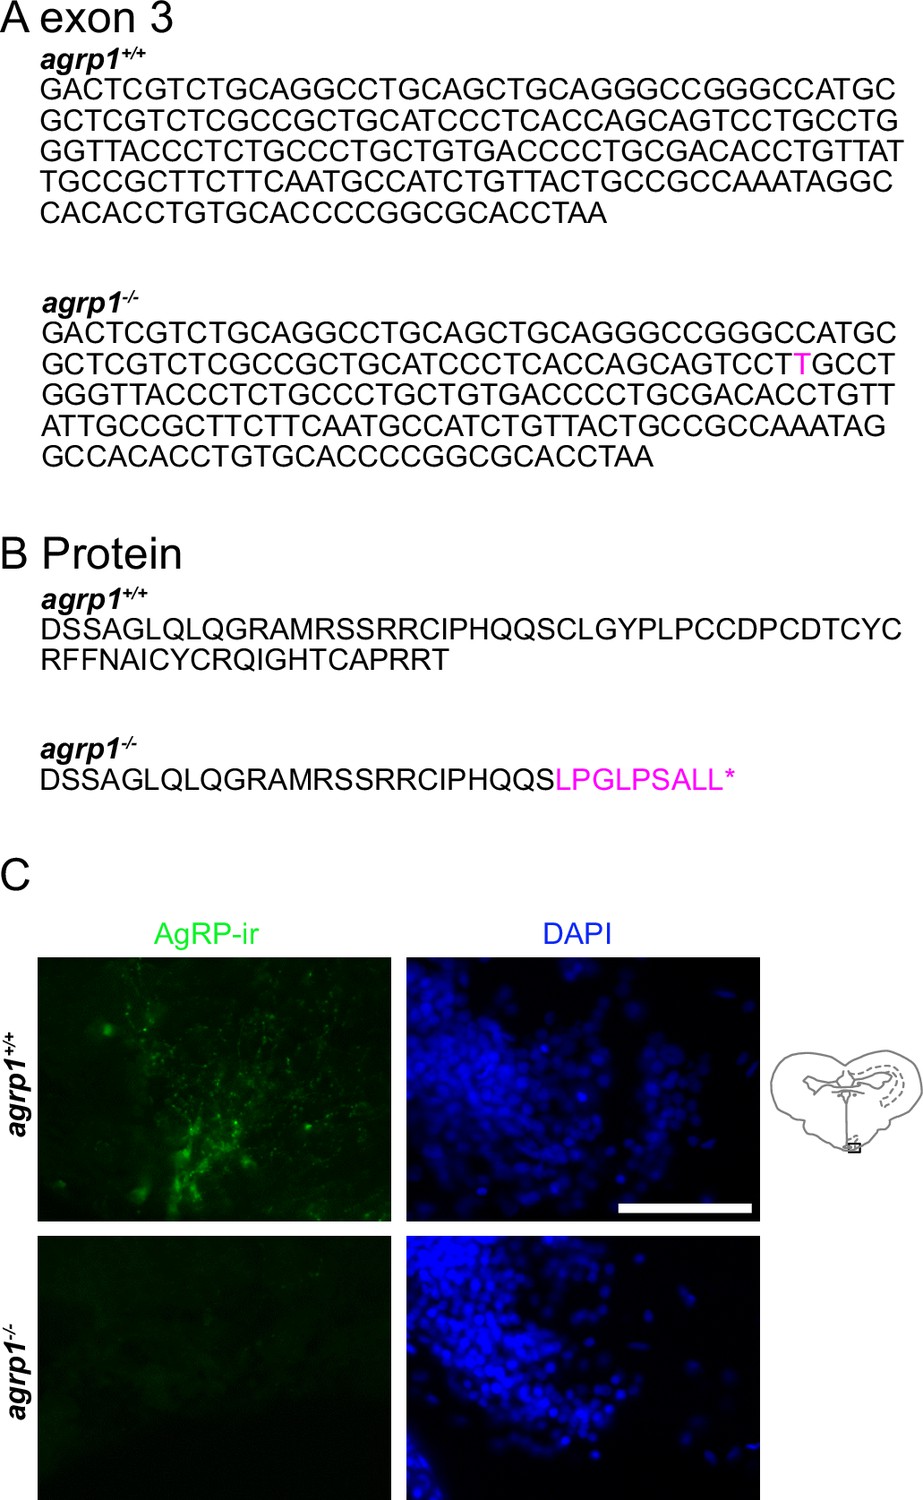
Mutation site of agrp1 knockout medaka.
(A) The DNA sequence of WT (agrp1 +/+) and mutated (agrp1−/−) exon3 of agrp1 gene. The nucleotide indicated with magenta represents an insertion. (B) The predicted amino acid sequence of agrp1 +/+ and agrp1−/−. Mutated amino acids are indicated with magenta. (C) AgRP1 immunoreactive signals were found in WT female brain but not in agrp1−/− one. Upper row: WT, lower row: agrp1−/−. Green: AgRP1 immunoreactive signals; blue: nuclei (DAPI). Scale bar: 50 µm.
Figure 6—figure supplement 2
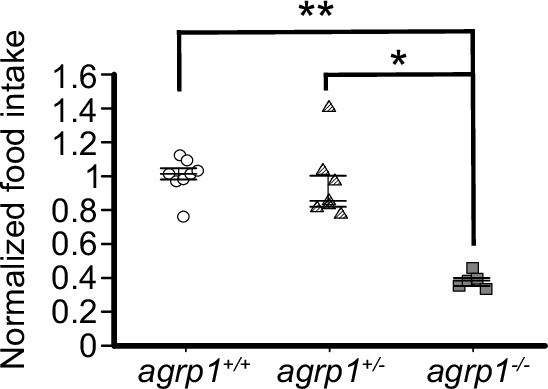
Food intake of WT, agrp1 hetero, and homo knockout medaka.
Food intake of WT (agrp1 +/+, n=8), hetero (agrp1+/−, n=7), and homo knockout (agrp1−/−, n=5) female medaka. agrp1 +/+ vs agrp1−/+: p=0.5470, agrp1 +/+ vs agrp1−/−: p=0.009353, agrp1−/+ vs agrp1−/−: p=0.01234. The upper, middle, and lower bars show the third quartile, median, and the first quartile, respectively. Steel–Dwass test, *p<0.05, **p<0.01. n.s., not significant.
-
Figure 6—figure supplement 2—source data 1
The numerical data for Figure 6—figure supplement 2.
- https://cdn.elifesciences.org/articles/100996/elife-100996-fig6-figsupp2-data1-v1.xlsx
Figure 7
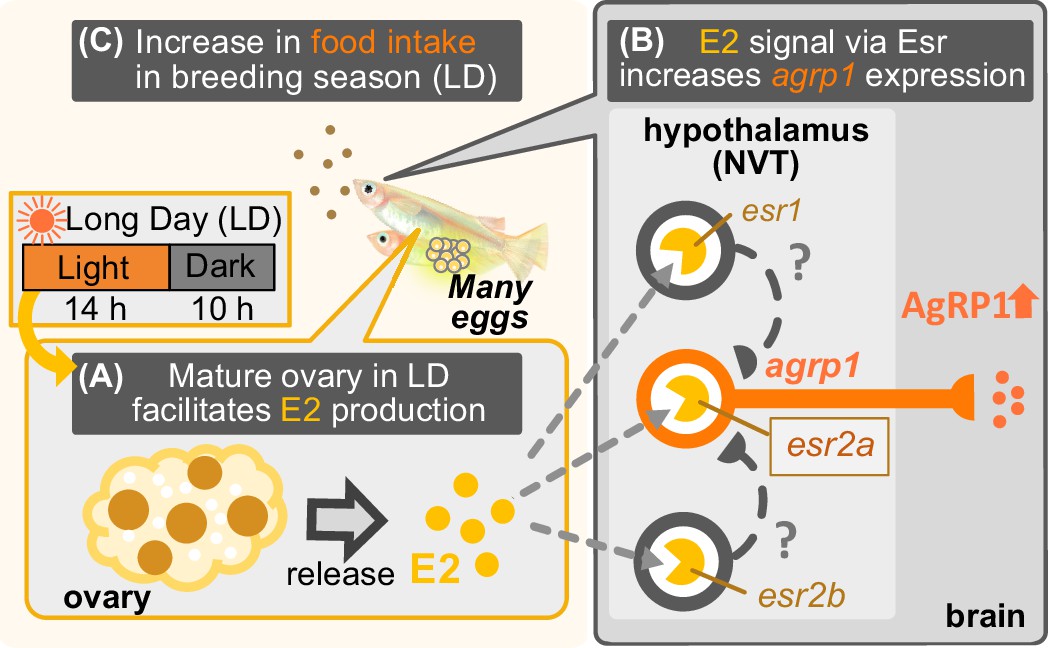
Illustration of mechanisms of breeding season-dependent feeding behavior in medaka suggested by the present study.
(A) Long day (LD) condition in the breeding season induces ovarian maturation, which facilitates release of estrogen (E2) from the mature ovary. (B) High concentration of serum E2 increases agrp1 expression in the brain via the estrogen receptors, especially, esr2a. (C) Higher expression of AgRP1 is suggested to activate neural circuitry for feeding, which leads to an increase in food intake and egg spawning of female medaka in the breeding season.
Additional files
Download links
A two-part list of links to download the article, or parts of the article, in various formats.
Downloads (link to download the article as PDF)
Open citations (links to open the citations from this article in various online reference manager services)
Cite this article (links to download the citations from this article in formats compatible with various reference manager tools)
AgRP1 modulates breeding season-dependent feeding behavior in female medaka
eLife 13:RP100996.
https://doi.org/10.7554/eLife.100996.3


