Molecular mapping and functional validation of GLP-1R cholesterol binding sites in pancreatic beta cells
- Section of Cell Biology and Functional Genomics, Division of Diabetes, Endocrinology and Metabolism, Department of Metabolism, Digestion and Reproduction, Imperial College London, United Kingdom
- Department of Life Sciences, Imperial College London, United Kingdom
- Section of Investigative Medicine, Division of Diabetes, Endocrinology and Metabolism, Department of Metabolism, Digestion and Reproduction, Imperial College London, United Kingdom
- Department of Medical Cell Biology, University of Uppsala, Sweden
- National Heart and Lung Institute, Imperial College London, United Kingdom
Figures
Figure 1 with 1 supplement
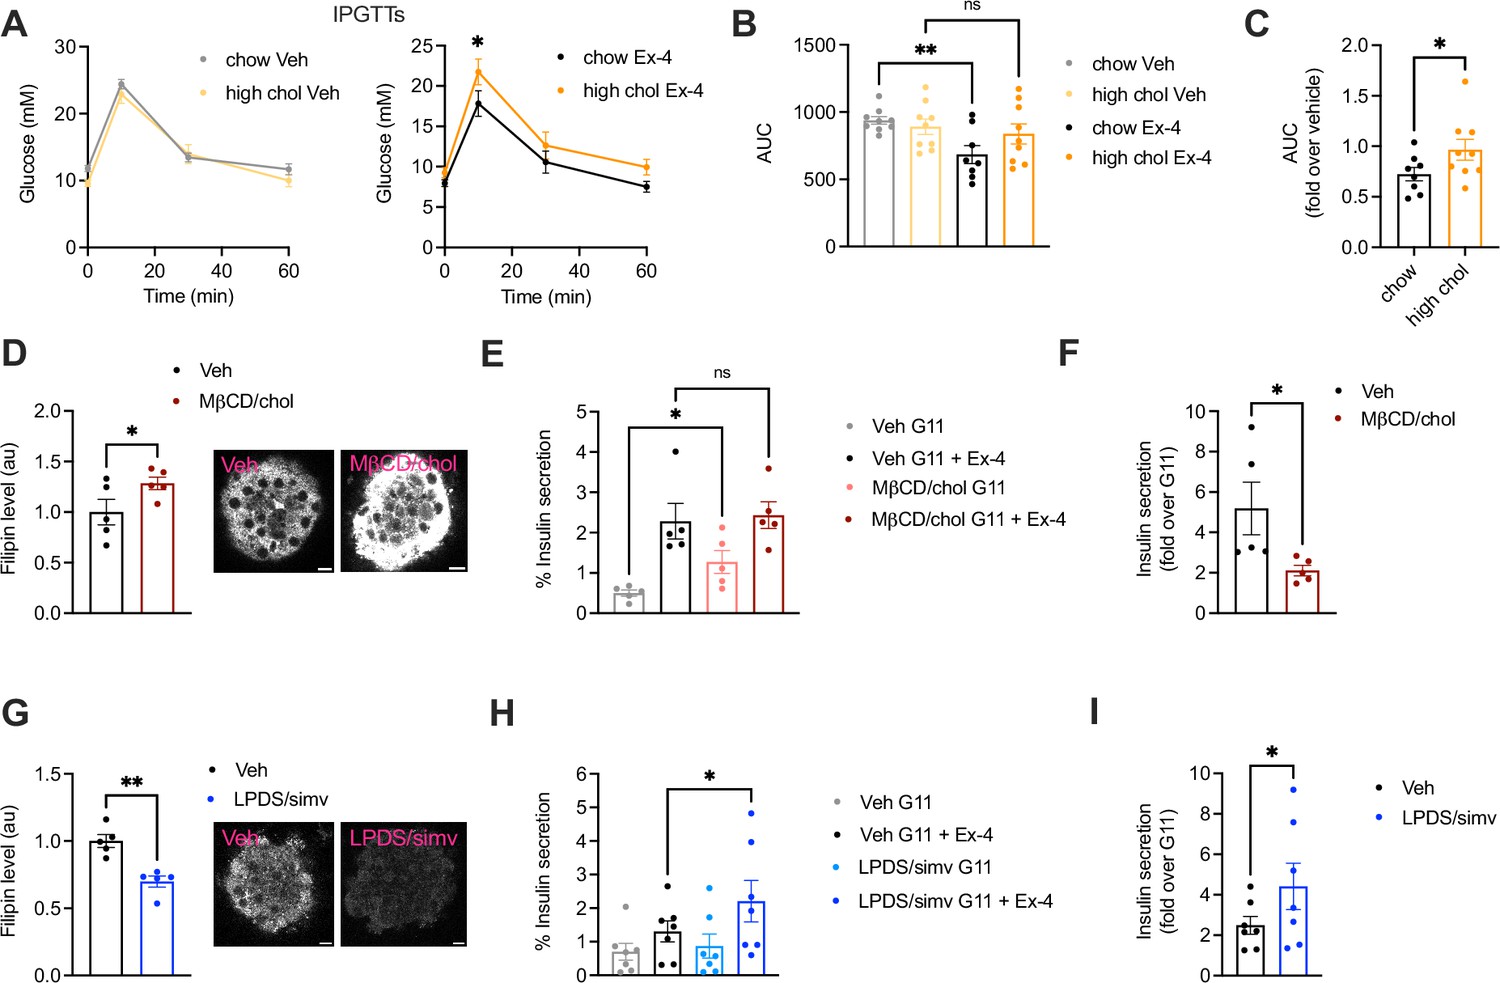
Effect of changes in cholesterol on glucagon-like peptide-1 receptor (GLP-1R) agonist responses in vivo and in primary islets.
(A) Intraperitoneal glucose tolerance tests (IPGTTs) 6 hr post-intraperitoneal administration of vehicle (Veh) or 1 nmol/kg exendin-4 (Ex-4) in mice fed a chow vs 2% cholesterol (high chol) diet for 5 wk; n=8–9 female mice per diet. (B) Area under the curve (AUC) for glucose curves from (A). (C) Ex-4 over Veh glucose levels in chow vs 2% cholesterol diet fed mice. (D) Average intensity of filipin staining (to label cholesterol) in mouse islets preincubated with Veh or methyl-β-cyclodextrin (MβCD) loaded with 20 mM cholesterol (MβCD/chol) for 1 hr; n=5 islet preps from separate mice; representative islet images also shown; size bars, 10 μm. (E) Percentage of insulin secretion from mouse islets preincubated with Veh or MβCD/chol before stimulation with 11 mM glucose (G11) +/-100 nM Ex-4; n=5. (F) Ex-4-induced insulin secretion (fold over G11) in mouse islets from (E). (G) Average filipin staining in mouse islets preincubated with Veh or lipoprotein-deficient serum (LPDS) media supplemented with 10 µM simvastatin (LPDS/simv) overnight; n=5 islet preps from separate mice; representative islet images also shown; size bars, 10 μm. (H) Percentage of insulin secretion from mouse islets preincubated with Veh or LPDS/simv before stimulation with G11 +/-100 nM Ex-4; n=7. (I) Ex-4-induced insulin secretion (fold over G11) in mouse islets from (H). Data is mean +/- SEM; ns, non-significant, *p<0.05, **p<0.01 by paired t-test or one-way ANOVA with Sidak’s multiple comparison test.
Figure 1—figure supplement 1
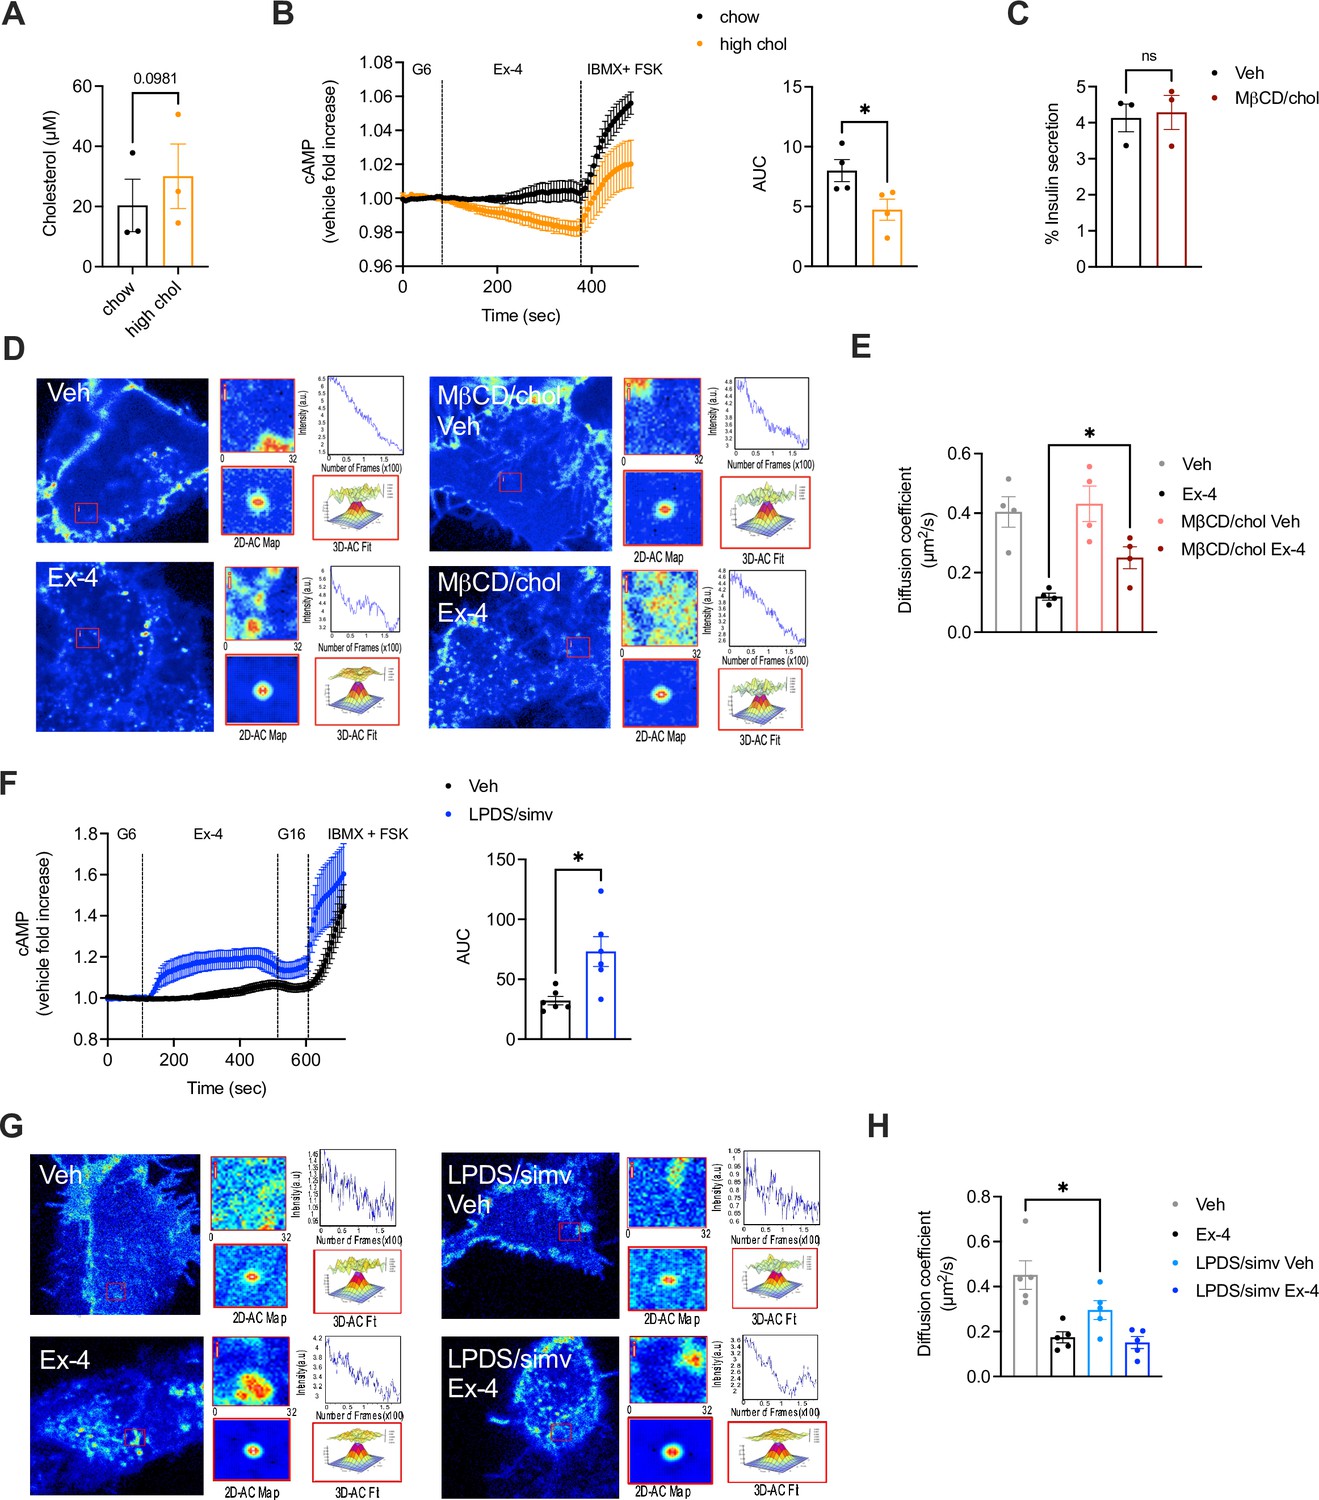
Effect of changes in cholesterol on glucagon-like peptide-1 receptor (GLP-1R) agonist responses in primary islets - contd.
(A) Cholesterol levels in islets extracted from mice fed a chow vs high cholesterol (high chol) diet for 5 wk; n=3. (B) cAMP responses in islets isolated from chow vs high cholesterol (high chol) diet fed mice transduced with Green Up cADDis biosensor and stimulated with 100 nM exendin-4 (Ex-4) in 6 mM glucose (G6) media followed by 100 μM isobutyl methylxanthine (IBMX) +10 µM Forskolin (FSK) for maximal response; area under the curve (AUC) for Ex-4 stimulation period shown; n=4. (C) Percentage of insulin secretion from mouse islets preincubated with Veh or methyl-β-cyclodextrin (MβCD) loaded with 20 mM cholesterol (MβCD/chol) for 1 hr before stimulation with a secretagogue cocktail (20 mM glucose, 30 mM KCl, 10 µM FSK and 100 µM IBMX) for 30 min; n=3. (D) Representative images from raster image correlation spectroscopy (RICS) analysis of GLP-1R plasma membrane lateral diffusion in INS-1 832/3 SNAP/FLAG-hGLP-1R cells preincubated with Veh or MβCD/chol for 1 hr before labelling with SNAP-Surface Alexa Fluor 647 and stimulation with Veh or 100 nM Ex-4. (E) Average RICS diffusion coefficient in cells from (D) (n=4). (F) cAMP responses in islets isolated from Pdx1Cre-ERT CAMPER mice (expressing the cAMP reporter TEPACVV in beta cells) (Bitsi et al., 2023) preincubated with control (Veh) or lipoprotein-deficient serum (LPDS) media supplemented with 10 µM simvastatin (LPDS/simv) overnight and stimulated with 100 nM Ex-4 in G6 followed by 16 mM glucose (G16) and 100 μM IBMX +10 µM FSK for maximal response; AUC for Ex-4 stimulation period shown; n=6. (G) Representative images from RICS analysis of GLP-1R plasma membrane lateral diffusion in INS-1 832/3 SNAP/FLAG-hGLP-1R cells preincubated with Veh or LPDS/simv media overnight before labelling with SNAP-Surface Alexa Fluor 647 and stimulation with Veh or 100 nM Ex-4. (H) Average RICS diffusion coefficient in cells from (G) (n=5). Data is mean +/- SEM; *p<0.05 by paired t-test or one-way ANOVA with Sidak’s multiple comparison test.
Figure 2

cgMD simulations of glucagon-like peptide-1 receptor (GLP-1R) – cholesterol binding sites in model membranes.
(A) Overview of the simulation setup - GLP-1R is embedded in a model mammalian plasma membrane with the following composition: POPC (30%), DOPC (30%), POPE (8%), DOPE (7%), and cholesterol (25%) in the upper leaflet, and POPC (5%), DOPC (5%), POPE (20%), DOPE (20%), POPS (8%), DOPS (7%), PIP2 (10%), and cholesterol (10%) in the lower leaflet. (B) Average cholesterol occupancy profile in active (left) and inactive (right) GLP-1R states shown as a heatmap (red – highest occupancy; blue – lowest occupancy), with the top 10 highest occupancy residues per state labelled. (C) Snake plot showing the top 30 highest cholesterol occupancy residues in active and inactive states, with colours indicating occupancy levels (top 10 – red; top 20 – pink; top 30 – orange). (D) Top three cholesterol binding sites in GLP-1R active (top) vs inactive (bottom) states, calculated using PyLipID. Binding sites are colour-coded as follows: site I - purple in active and cyan in inactive state; site II - orange; site III - green, with the top 3 residues with the highest residence time in each site labelled and average residence time indicated for each site. (E) GLP-1R snake plot indicating residues from top three cholesterol binding sites in both states using the same colour scheme as in (D). (F) GLP-1R snake plot indicating the 12 residues selected for screening, with the 4 residues showing a significant reduction in GLP-1R internalisation when mutated to alanine (see H) coloured in red, and the remaining residues in green. (G) Table showing the predicted structural impact of the 12 selected residues after site-directed mutagenesis to alanine in active vs inactive GLP-1R using Missense3D-TM (Hanna et al., 2024). (H) Surface expression and exendin-4 (100 nM, 10 min) mediated internalisation screen of the 12 selected residues from GLP-1R-cholesterol binding sites mutated to alanine, transiently transfected in INS-1 832/3 GLP-1R KO cells; n=4–5. Data is mean +/- SEM, *p<0.05, **p<0.01 by one way ANOVA with Dunnett’s multiple comparison test vs corresponding wild-type (WT) SNAP/FLAG-hGLP-1R.
Figure 3 with 1 supplement
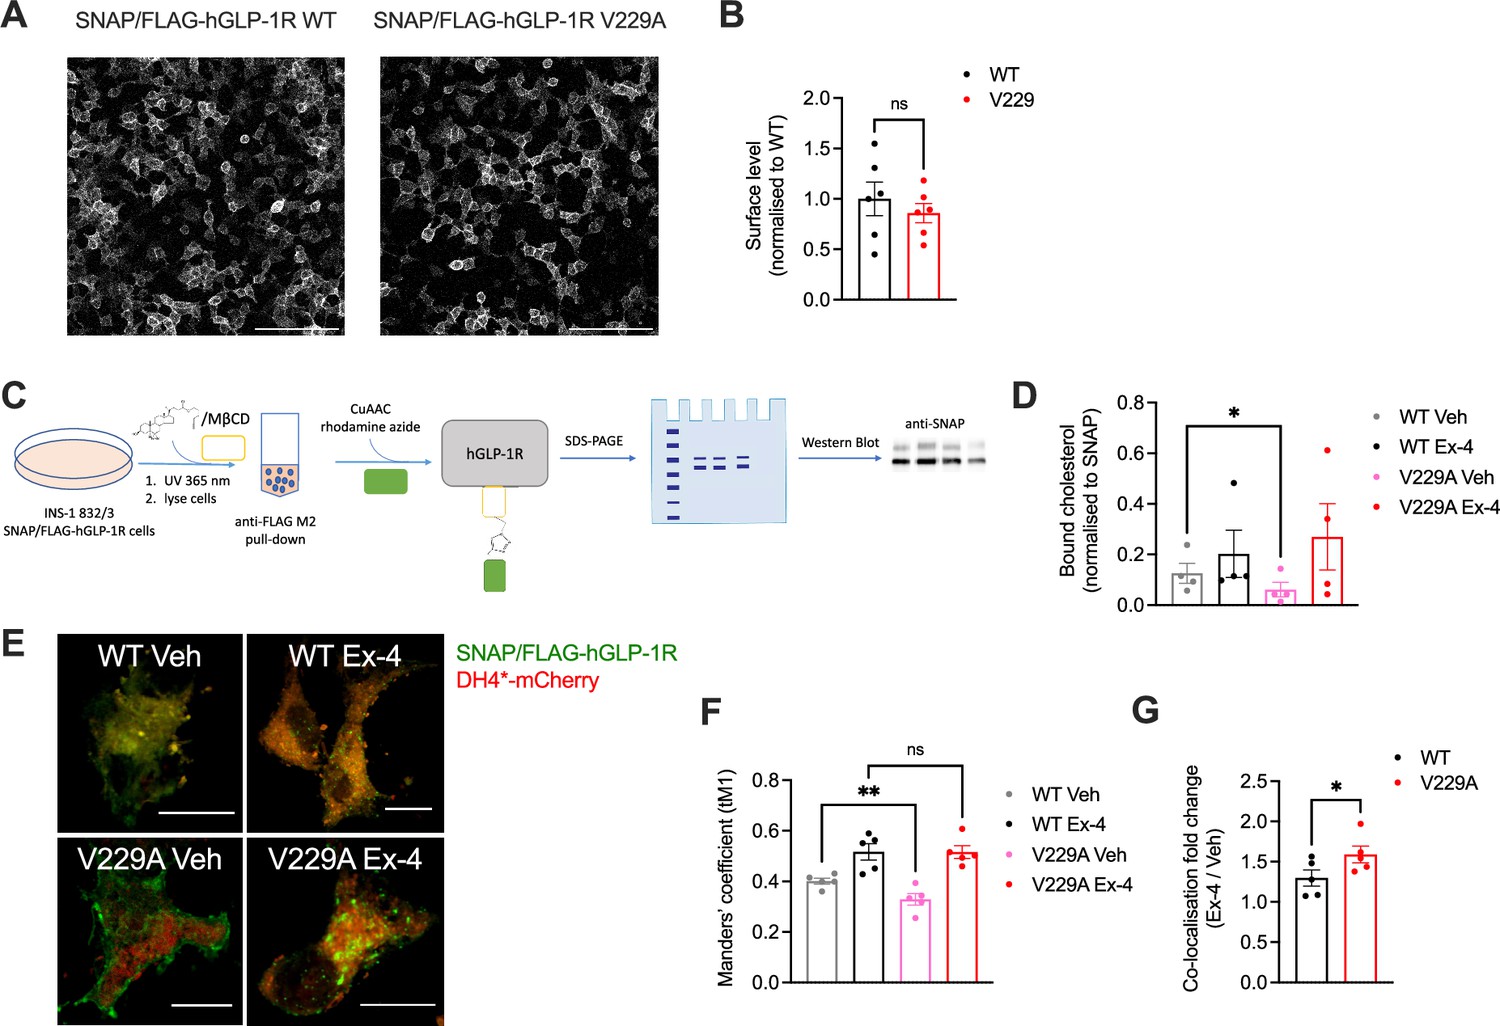
Glucagon-like peptide-1 receptor (GLP-1R) wild-type (WT) vs V229A cholesterol binding propensity.
(A) Representative images of INS-1 832/3 SNAP/FLAG-hGLP-1R WT or V229A sublines labelled with SNAP-Surface Alexa Fluor 647; size bars, 100 µm. (B) Surface expression of SNAP/FLAG-hGLP-1R WT vs V229A; n=6. (C) Schematic diagram of the GLP-1R PhotoClick cholesterol binding assay. (D) SNAP/FLAG-hGLP-1R-bound cholesterol normalised to receptor levels in INS-1 832/3 SNAP/FLAG-hGLP-1R WT or V229A treated with vehicle (Veh) or 100 nM exendin-4 (Ex-4) for 2 min; n=4. (E) Representative images of INS-1 832/3 SNAP/FLAG-hGLP-1R WT vs V229A cells labelled with SNAP-Surface 488 (green) and stimulated with Veh vs Ex-4 for 2 min prior to fixation and labelling with D4H*-mCherry (red); size bars, 5 µm. (F) Quantification of co-localisation (Mander’s tM1) between SNAP/FLAG-hGLP-1R WT or V229A and D4H*-mCherry in cells from (E); n=5. (G) Ex-4 over Veh co-localisation fold change for WT vs V229A SNAP/FLAG-hGLP-1R; n=5. Data is mean +/- SEM, ns, non-significant, *p<0.05, **p<0.01 by paired t-test or one-way ANOVA with Sidak’s multiple comparison test.
Figure 3—figure supplement 1
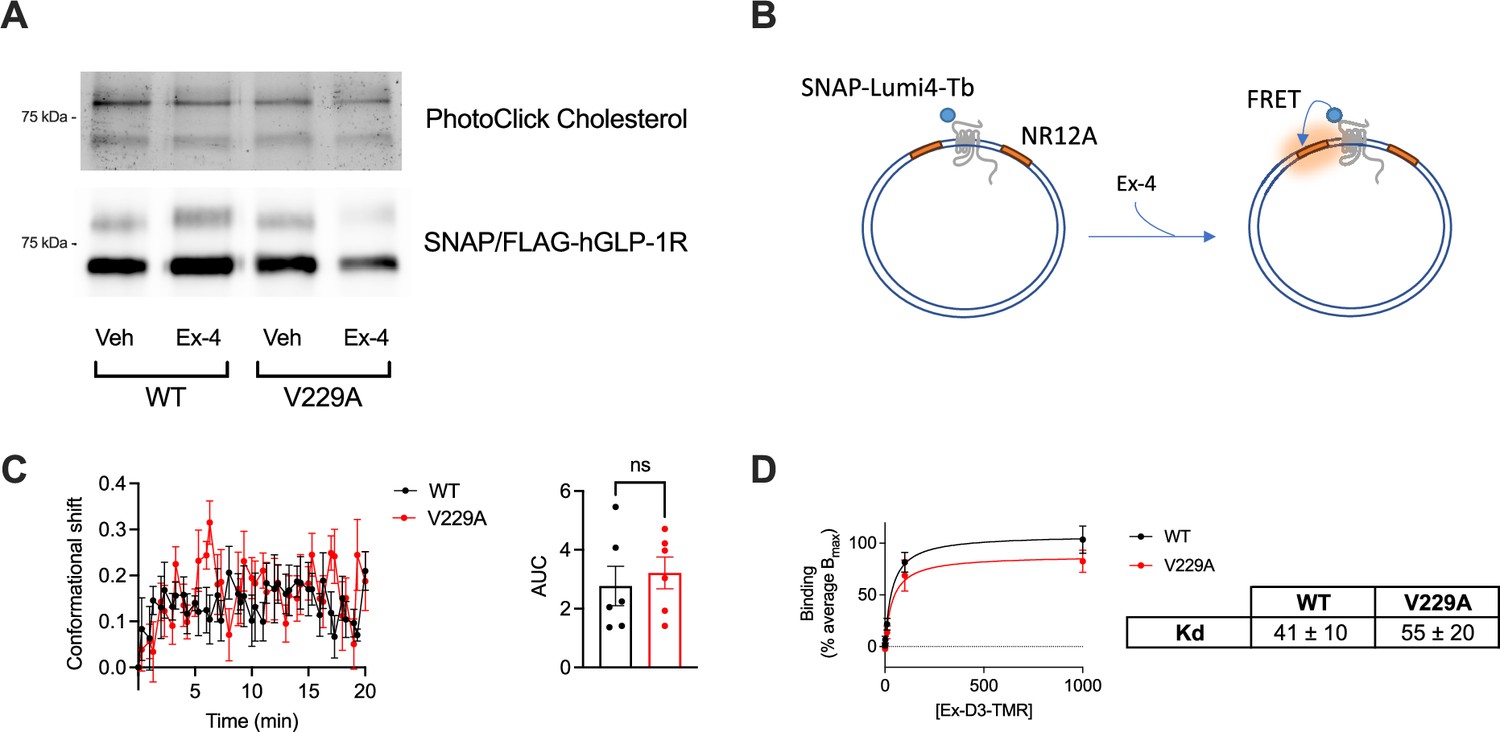
Glucagon-like peptide-1 receptor (GLP-1R) wild-type (WT) vs V229A cholesterol binding, and conformational shift - contd.
(A) Representative images of bound PhotoClick cholesterol and corresponding SNAP Western blot from SNAP/FLAG-hGLP-1R WT or V229A immunoprecipitation samples; vehicle (Veh), exendin-4 (Ex-4). (B) Schematic diagram of GLP-1R conformational shift assay. (C) Average conformational shift in response to 100 nM Ex-4 stimulation in INS-1 832/3 SNAP/FLAG-hGLP-1R WT vs V229A; area under the curve (AUC) of conformational shift response shown; n=6. (D) Binding affinity to exendin-asp3-TMR (Ex-D3-TMR) in INS-1 832/3 SNAP/FLAG-hGLP-1R WT vs V229A; Kd values shown; n=5. Data is mean +/- SEM; ns, not significant using paired t-test.
-
Figure 3—figure supplement 1—source data 1
PDF file containing original western blots for Figure 3—figure supplement 1A, indicating the relevant bands and treatments.
- https://cdn.elifesciences.org/articles/101011/elife-101011-fig3-figsupp1-data1-v1.pdf
-
Figure 3—figure supplement 1—source data 2
Original files for western blot analysis displayed in Figure 3—figure supplement 1A.
- https://cdn.elifesciences.org/articles/101011/elife-101011-fig3-figsupp1-data2-v1.zip
Figure 4 with 1 supplement
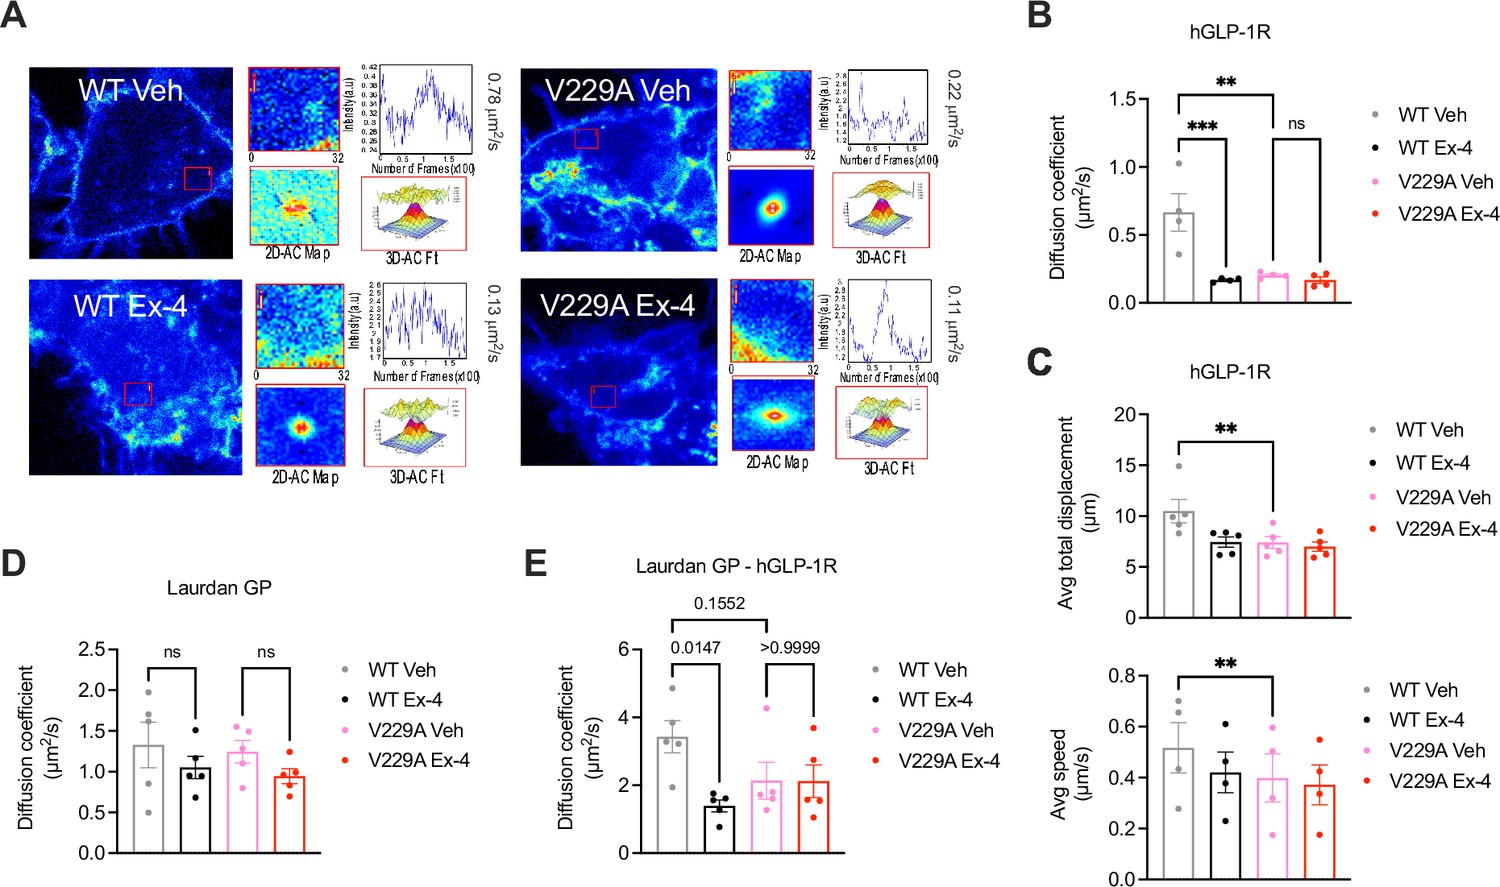
Glucagon-like peptide-1 receptor (GLP-1R) wild-type (WT) vs V229A movement at the plasma membrane.
(A) Representative images from GLP-1R WT vs V229A raster image correlation spectroscopy (RICS) analysis of plasma membrane lateral diffusion in INS-1 832/3 SNAP/FLAG-hGLP-1R WT or V229A cells labelled with SNAP-Surface Alexa Fluor 647 before stimulation with vehicle (Veh) or 100 nM exendin-4 (Ex-4). (B) Average RICS diffusion coefficients from GLP-1R WT vs V229A from (A); n=4. (C) TIRF-SPT analysis of average total displacement (top) and speed (bottom) of GLP-1R WT vs V229A under Veh or Ex-4-stimulated conditions in INS-1 832/3 GLP-1R KO cells expressing hGLP-1R-mEGFP WT vs V229A; n=4 for total displacement and n=5 for speed. (D) Average RICS diffusion coefficients of plasma membrane lipid-ordered nanodomains (measured as changes in membrane fluidity/lipid packing assessed by Laurdan GP values) in INS-1 832/3 SNAP/FLAG-hGLP-1R WT vs V229A cells under Veh or Ex-4-stimulated conditions; n=5. (E) Average diffusion coefficient from RICCS analysis of SNAP-Surface Alexa Fluor 647-labelled SNAP/FLAG-hGLP-1R WT vs V229A with lipid-ordered nanodomains assessed as in (D) under Veh or Ex-4-stimulated conditions in INS-1 832/3 SNAP/FLAG-hGLP-1R WT vs V229A cells; n=5. Data is mean +/- SEM; ns, non-significant, **p<0.01, ***p<0.001 by one-way ANOVA with Sidak’s multiple comparison test.
Figure 4—figure supplement 1
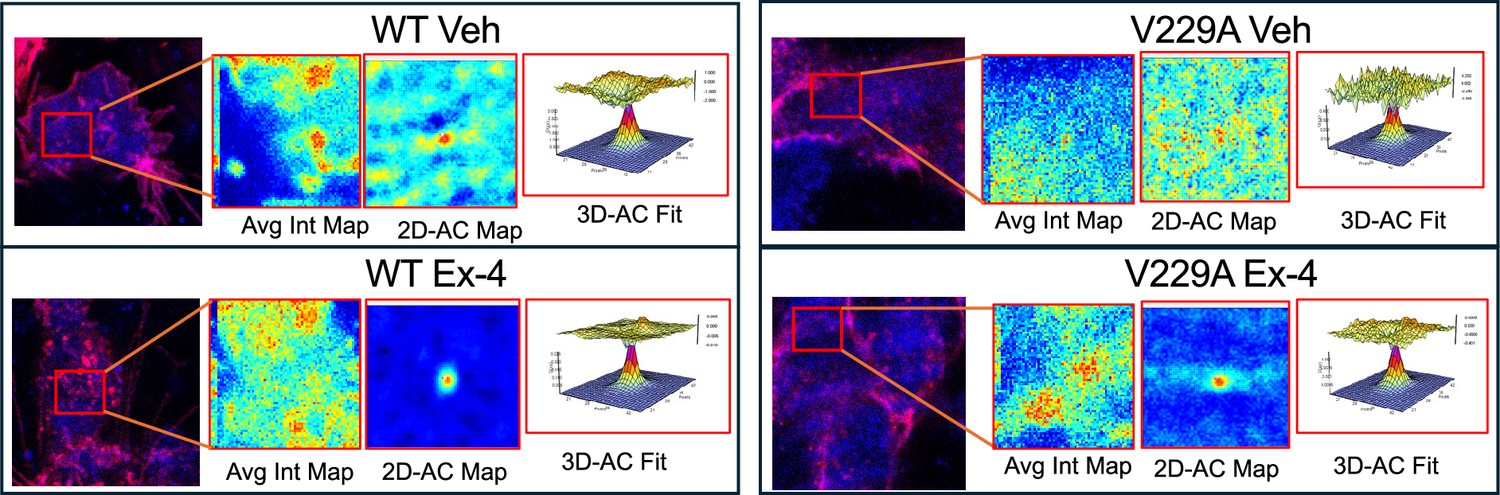
glucagon-like peptide-1 receptor (GLP-1R) wild-type (WT) vs V229A lipid cross-correlation - contd.
Representative images from GLP-1R WT vs V229A raster image cross-correlation spectroscopy (RICCS) analysis of plasma membrane lateral diffusion in INS-1 832/3 SNAP/FLAG-hGLP-1R WT or V229A cells labelled with SNAP-Surface Alexa Fluor 647 (red) and Laurdan (blue) before stimulation with vehicle (Veh) or 100 nM exendin-4 (Ex-4).
Figure 5
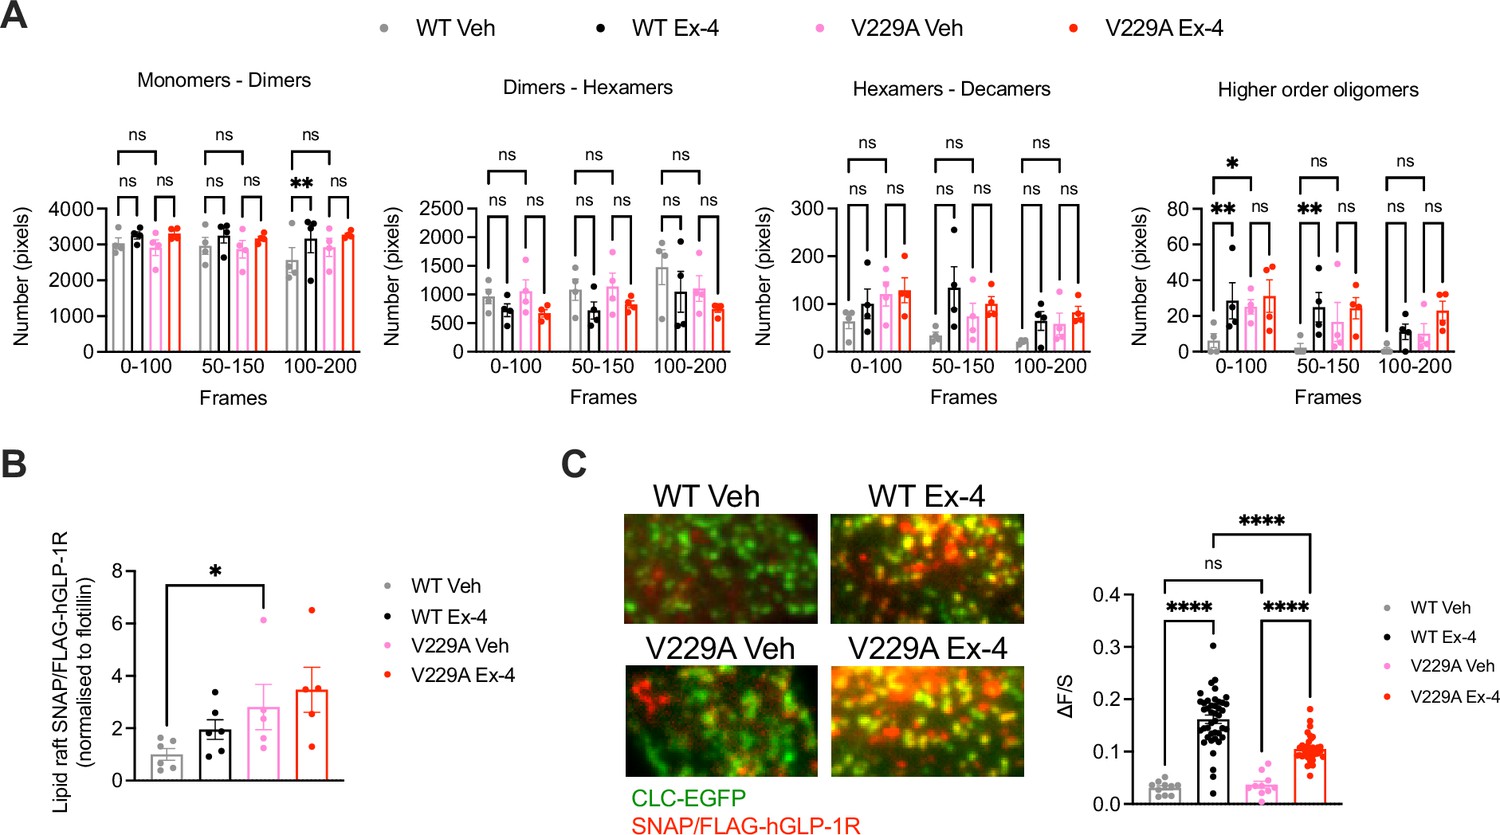
Glucagon-like peptide-1 receptor (GLP-1R) wild-type (WT) vs V229A oligomerisation and clathrin-coated pit (CCP) recruitment.
(A) N&B estimation of average number of pixels for the different oligomerisation states of the GLP-1R, either as monomers-dimers, dimers-hexamers, hexamers-decamers, or higher order oligomers, calculated at different time frames after stimulation with either vehicle (Veh) or 100 nM exendin-4 (Ex-4) from INS-1 832/3 SNAP/FLAG-hGLP-1R WT or V229A cells; n=4. (B) GLP-1R WT vs V229A levels at lipid raft fractions purified from INS-1 832/3 SNAP/FLAG-hGLP-1R WT vs V229A cells under Veh or Ex-4-stimulated conditions. Results represent SNAP levels assessed by Western blotting normalised to flotillin as a marker of lipid raft enrichment; n=5–6. (C) Left: representative TIRF images of INS-1 832/3 SNAP/FLAG-hGLP-1R WT or V229A cells co-expressing clathrin light chain-GFP (CLC-GFP) labelled with SNAP-Surface Alexa Fluor 647 prior to Veh or 100 nM Ex-4 stimulation; right: quantification of association (ΔF/S, see Methods) of SNAP/FLAG-hGLP1-R WT or V229A with clathrin puncta; n=29 and 127 cells for WT Veh vs Ex-4, and n=31 and 106 cells for V229A Veh vs Ex-4, respectively; each data point represents mean of 3 cells, data collated from three separate experiments. Data is mean +/-SEM; ns, non-significant, *p<0.05, **p<0.01, ****p<0.0001 by unpaired t-test, one- or two-way ANOVA with Sidak’s multiple comparison test.
Figure 6
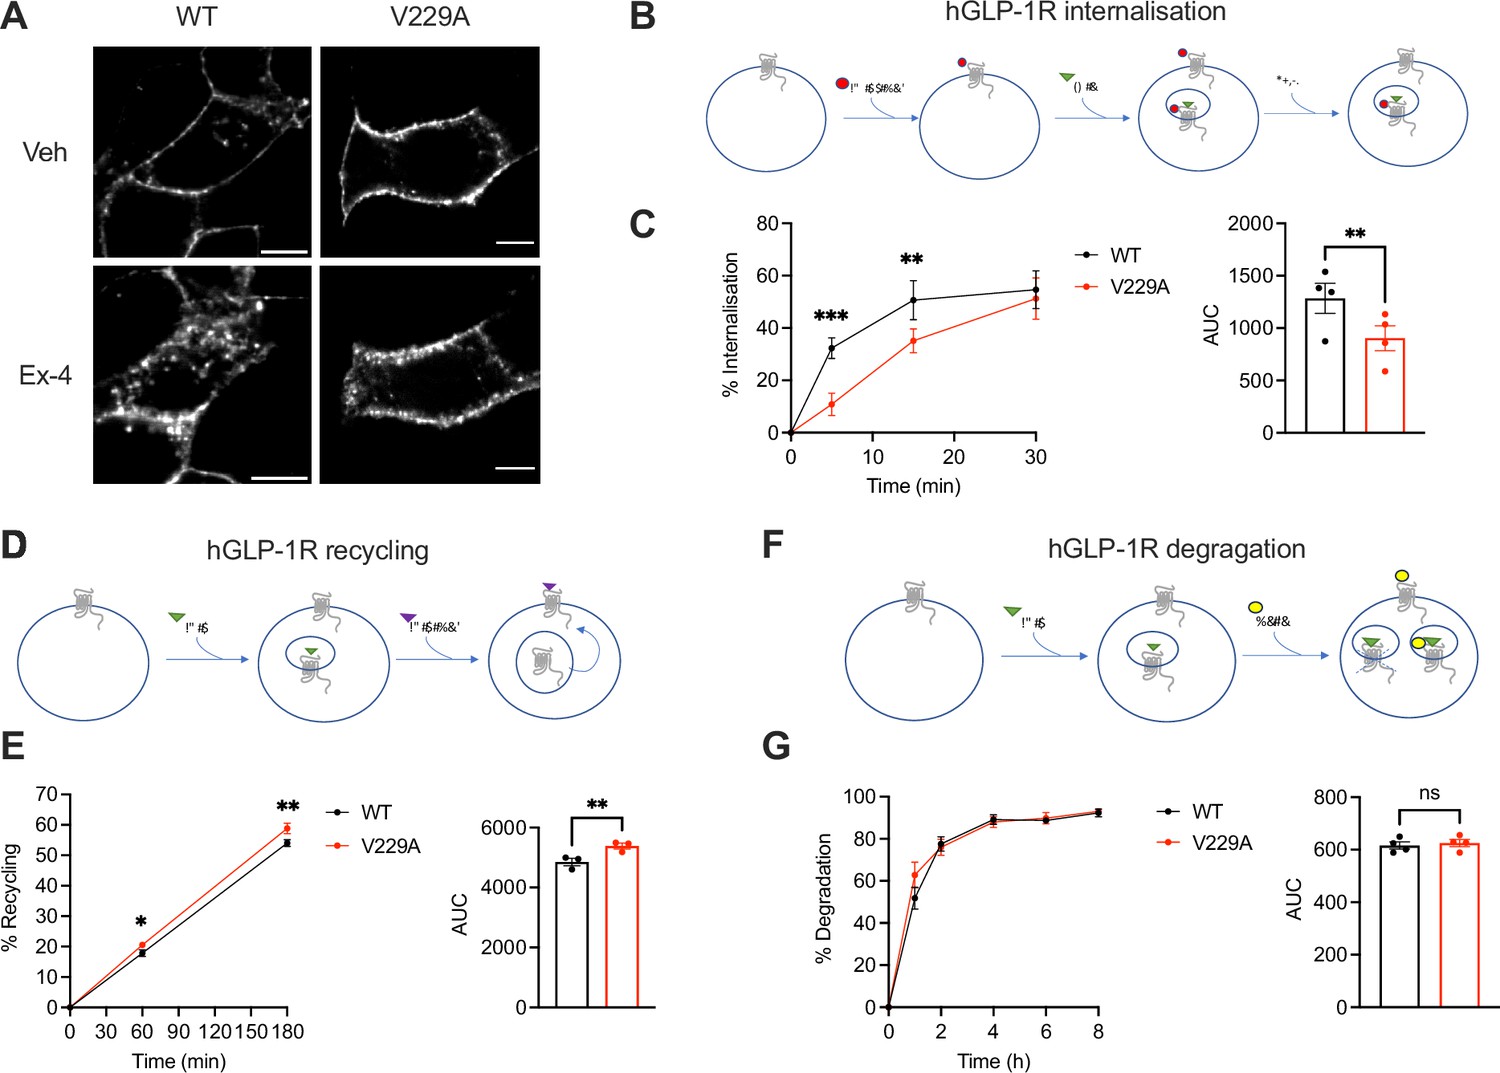
Glucagon-like peptide-1 receptor (GLP-1R) wild-type (WT) vs V229A trafficking profiles.
(A) Representative images of INS-1 832/3 SNAP/FLAG-hGLP-1R WT or V229A cells labelled with SNAP-Surface Alexa Fluor 647 probe under vehicle (Veh) conditions or following stimulation with 100 nM exendin-4 (Ex-4) for 10 min; size bars, 5 µm. (B) Schematic diagram of agonist-mediated SNAP/FLAG-hGLP-1R internalisation assay. (C) Percentage of internalised SNAP/FLAG-hGLP-1R WT vs V229A at the indicated time points after stimulation with 100 nM Ex-4; corresponding area under the curve (AUC) also shown; n=4. (D) Schematic diagram of SNAP/FLAG-hGLP-1R plasma membrane recycling assay. (E) Percentage of recycled SNAP/FLAG-hGLP-1R WT vs V229A at the indicated time points after stimulation with 100 nM Ex-4; corresponding AUC also shown; n=3. (F) Schematic diagram of agonist-mediated SNAP/FLAG-hGLP-1R degradation assay. (G) Percentage of SNAP/FLAG-hGLP-1R WT vs V229A degradation at the indicated time points after stimulation with 100 nM Ex-4; corresponding AUC also shown; n=4. Data is mean +/- SEM; ns, non-significant, *p<0.05, **p<0.01, ***p<0.001 by paired t-test or two-way ANOVA with Sidak’s multiple comparison test.
Figure 7 with 1 supplement
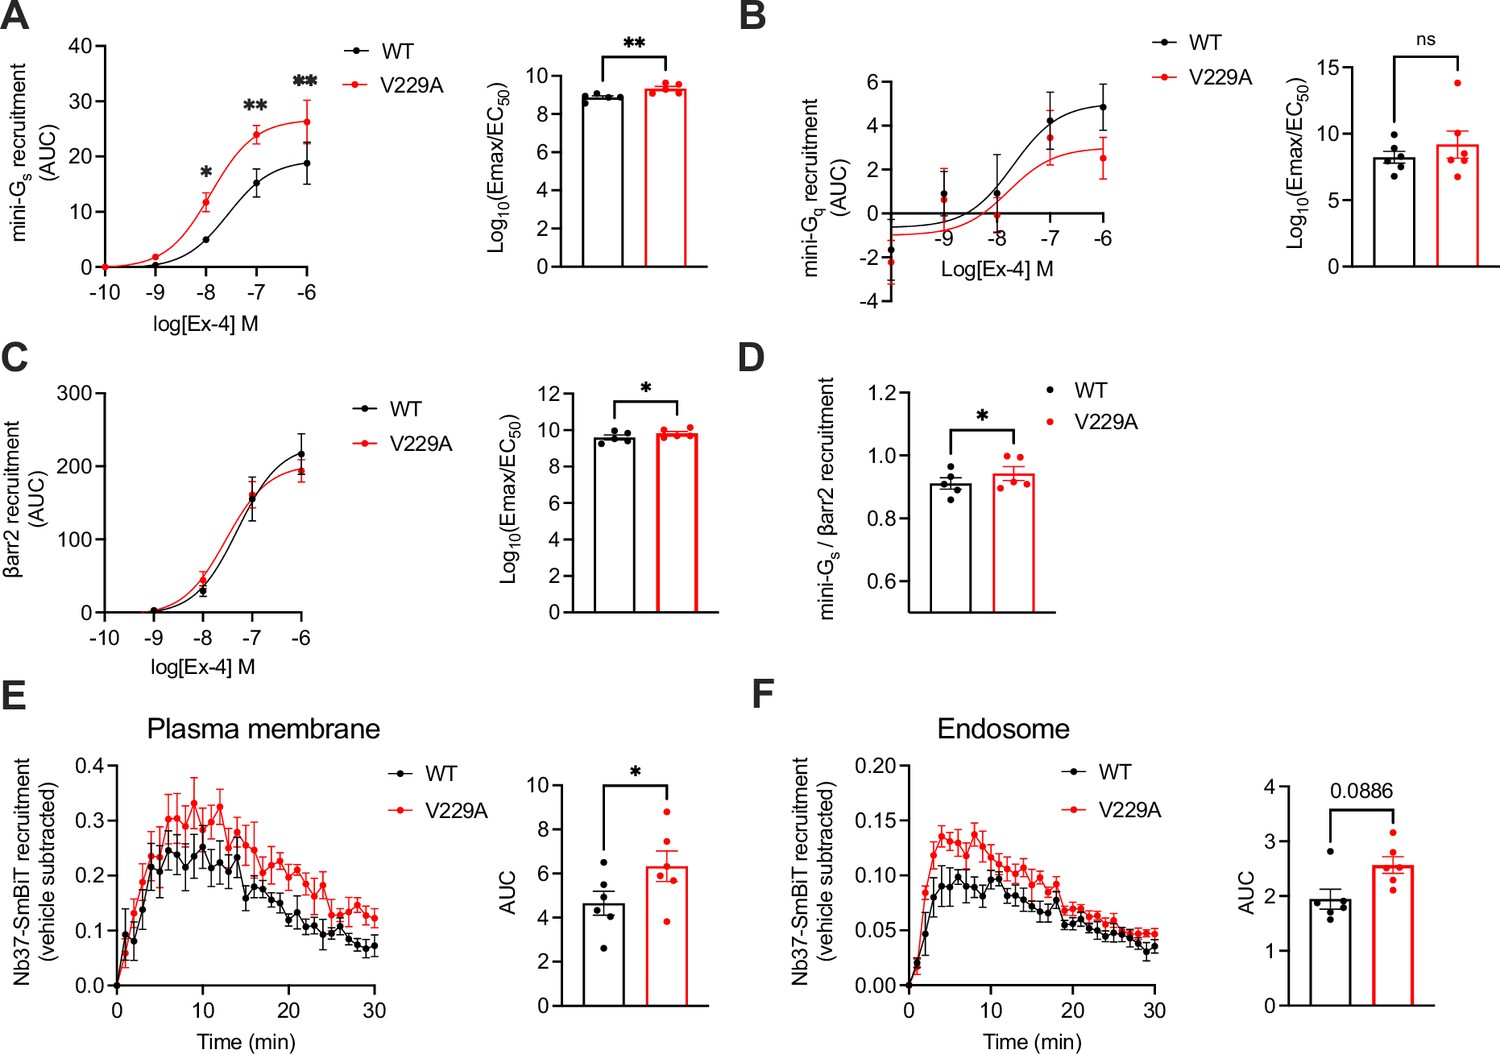
Signalling profiles of glucagon-like peptide-1 receptor (GLP-1R) wild-type (WT) vs V229A.
(A) Mini-Gs recruitment dose response curves and log10(Emax/EC50) following stimulation with the indicated concentrations of exendin-4 (Ex-4) in INS-1 832/3 GLP-1R KO cells transiently transfected with GLP-1R-SmBiT WT or V229A and LgBiT-mini-Gs; n=5. (B) Mini-Gq recruitment dose response curves and log10(Emax/EC50) after stimulation with the indicated concentrations of Ex-4 in INS-1 832/3 GLP-1R KO cells transiently transfected with GLP-1R-SmBiT WT or V229A and LgBiT-mini-Gq; n=6. (C) β-arrestin 2 (βarr2) recruitment dose response curves and log10(Emax/EC50) after stimulation with the indicated concentrations of Ex-4 in INS-1 832/3 GLP-1R KO cells transiently transfected with GLP-1R-SmBiT WT or V229A and LgBiT-βarr2; n=5. (D) Mini-Gs over βarr2 bias calculation for GLP-1R V229A vs WT. (E) GLP-1R WT vs V229A plasma membrane activation after stimulation with 100 nM Ex-4 in INS-1 832/3 GLP-1R KO cells co-transfected with Nb37-SmBiT, LgBiT-CAAX and SNAP/FLAG-hGLP-1R WT or V229A, measured by NanoBiT bystander complementation assay; area under the curve (AUC) also shown; n=6. (F) As in (E) but for GLP-1R WT vs V229A endosomal activation in INS-1 832/3 GLP-1R KO cells co-transfected with Nb37-SmBiT, Endofin-LgBiT and SNAP/FLAG-hGLP-1R WT or V229A; n=6. Data is mean +/- SEM; ns, non-significant, *p<0.05, **p<0.01 by paired t-test or two-way ANOVA with Sidak’s multiple comparison test.
Figure 7—figure supplement 1
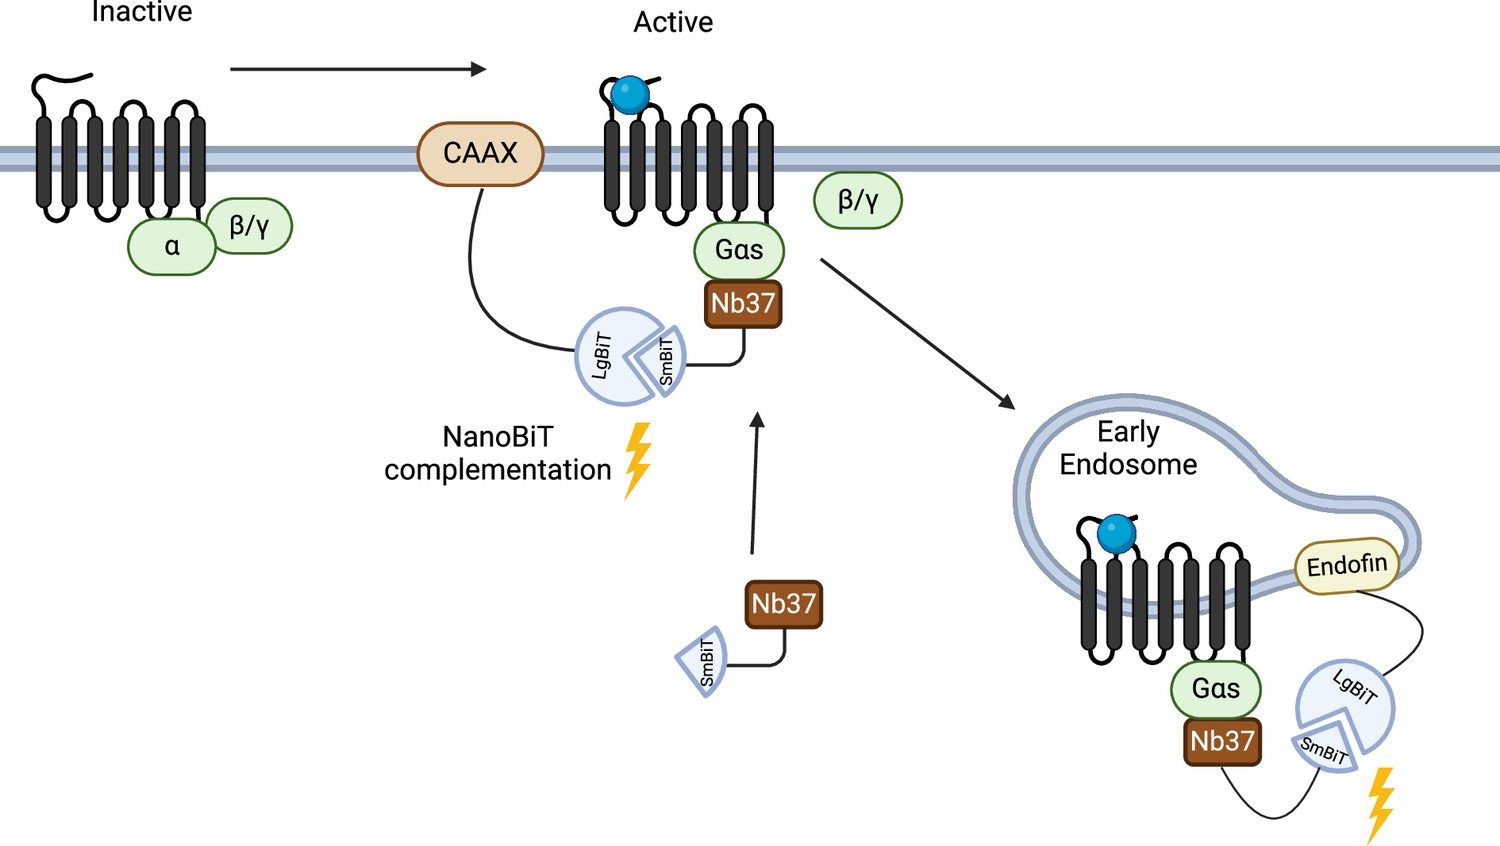
Schematic of the Nb37 bystander NanoBiT complementation assay.
Bystander complementation measures the recruitment of Nb37-SmBiT, which binds specifically to active Gαs, to either the plasma membrane (via NanoLuc complementation with KRAS CAAX motif-LgBiT), or to endosomes (via Nanoluc complementation to Endofin FYVE domain-LgBiT) in response to exendin-4 stimulation, therefore, assessing glucagon-like peptide-1 receptor (GLP-1R) activation specifically at these two subcellular locations.
Figure 8 with 1 supplement
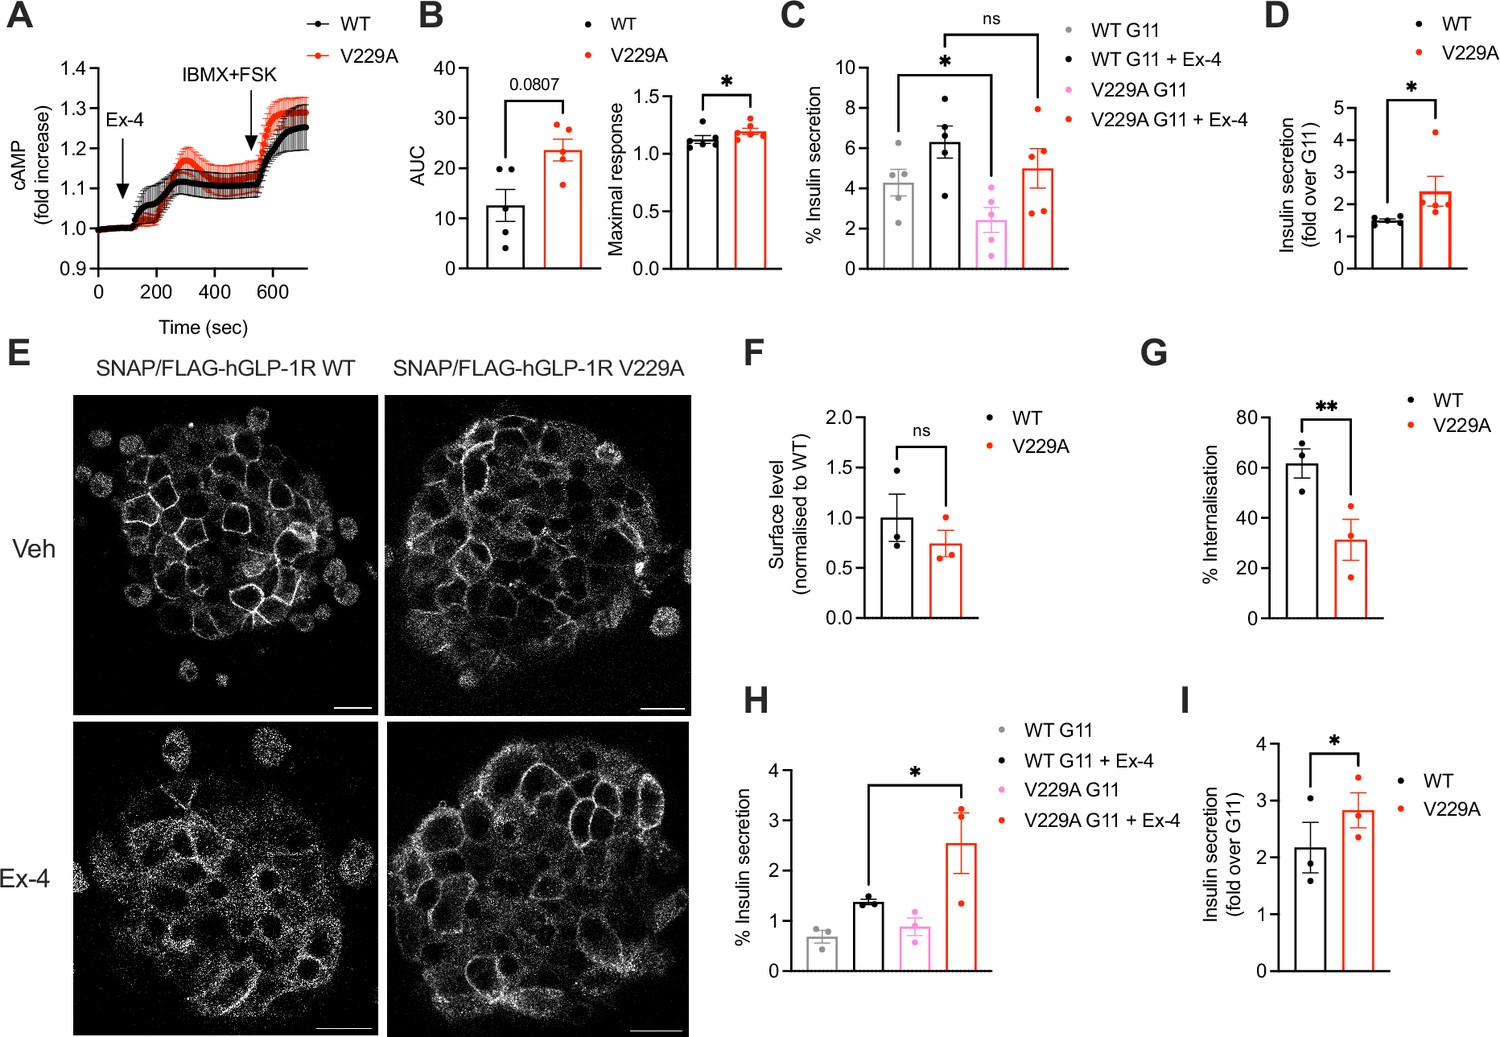
Functional responses of glucagon-like peptide-1 receptor (GLP-1R) wild-type (WT) vs V229A in pancreatic beta cells and primary islets.
(A) cAMP responses of INS-1 832/3 SNAP/FLAG-hGLP-1R WT vs V229A cells transduced with the Green Up Global cAMP cADDis biosensor before stimulation with 100 nM Exendin-4 (Ex-4) followed by 100 μM isobutyl methylxanthine (IBMX) +10 µM forskolin (FSK) for maximal response. (B) AUC and maximal response for the Ex-4 period from (A); n=5. (C) Insulin secretion from INS-1 832/3 SNAP/FLAG-hGLP-1R WT vs V229A cells following stimulation with 11 mM glucose (G11) +/-100 nM Ex-4; n=5. (D) Insulin secretion Ex-4-fold increase over G11 calculated from data in (C). (E) Representative images of GLP-1R KO mouse islets transduced with adenoviruses expressing SNAP/FLAG-hGLP-1R WT or V229A, labelled with SNAP-Surface Alexa Fluor 647 prior to stimulation with vehicle (Veh) or 100 nM Ex-4 for 5 min; size bars, 100 µm. (F) Surface expression of SNAP/FLAG-hGLP-1R WT vs V229A expressed in GLP-1R KO mouse islets from (E); n=3. (G) Percentage of SNAP/FLAG-hGLP-1R WT vs V229A internalisation in GLP-1R KO mouse islets following stimulation with 100 nM Ex-4 for 5 min; n=3. (H) Insulin secretion responses from GLP-1R KO islets transduced with SNAP/FLAG-hGLP-1R WT vs V229A adenoviruses following stimulation with G11 +/-100 nM Ex-4; n=3. (I) Insulin secretion Ex-4-fold increase over G11 calculated from data in (H). Data is mean +/- SEM; ns, non-significant, *p<0.05, **p<0.01 by paired t-test or one-way ANOVA with Sidak’s multiple comparison test.
Figure 8—figure supplement 1
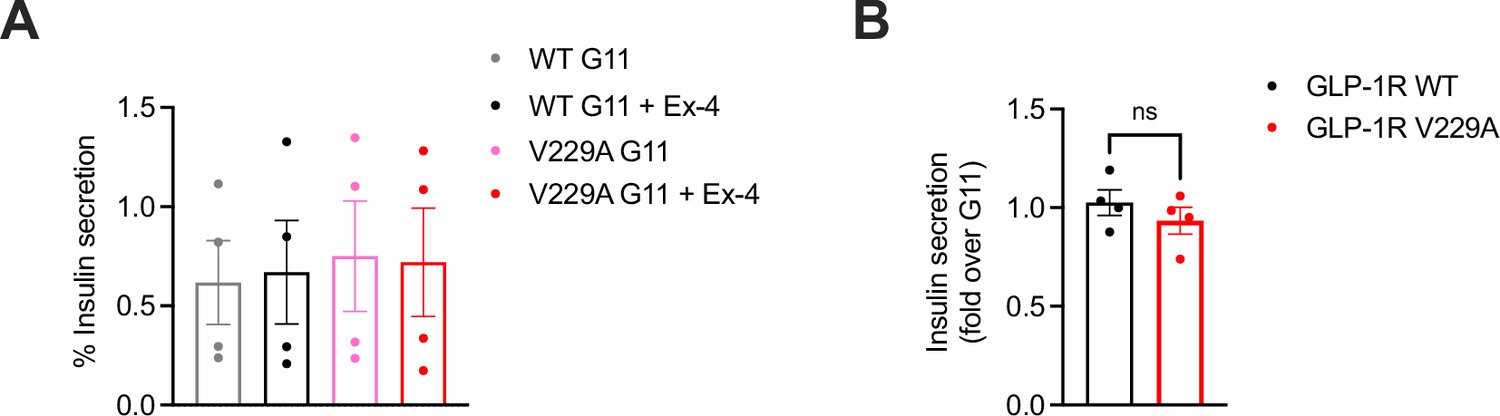
Insulin secretion of glucagon-like peptide-1 receptor (GLP-1R) wild-type (WT) vs V229A-expressing islets under high cholesterol conditions.
(A) Percentage of insulin secretion from GLP-1R KO islets transduced with SNAP/FLAG-hGLP-1R WT vs V229A adenoviruses preincubated with Veh or methyl-β-cyclodextrin (MβCD) loaded with 20 mM cholesterol (MβCD/chol) for 1 hr before stimulation with G11 +/-100 nM exendin-4 (Ex-4); n=4. (B) Insulin secretion Ex-4-fold increase over G11 calculated from data in (A). Data is mean +/- SEM; ns, non-significant by paired t-test.
Figure 9
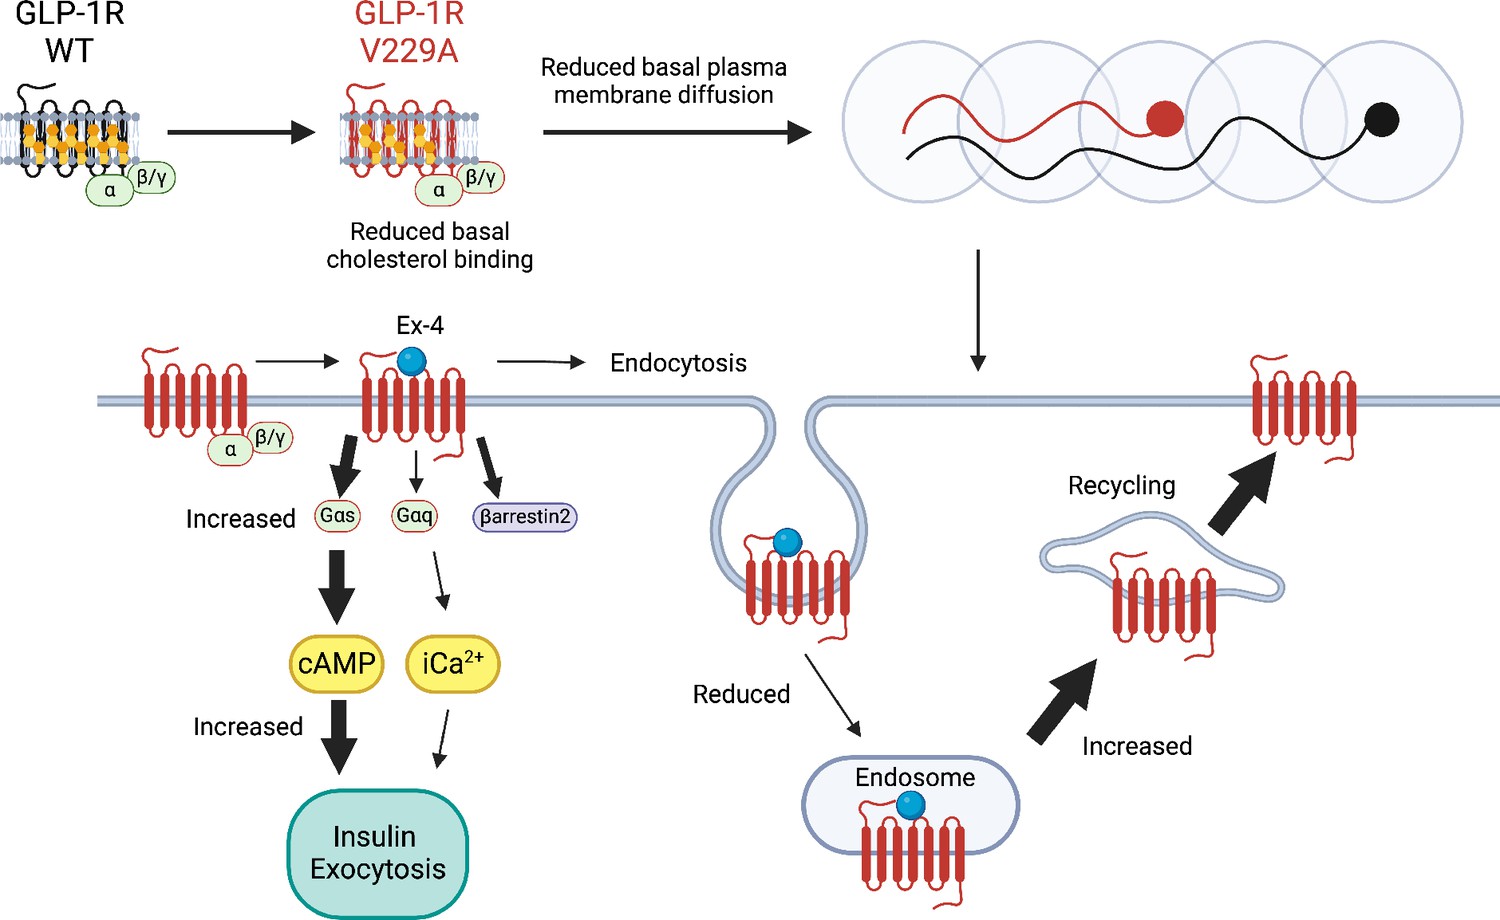
Schematic diagram of effects of cholesterol binding mutant glucagon-like peptide-1 receptor (GLP-1R) V229A on GLP-1R function.
Thick arrows indicate increased and thin arrows decreased pathway engagement.
Tables
Table 1
Overview of effects of glucagon-like peptide-1 receptor (GLP-1R) V229A in inactive and active states compared with GLP-1R wild-type (WT).
(↑ increased, ↓ decreased, ≈ unchanged).
| Assay | GLP-1R V229A vs GLP-1R WT | |
|---|---|---|
| Vehicle (inactive) | Exendin-4 (active) | |
| Surface expression | ≈ (↓) | N/A |
| Cholesterol binding | ↓ | ≈ |
| Plasma membrane diffusion | ↓↓ | ≈ |
| Plasma membrane displacement | ↓ | ≈ |
| Plasma membrane speed | ↓ | ≈ |
| Oligomerisation | ↑ | ≈ |
| Lipid raft recruitment | ↑ | ↑ |
| CCP recruitment | ≈ | ↓ |
| Internalisation | N/A | ↓ |
| Recycling | N/A | ↑ |
| Degradation | N/A | ≈ |
| Mini-Gs recruitment | N/A | ↑↑ |
| β-arrestin 2 recruitment | N/A | ↑ |
| Mini-Gq recruitment | N/A | ≈ |
| Activation at plasma membrane | N/A | ↑↑ |
| Activation at endosomes | N/A | ↑ |
| cAMP | N/A | ↑ |
| Insulin secretion | ↓ cells / ≈ islets | ≈ cells / ↑ islets |
Table 2
Site-directed mutagenesis primers for SNAP/FLAG-hGLP-1R cholesterol binding mutant generation.
| GLP-1R cholesterol binding mutant | Forward primer (5’–3’) | Reverse primer (5’–3’) | Side chain charge change |
|---|---|---|---|
| BATCH 1 SCREEN | |||
| I323A | CATTGGGGTGAACTTCCTCGCCTTTGTTCGGGTCATCTGC | GCAGATGACCCGAACAAAGGCGAGGAAGTTCACCCCAATG | non-polar to non-polar |
| S163A | CTCTGGTTATCGCCGCTGCGATCCTCCTC | GAGGAGGATCGCAGCGGCGATAACCAGAG | polar to non-polar |
| S225A | CCAGGACTCTCTGGCCTGCCGCCTGGTG | CACCAGGCGGCAGGCCAGAGAGTCCTGG | polar to non-polar |
| V229A | GAGCTGCCGCCTGGCGTTTCTGCTCATGC | GCATGAGCAGAAACGCCAGGCGGCAGCTC | non-polar to non-polar |
| BATCH 2 SCREEN | |||
| L167A | CCTCTGCGATCCTCGCCGGCTTCAGACACC | GGTGTCTGAAGCCGGCGAGGATCGCAGAGG | non-polar to non-polar |
| V160A | CCTTCTCTGCTCTGGCTATCGCCTCTGCGAT | ATCGCAGAGGCGATAGCCAGAGCAGAGAAGG | non-polar to non-polar |
| I165A | GTTATCGCCTCTGCGGCCCTCCTCGGCTTCAG | CTGAAGCCGAGGAGGGCCGCAGAGGCGATAAC | non-polar to non-polar |
| G151A | CATCTACACGGTGGCCTACGCACTCTCCT | AGGAGAGTGCGTAGGCCACCGTGTAGATG | non-polar to non-polar |
| BATCH 3 SCREEN | |||
| D372A | GCCTTTGTGATGGCCGAGCACGCCCGG | CCGGGCGTGCTCGGCCATCACAAAGGC | acidic to non-polar |
| H363A | CATCCCCCTGCTGGGGACTGCTGAGGTCATCTTTG | CAAAGATGACCTCAGCAGTCCCCAGCAGGGGGATG | basic to non-polar |
| L401A | AGGGGCTGATGGTGGCCATAGCATACTGCTTTGTCAACAAT | ATTGTTGACAAAGCAGTATGCTATGGCCACCATCAGCCCCT | non-polar to non-polar |
| I400A | CAGGGGCTGATGGTGGCCGCATTATACTGCTTTGTCAAC | GTTGACAAAGCAGTATAATGCGGCCACCATCAGCCCCTG | non-polar to non-polar |
Table 3
Transfected plasmid amounts for Nb37 bystander NanoBiT assays.
| LgBiT-KRAS CAAX motif (SSSGGGKKKKKKSKTKCVIM) | Endofin FYVE domain-LgBiT(amino acid region Gln739-Lys806) | ||
|---|---|---|---|
| Plasmid | Concentration | Plasmid | Concentration |
| SNAP/FLAG-hGLP-1R WT or V229A | 0.1 µg | SNAP/FLAG-hGLP-1R WT or V229A | 0.1 µg |
| Nb37-SmBiT | 0.05 µg | Nb37-SmBiT | 0.25 µg |
| LgBiT-CAAX | 0.05 µg | Endofin-LgBiT | 0.25 µg |
| Gαs (human, short isoform) | 0.25 µg | Gαs (human, short isoform) | 0.25 µg |
| Gβ1 (human) | 0.25 µg | Gβ1 (human) | 0.25 µg |
| Gγ1 (human) | 0.25 µg | Gγ1 (human) | 0.25 µg |
| RIC8B (human, isoform 2) | 0.05 µg | RIC8B (human, isoform 2) | 0.05 µg |
| pcDNA 3.1 | 0.40 µg | pcDNA 3.1 | - |
Additional files
-
MDAR checklist
- https://cdn.elifesciences.org/articles/101011/elife-101011-mdarchecklist1-v1.pdf
-
Supplementary file 1
Active GLP-1R - cholesterol interactions.
- https://cdn.elifesciences.org/articles/101011/elife-101011-supp1-v1.csv
-
Supplementary file 2
Inactive GLP-1R - cholesterol interactions.
- https://cdn.elifesciences.org/articles/101011/elife-101011-supp2-v1.csv
-
Supplementary file 3
Insulin secretion raw data.
- https://cdn.elifesciences.org/articles/101011/elife-101011-supp3-v1.xlsx
Download links
A two-part list of links to download the article, or parts of the article, in various formats.
Downloads (link to download the article as PDF)
Open citations (links to open the citations from this article in various online reference manager services)
Cite this article (links to download the citations from this article in formats compatible with various reference manager tools)
Molecular mapping and functional validation of GLP-1R cholesterol binding sites in pancreatic beta cells
eLife 13:RP101011.
https://doi.org/10.7554/eLife.101011.3


