Neuromodulation of excitatory synaptogenesis in striatal development
- Howard Hughes Medical Institute, Harvard Medical School, United States
- Northwestern University, United States
Figures
Figure 1 with 3 supplements
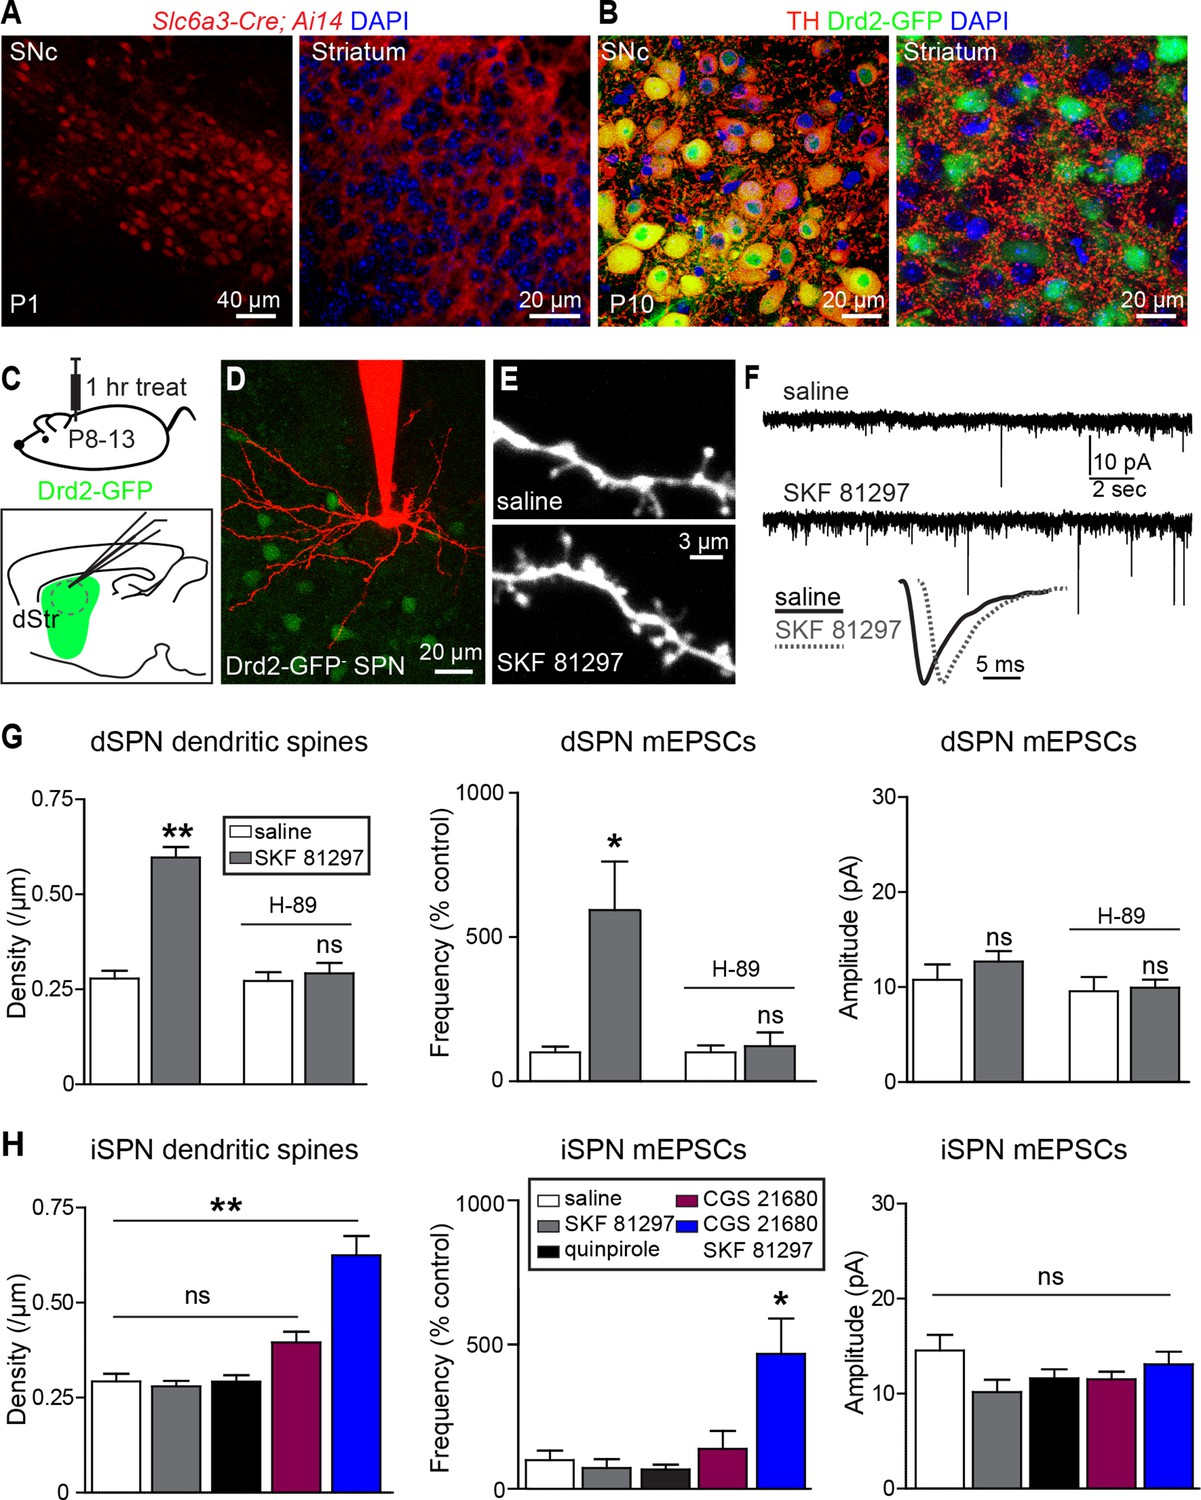
Gαs GPCR stimulation rapidly increases SPN dendritic spine and excitatory synapse number.
(A) Cre recombinase expression driven by dopamine transporter gene (Slc6a3) promoter activates tdTomato expression (red) in a reporter mouse, revealing cells bodies in SNc (left) and densely innervating fibers within striatum (right) at postnatal day 1 (P1). (B) At P10, immunohistochemistry for tyrosine hydroxylase shows expression in SNc cell bodies (left) and a punctate pattern in the striatum (right). (C) Schematic of the experiment and recording preparation. (D) 2PLSM image of a Drd2-GFP negative SPN filled with Alexa 594 during whole-cell recording. (E) 2PLSM images of dendrites and dendritic spines on dSPNs after saline or SKF 81297 administration in vivo. (F) Example mEPSC recordings and individual events demonstrating enhanced mEPSC frequency in dSPNs with Drd1 stimulation. (G) Summaries of spine density, mEPSC frequency and amplitude in dSPNs following in vivo administration of saline or the Drd1 agonist SKF 81297 to control animals or those treated with the PKA antagonist H-89. (H) Summaries of spine density, mEPSC frequency and amplitude in iSPNs following in vivo administration of saline, the Drd1 agonist SKF 81297, the Drd2 agonist quinpirole, the A2aR agonist CGS 21680, or SKF 81297 and CGS 21680 together.
Figure 1—figure supplement 1
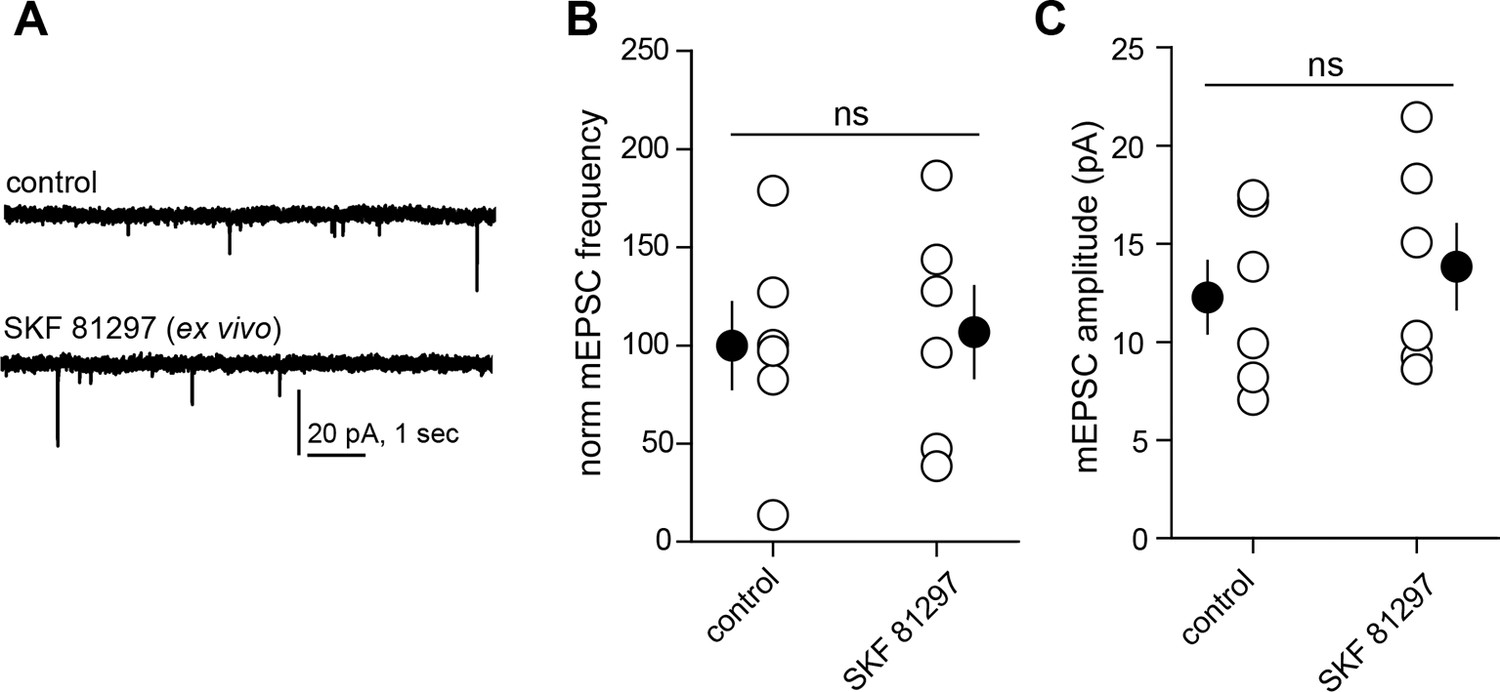
Drd1 agonist treatment of the acute brain slice fails to enhance excitatory synapse numbers on dSPNs.
(A) Trace examples of miniature EPSC (mEPSC) recordings from dSPNs in slices that were incubated in the presence or absence of Drd1 agonist SKF 81297 (10 µM) for ~1 hr. (B) Summary data demonstrating no difference in normalized mEPSC frequency between conditions. Error bars indicate SEM. C. Summary data demonstrating no difference in mEPSC amplitude between conditions. Error bars indicate SEM.
Figure 1—figure supplement 2

Acute Drd1 agonist treatment induces locomotion in immature pups.
(A) View from above the arena used to record locomotor activity and quantify grid crossings, with example tracks of individual mice from the noted conditions recorded for 30 min. (B) Summary graphs of distance travelled and grid coverage from mice injected with saline, Drd1 agonist SKF 81297, or Drd2 agonist quinpirole. A subset of animals was pre-treated with PKA blocker H-89 thirty minutes before saline/agonist injections. Drd1 agonist treatment increased locomotion, an effect that was partially blocked by H-89 pre-administration. N=9, 11, 7 and 5 mice/group; *p<0.05, p<0.1; error bars indicate SEM.
Figure 1—figure supplement 3

Drd1 agonist treatment repeatedly potentiates locomotion in immature pups.
(A) View from above the arena used to record locomotor activity, with example tracks of individual mice from the noted conditions recorded for 30 min, on day 3 of the experiment. P9 mice received priming injections on day 1, as noted, and their locomotor behavior in response to a second injection on Day 3 was evaluated. (B) Summary graph of distance travelled from mice injected twice with saline on days 1 and 3, saline and SKF 81297, or two rounds of SKF 81297 treatment. Drd1 agonist treatment increased locomotion and further potentiated SKF 81297-induced locomotion increase on day 3. N=10 mice/group; one-way ANOVA p<0.0001, post hoc tests *p<0.05, **p<0.01, *** p<0.001; error bars indicate SEM.
Figure 2 with 1 supplement
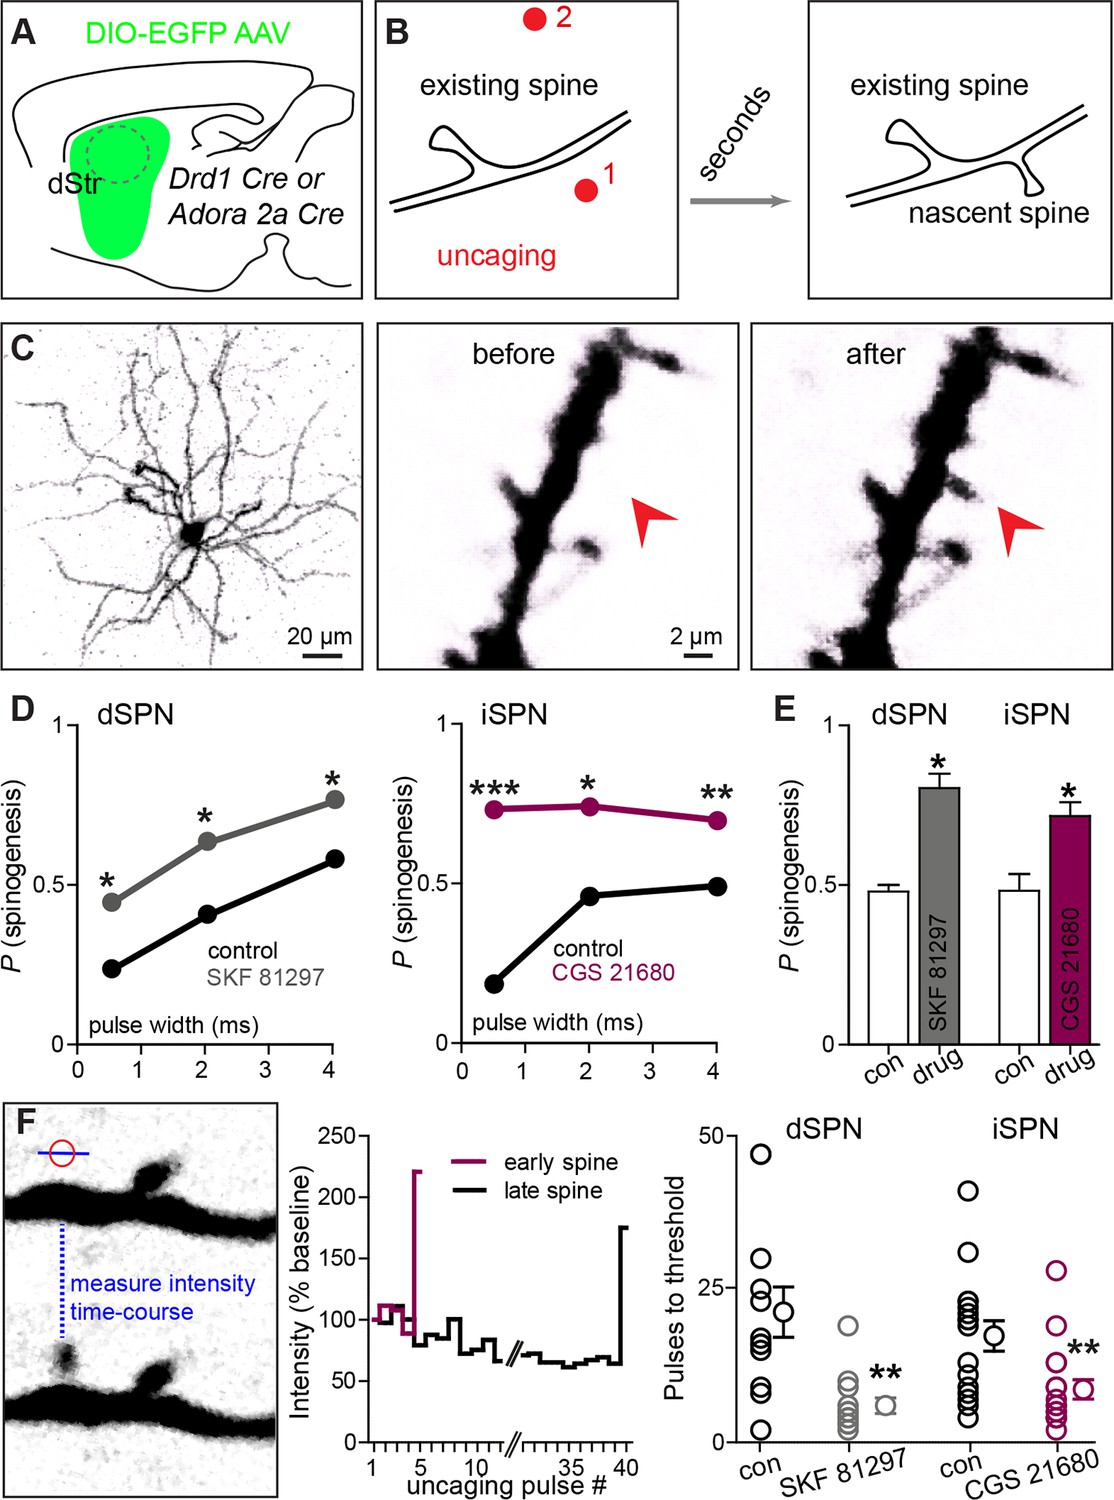
Drd1 or A2a receptor activation facilitates spinogenesis on dSPNs and iSPNs, respectively.
(A) Schematic of experimental setup. AAVs encoding Cre-dependent GFP expression are used with appropriate transgenic mice to induce sparse GFP labeling of dSPNs or iSPNs. (B) Schematic illustrating de novo dendritic spine formation triggered by focal 2-photon glutamate uncaging. In a subset of experiments, uncaging was rapidly alternated between two sites, located close to (<2 µm) and far from (>5 µm) the GFP-positive dendrite. De novo spinogenesis occurred in a subset of trials in locations near the dendrite. (C) Example of a GFP+ neuron imaged at low magnification (left) and higher magnification images of a dendrite before (middle) and after (right) successful induction of new spine formation (arrow). (D) Probability of successful spinogenesis across all induction attempts in dSPNs (left) and iSPNs (right) as a function of uncaging pulse width in control conditions (black) or in the presence of the indicated Gαs GPCR agonist (grey, Drd1 agonist SKF 81297; burgundy, A2aR agonist CGS 21680). (E) Average probability of spinogenesis for dSPNs and iSPNs analyzed in control conditions or in the presence of the indicated Gαs GPCR agonist. Error bars indicated SEM of the probability across mice. (F) Analysis of spinogenesis kinetics using line scans to measure fluorescence in the emerging spine head (left) indicates that although the actual process of spinogenesis is fast (right), some spines are generated early (burgundy) and others late (black) during the stimulation protocol. (G) Gαs GPCR agonist treatment reduces the number of uncaging pulses needed for detection of an emergent dendritic spine. Error bars indicate SEM.
Figure 2—figure supplement 1
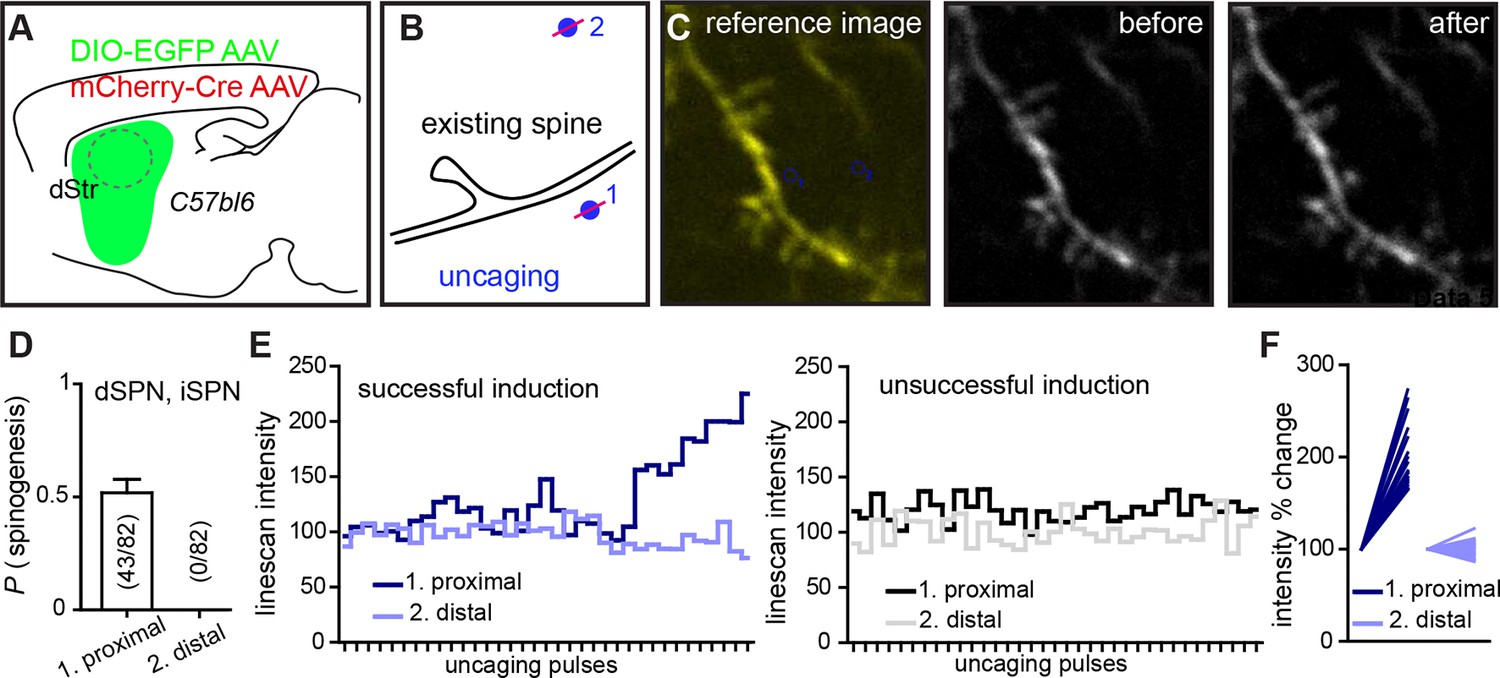
Dual site uncaging de novo spinogenesis induction.
(A) Experimental schematic. For sparse expression of GFP-expressing AAV in striatal SPNs, mice were injected with a combination of two AAVs, mCherry-Cre and Cre-dependent DIO-EGFP AAV. (B) At P8-13, acute slices were prepared and GFP+ dendritic segments were imaged with one laser tuned to 840 nm before, during and after delivering a two-site MNI-L-glutamate uncaging protocol. One site was near the dendrite (<2 µm), while the second one was at least 5 µm away. Distal sites (2) were selected either on the same or different side of the dendrite, relative to the proximal (1) uncaging location. (C) Fluorescence image illustrating the uncaging sites selected for one trial (left). Before (middle) and after (right) images, demonstrating successful induction of a spiny protrusion. (D) Summary data for 82 trials. Success rate for proximal uncaging site spinogenesis is consistent with that from previous studies (~50% success rate with no added Mg2+ ACSF; Figure 2). No trials were associated with appearance of a protrusion or an isolated fluorescence spot at the distal uncaging site. To further evaluate dynamics of signal change in the locations of induction attempts, we tracked line-scan intensity changes across time and uncaging pulses. (E) Examples of individual successful and unsuccessful inductions of spinogenesis showing line-scan tracking at both uncaging locations. (F) Summary graph of line-scans before and after uncaging showing normalized intensity levels for trials at proximal and distal sites.
Figure 3 with 1 supplement
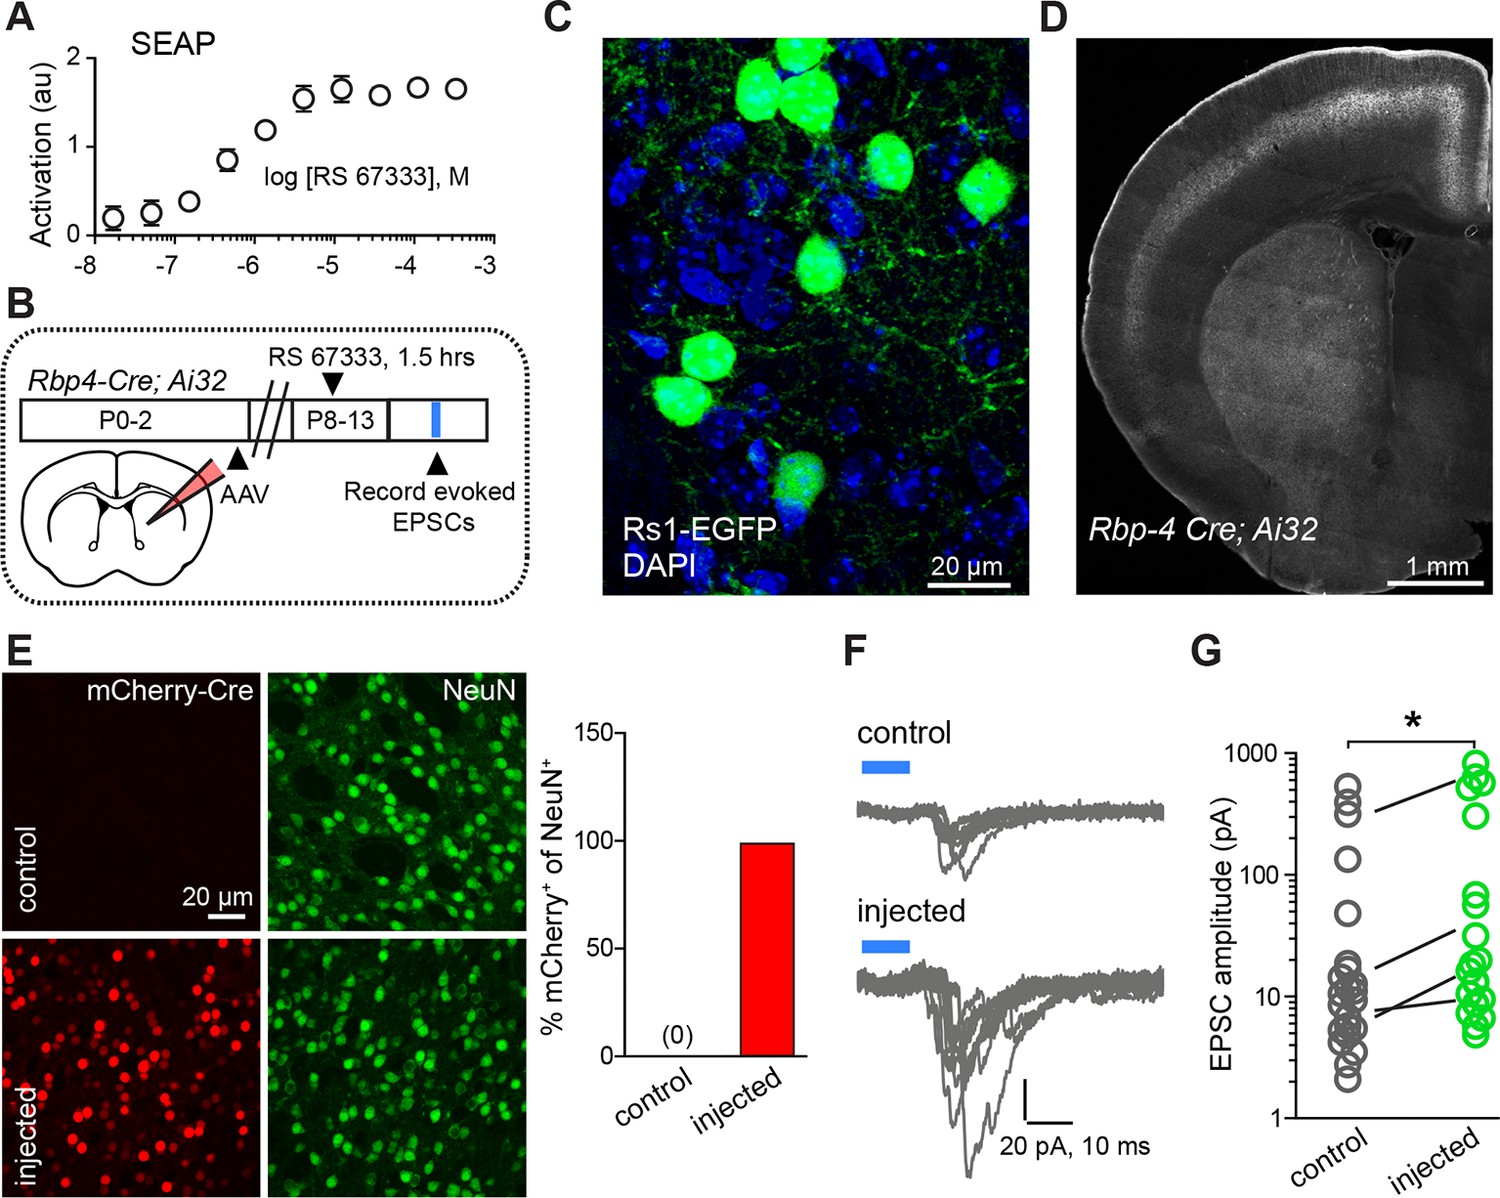
Chemogenetic Gαs GPCR activation is sufficient to rapidly enhance corticostriatal innervation.
(A) Secreted alkaline phosphatase (SEAP)-based in vitro test of the efficacy of PKA activation following activation of the Gαs-targeted RASSL with RS 67333. (B) Experimental design showing unilateral neonatal virus injection of DIO-Rs1-EGFP AAV and mCherry-Cre AAV into striatum of Rbp4-Cre; Ai32 mice. At P8-13, pups were systemically injected with RS 67333 and acute slices were prepared 1.5 hr after the injection. Light-evoked EPSCs were recorded in SPNs and compared across injected and uninjected hemispheres. (C) Confocal image showing striatal expression of a Cre-dependent Gαs targeted Rs1-EGFP AAV in a Cre-expressing mouse. (D) YFP fluorescence image illustrating the expression ChR2-YFP in layer 5 pyramidal neurons in coronal brain section of an Rbp4-Cre; Ai32 mouse. (E) Images mCherry-Cre (left, red) and NeuN (middle, green) expression in control (top) or Cre-mCherry encoding AAV injected (bottom) striatum. The proportion of striatal neurons identified immunohistochemically by NeuN expression that co-express Cre in infected or uninfected hemispheres. (F) Examples of light-evoked EPSCs from SPNs in control and virally injected hemisphere of the same mouse. Ten overlaid consecutive acquisition traces are shown for each neuron. (G) Summary data showing larger amplitudes of ChR2-evoked EPSCs for SPNs from the injected side of the brain. Circles are average responses of single neurons, whereas lines reflect individual mouse averages.
Figure 3—figure supplement 1

Age dependence of optogenetically evoked corticostriatal responses.
(A) Examples of individual (grey) and average (black, 5 consecutive traces) light-evoked, pharmacologically isolated AMPAR-dependent responses in SPNs from Rbp4-Cre; Ai32 mice of different ages. More individual response failures in responsive SPNs and non-responsive neurons are observed at the younger ages. (B) Summary data across age groups indicating expansion of connectivity from P8 through eye opening at P13-14. Individual neuron peak response amplitude averages are shown as clear circles, with group averages in red. Error bars reflect SEM.
Figure 4 with 1 supplement
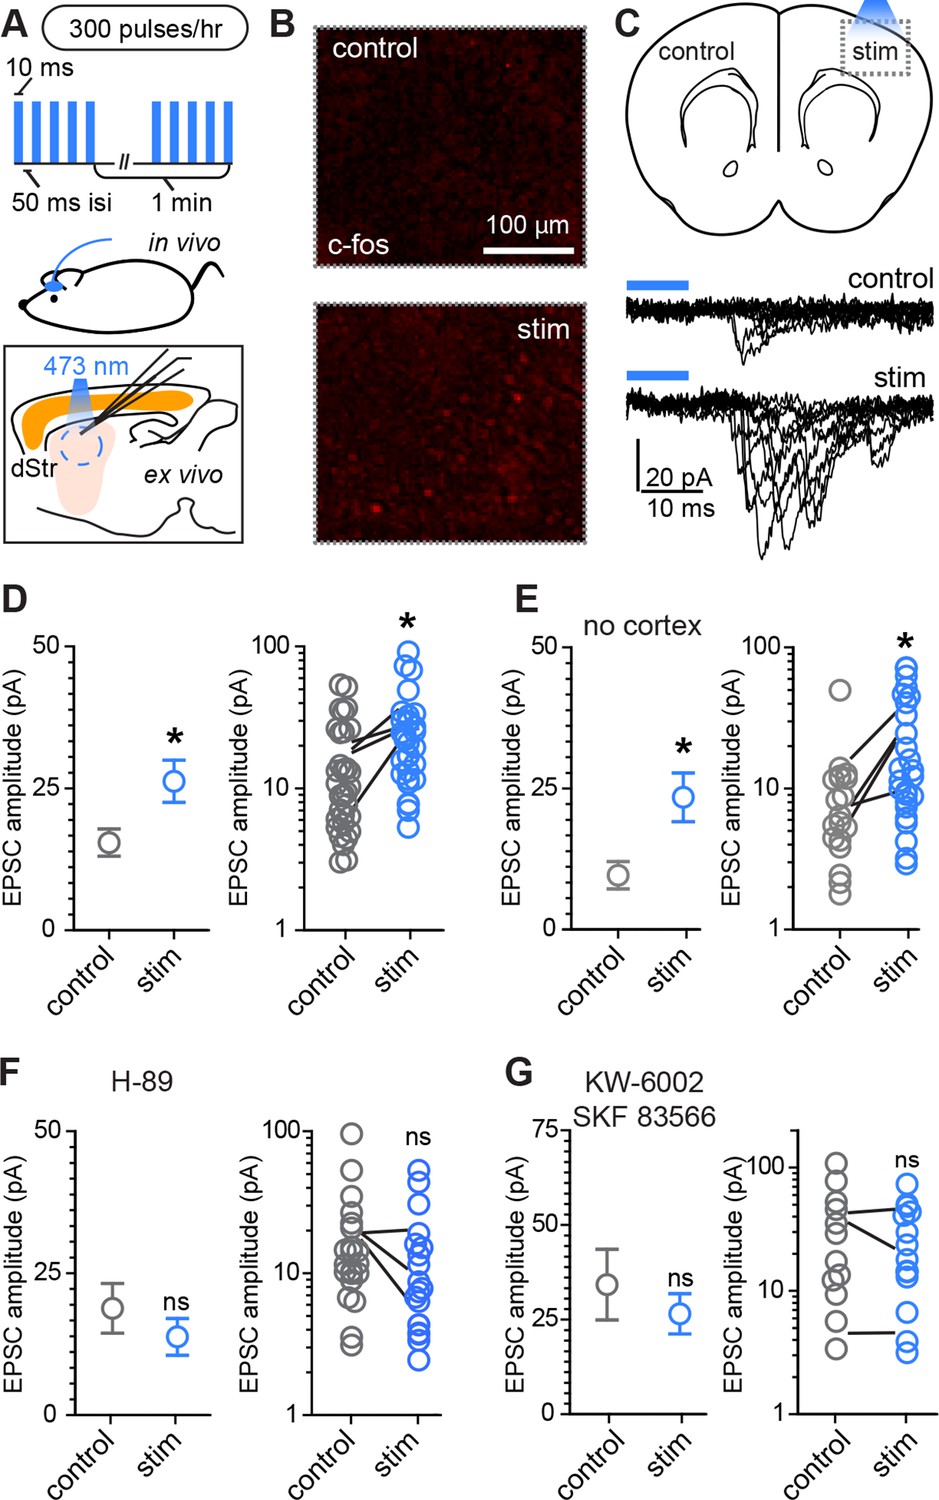
Rapid activity-dependent in vivo corticostriatal plasticity depends on PKA and Gαs-coupled receptor activation.
(A) Experimental schematic. A mouse pup expressing ChR2-YFP in corticostriatal fibers (Rbp4-Cre; Ai32) receives 300 light pulses over the course of 1 hr via an extracranially mounted LED located over somatosensory and motor cortices. Immediately after in vivo optogenetic stimulation, acute slices are prepared and ChR2-mediated EPSCs in SPNs are recorded from stimulated and control hemispheres. (B) Immunohistochemical labeling of immediate early gene c-fos product shows increased labeling on the optogenetically stimulated side. (C) Schematic of the experiment and example traces showing ten sequentially evoked EPSCs from example SPNs of the control and stimulated hemisphere in one mouse. (D) Average amplitudes of optogenetically evoked EPSCs showing successful induction of corticostriatal plasticity under baseline conditions. Group averages are shown on the left (error bars reflect SEM) and single neuron (circles) as well as individual mouse (lines) averages are on the right. (E) As in D, repeated in in striatum-only slices, prepared by removing cortex before recording from SPNs. (F,G) As in D, showing in vivo pre-administration of PKA blocker H-89 30 min before optogenetic stimulation (F) or antagonism of Drd1 and A2a receptors with SKF 83566 and KW-6002 (G) prevent optogenetically induced corticostriatal plasticity.
Figure 4—figure supplement 1
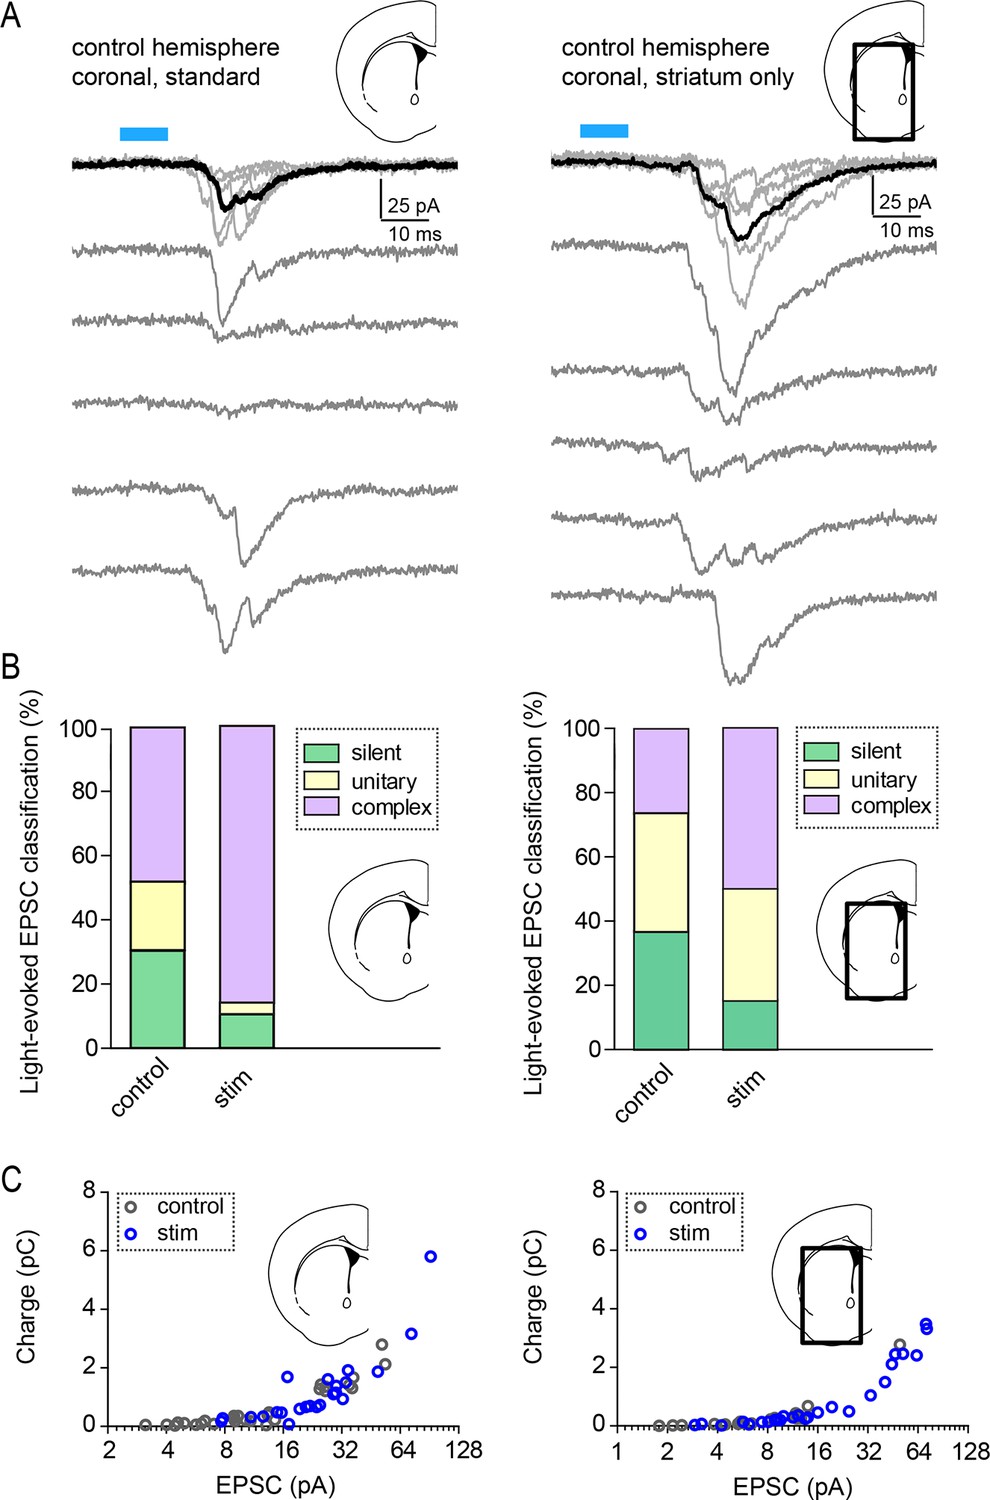
Light-evoked response properties in SPNs of Rbp4-Cre; Ai32 mice.
(A) Examples of individual pharmacologically isolated AMPAR-dependent light-evoked EPSCs, recorded from SPNs in Rbp4-Cre; Ai32 mice, either in a standard coronal preparation (left), or in a striatum-only slice with the neocortex removed (right). Individual acquisition sweeps are shown in grey and the average of 5 consecutive traces is in black. (B) Classification of light-evoked responses into silent, unitary (single-peak) and complex responses, in control and in optogenetically stimulated hemispheres. (C) Charge transfer was similar for standard slices and striatum only preparations.
Figure 5
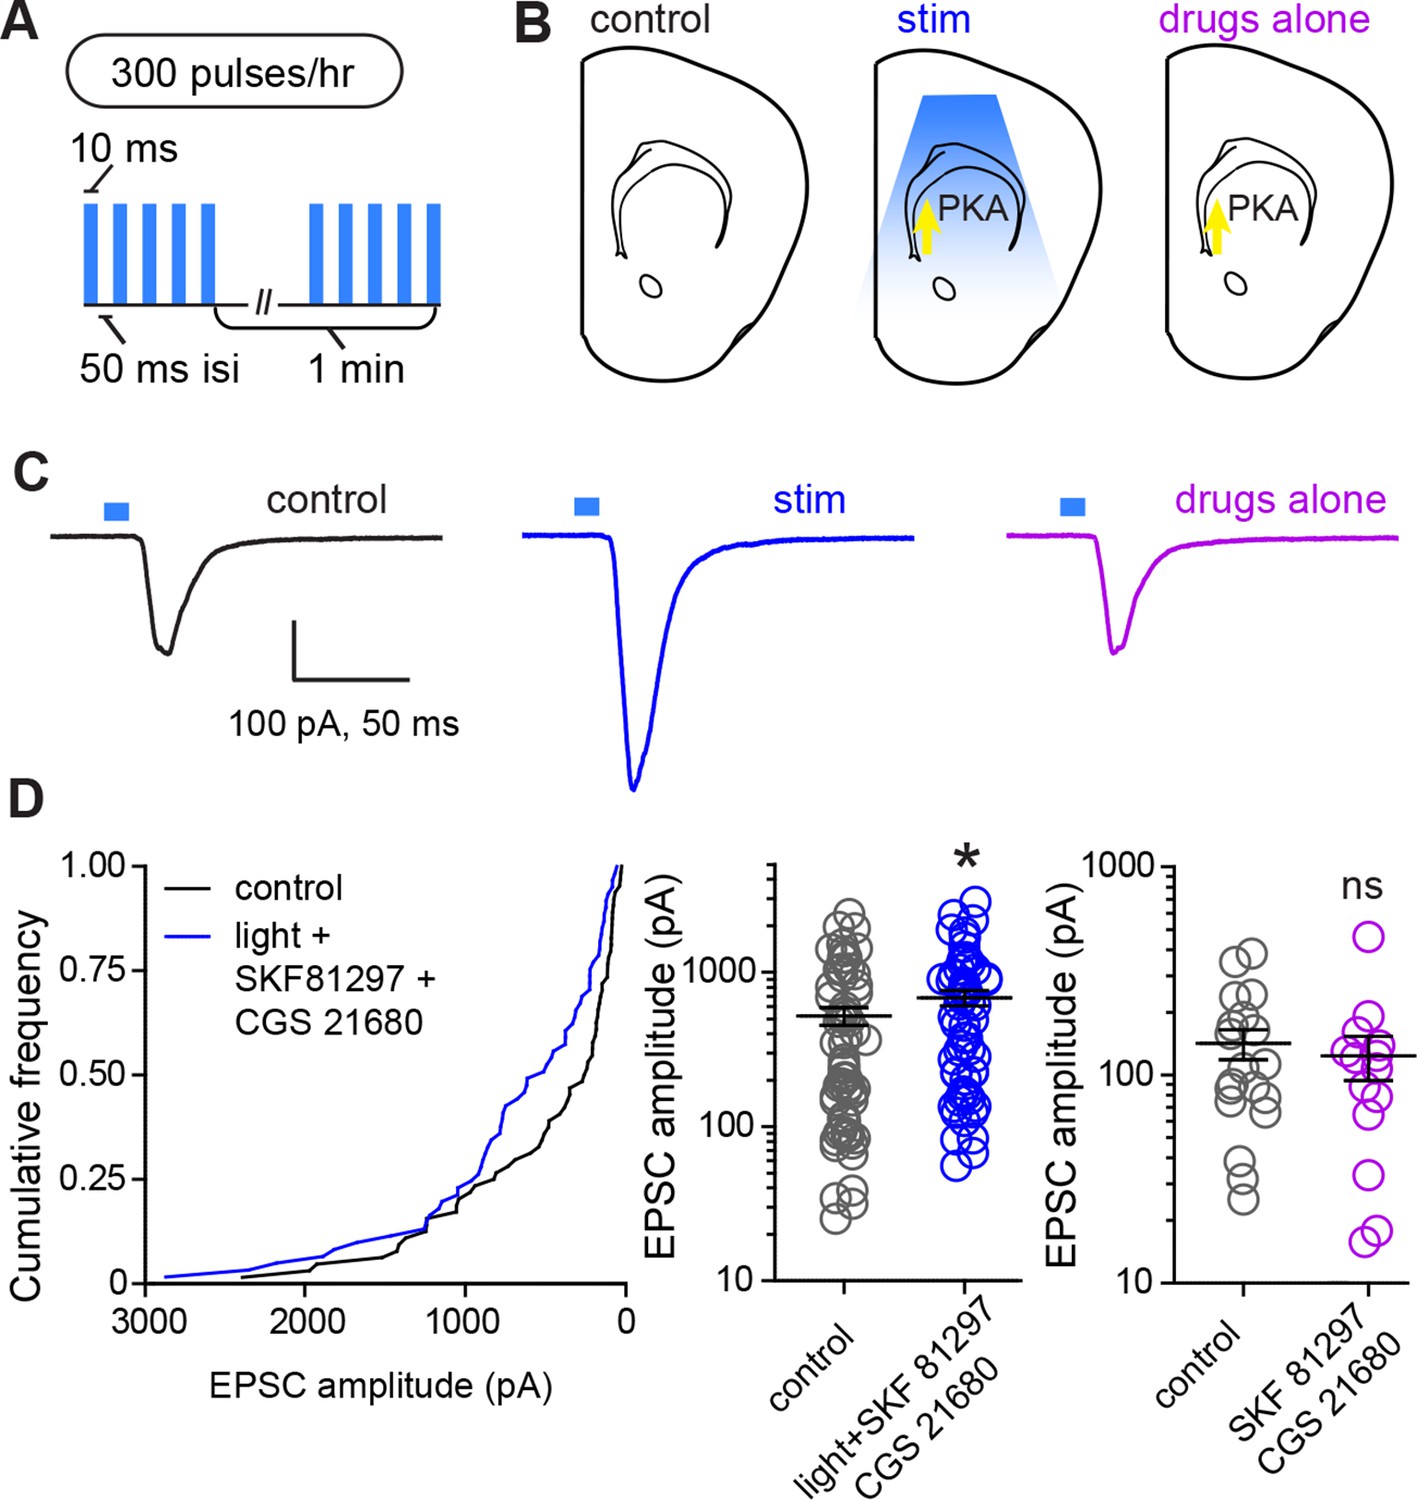
Glutamate release and Gαs-coupled receptor activation are sufficient to rapidly enhance corticostriatal connectivity in brain slices.
(A) Experimental schematic for optogenetic stimulation parameters. (B) Graphic representation of stimulation conditions in the acute slice. (C) Example traces showing average evoked EPSCs for representative neurons in control, stimulation (light+Gαs-coupled receptor agonists) and drugs only conditions. (D) Average amplitudes of optogenetically evoked EPSCs. Left, cumulative distribution of responses in control and stimulated groups. Group averages are shown on the middle and right graphs. Single neurons are represented by circles, error bars reflect SEM.
Figure 6
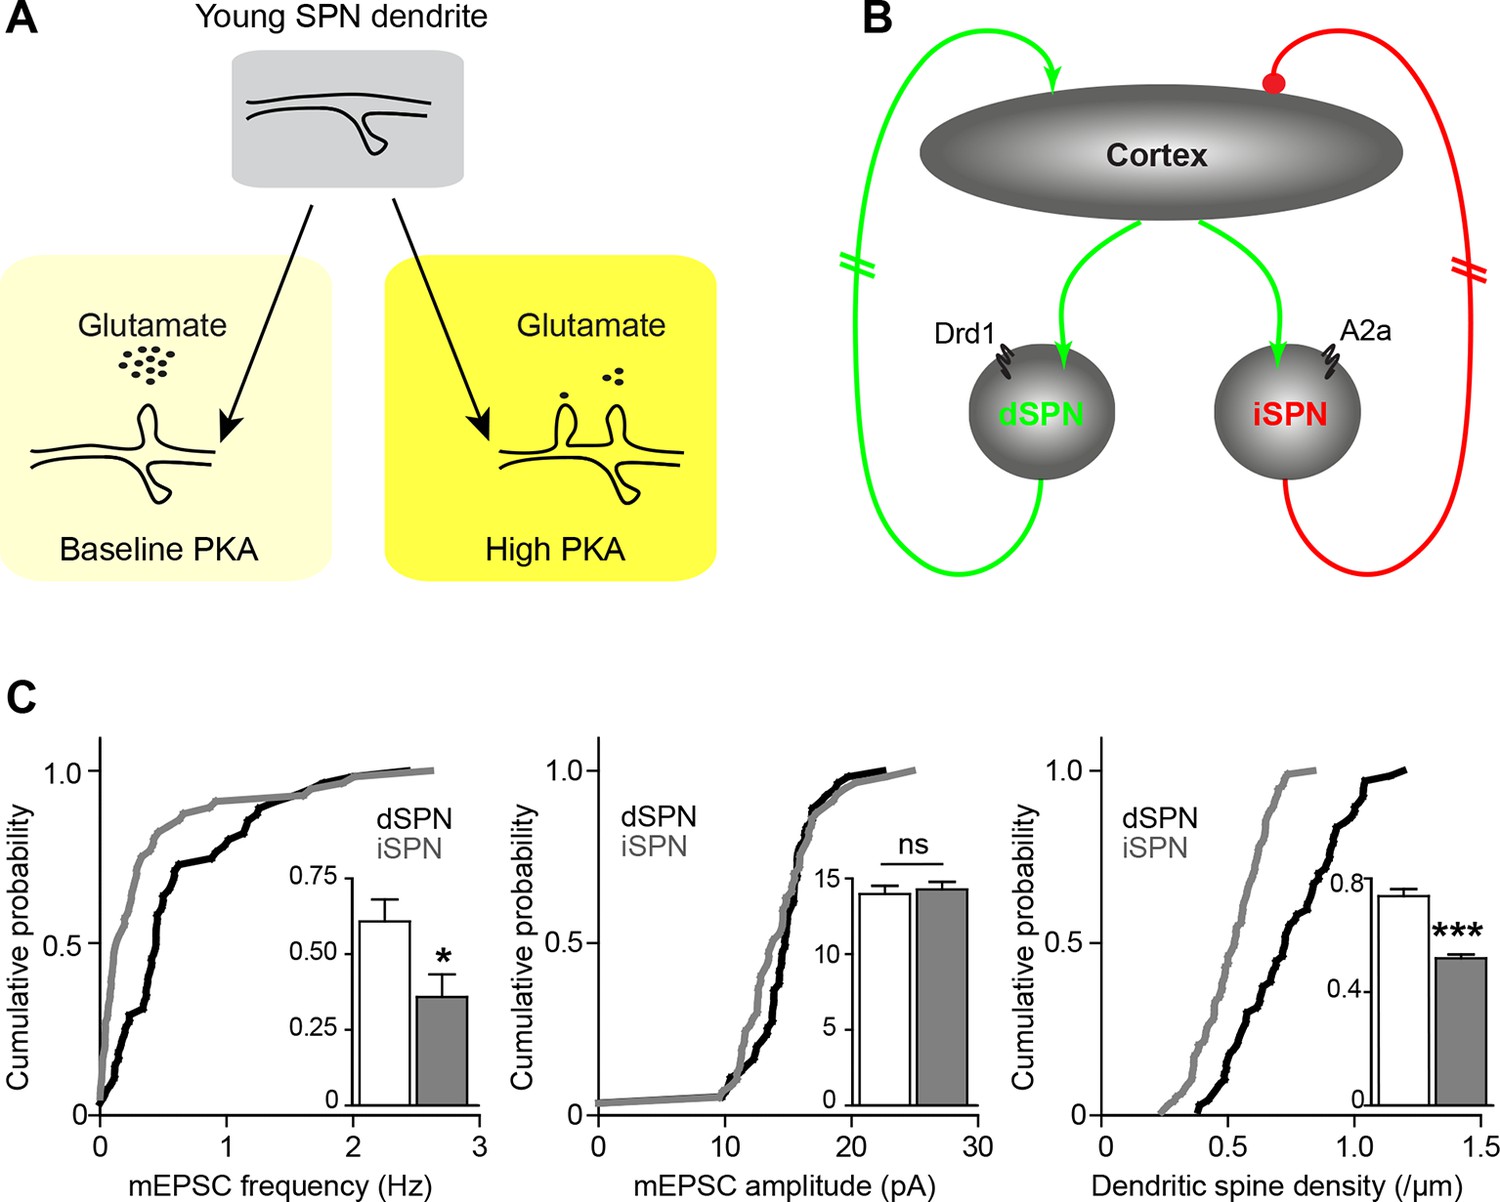
Pathway bias and neuromodulatory control of SPN excitatory synaptogenesis during development.
(A) Schematic summarizing the key result of this study. Neuromodulation, acting via PKA, regulates glutamate-dependent developmental synaptogenesis. (B) These results fit into the larger framework of the basal ganglia model, which indicates that through polysynaptic recurrent loops involving the neocortex, dSPN activity is positively coupled to striatal glutamate release onto SPNs of both pathways, whereas indirect pathway activity provides negative feedback. (C) Together the two models can account for a transient developmental bias towards the earlier innervation of dSPNs over iSPNs. During development, dSPNs have greater dendritic spine density and miniature EPSC frequency but not amplitude, compared to iSPNs. These graphs represent re-analyses of control data from a previously published study (Kozorovitskiy et al., 2012).
Download links
A two-part list of links to download the article, or parts of the article, in various formats.
Downloads (link to download the article as PDF)
Open citations (links to open the citations from this article in various online reference manager services)
Cite this article (links to download the citations from this article in formats compatible with various reference manager tools)
Neuromodulation of excitatory synaptogenesis in striatal development
eLife 4:e10111.
https://doi.org/10.7554/eLife.10111


