PROTAC-induced protein structural dynamics in targeted protein degradation
- Department of Chemistry, University of California, Riverside, United States
- Department of Bioengineering, University of California, United States
Figures
Figure 1 with 2 supplements
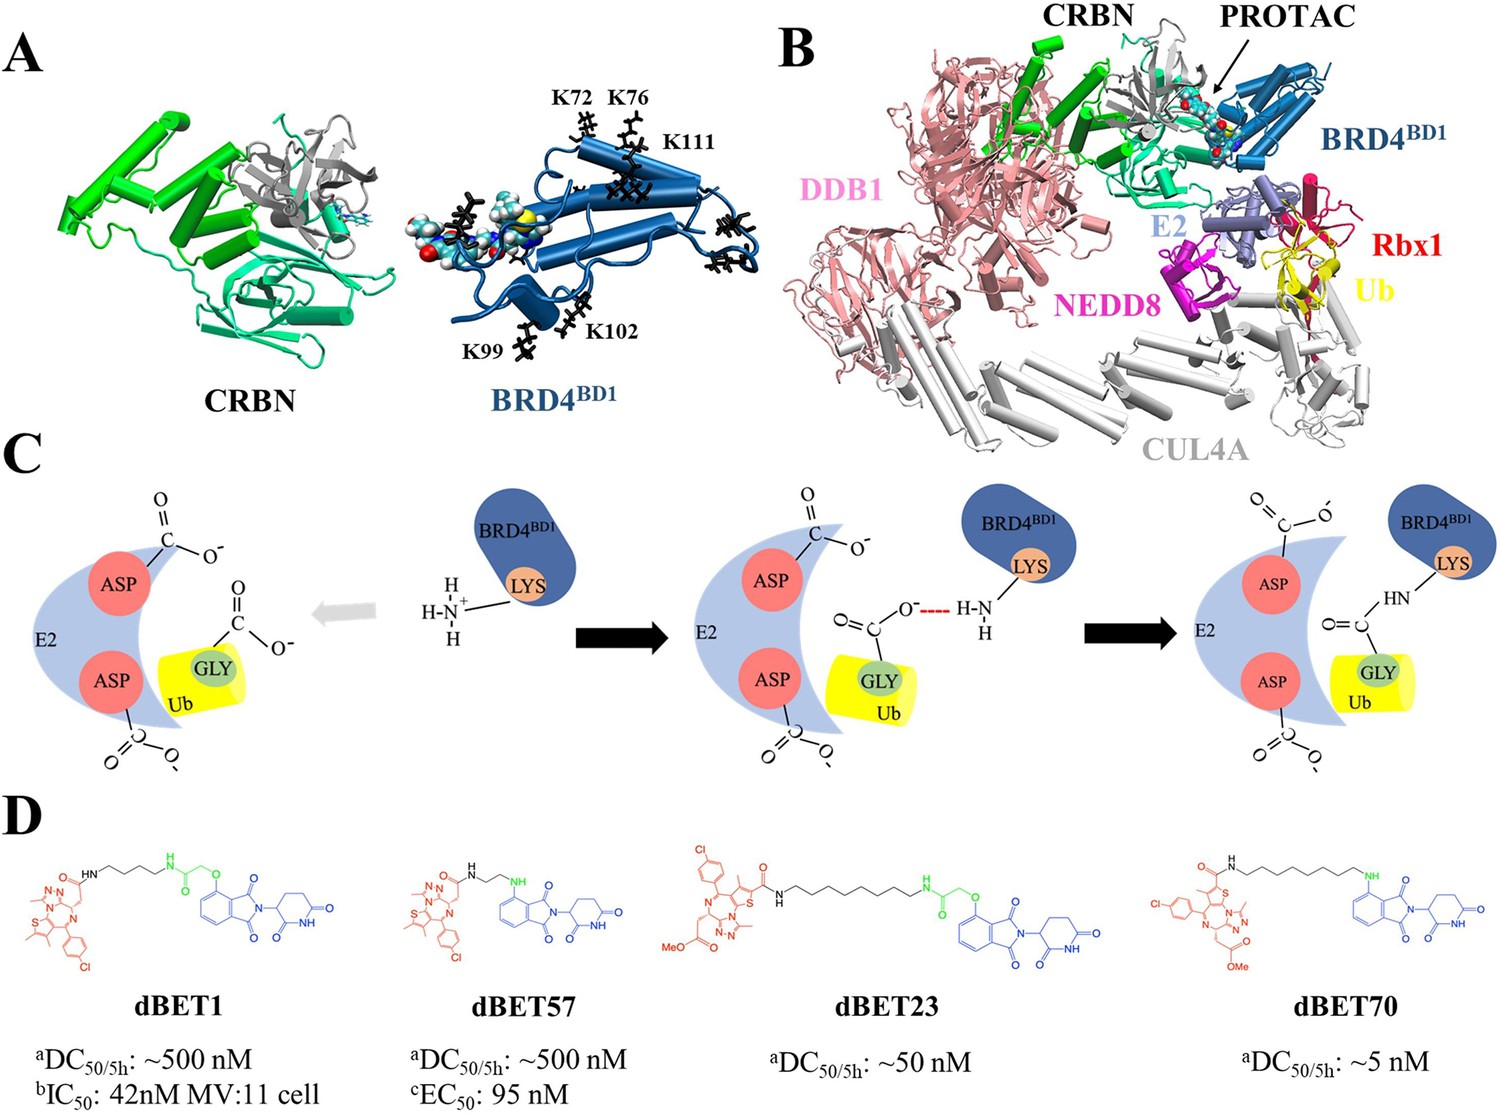
Structures of PROteolysis TArgeting Chimera (PROTAC)-mediated degradation machinery complex.
(A) Cereblon (CRBN) E3 ligase, consists of an N-terminus domain (mint), helical binding domain (green), and C-terminus domain (gray). Notably, CRBN E3 ligase is also simply termed CRBN in the main text. Bromodomain-containing protein 4 (BRD4BD1; targeted protein) consists of several important Lys residues (K72/76/99/102/111 black sticks) for successful degradation. (B) Degradation machinery complex is constructed with DDB1, CUL4A, NEDD8, Rbx1, E2 enzyme, ubiquitin (Ub), and CRBN-PROTAC-BRD4BD1. Note, the complex without PROTAC recruited BRD4BD1 is termed CRLA4A E3 ligase. (C) An illustration of the theoretical model of ubiquitination reaction. The catalytic site with multiple Asp residues creates a negatively charged environment that attracts Lys residues to enter the catalytic site. Lys and Asp residues then react with the C-terminus Gly of Ub for future degradation. (D) Chemical structure of each dBET PROTAC. aDegradation profile DC50/5h for four PROTACs was obtained from EGFP/mCherry reporter assay published in Nowak et al., 2018. bData published in Qin et al., 2018. cData published in Nowak et al., 2018.
Figure 1—figure supplement 1
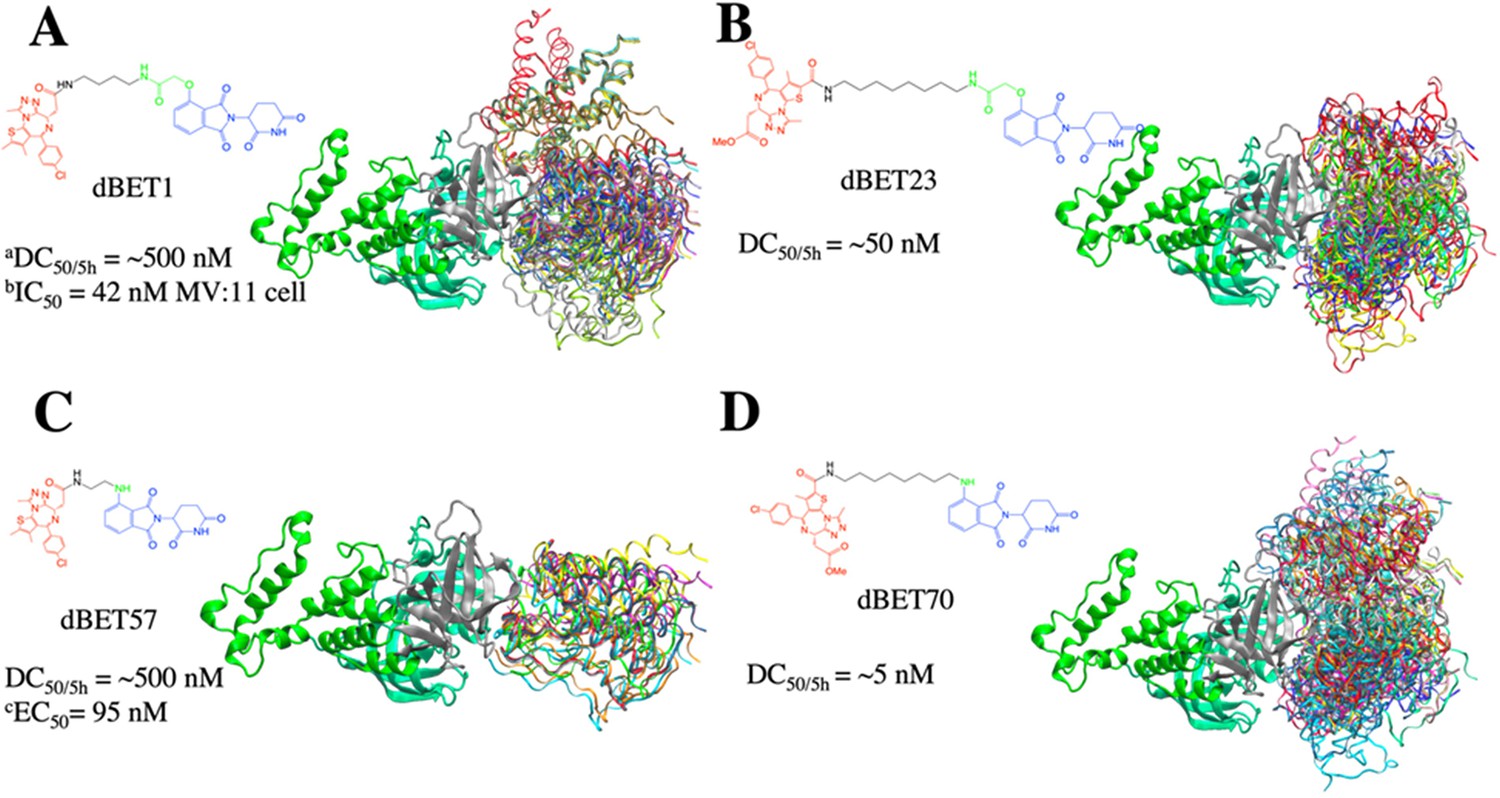
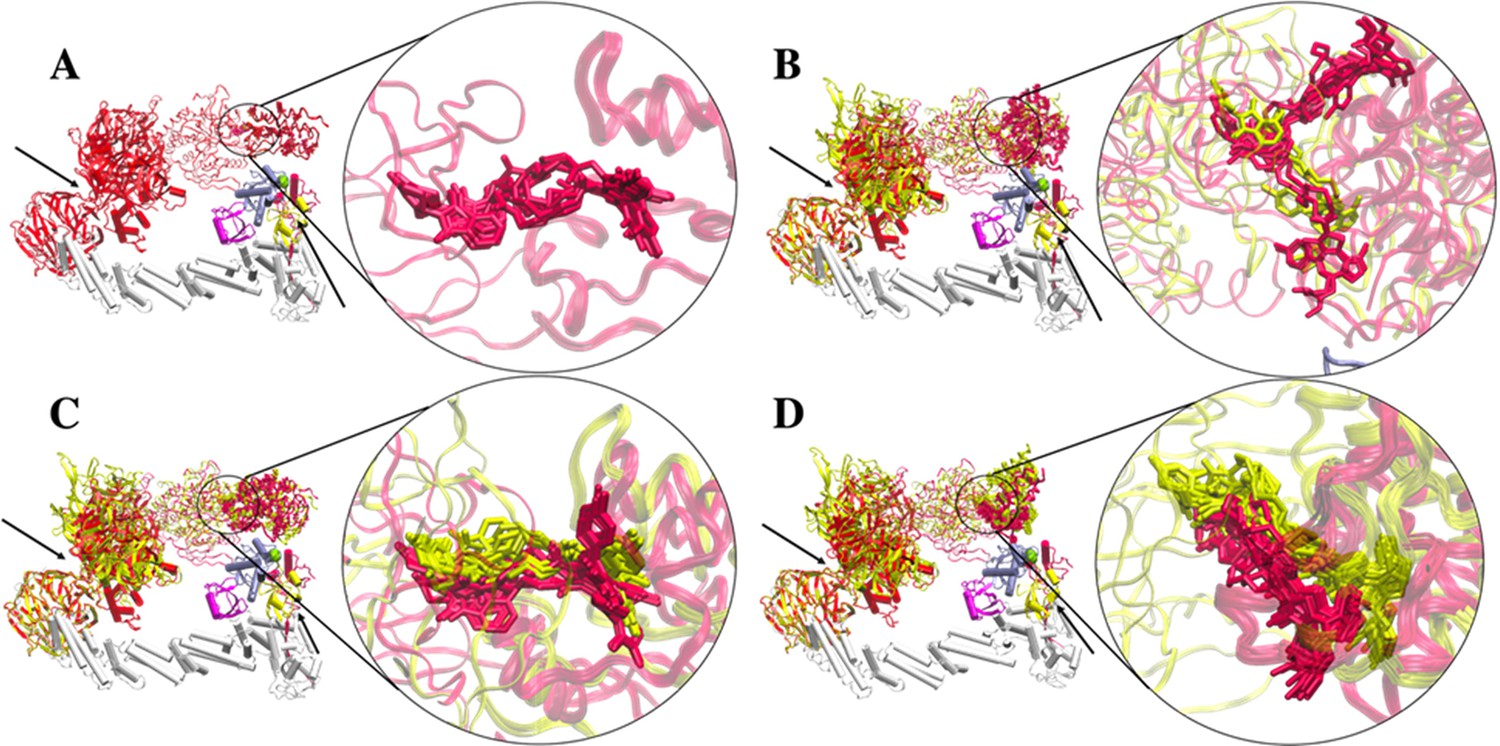
Conformational ensembles of ternary complexes (CRBN-degrader of bromodomain and extra-terminal domain (dBETx)-BRD4BD1) from protein–protein docking.
All protein–protein docking conformations for each PROTAC were superimposed based on CRBN (thick, ribbon) to show different poses of BRD4BD1 (rainbow color; ribbon). Each dBET PROTAC has multiple binding poses that contribute to different degradation efficiency. (A) dBET1 with 186 ternary complex conformations. (B) dBET23 with 168 ternary complexes. (C) dBET57 with 24 ternary complexes. (D) dBET70 with 183 ternary complexes. aDegradation profile DC50/5h for four PROTACs was obtained from EGFP/mCherry reporter assay published in Nowak et al., 2018. bData published in Qin et al., 2018. cData published in Nowak et al., 2018.
Figure 1—figure supplement 2
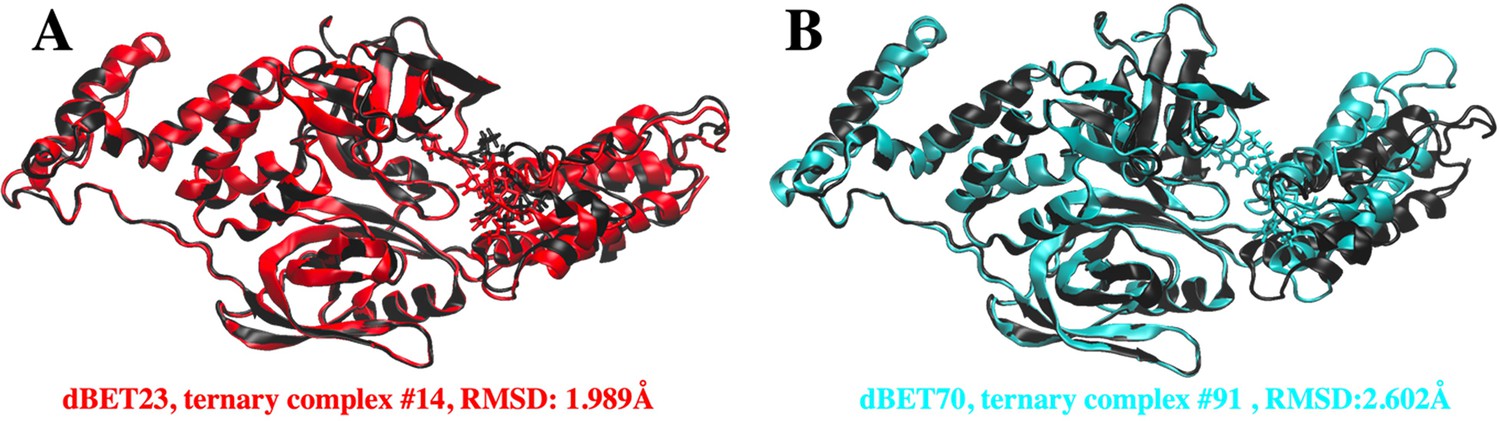
Superpositions of predicted CRBN-dBETx-BRD4BD1 ternary complexes (red for dBET23 and cyan for dBET70) with reported crystal structures (Black).
(A) Predicted CRBN-dBET23-BRD4BD1 ternary complex index #14 (red) has RMSD of 1.99 Å with respect to the crystal structure (PDB ID: 6BN7). (B) Predicted CRBN-dBET70-BRD4BD1 ternary complex index #91 (cyan) has RMSD of 2.60 Å with respect to the crystal structure (PDB ID: 6BN9). Note, dBET70 degrader was not resolved in the crystal structure. The structural superposition is performed based on the backbone of CRBN and RMSD calculation is conducted based on the backbone of BRD4BD1. PROTAC dBET23 and dBET70 are shown in licorice representation.
Figure 2 with 6 supplements
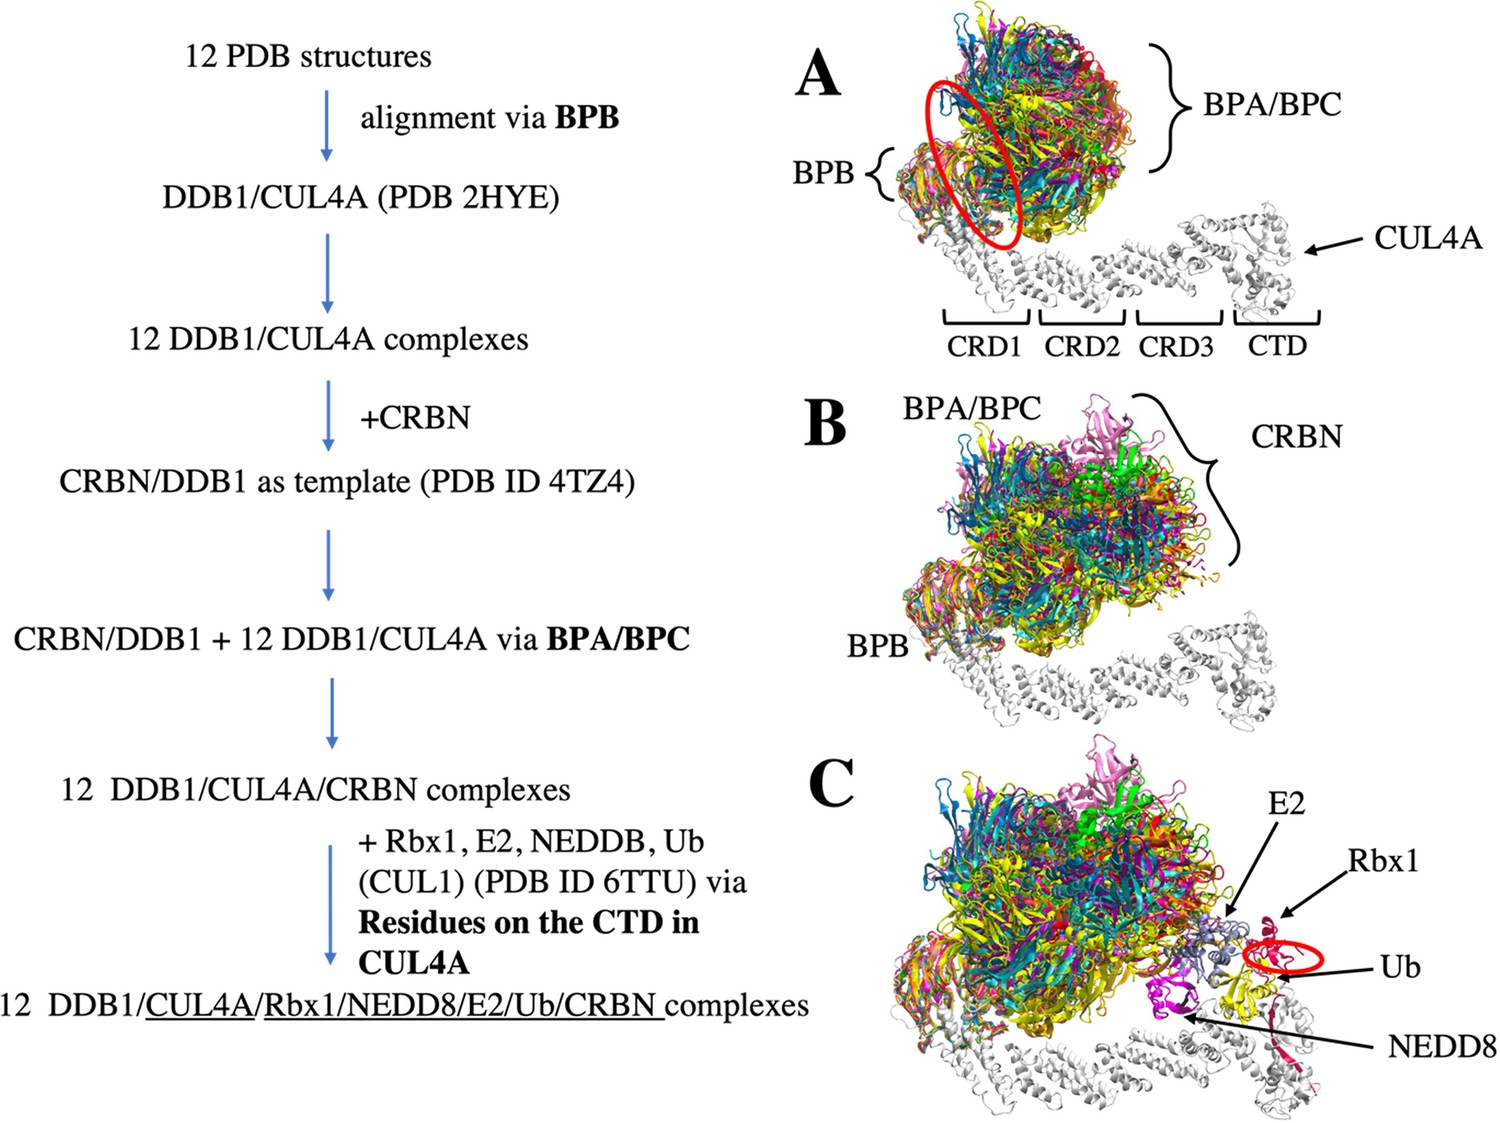
Flowchart of CRL4A E3 ligase scaffolds construction.
(A) structure alignments of 12 DDB1 PDB structures to the CUL4A based on the BPB part. Red circle indicates a hinge loop connecting BPB and BPA/BPC in DDB1. (B) Structure alignment of CRBN E3 ligase to the DDB1/CUL4A based on the BPA/BPC part, resulting 12 DDB1/CUL4A/CRBN scaffolds. (C) E2/Rbx1/Ub/NEDD8 components (PDBID: 6TTU) are added to the /DDB1/CUL4A/CRBN scaffolds to make 12 diverse CRL4A E3 ligase scaffolds. Red circle indicates another hinge loop in the Rbx1.
Figure 2—figure supplement 1
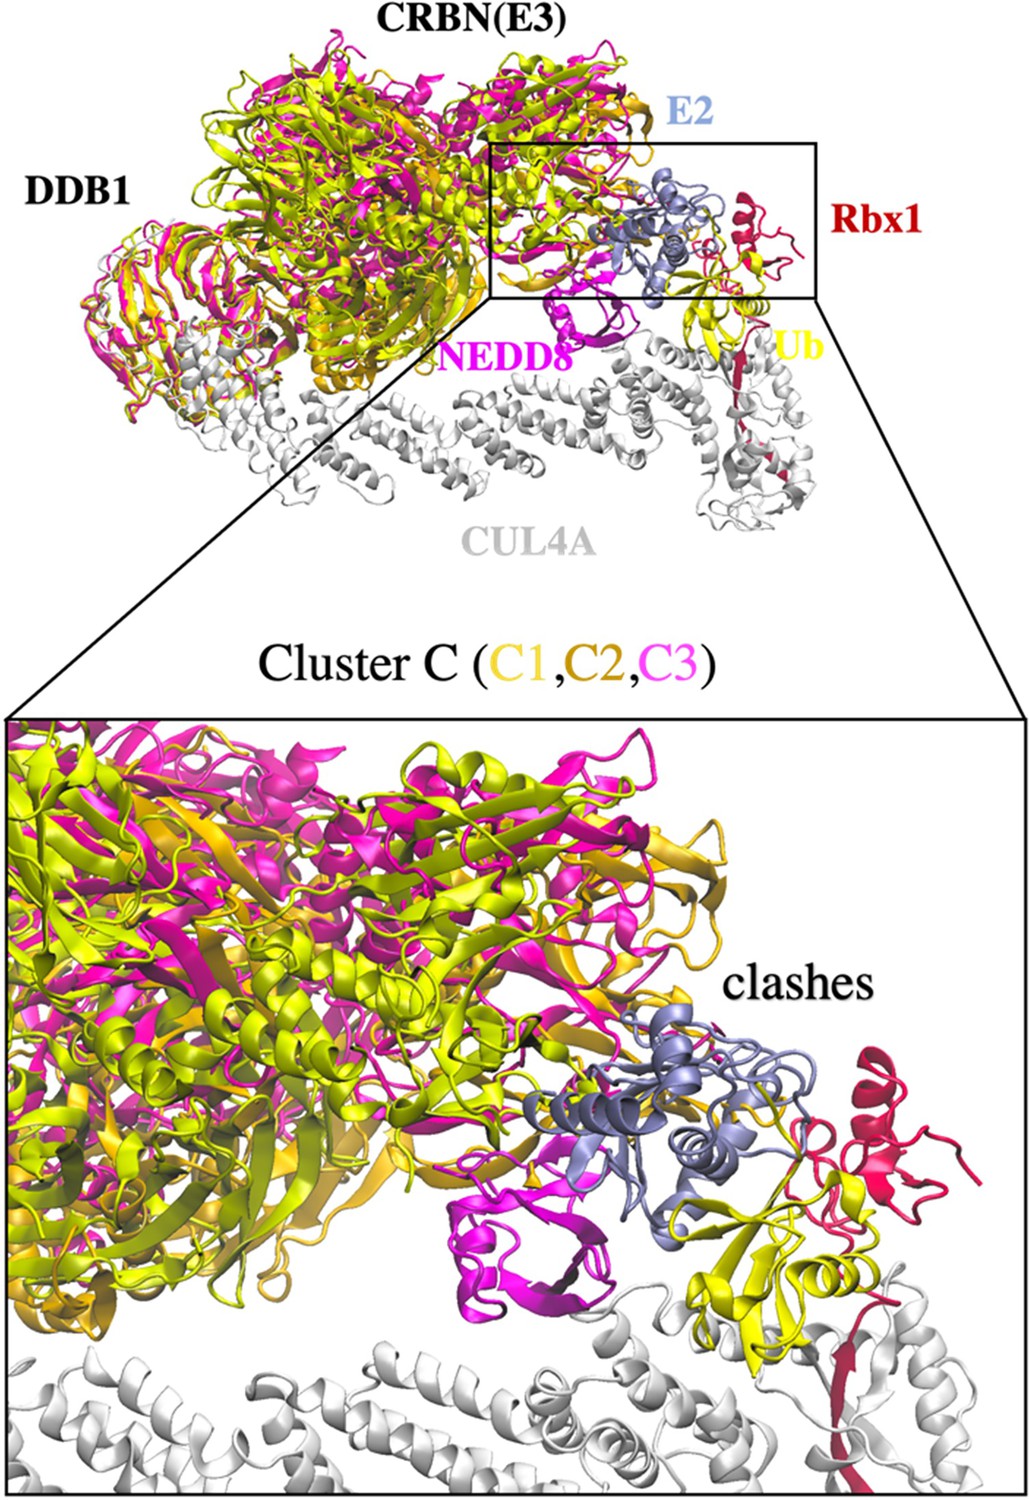
Cluster C with clashes between CRBN E3 and E2.
Three DDB1 conformations (C1, yellow; C2, gold; and C3, pink) were found to have protein clashing and is not considered for further degradation machinery complex construction.
Figure 2—figure supplement 2
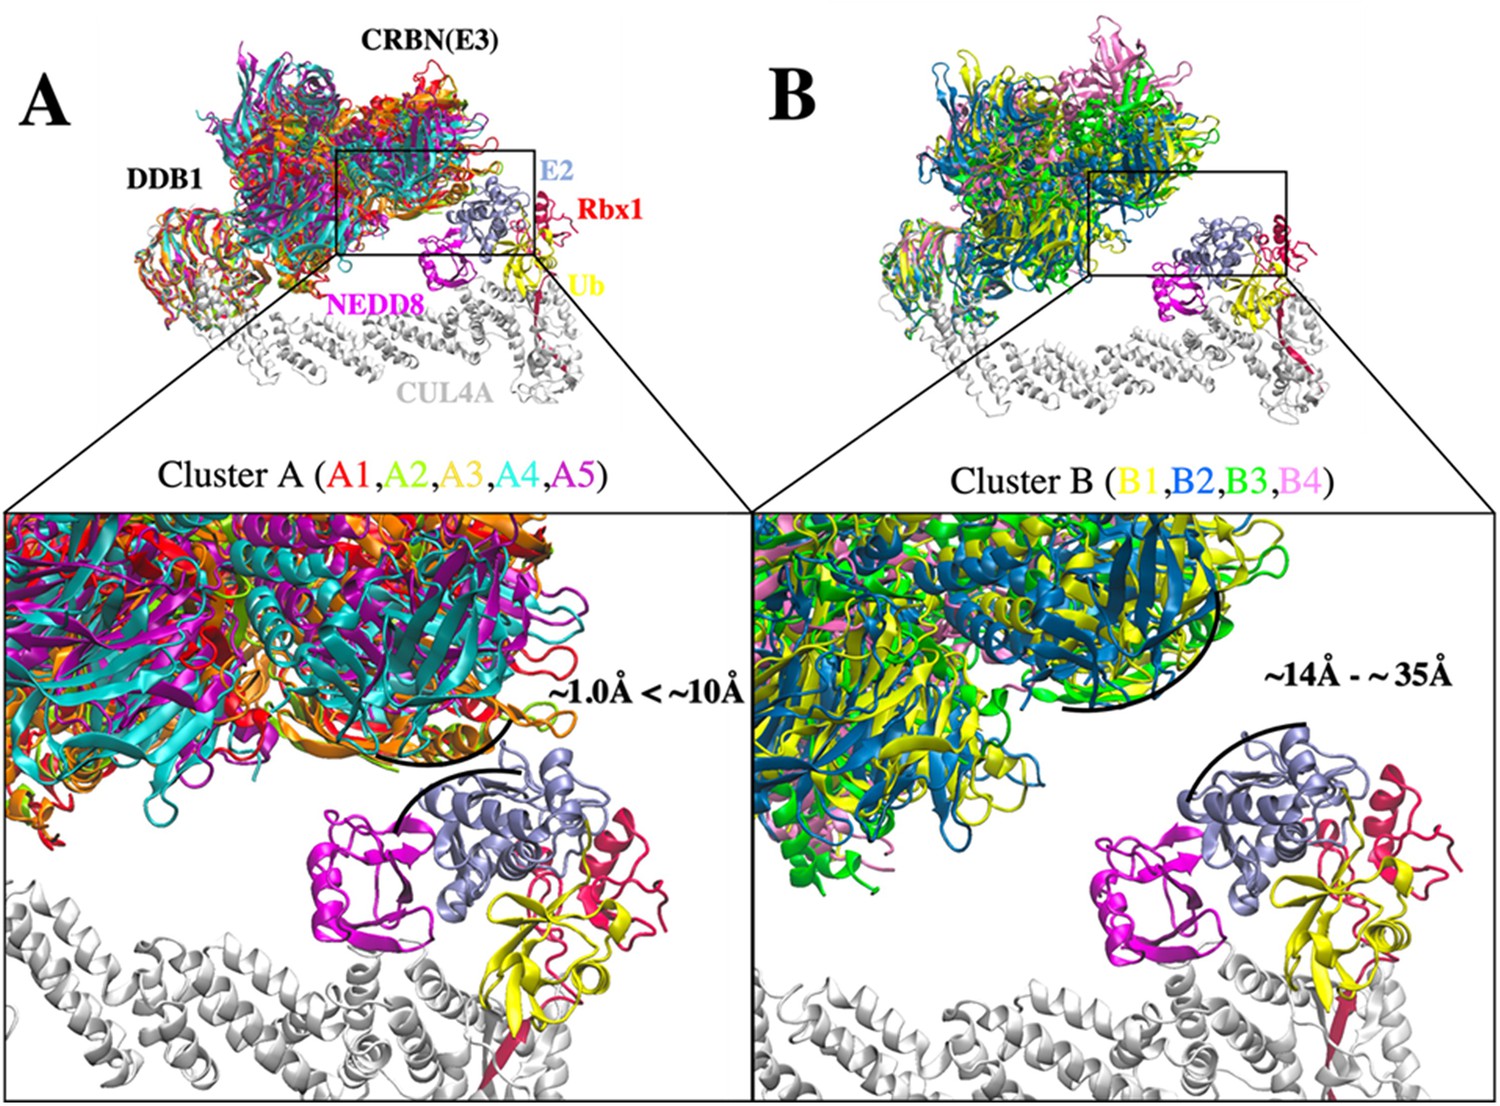
Conformational clusters of CRL4A E3 ligase scaffolds.
(A) Cluster A with interface distance between E2 and E3 ligase ranges from ~1.0 Å to ~10 Å. Five DDB1 conformations were analyzed and grouped in cluster A. A1 (red), A2 (mint), A3 (orange), A4 (cyan), and A5 (purple). (B) Cluster B with interface distance between E2 and E3 ligase ranges from ~14 Å to ~35 Å. Four DDB1 conformations were analyzed and grouped in cluster B. B1 (yellow), B2 (blue), B3 (green), and B4 (pink). Black curved lines indicate the E2–E3 interface distance in each cluster with the closest distance. All nine DDB1 conformations were aligned based on β-propeller domains in DDB1. Other protein components: CUL4A (white), NEDD8 (magenta), E2 (ice blue), Ub (yellow), and Rbx1 (red) were taken from PDB ID 6TTU and added to nine clusters to construct nine CRL4A E3 ligase scaffolds.
Figure 2—figure supplement 3
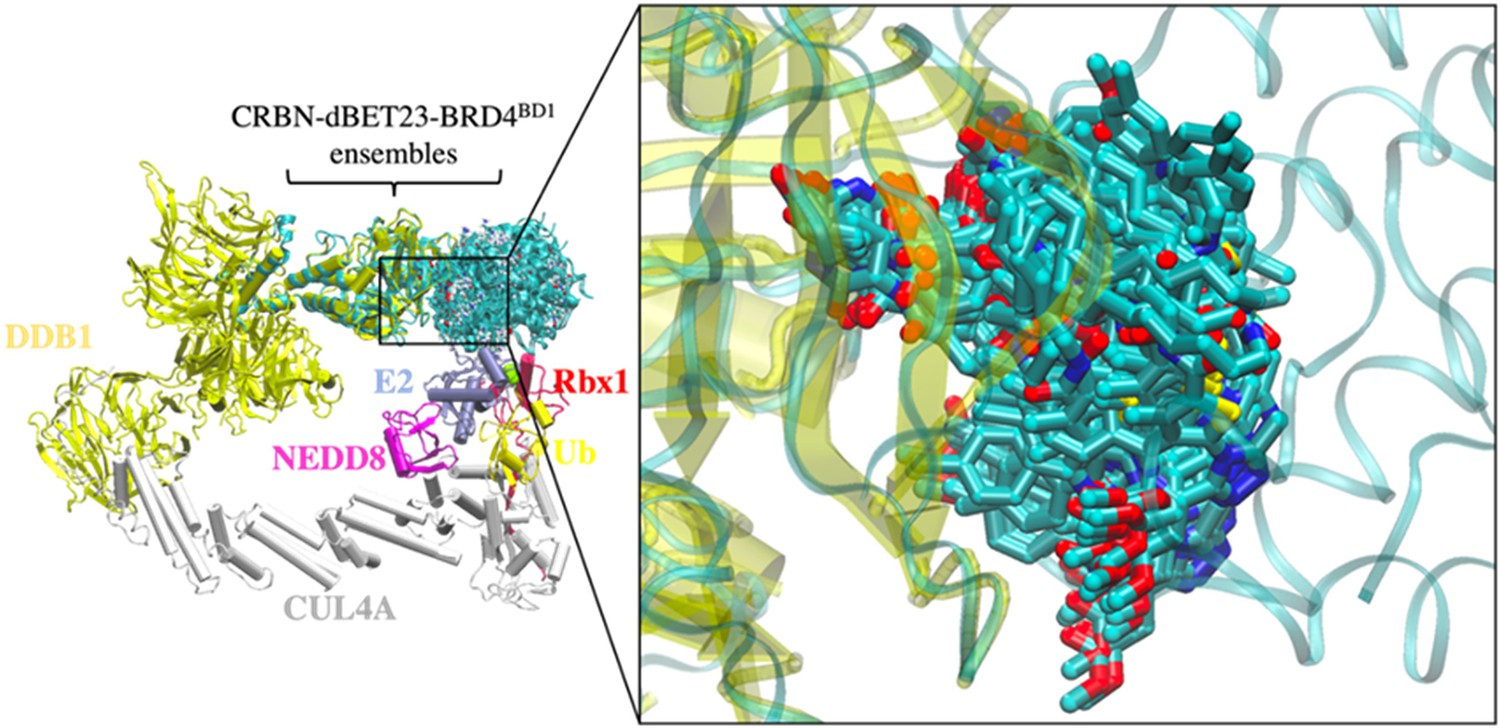
Conformational ensemble of dBET23 from protein–protein docking.
168 CRBN-dBET23-BRD4BD1 ternary complexes were applied to cluster B1 to construct 104 degradation machinery complexes. Ternary complexes were superimposed on the CRL4A E3 ligase by aligning the backbone of CRBN. The zoom-in region shows the flexibility of the linker of dBET23.
Figure 2—figure supplement 4
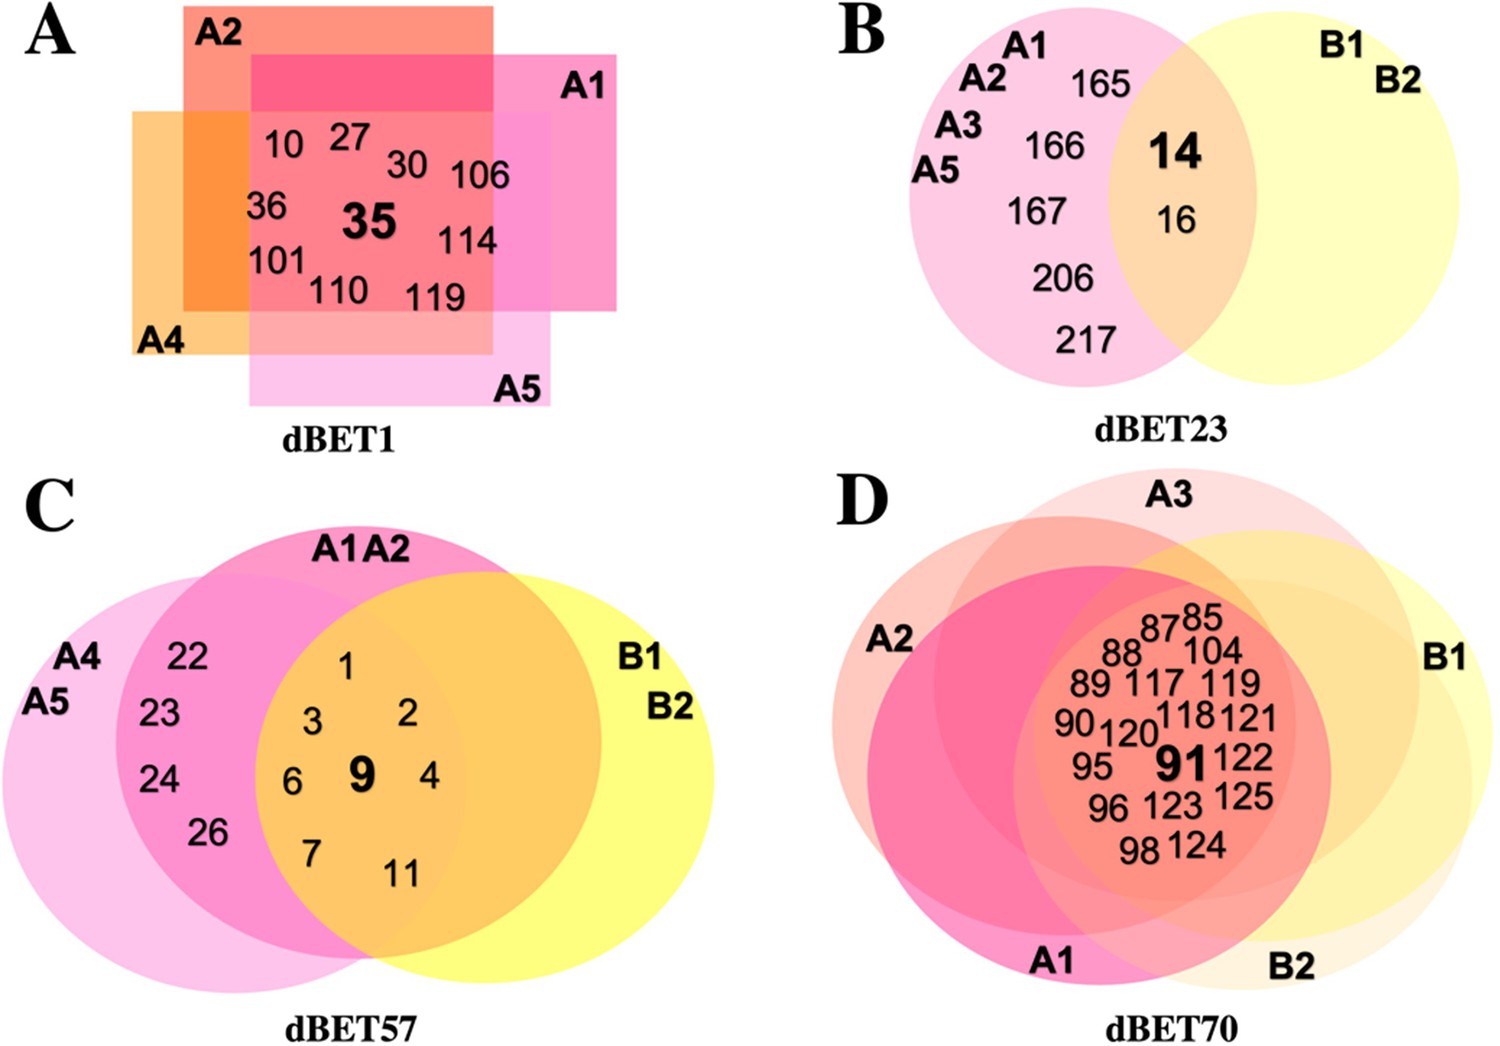
Overlapping diagram representation of common CRBN-dBETx-BRD4BD1 ensembles found in each degradation machinery complex.
Numbers represent ensemble index. (A) CRBN-dBET1-BRD4BD1 ensembles fall within A1, A2, A4 and A5 clusters. (B) CRBN-dBET23-BRD4BD1 ensembles fall within A1, A2, A3, A5, B1, and B2 clusters. (C) CRBN-dBET57-BRD4BD1 ensembles fall within A1, A2, A4, A5, B1, and B2 clusters. (D) CRBN-dBET70-BRD4BD1 ensembles fall within A1, A2, A3, B1, and B2 clusters.
Figure 2—figure supplement 5
Clusters of PROTAC conformations from top-ranked docking scores.
Aligning CRBN of the two representative clusters A1 and B1 shows similar PROTAC conformations. (A) dBET1. No ternary complex is found in cluster B1 for dBET1. (B) dBET23. (C) dBET57. (D) dBET70. Cluster A1 (red) and Cluster B1 (yellow). Black arrows indicate the hinge loops in both DDB1 and Rbx1 proteins. CUL4A (white), NEDD8 (magenta), E2 (ice blue), Ub (light yellow), and Rbx1 (rose).
Figure 2—figure supplement 6
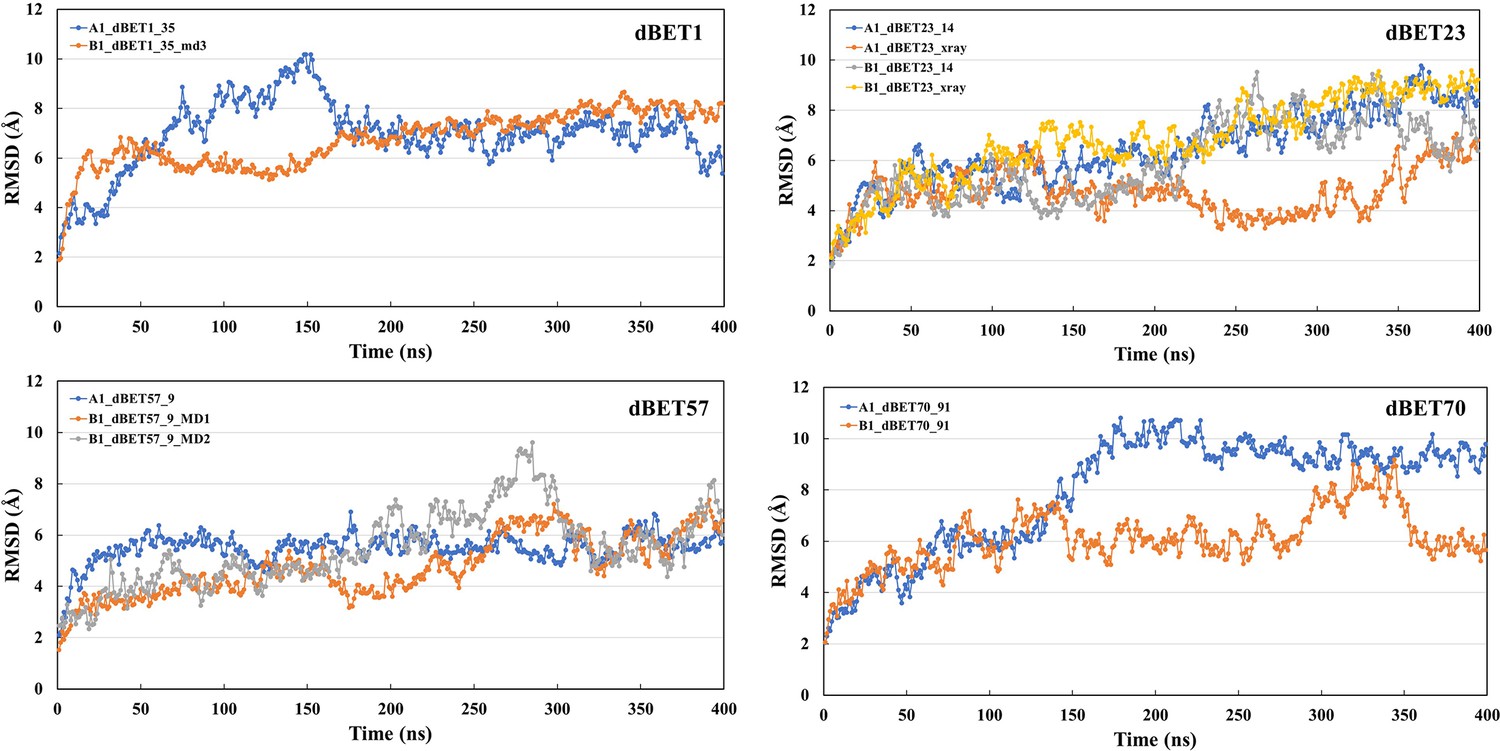
Root-mean-squared deviation (RMSD) analysis for each degradation machinery complexes.
The RMSD was calculated based on the backbone atoms and the first frame of the trajectory was used as reference.
Figure 3 with 2 supplements
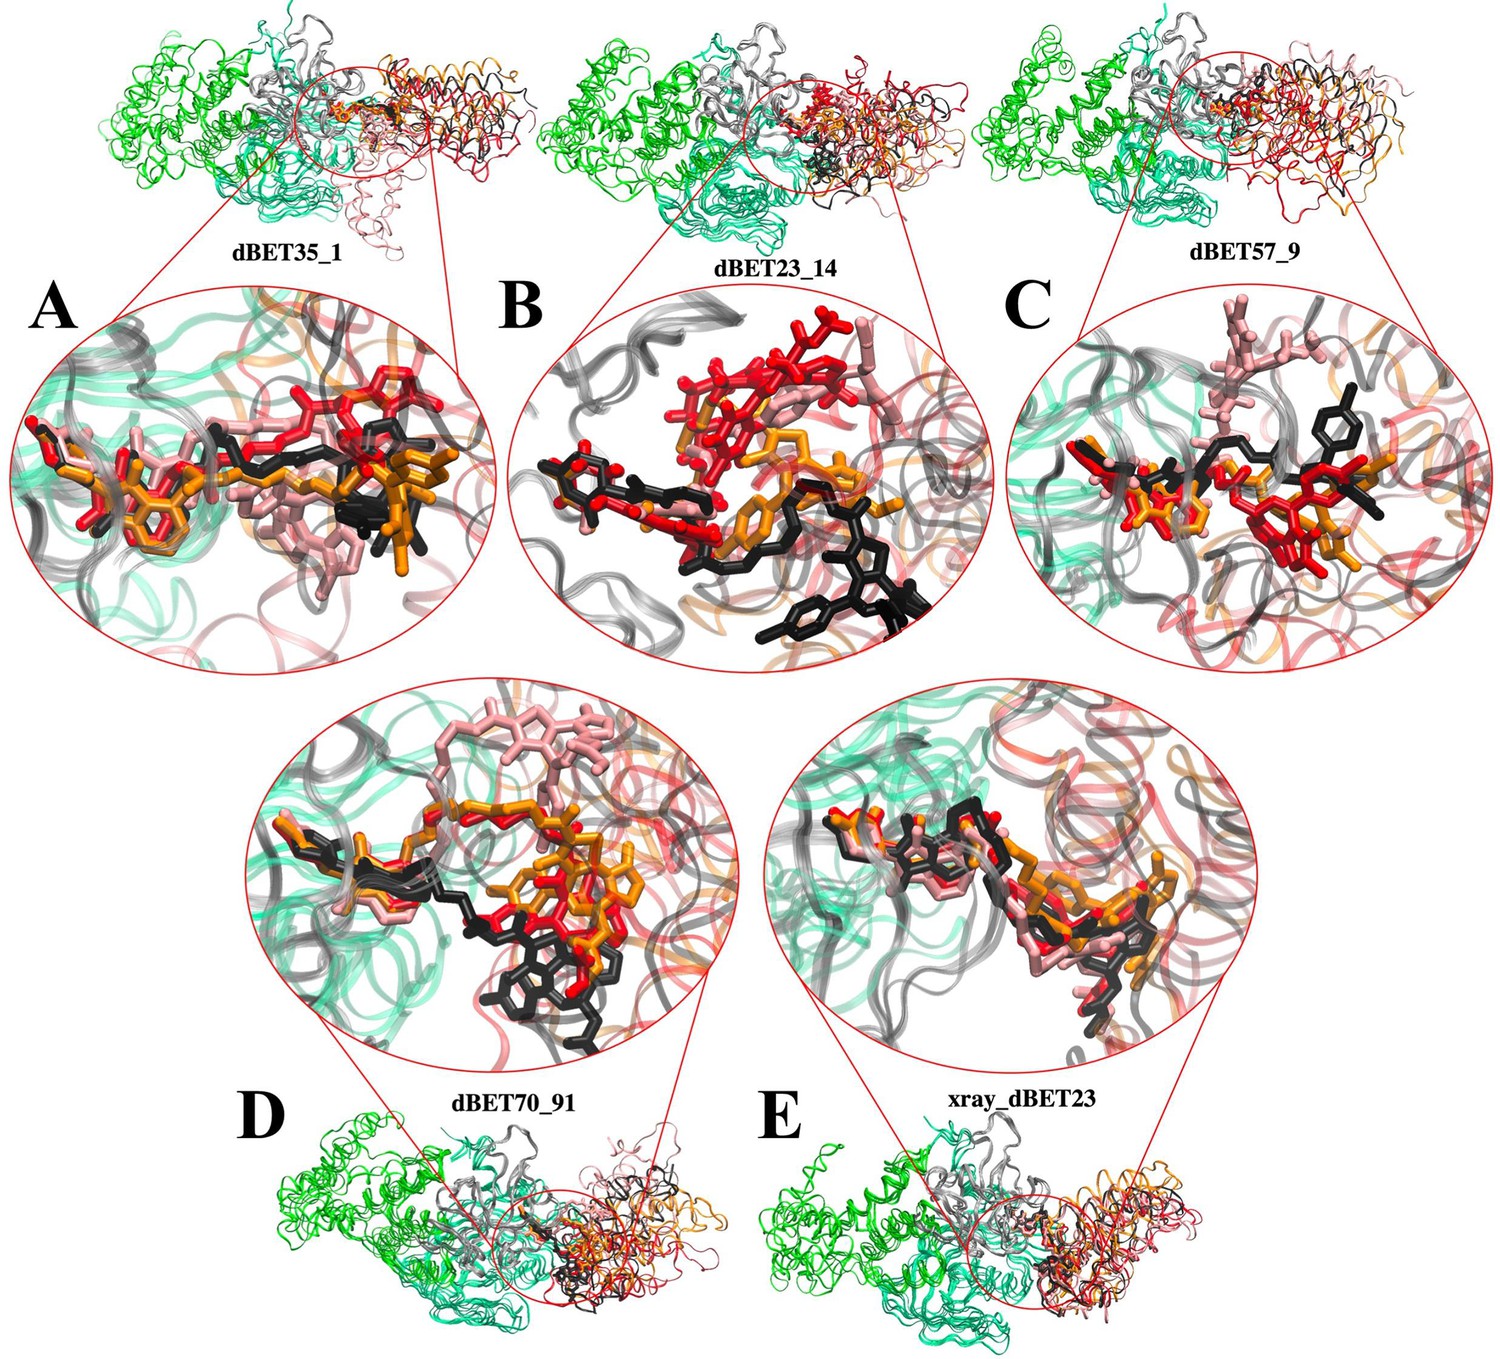
Flexibility of dBET PROTACs.
The last molecular dynamics (MD) frame from three MD runs was aligned with initial frame of the C-terminus domain (gray) of CRBN. Two warheads bound tightly to the respective proteins, whereas the linker is highly flexible, adopting various conformations. MD run 1 (red), MD run 2 (pink), MD run 3 (orange), and initial frame (black). (A) CRBN-dBET1_#35-BRD4BD1. (B) CRBN-dBET23_#14-BRD4BD1. (C) CRBN-dBET57_#9-BRD4BD1. (D) CRBN-dBET70_#91-BRD4BD1. (E) CRBN-dBET23xray-BRD4BD.
Figure 3—figure supplement 1
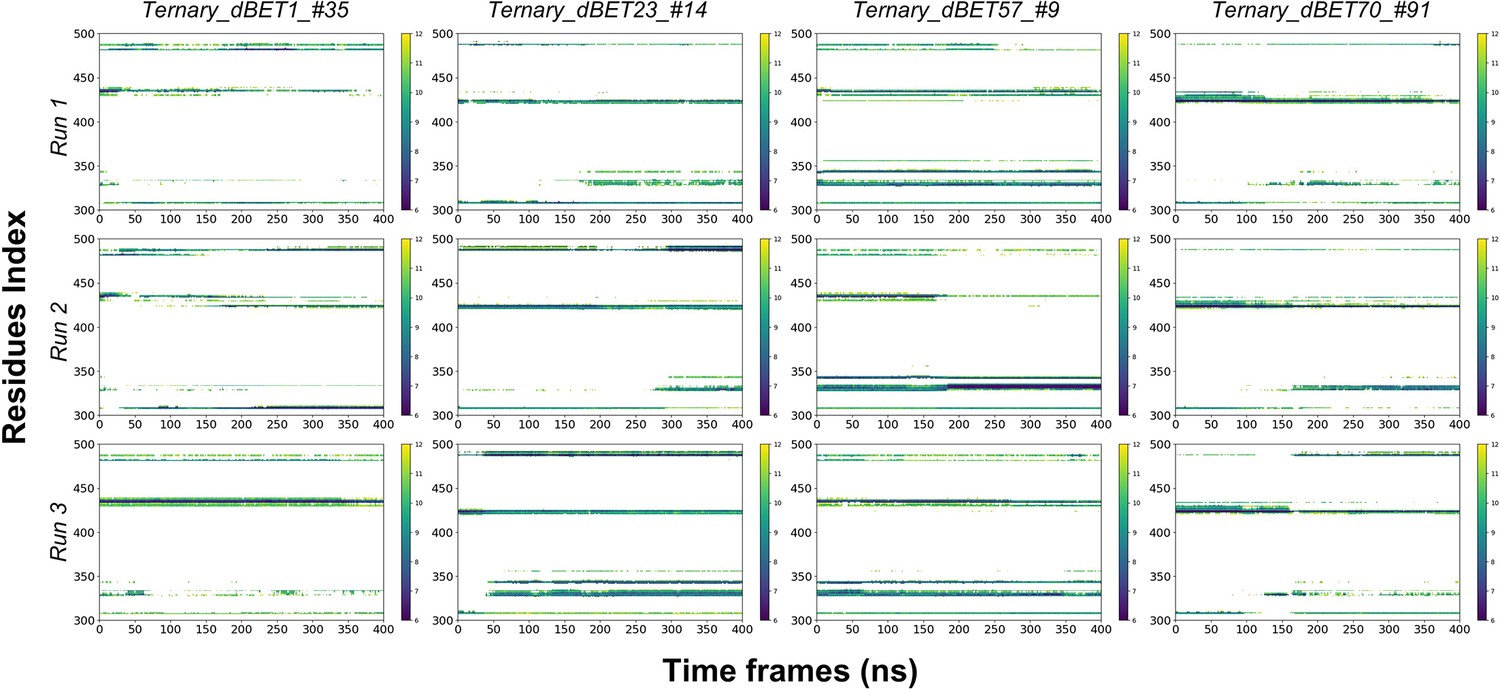
Residues Contact map between PROTACs and BRD4BD1 throughout 400ns of MD simulation.
X-axis is the residues index of BRD4BD1 and y-axis is the Time of MD simulation. The distance cutoff is 12Å.
Figure 3—figure supplement 2
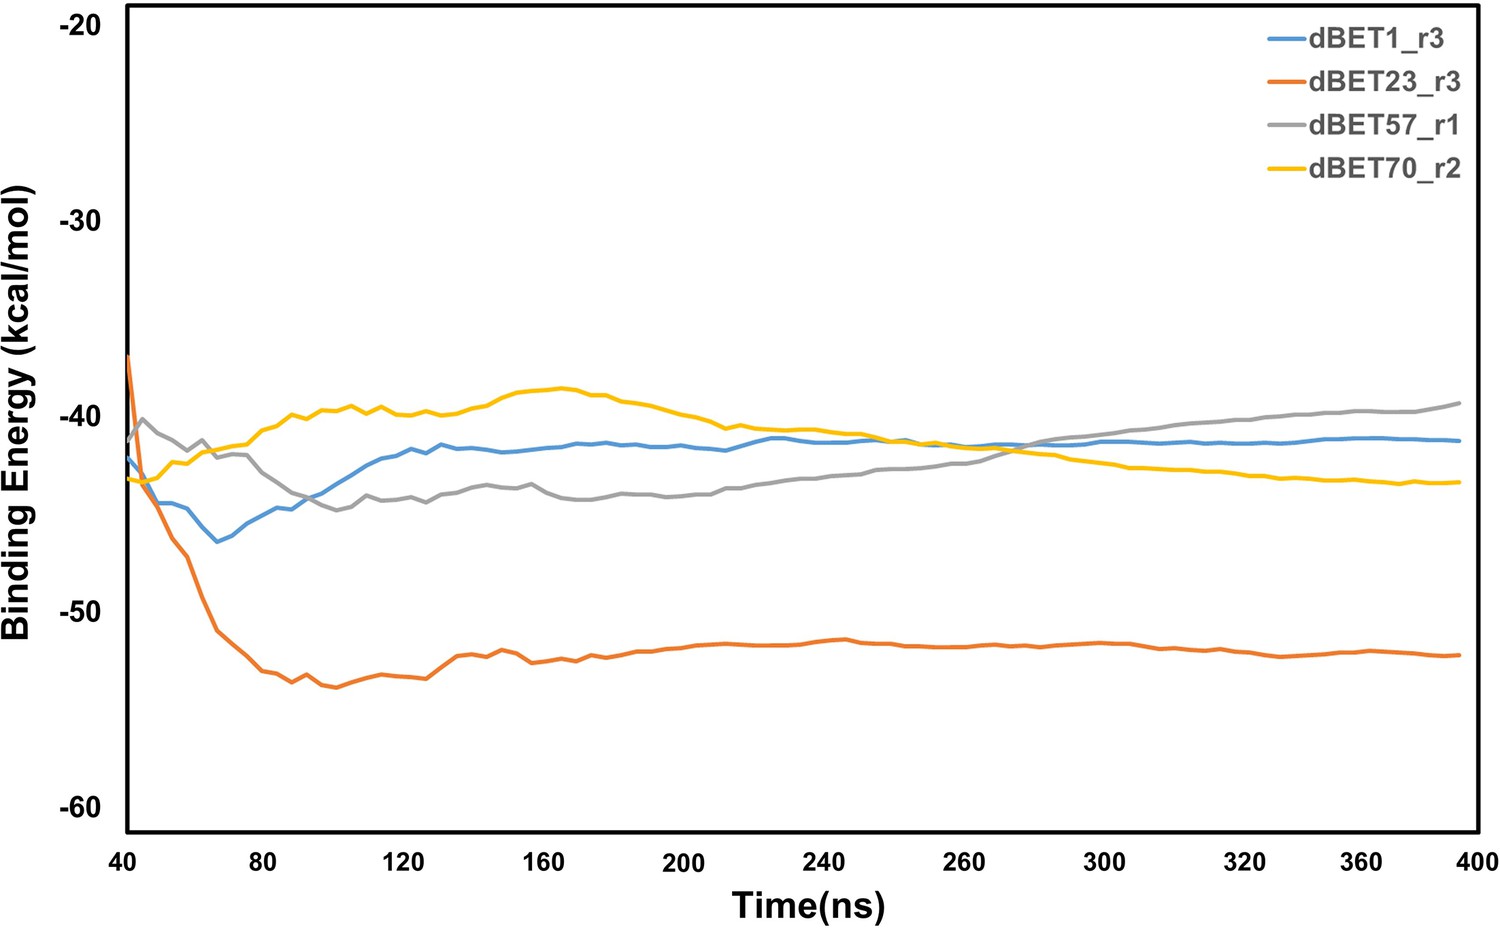
Analysis of protein-protein interaction energies of ternary complexes for each dBETs.
Computed nonbonded interaction energy between proteins (CRBN-BRD4BD1) and different dBETs using the MD runs of our selected ternary complexes. (See Materials and methods) Only the lowest interaction energy among the 3 random seeds MD simulations is reported here. Note that the energy calculations focus on non-bonded intermolecular interactions and solvation free energy calculations using MM/PBSA, where the configuration entropy loss during protein binding was not explicitly included.
Figure 4 with 3 supplements
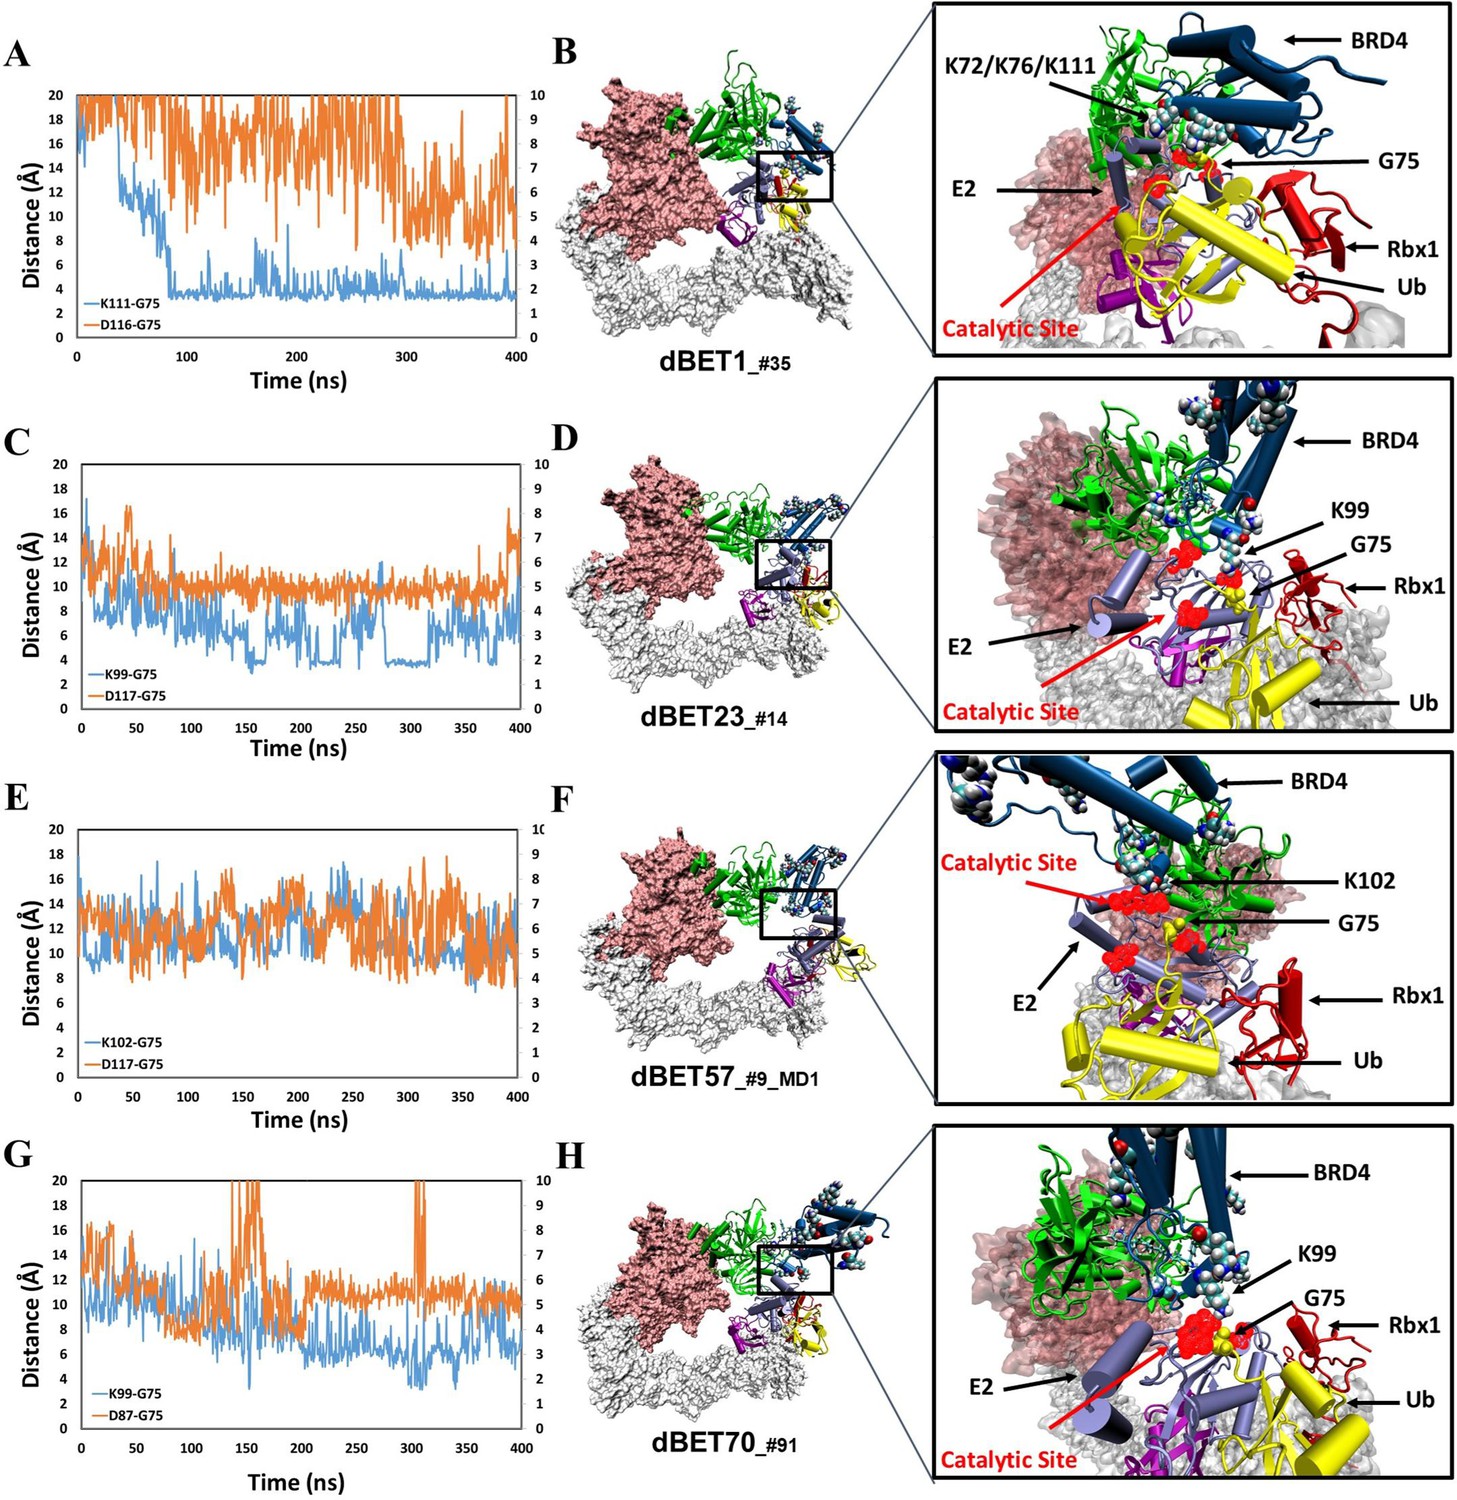
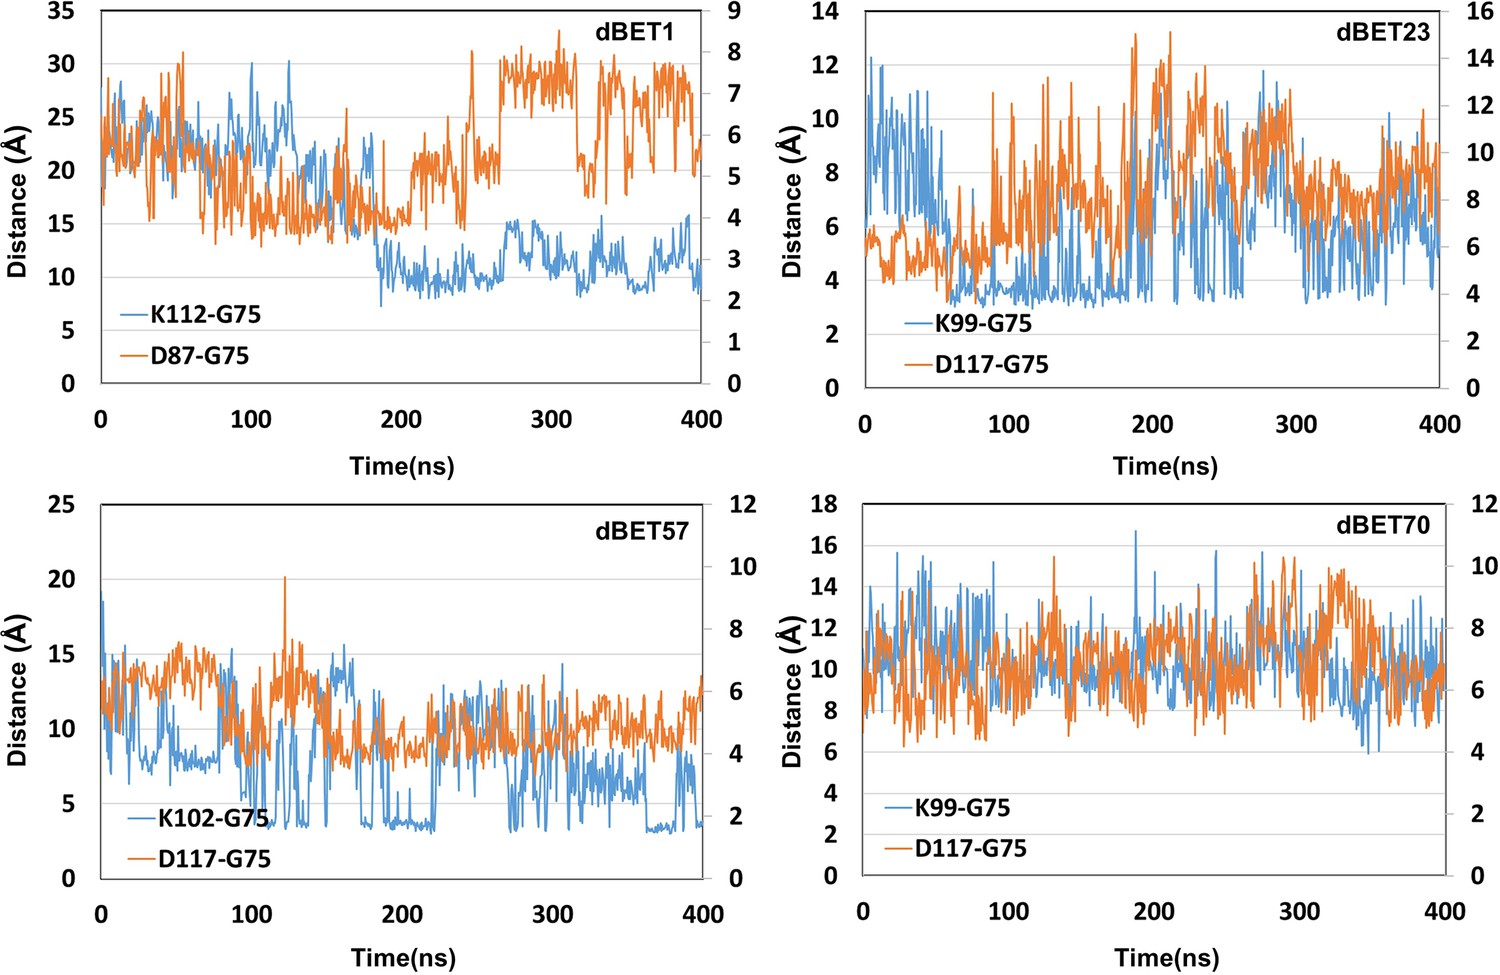
structural dynamics and local interaction of each degradation machinery.
(A) K111 and D116 of dBET1_#35 (Distance of K72/76 is reported in Figure 4—figure supplement 1). The left y-axis in blue presents the distance between Lys (N atom) of BRD4BD1 and Gly (C atom) of Ub, and the right y-axis in red presents the distance between Asp (O atom) of E2 and Gly (O atom) of Ub. The same left and right y-axis representations are used in C, E and G. (B) K72/76/111 of BRD4BD1 reaches the negatively charged catalytic site of E2. (C) K99 and D117 of dBET23_#14. (D) K99 of BRD4BD1 reaches the negatively charged catalytic site of E2. (E) K102 and D117 of dBET57_#9_MD1. (F) K102 of BRD4BD1 reaches the negatively charged catalytic site of E2. (G) K99 and D87 of dBET70_#91. (H) K99 of BRD4BD1 reaches the negatively charged catalytic site of E2. (refer to Figure 4—figure supplement 3 for data of second seed of MD simulation).
Figure 4—figure supplement 1
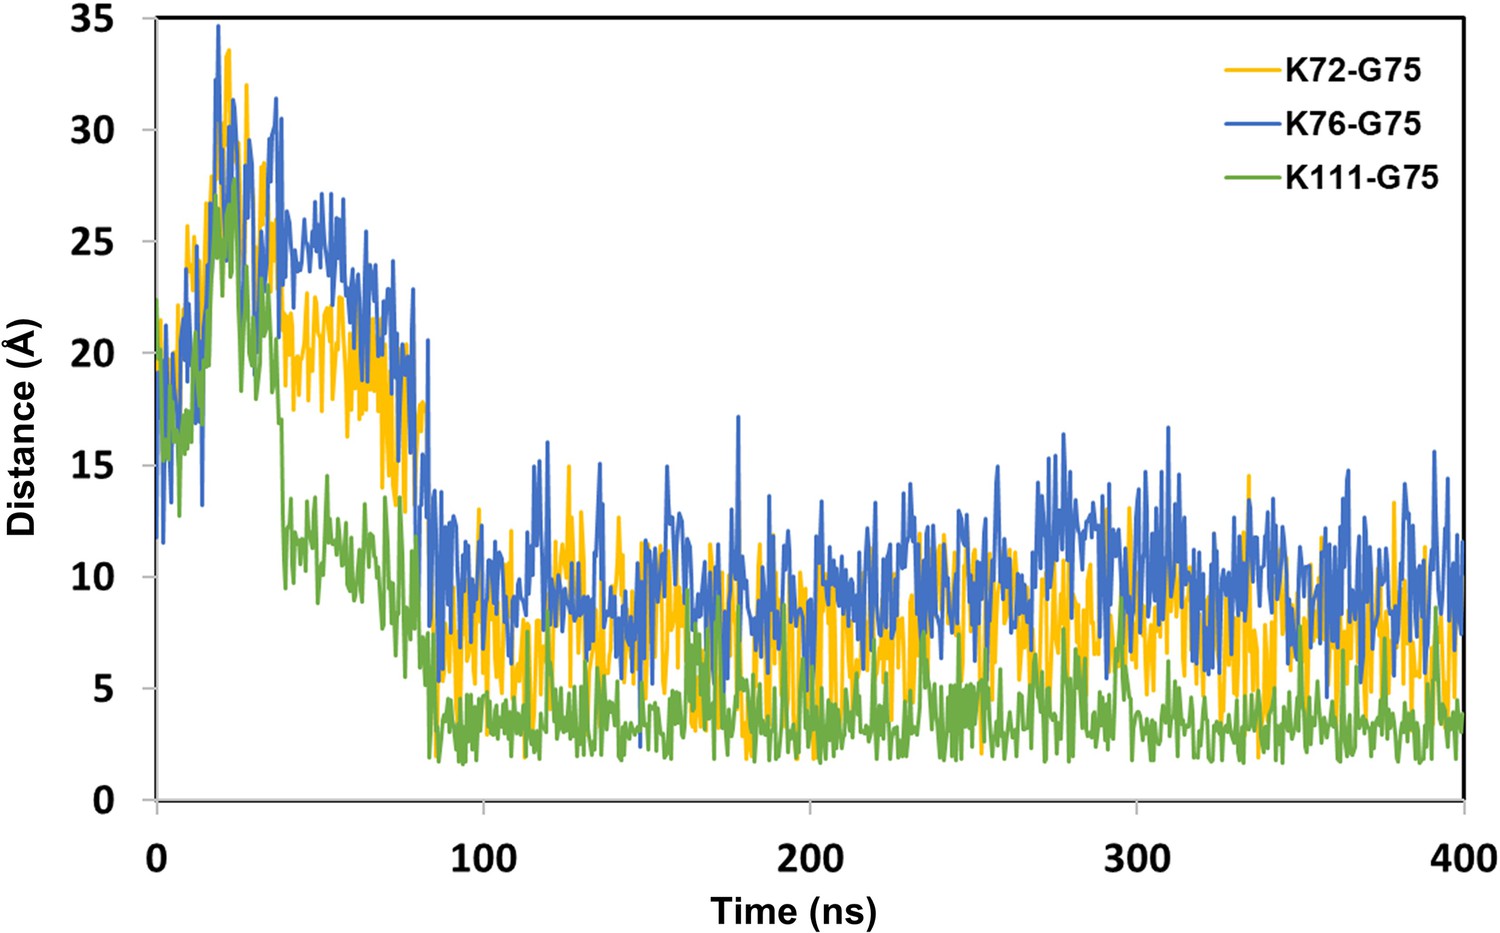
The distance between Lys (N atom) of BRD4BD1 and Gly (C atom) of Ub from dBET1_#35 degredation complex.
Figure 4—figure supplement 2
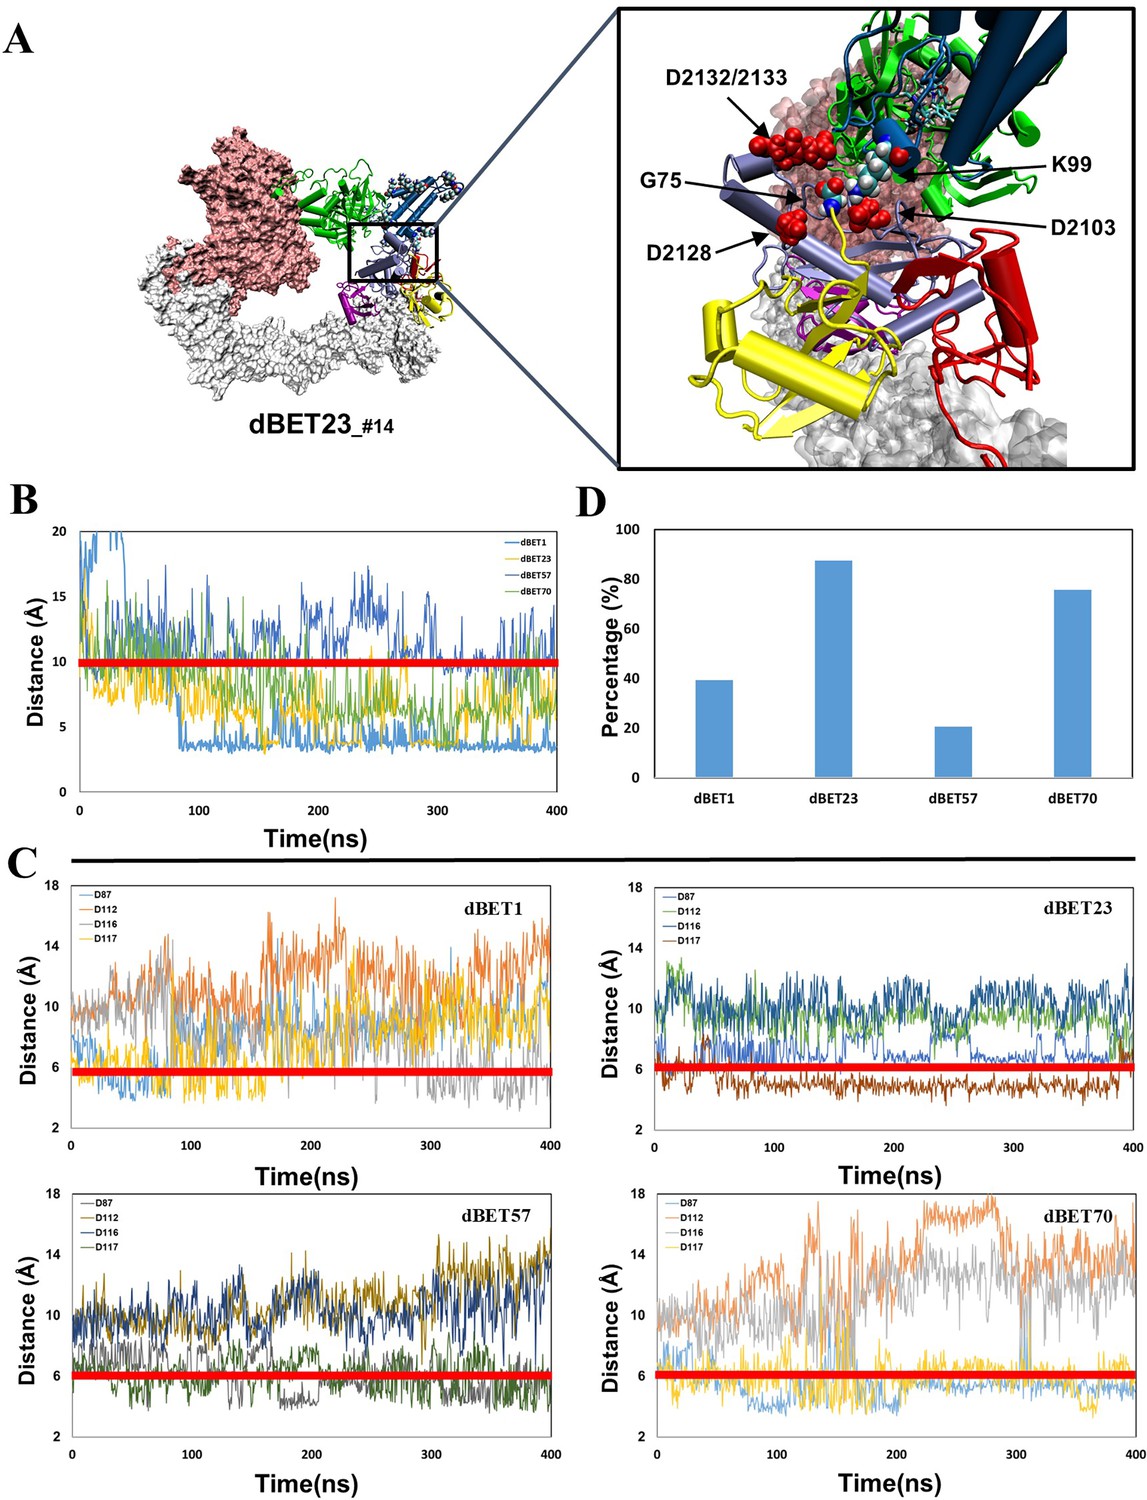
Quantifying the probability of isoppetide bond formation using two criteria: (1) Lys (N atom) Gly (C atom) distance and (2) Asp (O atom) and Gly (O atom) distance.
(A) Visualizing four Asp of E2 in close proximity of G75 of Ub. Asp is colored in red with vdW representation. (B) The Lys (N atom) and Gly (C atom) distance of each dBETs. (C) All four Asp (O atom) and Gly (O atom) distance of each dBETs. (D) Probability of satisfying both criteria for each dBETs. Red line indicates the cutoff distance for each criterion: 10 Å for Lys (N atom) Gly (C atom) distance; 6 Ã for Asp (O atom) and Gly (O atom) distance.
Figure 4—figure supplement 3
Lys (N atom) Gly (C atom) distance and 2 Asp (O atom) and Gly (O atom) distance for second seeds of MD simulation.
All four Asp (O atom) and Gly (O atom) distance of each dBETs.
Figure 5 with 5 supplements
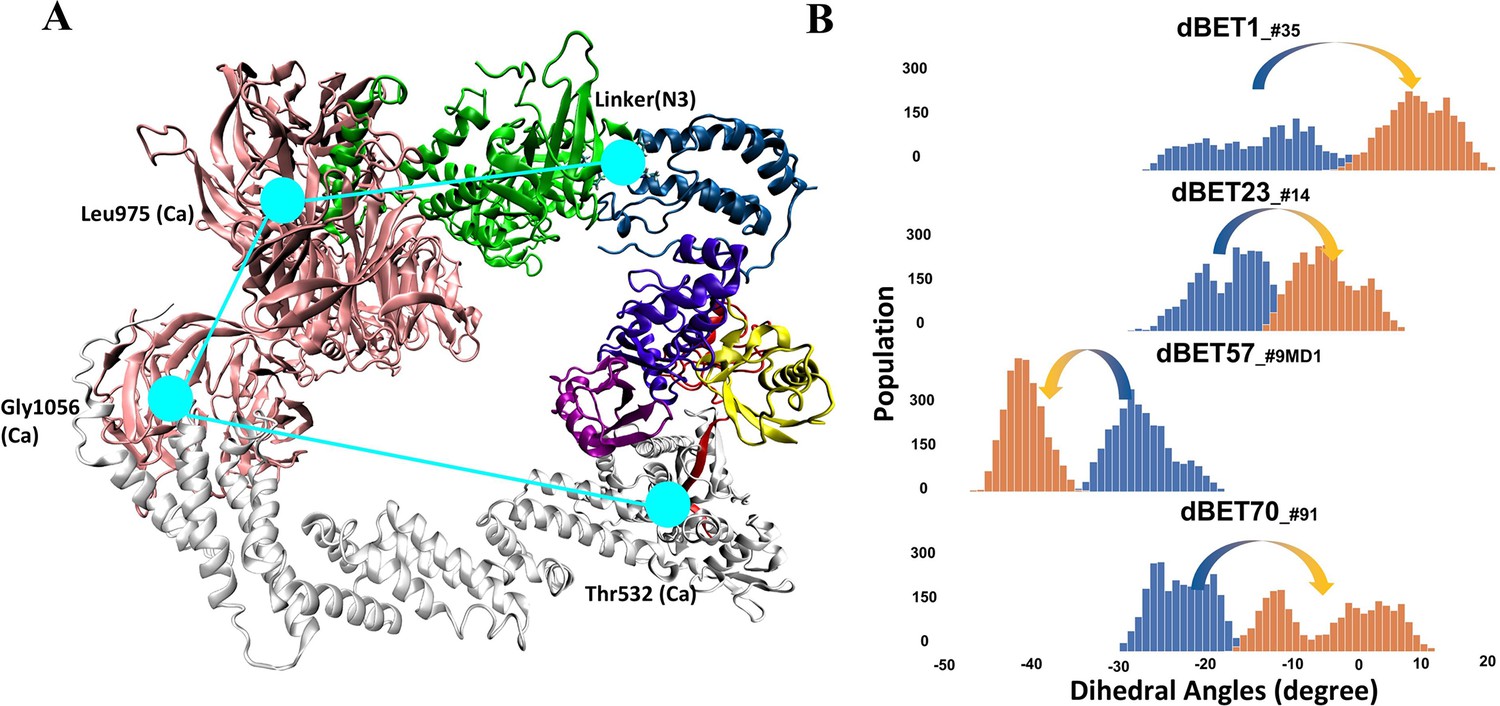
Quantifying the motion of degradation complex.
(A) Defining the pseudo dihedral angles, Linker(N3)-Leu975(Ca)-Gly1056(Ca)-Thr532(Ca) to capture the essential motion of the degradation complex. (B) Dihedral angle histogram shows the population distribution of the first 100 ns (blue) and last 100 ns (orange) of the MD simulation. The distribution shows a ~10-15o dihedral angle shift.
Figure 5—figure supplement 1
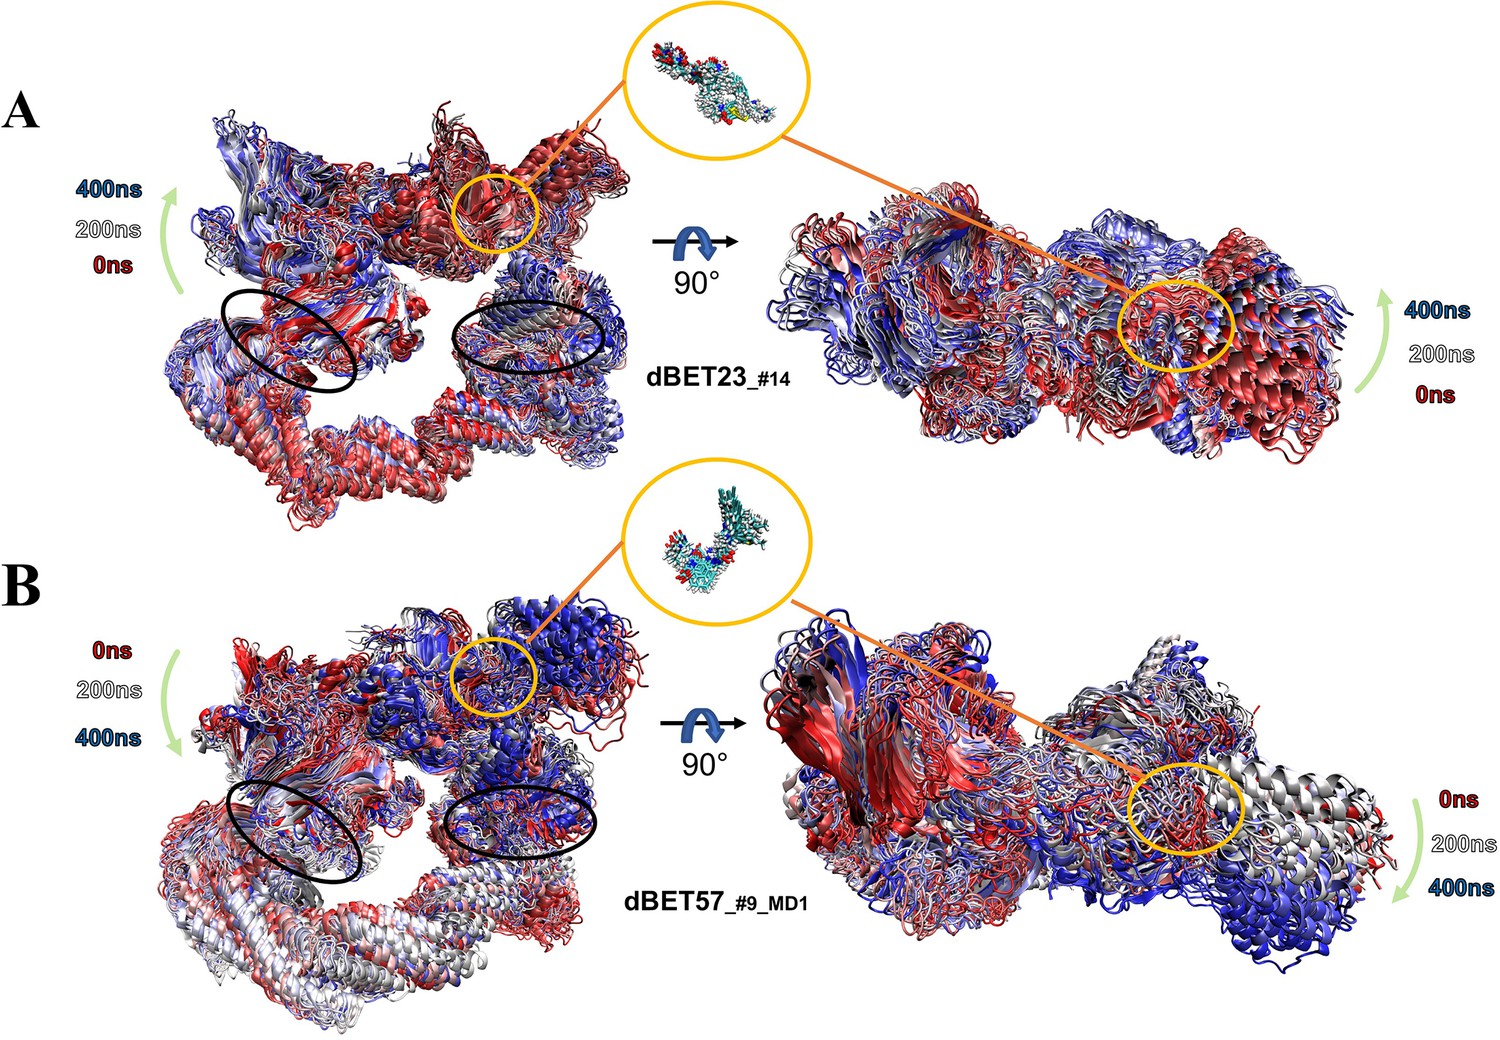
Dynamic nature of degradation complex.
Overlay of 25 frames from 400-ns MD simulation segment showing the overall dynamic nature of the degradation complex. The green arrows indicate the motion of the hinge region (left panel) and BRD4 (right panel). The whole 400-ns MD trajectories are superimposed based on the backbone of protein. The black circles indicate the two hinge regions: loops in Rbx1 and DDB1 proteins. (A) PROTAC dBET23_#14 degradation complex. (B) PROTAC dBET57_#9_MD1 degradation complex. Zoom-in representations show the PROTAC dynamics.
Figure 5—figure supplement 2
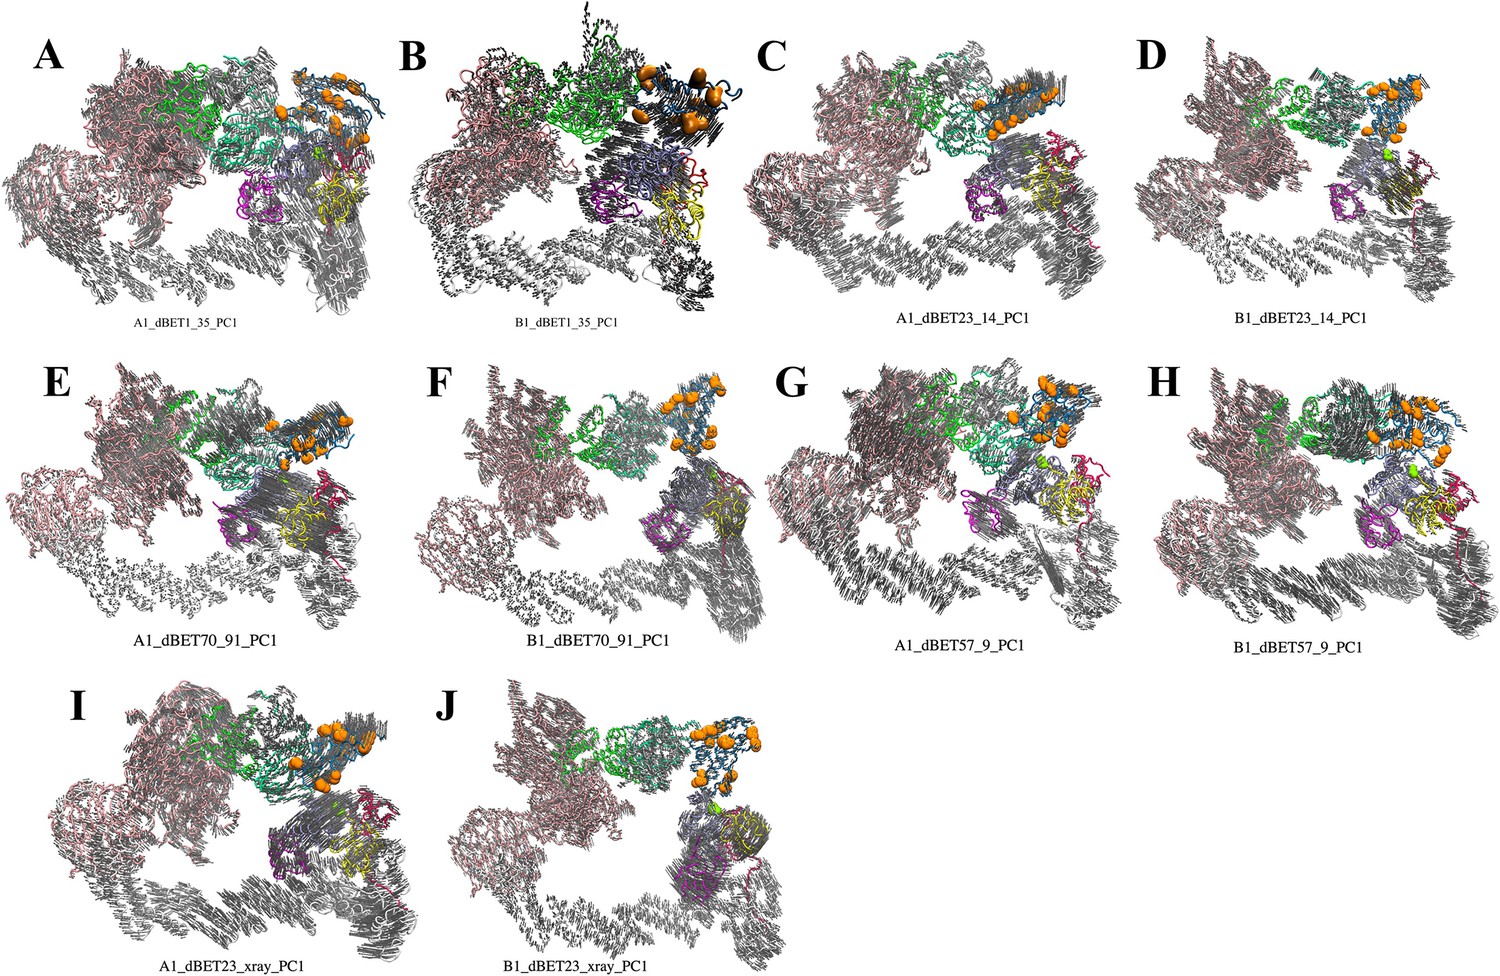
First PC mode of the predicted ternary complexes.
(A–E) cluster A1 degradation machinery complexes. (F–J) cluster B1 degradation machinery complexes. DDB1, pink; CUL4A, white; NEDD8, magenta; E2, ice blue; ubiquitin, yellow; Rbx1, red; HBD of CRBN E3, green; NTD of CRBN E3, mint; CTD of CRBN E3, dark gray; BRD4BD1, blue. Orange balls indicate Lys resides on BRD4BD1. Light gray arrows indicate the direction of protein movements in the PCA.
Figure 5—figure supplement 3
Correlation between PROTACs and hinge motion.
Tracing the shortest path that propagates through the non-bonded interaction network originated from the linker to the hinge region. (A) Linker to DDB1 (B) Linker to Rbx1. dBET23 (orange), dBET70 (gray), dBET57 (blue), hinge region (green circle).
Figure 5—figure supplement 4
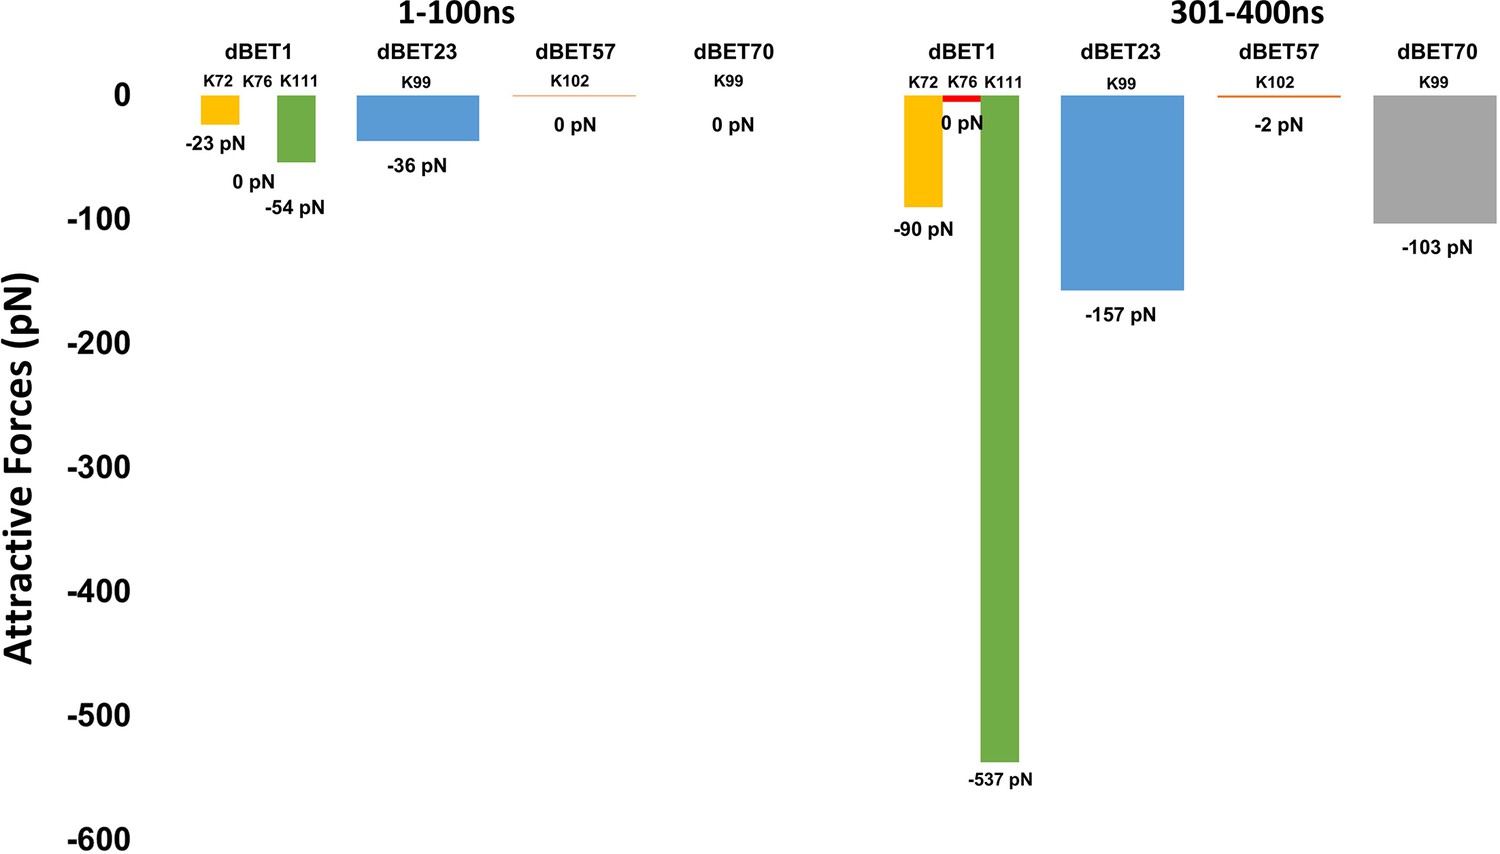
Attractive force between Lys of BRD4BD1 and Gly of Ub.
dBET1 uses Lys72/76/111; dBET23 and dBET70 use Lys99; dBET57 uses Lys102 for Lys-Gly interaction, respectively.
Figure 5—figure supplement 5
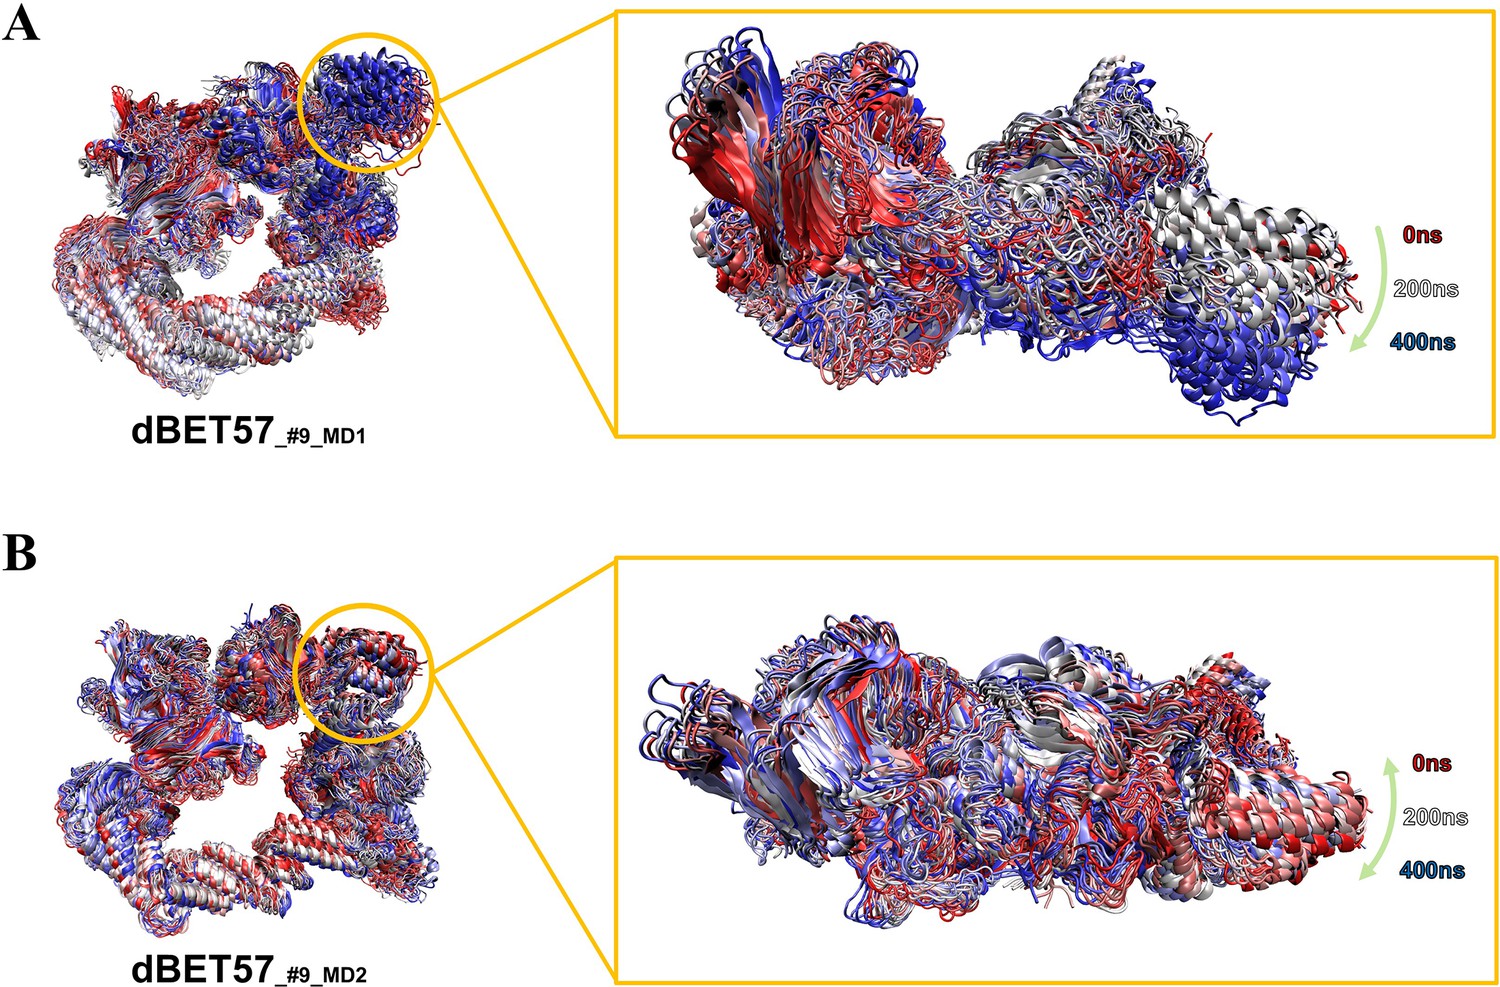
Comparing degradation machinery complexes’ dynamic of dBET57_#9_MD1 and dBET57_#9_MD2 with different BRD4BD1 initial conformations.
(A) BRD4BD1 of dBET57_#9_MD1 shows larger motion (10–15 degrees) which eventually leads to ubiquitination. (B) BRD4BD1 of dBET57_#9_MD1 shows very little motion (~0 degree) and did not recruit Lys for ubiquitination.
Figure 6
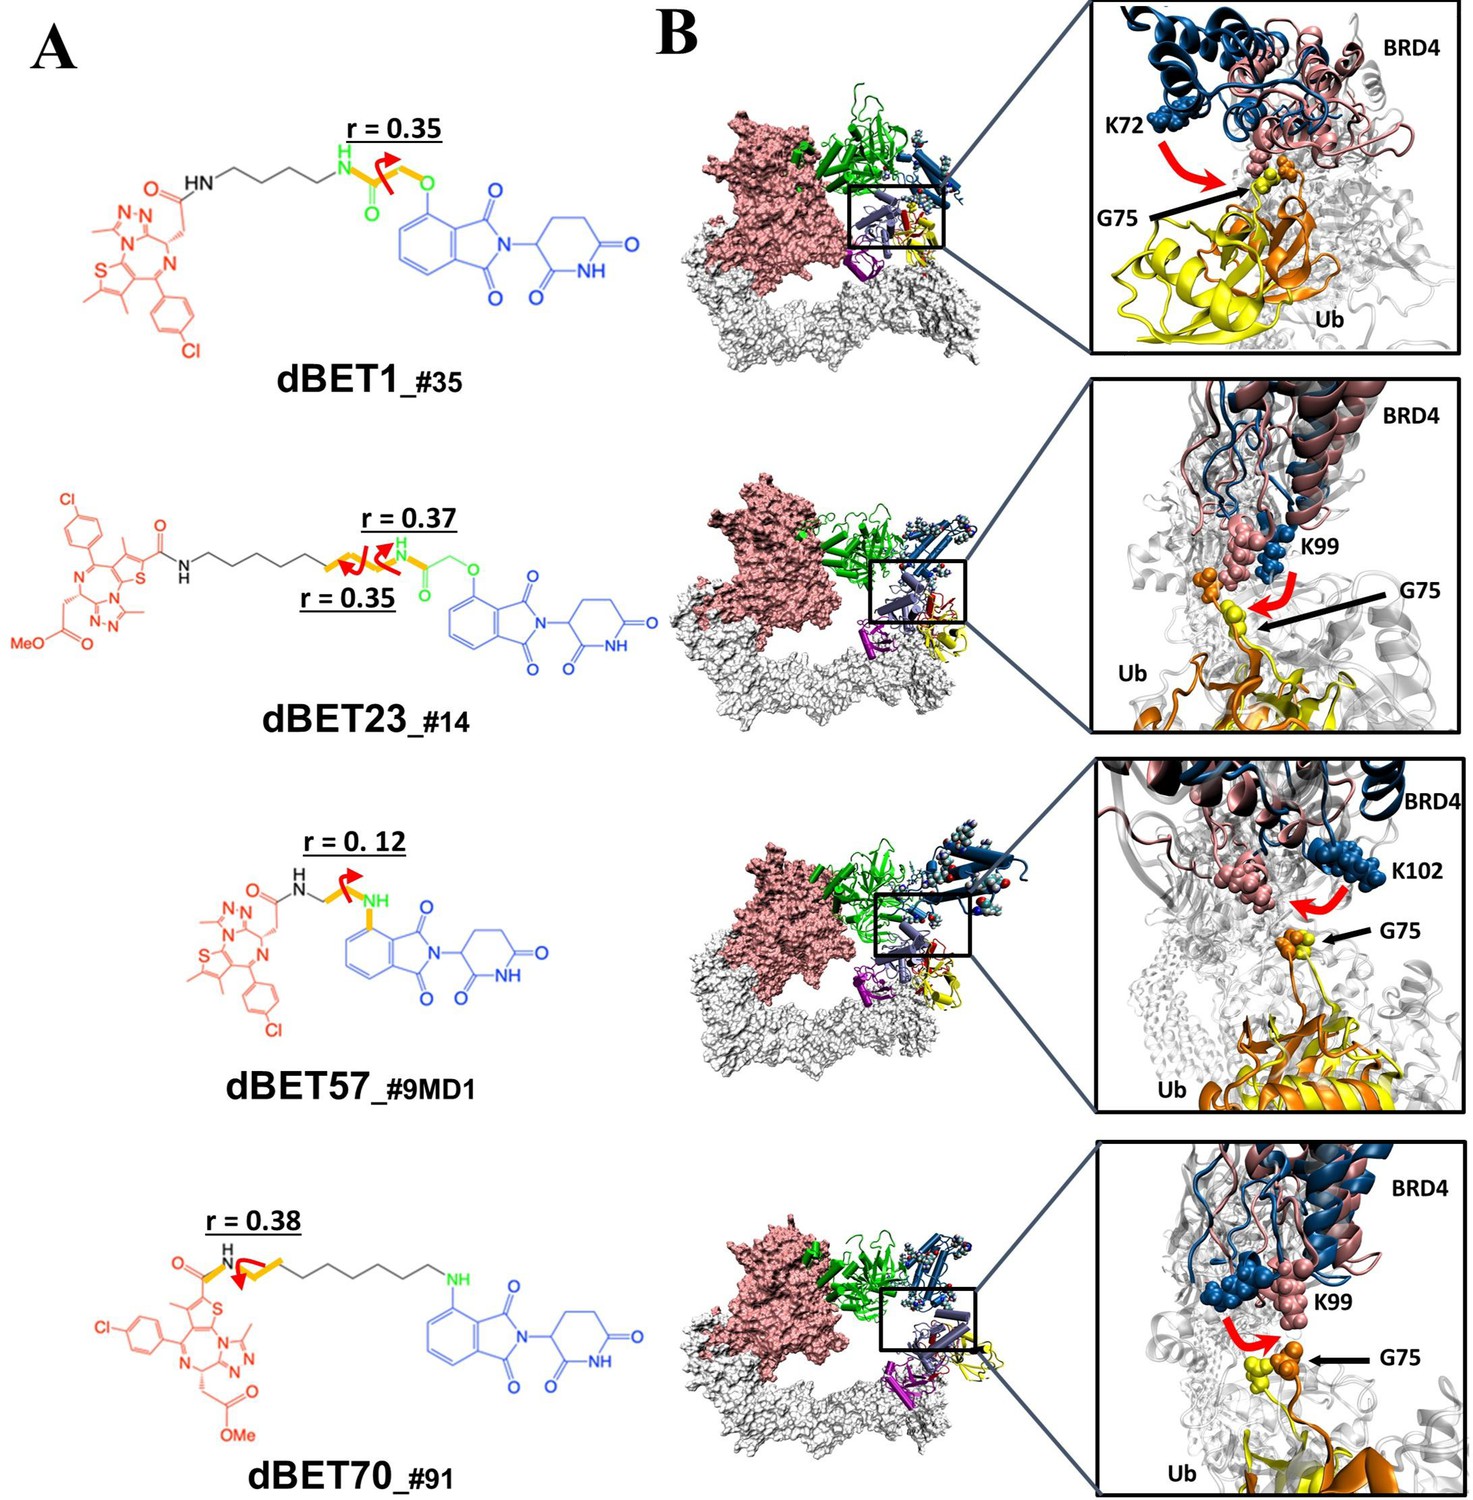
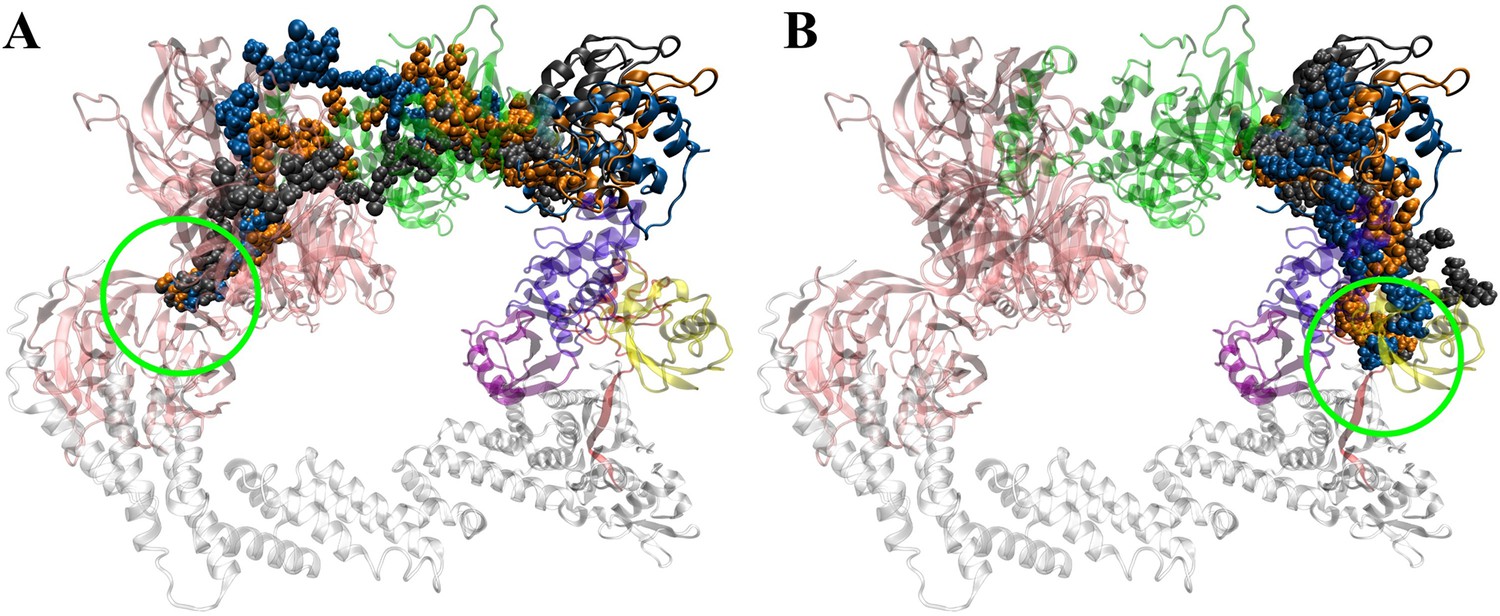
Quantification of the correlated motion between the linker and degradation complex.
(A) Dihedral angles correlated with the degradation complex. r is the dihedral correlation coefficient (See Methods for detailed calculation). (B) Motion of BRD4BD1 and Ub indicates a shift between the initial frames (BRD4BD1, blue; Ub, yellow) and final frames (BRD4BD1, pink; Ub, orange) of MD simulation. K72, K99 and K102 engaged in the interaction with G75 of Ub in each degradation complex, which implies their potential for degrading BRD4BD1. For visualization purposes we present only K72 of dBET1_#35, but K76 and K111 can also engage in interaction with G75 (See Figure 4).
Figure 7 with 1 supplement
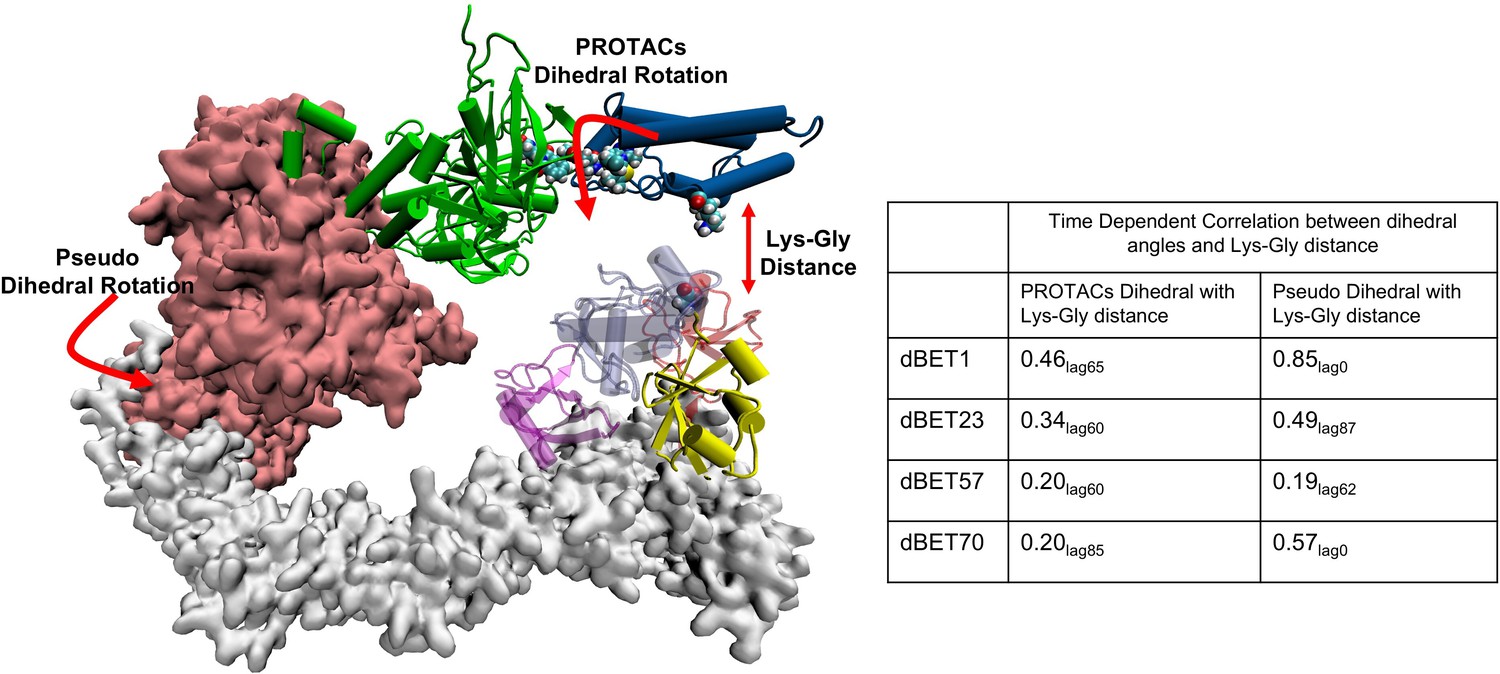
Time-dependent correlation between PROTACs/Pseudo dihedral angles and Lys-Gly interaction.
The peak values of time-dependent correlation were reported. For instance, 0.46lag65 represents the correlation coefficient at 65ns of the MD simulation.
Figure 7—figure supplement 1
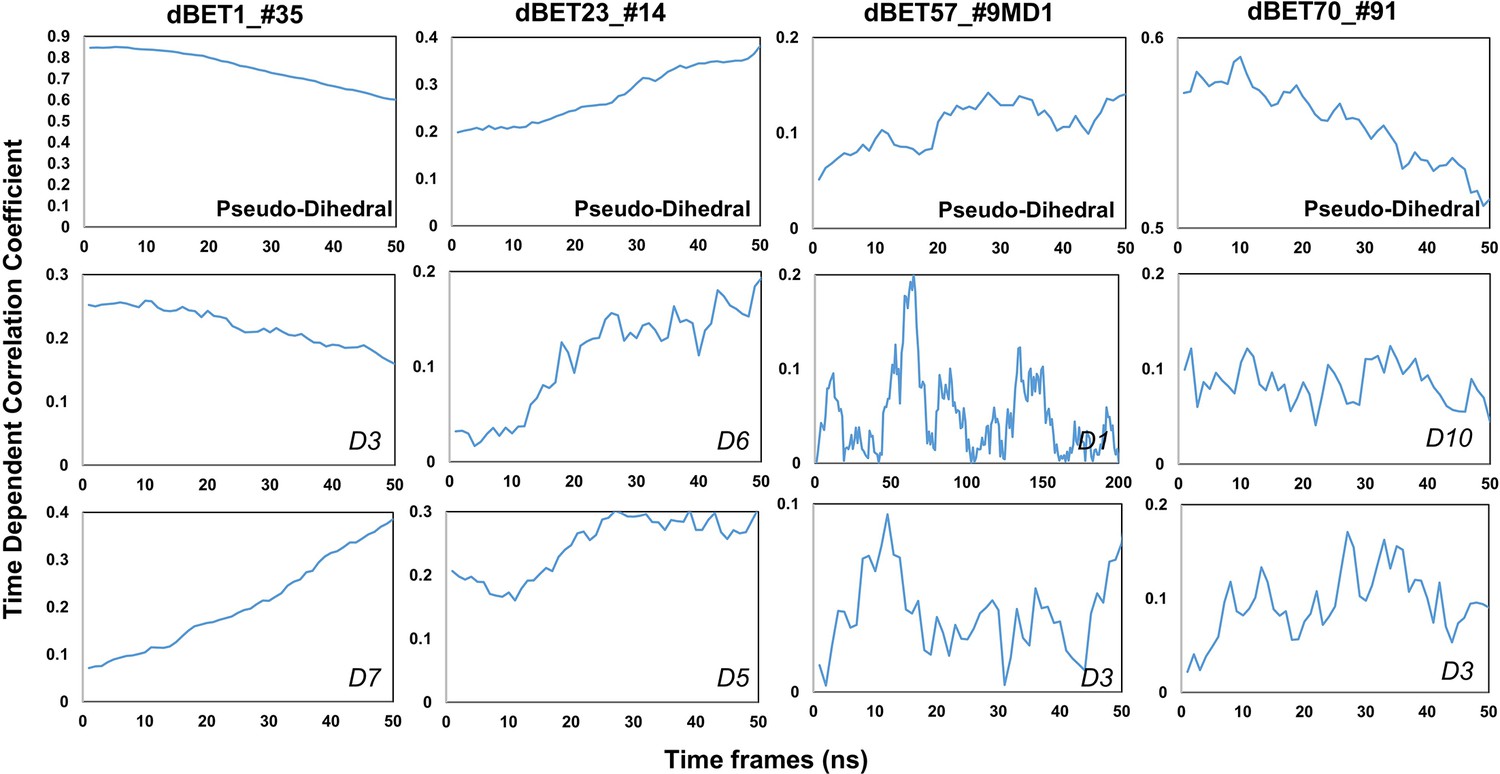
Time-dependent correlation of Psuedo dihedral angles and PROTACs dihedral angles.
(Please refer to Figure 8 for the dihedral index).
Figure 8
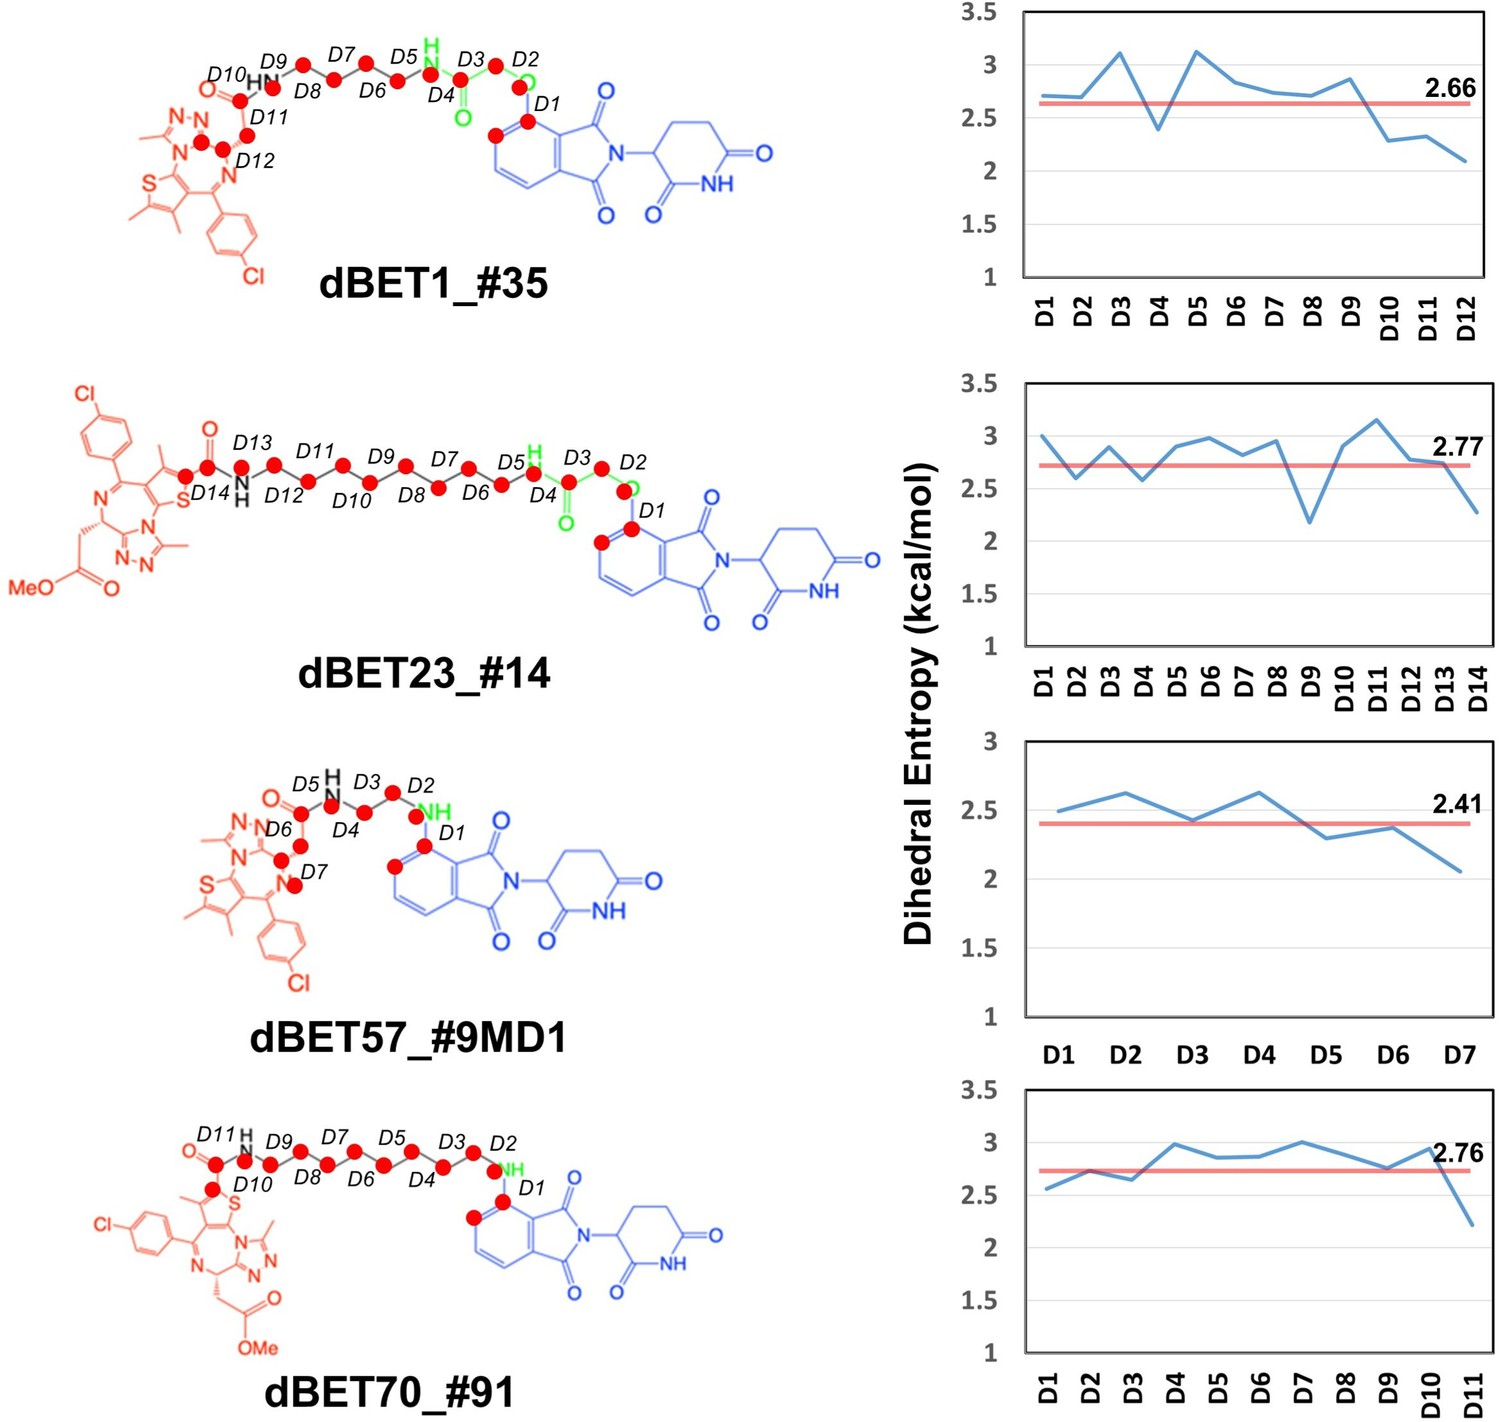
Dhedral entropies of each dihedra langles of the PROTACs using Gibbs entropy formula.
The probability distribution is the probability distribution of dihedra langles. Larger entropies means the molecules is more flexible and lower values indcates a more rigid molecules.
Tables
Table 1
List of molecular dynamics (MD) simulations for ternary complex CRBN-dBETx-BRD4BD1 and the degradation machinery complex.
A1 and B1 indicate that the complex was assembled using scaffold cluster A1 and B1, respectively. The subscript number after each dBET degrader indicates the conformation index number from the protein–protein docking results. B1_dBET1_md3 indicates that a ternary conformation obtained from a CRBN-dBET1_#35-BRD4BD1 MD run (Figure 3 color orange) was used to build the initial conformation.
| MD index | Run | MD index | Run | MD index | Run |
|---|---|---|---|---|---|
| CRBN-dBET1_#35-BRD4BD1 | 3 | A1_dBET1_#35 | 1 | B1_dBET1_md3 | 2 |
| CRBN-dBET23_#14-BRD4BD1 | 3 | A1_dBET23_#14 | 1 | B1_dBET23_#14 | 2 |
| CRBN-dBET57_#9-BRD4BD1 | 3 | A1_dBET57_#9 | 1 | B1_dBET57_#9_MD1 | 2 |
| B1_dBET57_#9_MD2 | 1 | ||||
| CRBN-dBET70_#91-BRD4BD1 | 3 | A1_dBET70_#91 | 1 | B1_dBET70_#91 | 2 |
| CRBN-dBET23_xray-BRD4BD1 | 3 | A1_dBET23_xray | 1 | B1_dBET23_xray | 1 |
Table 2
Number of ternary complexes used in the molecular docking and construction of degradation machinery complex.
| Cluster A | Cluster B | |||||||||
|---|---|---|---|---|---|---|---|---|---|---|
| PROTAC | Conformations from protein–protein docking | Number of conformations for construction of degradation machinery complex | ||||||||
| A1 | A2 | A3 | A4 | A5 | B1 | B2 | B3 | B4 | ||
| dBET1 | 186 | 81 | 51 | 17 | 22 | 38 | 68 | 106 | 0 | 0 |
| dBET23 | 168 | 42 | 52 | 87 | 0 | 23 | 104 | 86 | 0 | 0 |
| dBET57 | 24 | 19 | 12 | 0 | 5 | 7 | 17 | 17 | 0 | 0 |
| dBET70 | 183 | 37 | 73 | 73 | 0 | 10 | 96 | 83 | 0 | 0 |
Appendix 1—table 1
Summary of the predicted CRBN-dBETx-BRD4BD1 ensembles from protein-protein docking.
Total ternary conformations were recorded, and conformations with clashes were carefully examined and manually removed.
| PROTAC | DC50/5h (nM)6 | Degrader Conf. | Total ternary Conf. predicted | Selected reasonable ternary complexes | Reasonable ternary complexes (%) |
|---|---|---|---|---|---|
| dBET1 | ~500 | 125 | 297 | 186 | 62.3 |
| dBET23 | ~50 | 212 | 250 | 168 | 67.2 |
| dBET57 | ~500 | 25 | 40 | 24 | 60.0 |
| dBET70 | 5 | 143 | 217 | 183 | 84.4 |
Appendix 1—table 2
Binding scores predicted by MOE protein-protein docking for the CRBN-dBETx-BRD4BD1 ternary complexes.
| dBET1 Conf. index # | Etotal (kcal/mol) | dBET23 Conf. index # | Etotal (kcal/mol) | dBET57 Conf. index # | Etotal (kcal/mol) | dBET70 Conf. index # | Etotal (kcal/mol) |
|---|---|---|---|---|---|---|---|
| 35 | –7353.1 | 206 | –7272.9 | 22 | –7265.3 | 91 | –7330.9 |
| 10 | –7352.0 | 14 | –7221.1 | 24 | –7265.2 | 85 | –7326.2 |
| 27 | –7349.2 | 165 | –7193.7 | 26 | –7264.9 | 90 | –7323.8 |
| 30 | –7345.6 | 168 | –7183.9 | 9 | –7237.8 | 117 | –7319.3 |
| 101 | –7304.9 | 166 | –7177.8 | 23 | –7225.3 | 88 | –7314.0 |
| 110 | –7279.3 | 217 | –7141.8 | 1 | –7216.9 | 118 | –7308.2 |
| 36 | –7255.5 | 167 | –7141.4 | 7 | –7201.4 | 120 | –7303.2 |
| 106 | –7236.1 | 16 | –7045.1 | 4 | –7153.0 | 89 | –7297.7 |
| 114 | –7260.9 | 2 | –7145.9 | 119 | –7295.4 | ||
| 119 | –7142.3 | 3 | –7130.2 | 122 | –7288.8 | ||
| 6 | –7125.6 | 125 | –7256.5 | ||||
| 11 | –7065.6 | 123 | –7254.4 | ||||
| 98 | –7244.7 | ||||||
| 121 | –7237.9 | ||||||
| 87 | –7219.4 | ||||||
| 95 | –7214.7 | ||||||
| 96 | –7195.2 | ||||||
| 124 | –7104.8 | ||||||
| 126 | –7040.4 |
Appendix 1—table 3
Accessible lysine residues identified in the CRL4A E3 ligase scaffolds for each PROTAC in each cluster.
| PROTAC | A1 | A2 | A3 | A4 | A5 |
|---|---|---|---|---|---|
| dBET1 | 55, 57, 102, 112 | 55, 57, 12 | 112, 155 | 112 | 55, 57, 72, 91, 111, 112, 155, 160 |
| dBET23 | 55, 102, 141, 155, 160 | 55 ,99, 102, 112, 141,150, 160 | 72, 76, 111, 155 | N/A | 155, 160 |
| dBET57 | 55, 112 | 55, 112 | N/A | 111, 112 | 111, 112 |
| dBET70 | 55, 141, 160 | 55, 99, 102, 112, 141, 150, 160 | 76, 155, 160 | N/A | 155, 160 |
| PROTAC | B1 | B2 | B3 | B4 | |
| dBET1 | 55, 57, 72, 102, 111, 112 | 55, 57, 72, 102, 111, 112, 160 | N/A | N/A | |
| dBET23 | 55, 57, 99, 102, 112 | 55, 57, 99, 102, 112 | N/A | N/A | |
| dBET57 | 57, 55, 111, 112 | 55, 57, 72, 111, 112 | N/A | N/A | |
| dBET70 | 55, 57, 99, 102, 112 | 55, 57, 99, 102 | N/A | N/A |
Appendix 1—table 4
PCA analysis with the first two PCs projection coverage in each degradation machinery complex.
TThe essential motions in the first two PCs of ten degradation machinery complexes were calculated based on the backbone atoms. The coverage of the first two PCs were reported. Note, all, expect A1_dBET1_#35 and A1_dBET57_#9 have the first two PCs coverage is below 60%.
| A1 | B1 | |||||
|---|---|---|---|---|---|---|
| PROTAC | PC1 | PC2 | PC1+PC2 | PC1 | PC2 | PC1+PC2 |
| dBET1_#35 | 49.2% | 9.0% | 59.2% | 69.0% | 9.6% | 78.6% |
| dBET23_#14 | 47.3% | 13.4% | 60.7% | 64.8% | 7.2% | 72.0% |
| dBET57_#9 | 28.4% | 13.8% | 42.2% | 49.8% | 10.8% | 60.6% |
| dBET70_#91 | 66.2% | 8.6% | 74.8% | 51.1% | 12.3% | 63.4% |
| dBET23_xray | 50.7% | 11.9% | 62.6% | 50.7% | 15.4% | 66.1% |
Additional files
Download links
A two-part list of links to download the article, or parts of the article, in various formats.
Downloads (link to download the article as PDF)
Open citations (links to open the citations from this article in various online reference manager services)
Cite this article (links to download the citations from this article in formats compatible with various reference manager tools)
PROTAC-induced protein structural dynamics in targeted protein degradation
eLife 13:RP101127.
https://doi.org/10.7554/eLife.101127.3


