Efficacy and mechanism of action of cipargamin as an antibabesial drug candidate
- National Research Center for Protozoan Diseases, Obihiro University of Agriculture Veterinary Medicine, Japan
- Department of Veterinary Medicine, Agriculture College of Yanbian University, China
- College of Veterinary Medicine and Biomedical Sciences, Cavite State University, Philippines
- Department of Biochemistry and Molecular Biology, Faculty of Veterinary Medicine, Mansoura University, Egypt
- Central Laboratory, Institute of Tropical Medicine (NEKKEN), Nagasaki University, Japan
- School of Basic Medicine, Hubei University of Arts and Science, China
- Research Center for Asian Infectious Diseases, The University of Tokyo, Japan
Figures
Figure 1 with 1 supplement
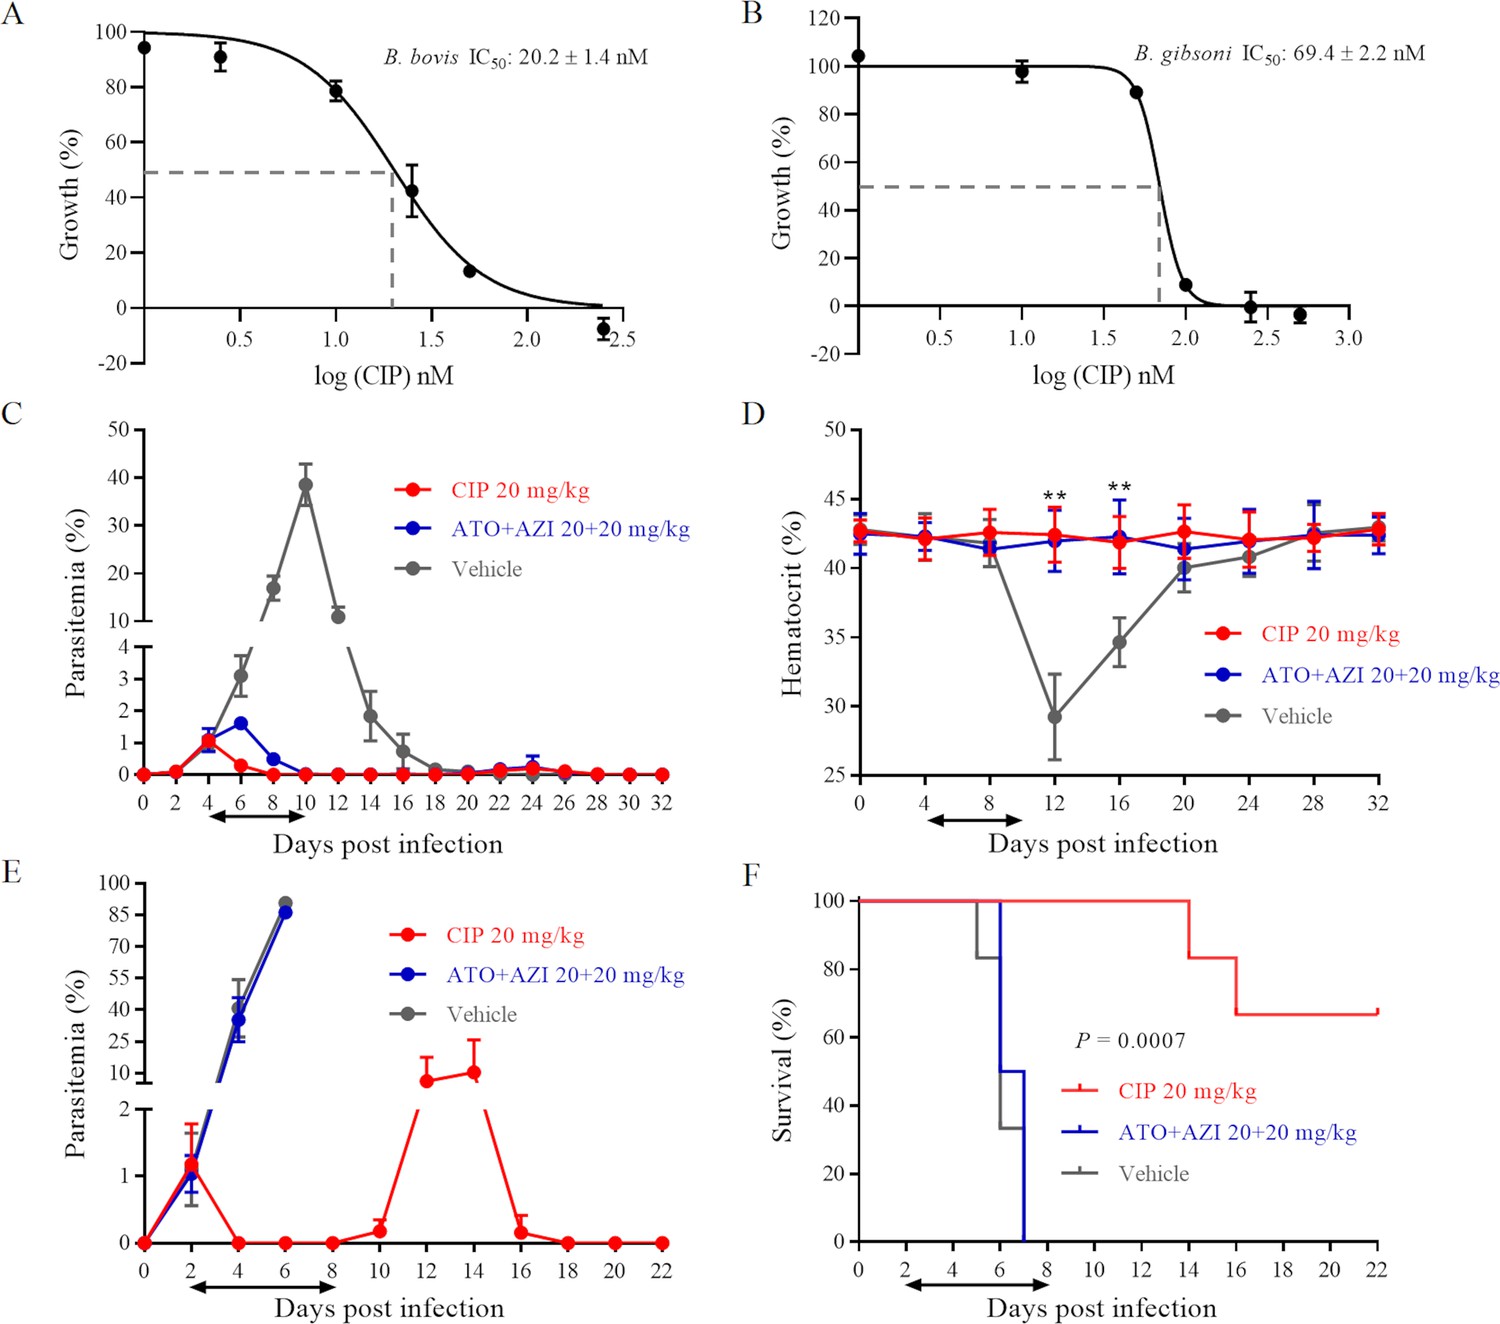
Cipargamin (CIP) demonstrates potent inhibition on Babesia spp.
(A, B) Dose-dependent growth curve of CIP on B. bovis and B. gibsoni in vitro. IC50: the half maximal inhibitory concentration. (C) Inhibitory effects of CIP and atovaquone (ATO) plus azithromycin (AZI) on the proliferation of B. microti in BALB/c mice. (D) Hematocrit (HCT) values in mice treated with CIP or ATO plus AZI compared with vehicle-treated mice. (E) Inhibitory effects of CIP and ATO plus AZI on the proliferation of B. rodhaini in BALB/c mice. (F) Survival rates of CIP-treated, ATO plus AZI-treated, and vehicle-treated mice. The treatment time is shown by two-way arrows, and significant differences (p < 0.01) between the drug-treated groups (n = 6) and the vehicle-treated control group (n = 6) are indicated by asterisks. The data from one of three individual experiments are expressed as means ± SD. **p ˂ 0.01.
Figure 1—figure supplement 1
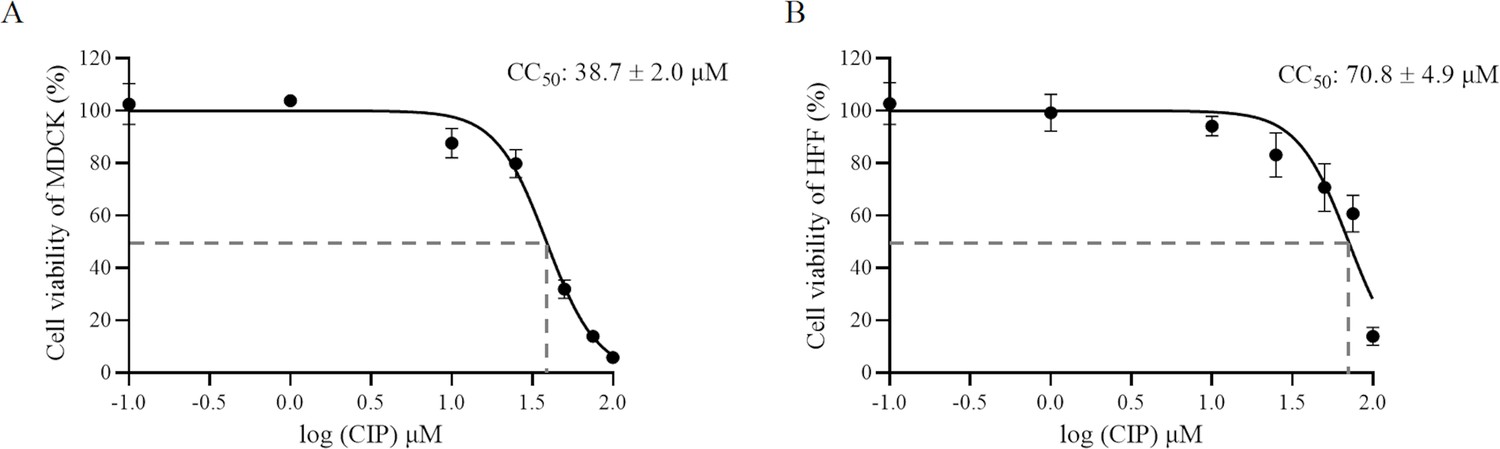
Cytotoxicity assay of CIP on (A) Madin-Darby canine kidney (MDCK) cells and (B) human foreskin fibroblast (HFF).
The MTP-500 microplate reader was utilized to detect the absorbance at 450 nm. Each value represents the mean ± SD of three independent experiments carried out in triplicate. CC50: the 50% cytotoxic concentration.
Figure 2 with 1 supplement
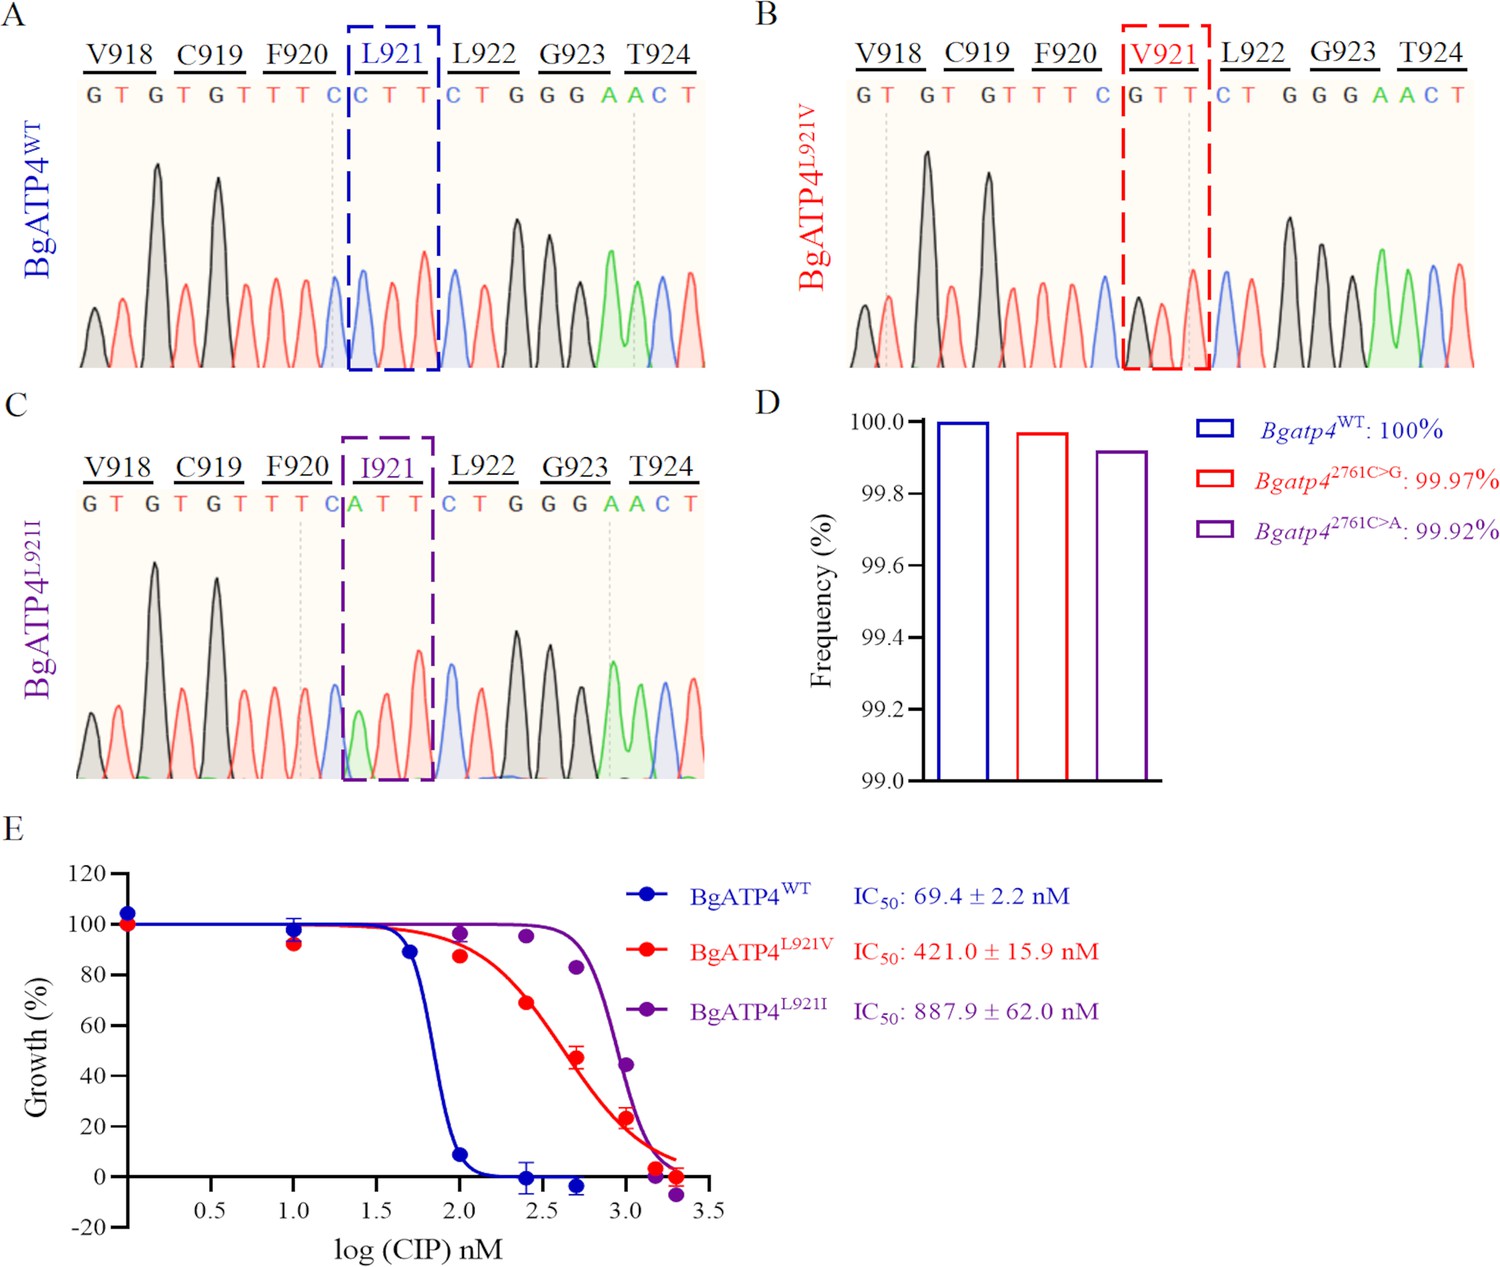
Mutations in BgATP4 mediate cipargamin (CIP) resistance.
(A–C) Representative sequencing chromatogram of wild-type and resistant parasites from CIP-treated B. gibsoni. The resistant parasite genomic DNA is extracted from blood samples after a 60-day treatment. The BgATP4 gene was amplified and sequenced using the DNA. (D) Genes of high-frequency sequence variants detected by next-generation sequencing (NGS). (E) Dose-dependent growth curve of BgATP4WT, BgATP4L921V, and BgATP4L921I in vitro. The data from one of three individual experiments are expressed as means ± SD.
Figure 2—figure supplement 1
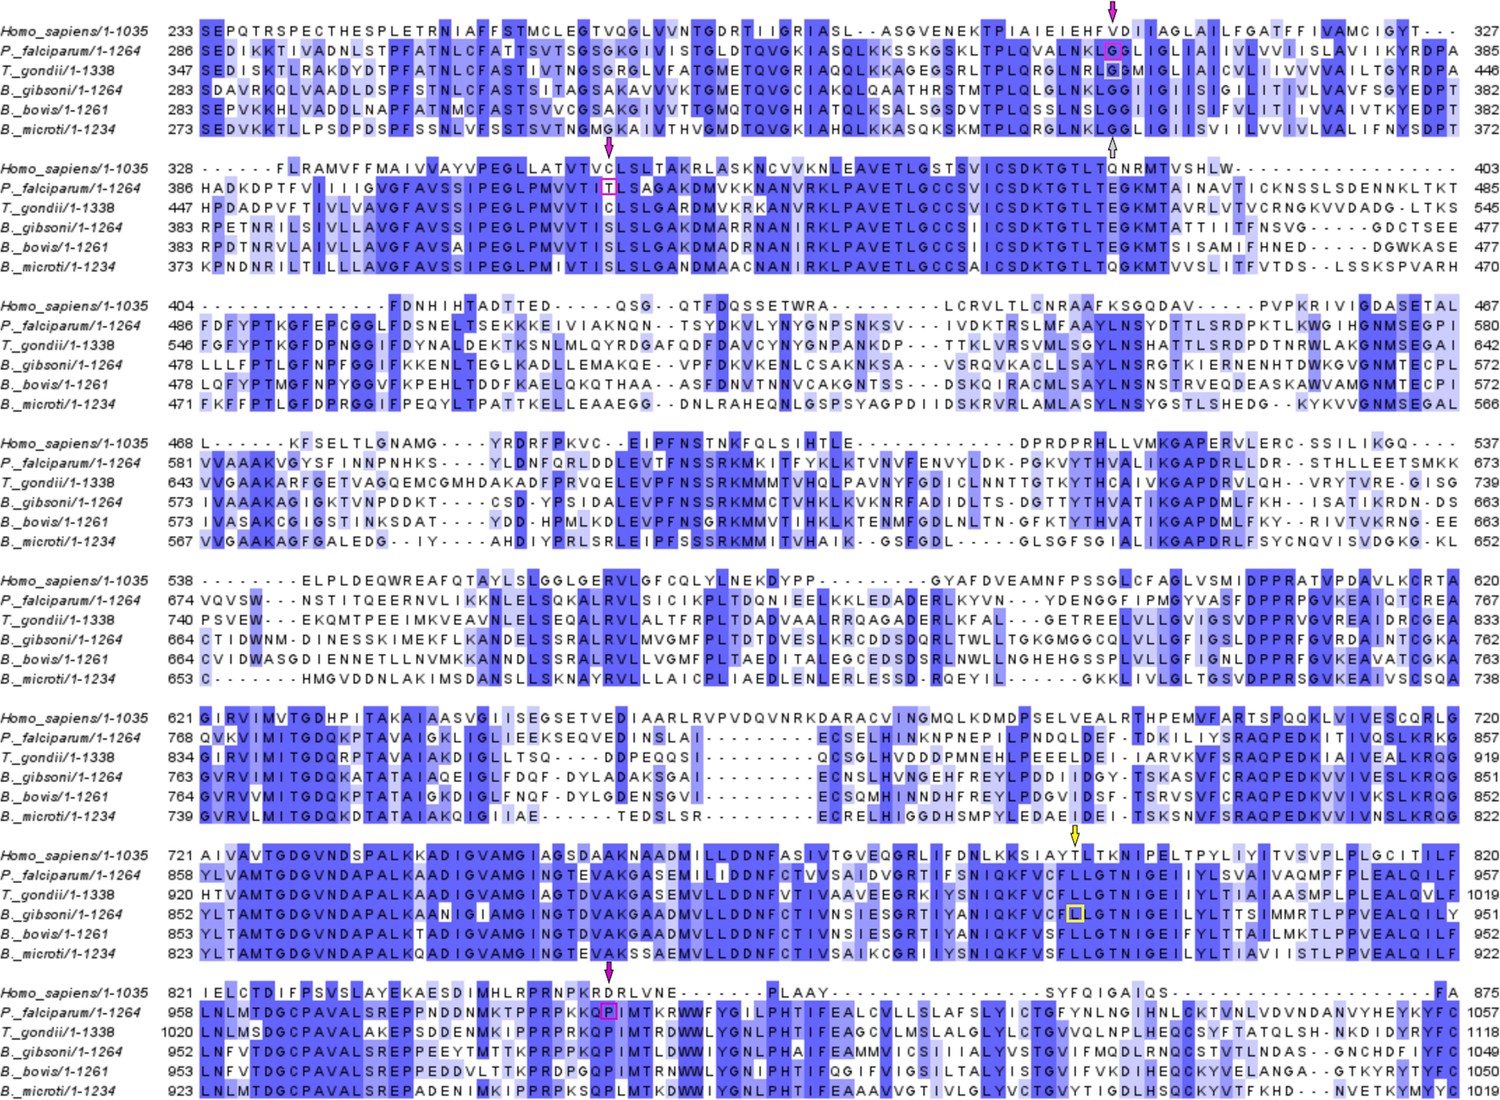
Multiple sequence alignment of ATP4 in different species.
A yellow square and arrow denote the BgATP4 mutation site discovered in this investigation; purple squares and arrows represent sites linked to P. falciparum cipargamin (CIP) resistance, and a gray square and arrow represent sites associated with T. gondii.
Figure 3 with 1 supplement
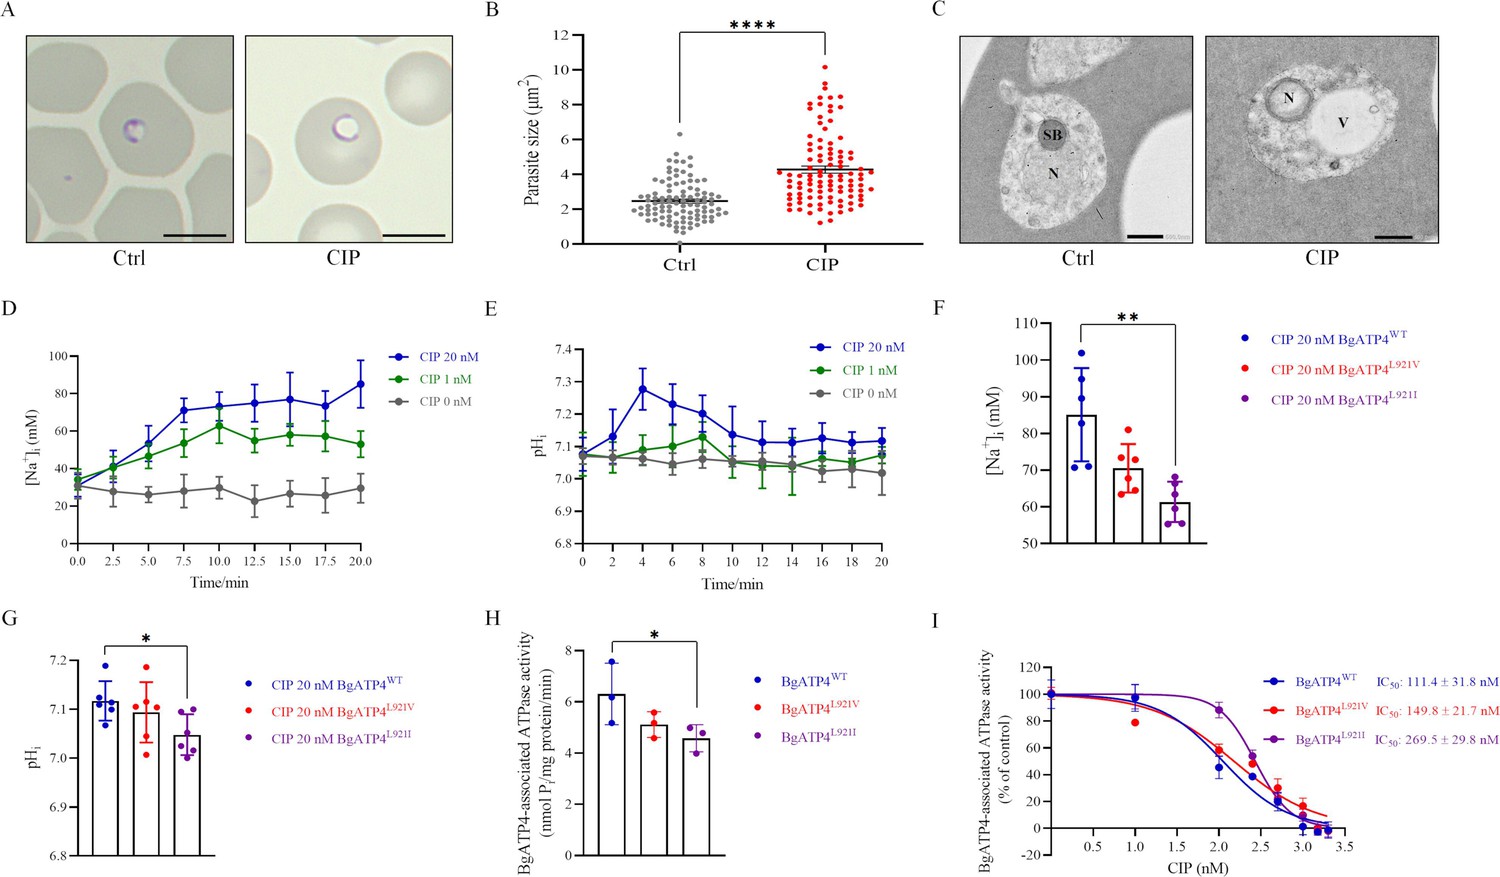
Mechanistic basis for resistance to cipargamin (CIP) conferred by the L921V and L921I mutations in BgATP4.
(A) Untreated and CIP-treated parasite morphology after incubation for 72 hr. Scale bar: 5 µm. (B) Sizes of 100 parasites in two groups measured with ImageJ software in panel A. Statistically significant differences between the means of variables determined by t-test. ****p ˂ 0.0001. (C) Transmission electron microscopy (TEM) of untreated and CIP-treated parasite. N, nucleus; SB, spherical body; V, vacuole. Scale bar: 500 nm. (D) [Na+]i concentrations after the addition of CIP in the BgATP4WT line. Representative traces from the experiment that highlight the impact of adding 20 nM CIP (blue), 1 nM CIP (green), or 0 nM CIP (grey) on the concentration [Na+]i of the BgATP4WT line. (E) Alkalinization of pHi in BgATP4WT line upon addition of the ATP4 inhibitor. (F) Addition of 20 nM CIP to the wild-type and resistant parasite lines results in different [Na+]i concentrations. (G) Addition of 20 nM CIP to the wild-type and resistant parasite lines results in different pHi concentrations. (H) Data acquired in the low Na+ condition (containing only the 2 mM Na+ introduced upon the addition of 1 mM Na2ATP) was subtracted from data obtained in the high Na+ condition to determine the ATPase activity related to the BgATP4 proteins. (I) Dose-dependent BgATP4-associated ATPase activity curve of BgATP4WT, BgATP4L921V, and BgATP4L921I in vitro. ATPase activity was determined at pH 7.2 in the presence of 150 mM Na+ and 1 mM Na2ATP. Each value represents the mean ± SD derived from a minimum of three biological replicates. *p ˂ 0.05; **p ˂ 0.01.
Figure 3—figure supplement 1
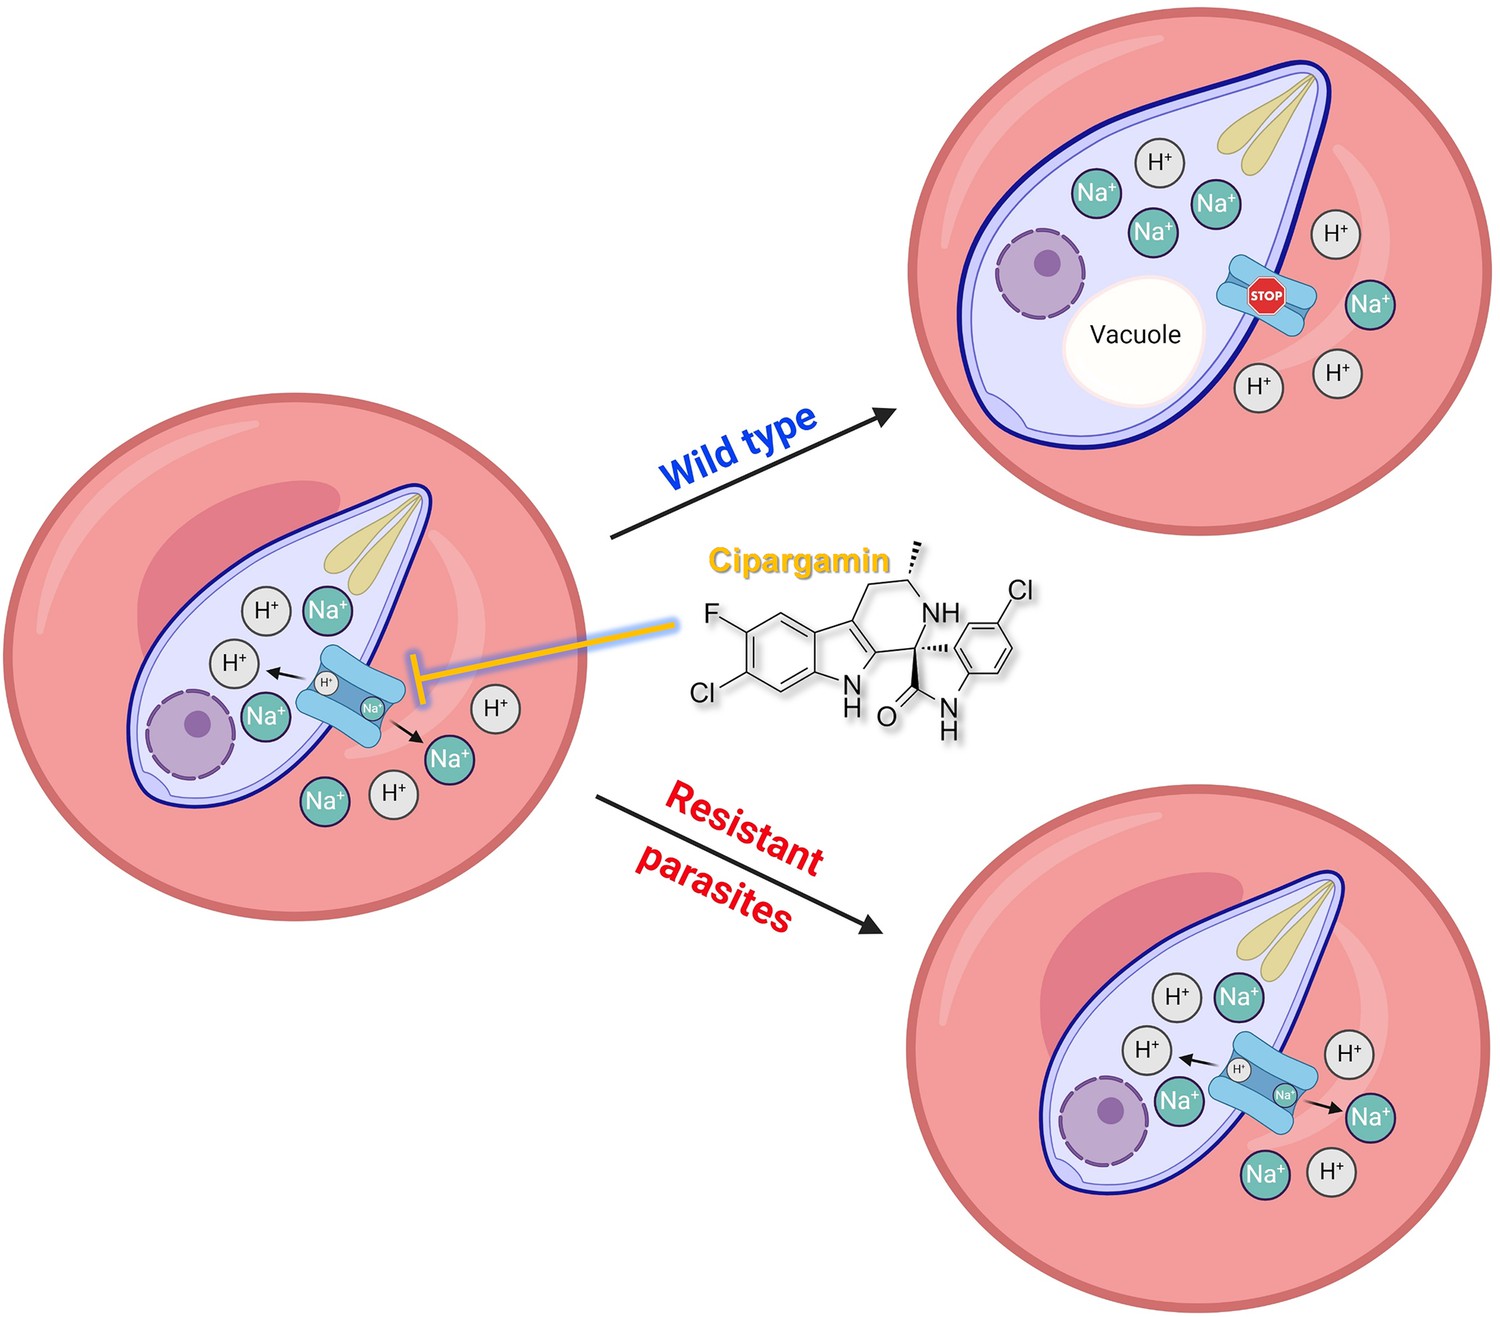
Proposed mechanism of inhibition of cipargamin (CIP) on wild-type and mutant parasite-infected erythrocytes.
CIP disrupts the BgATP4 function of wild-type parasites, which causes a net influx of Na+ and efflux of H+ from the parasite. The osmotic load imposed on the influx of Na+ further brings about parasite swelling and internal alkalinization, which are the main factors in Babesia death. Mutations in ATP4 minimize the susceptibility to ATP4 inhibitors by recovering H+ and Na+ balance, as indicated by the dotted arrows.
Figure 4 with 1 supplement
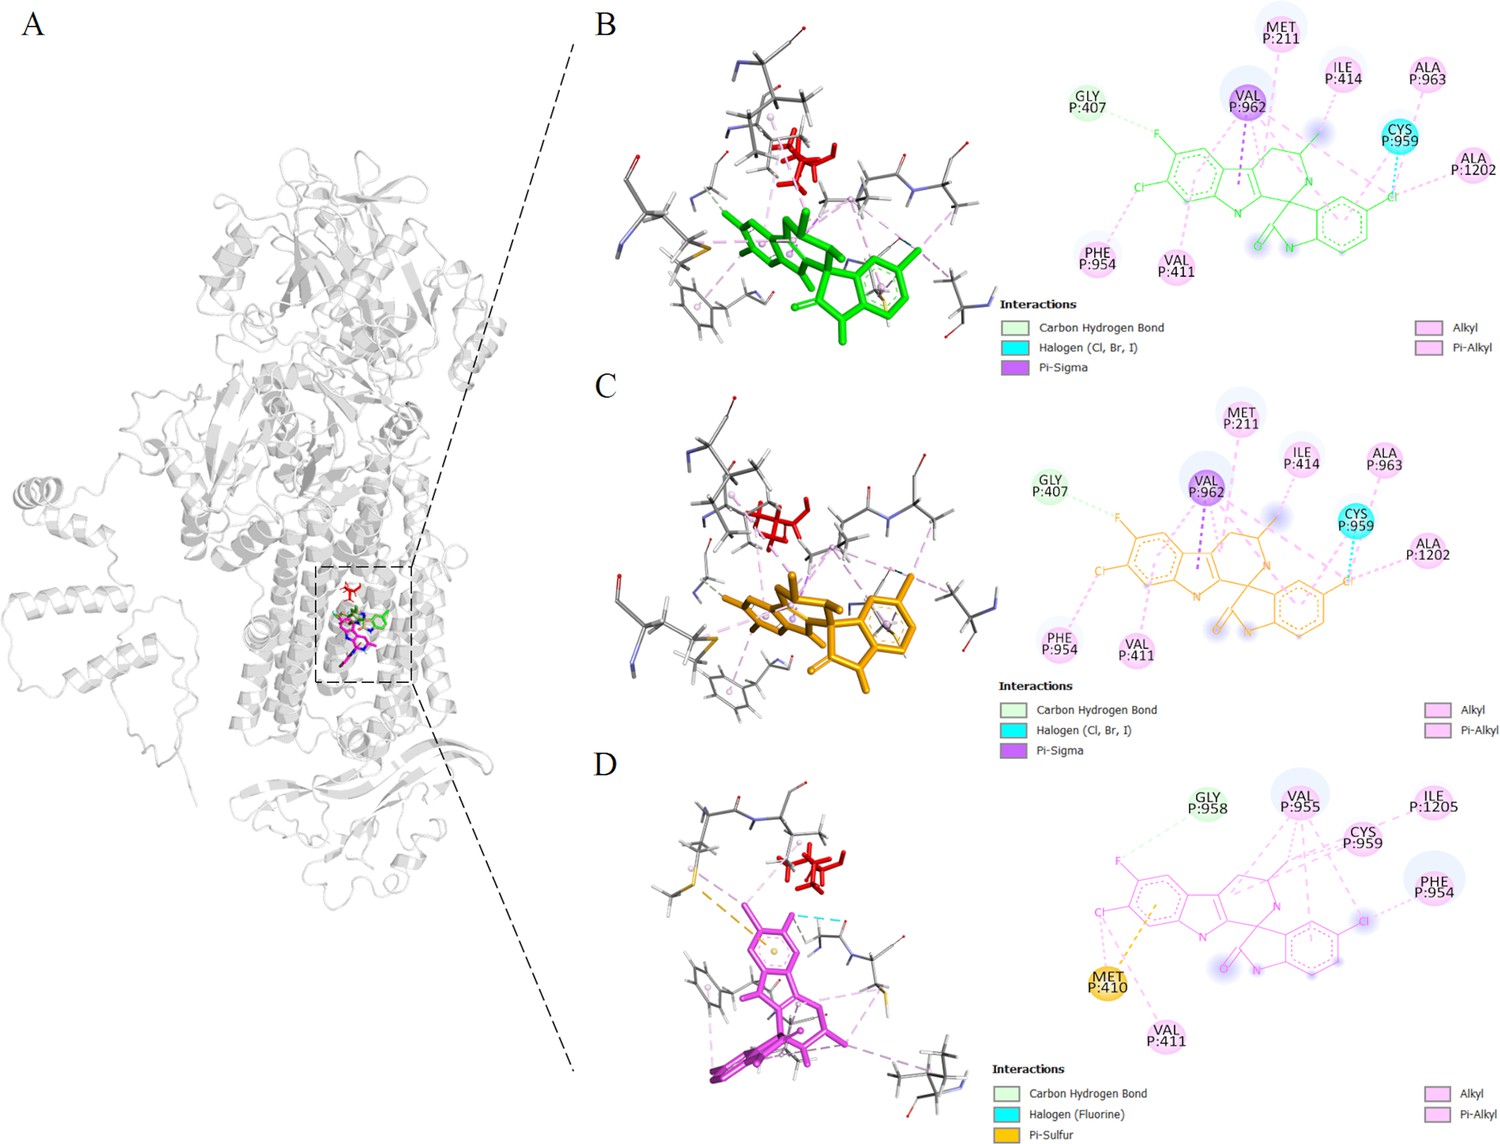
Binding sites proximal to BgATP4 residue 921 predicted by molecular docking.
(A) The lowest energy poses for cipargamin (CIP) were located in reference to the whole protein structure, docking against the WT (green), L921V (yellow), and L921I (pink) mutant BgATP4. The side chain of L921 is also shown in a red stick at its position. (B–D) The zoomed views of the binding locations of CIP.
Figure 4—figure supplement 1
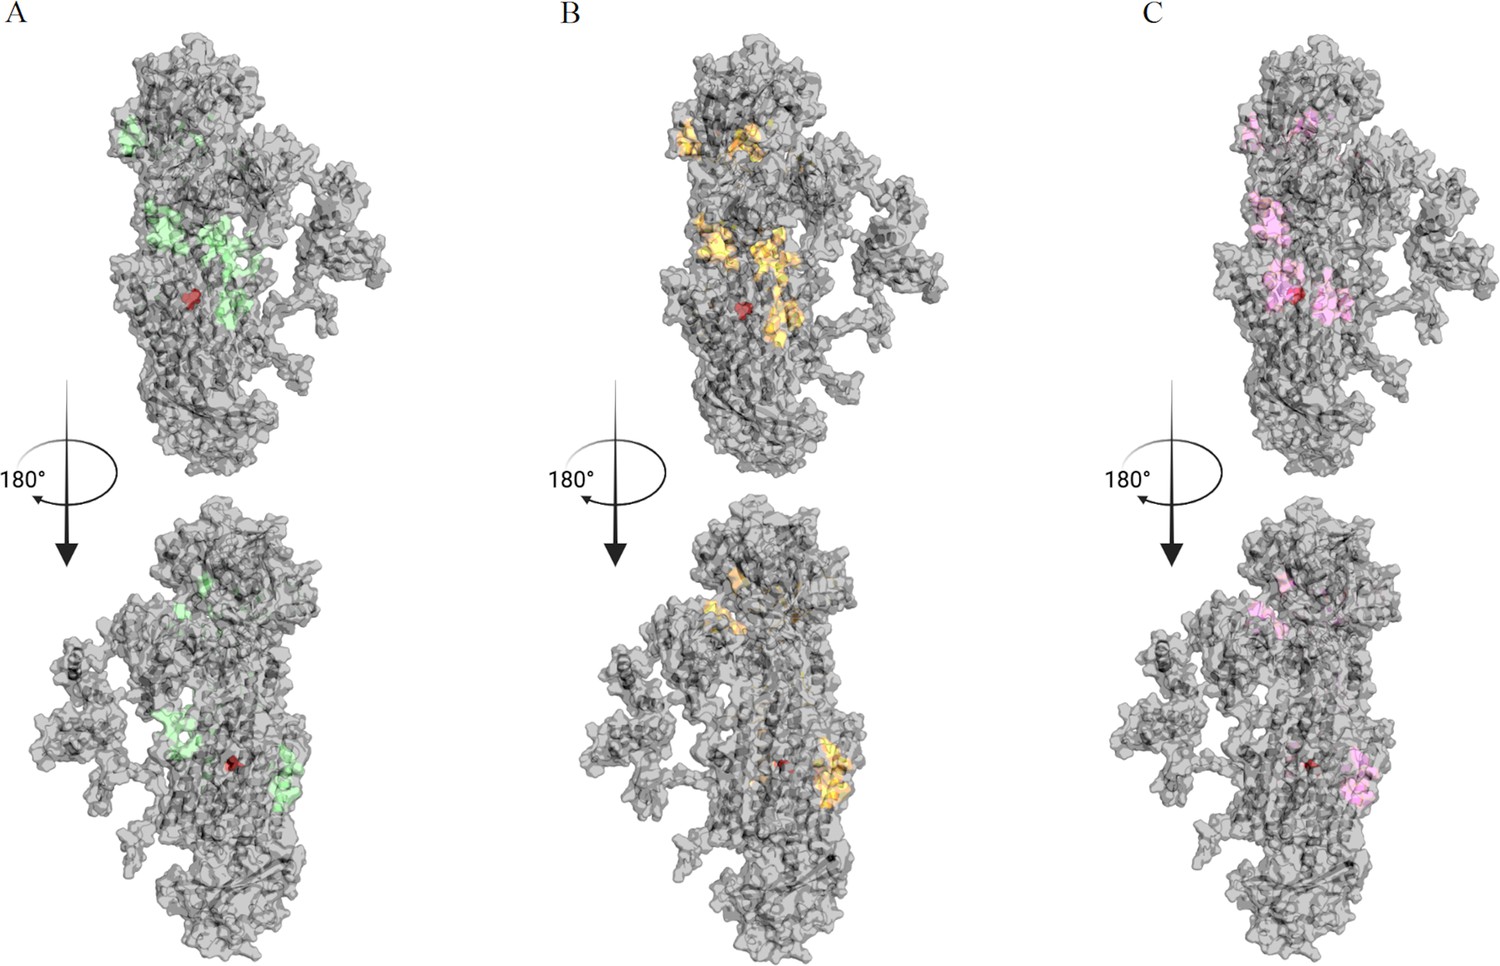
Binding sites for cipargamin (CIP) found by Gnina search across the entire surface of the protein.
(A–C) The binding space of WT, L921V, and L921I mutants in BgATP4 are labeled in green, yellow, and pink, respectively.
Figure 5
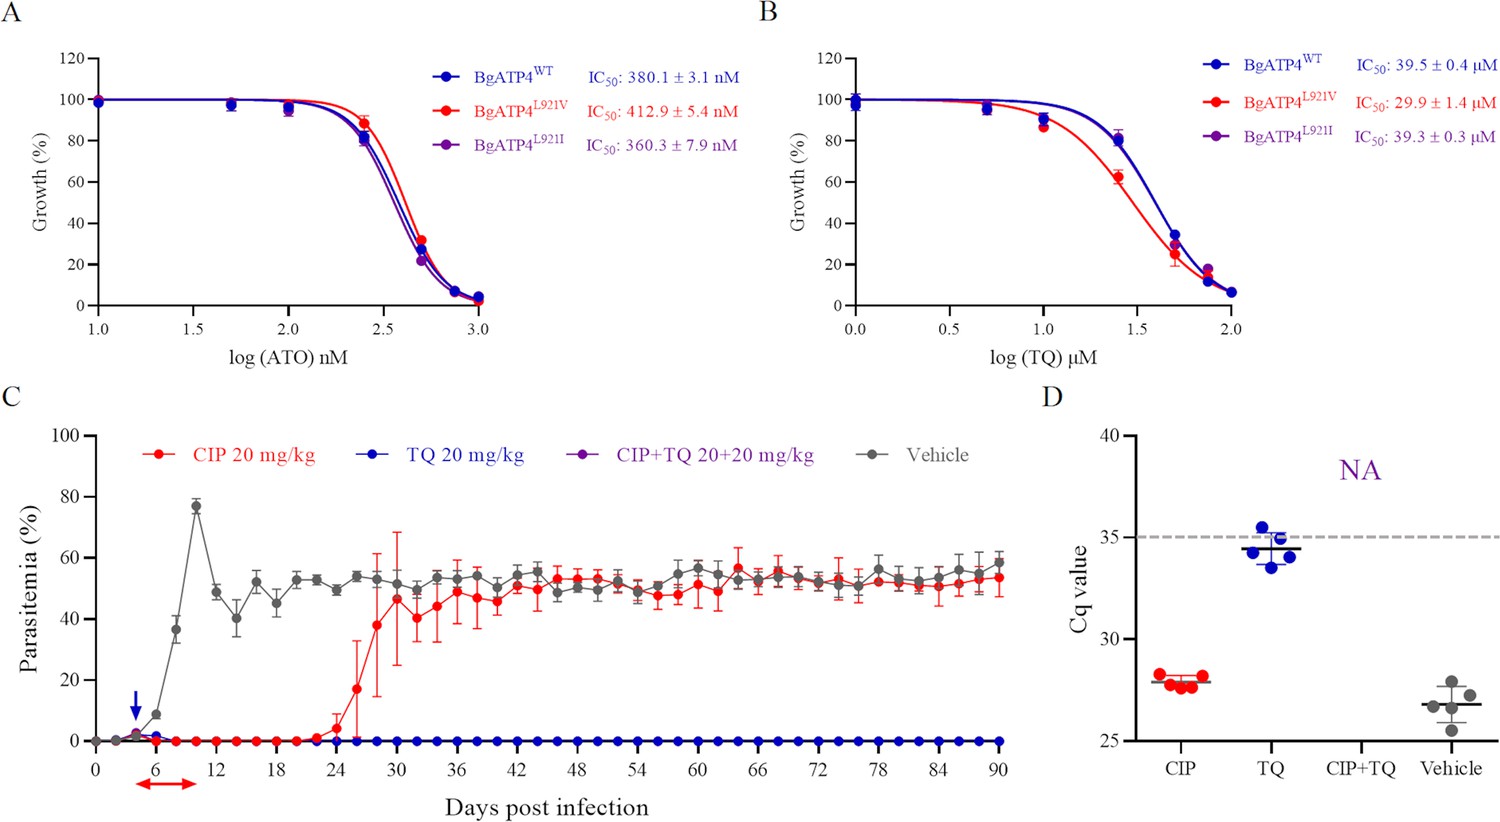
Cross-resistance between ATO and TQ in resistant parasites and combination therapy based on cipargamin (CIP) plus TQ.
(A) Dose-dependent growth curve of BgATP4WT, BgATP4L921V, and BgATP4L921I by ATO treatment in vitro. (B) Dose-dependent growth curve of BgATP4WT, BgATP4L921V, and BgATP4L921I by TQ treatment in vitro. (C) Inhibitory effects of CIP plus TQ on the proliferation of B. microti in SCID mice (n = 5 per group). Treatment started at 4 DPI: CIP was given at 20 mg/kg once daily for 7 days, TQ was administered as a single 20 mg/kg dose, and the combination group received both treatments (CIP at 20 mg/kg once daily for 7 days plus a single dose of TQ at 20 mg/kg). (D) Parasite DNA was detected by qPCR on genomic DNA extracted from blood collected from untreated and treated SCID mice infected with B. microti at 90 DPI. A dotted gray line across the graph represents the average cut-off Cq value. Cut-off Cq ≤35 was considered positive, while Cq >35 or no amplification was considered negative. Each value represents the mean ± SD derived from a minimum of five biological replicates. NA indicates no amplification.
Additional files
-
Supplementary file 1
Primer sets of B. gibsoni ATP4.
- https://cdn.elifesciences.org/articles/101128/elife-101128-supp1-v1.docx
-
Supplementary file 2
Primer sets of B. microti ATP4.
- https://cdn.elifesciences.org/articles/101128/elife-101128-supp2-v1.docx
-
Supplementary file 3
Interactions of CIP from docking simulations.
- https://cdn.elifesciences.org/articles/101128/elife-101128-supp3-v1.docx
-
MDAR checklist
- https://cdn.elifesciences.org/articles/101128/elife-101128-mdarchecklist1-v1.pdf
Download links
A two-part list of links to download the article, or parts of the article, in various formats.
Downloads (link to download the article as PDF)
Open citations (links to open the citations from this article in various online reference manager services)
Cite this article (links to download the citations from this article in formats compatible with various reference manager tools)
Efficacy and mechanism of action of cipargamin as an antibabesial drug candidate
eLife 13:RP101128.
https://doi.org/10.7554/eLife.101128.4


