HIV-1 Vif disrupts phosphatase feedback regulation at the kinetochore, leading to a pronounced pseudo-metaphase arrest
- McArdle Laboratory for Cancer Research, Department of Oncology, University of Wisconsin-Madison, United States
- Biophysics Graduate Program, University of Wisconsin-Madison, United States
- Cancer Biology Graduate Program, University of Wisconsin-Madison, United States
- Institute for Molecular Virology, University of Wisconsin-Madison, United States
- Carbone Comprehensive Cancer Center, University of Wisconsin-Madison, United States
Figures
Figure 1 with 1 supplement
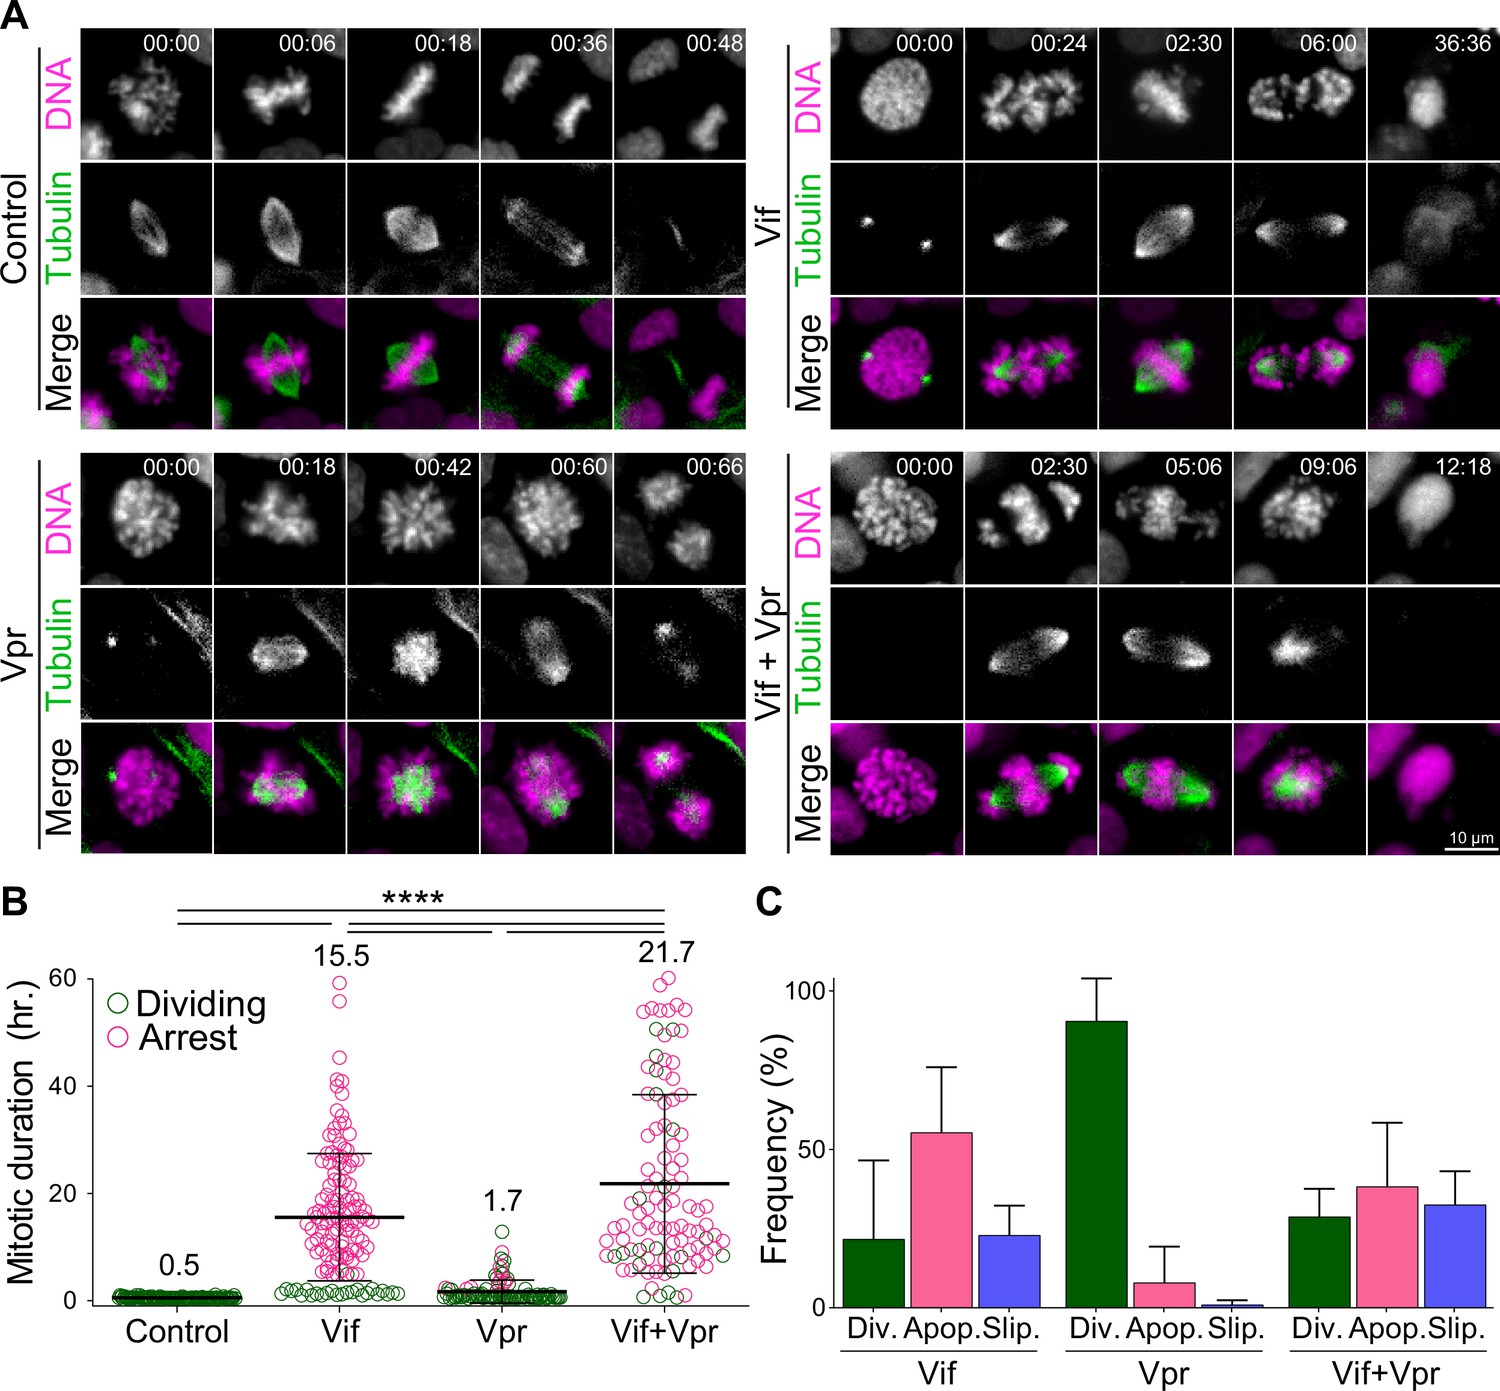
Vif and Vpr induce distinct forms of mitotic arrest.
(A) Representative live cell image for Cal51 cells with H2B-mScarlet and Tubulin-mNeonGreen expressing Control, Vif, Vpr, or Vif +Vpr reporter viruses. (B) Average mitotic duration of Cal51 cells expressing respective reporter virus (n=100 for each condition from two replicates). (C) Frequency of cell fate after mitosis for Cal51 cells expressing respective reporter virus. (n=100 for each from two replicates).
Figure 1—figure supplement 1
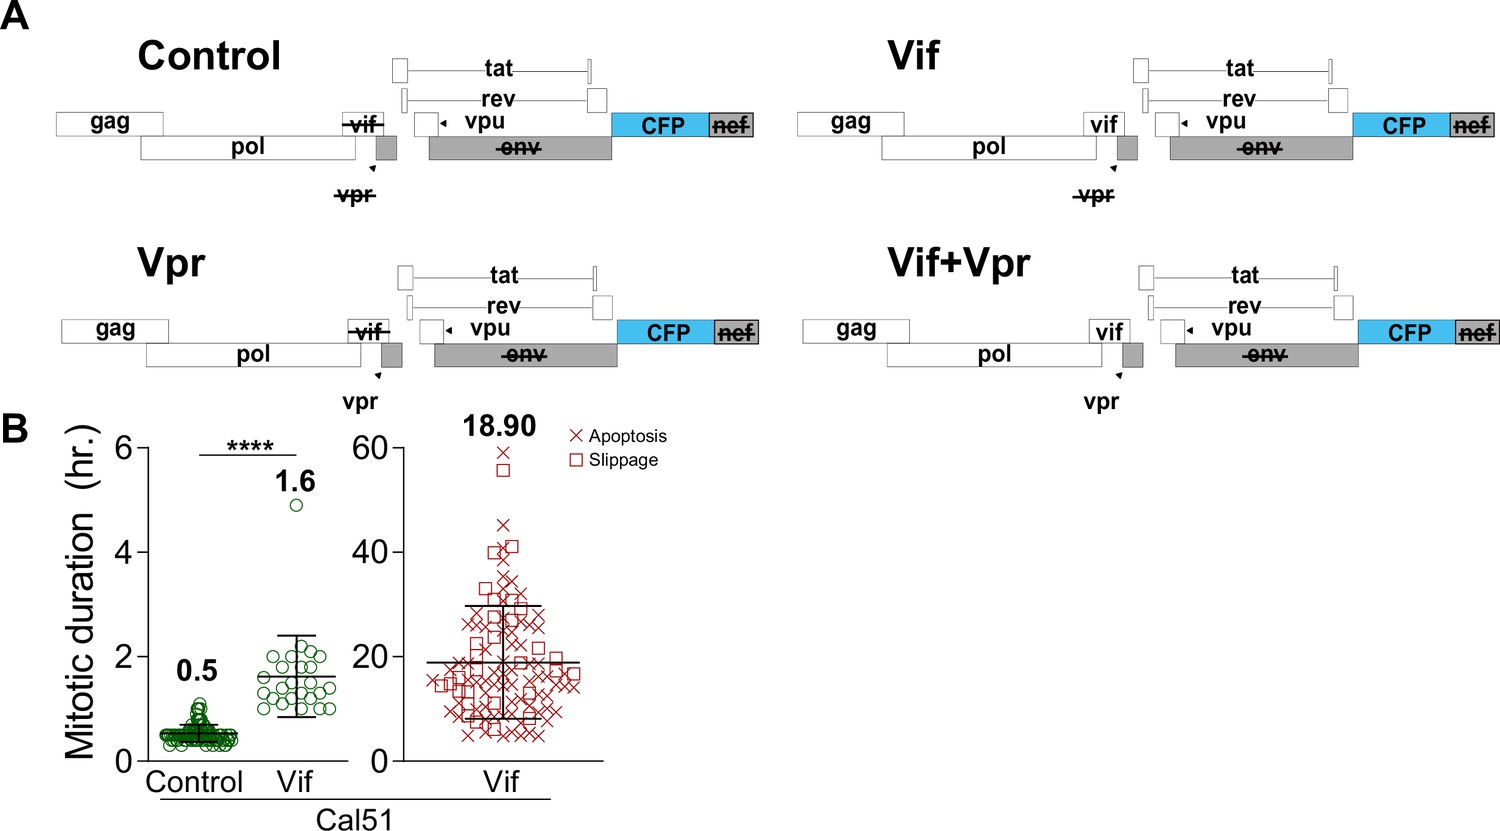
Vif induces a pseudo-metaphase arrest in Cal51.
(A) Various HIV-1 NL4-3 reporter viruses without viral Env and Nef, and with CFP used for most experiments in this study. (B) Average mitotic duration for Control and Vif-expressing Cal51 cells, dividing and non-dividing cells shown separately.
Figure 2 with 1 supplement
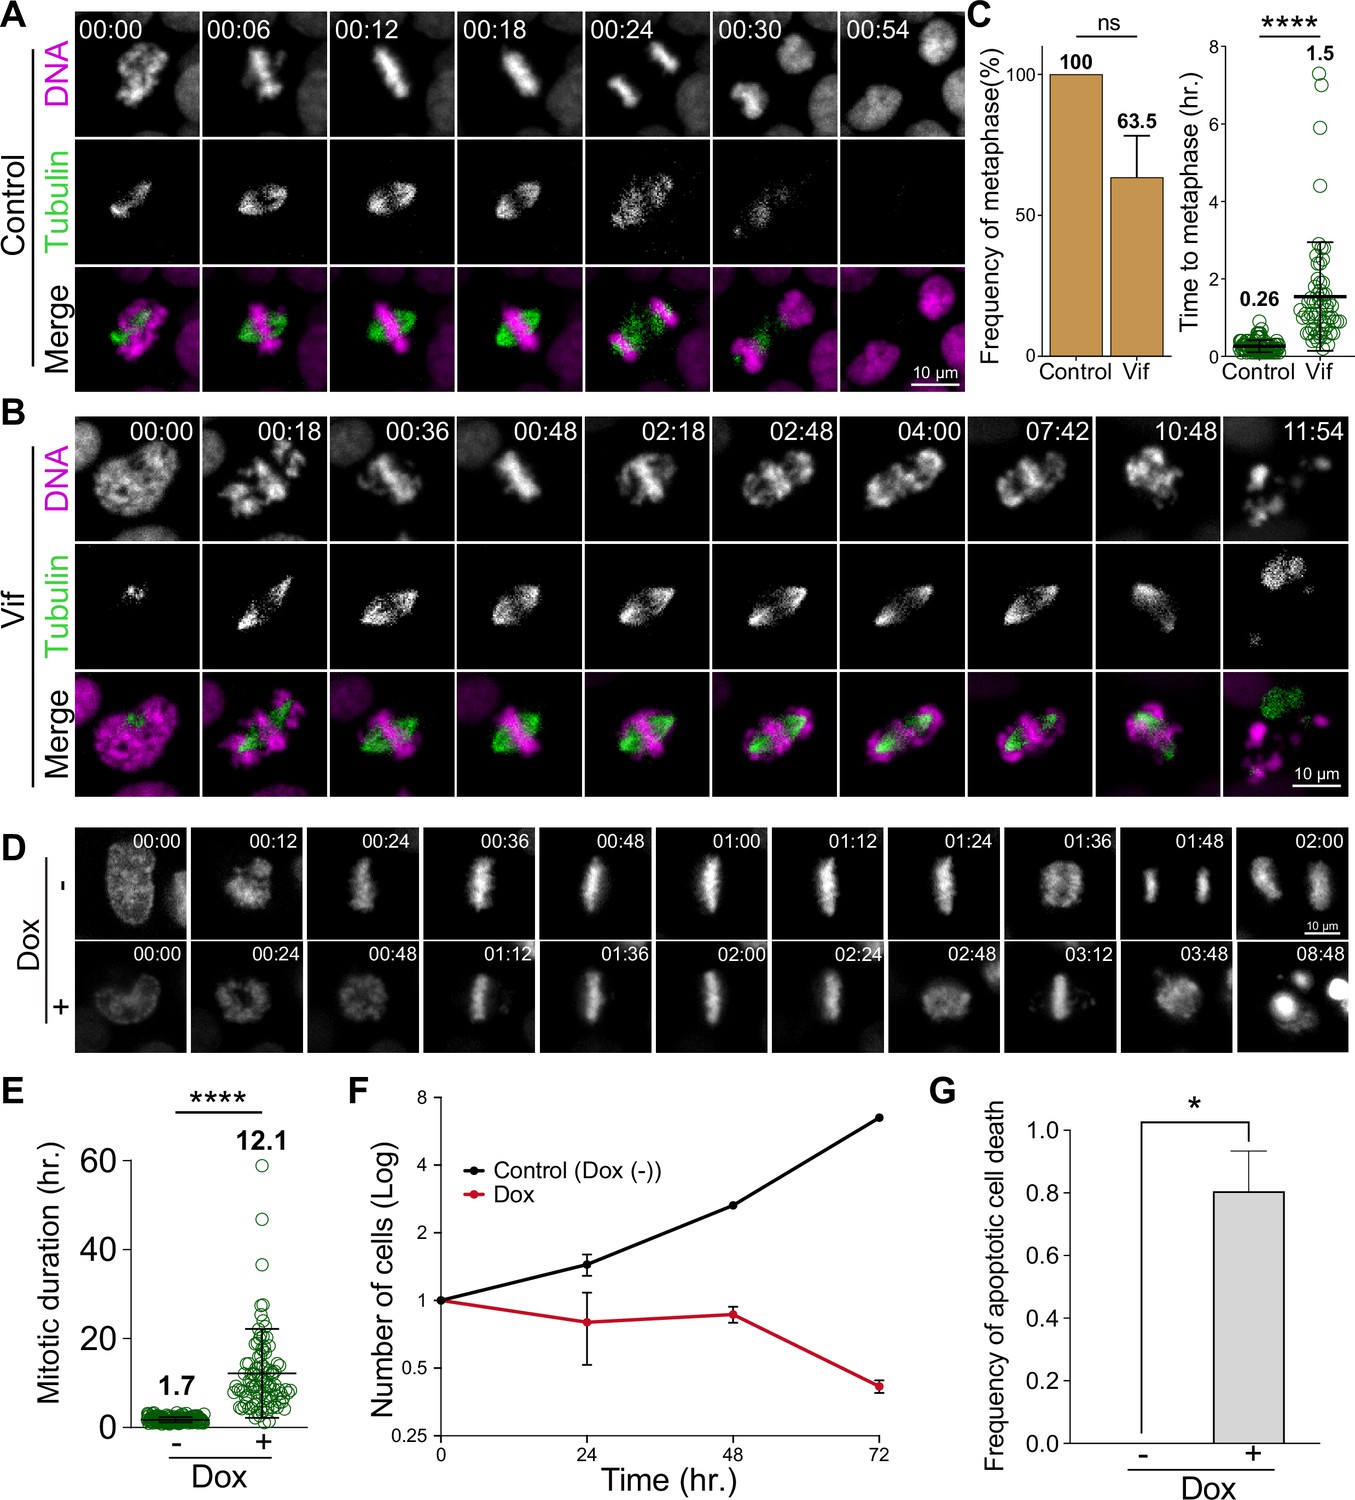
Vif induces robust pseudo-metaphase arrest.
(A) Representative live cell images for Cal51 cells with H2B-mScarlet and Tubulin-mNeonGreen expressing Control reporter virus. (B) Representative live cell image for Cal51 cells expressing Vif reporter virus. (C) Frequency of cells that achieve metaphase plate and time taken to achieve metaphase plate for cells in (A) and (B) (n=100 for each condition from two replicates). (D) Representative live-cell images of Vif conditional expressed HeLa cell with or without Doxycycline (Dox). (E) Average mitotic duration in condition (D) (n=100 cells for each condition from two replicates). (F) Quantification of viable cells over time after Dox induction. (G) Quantification of apoptotic cells after Dox induction.
Figure 2—figure supplement 1
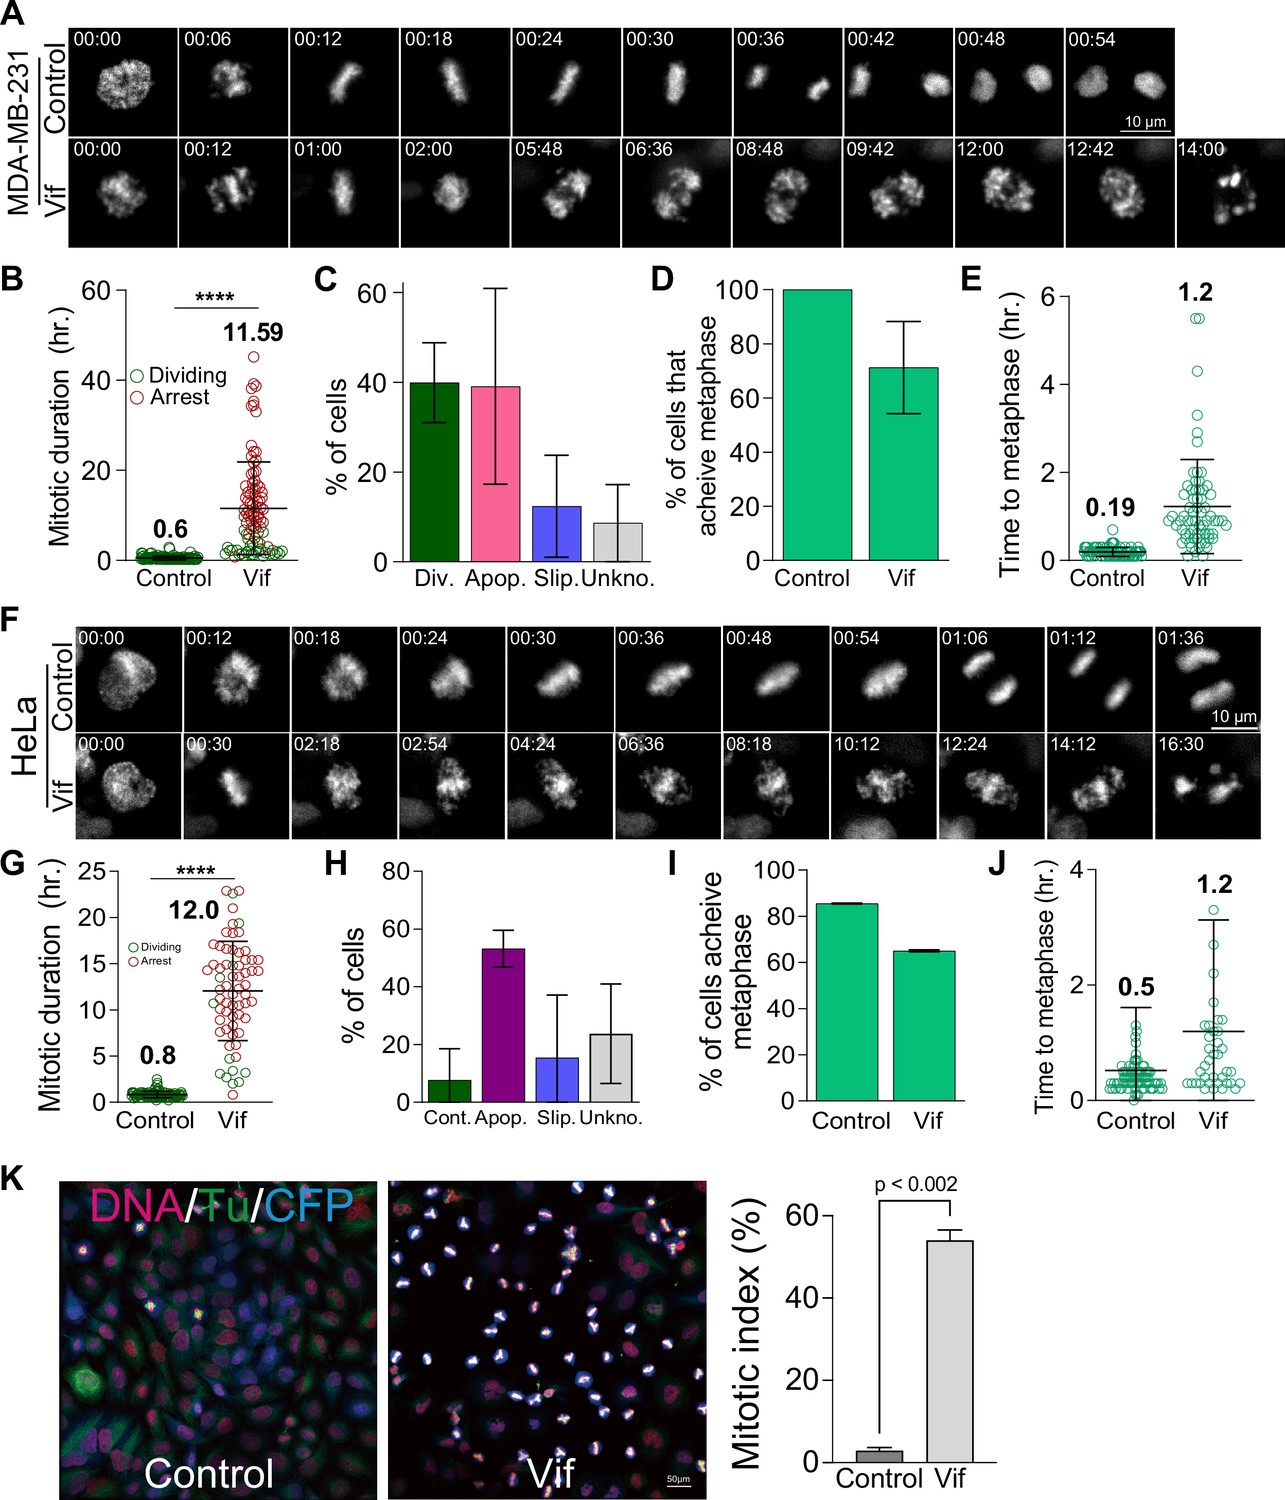
Vif induces pseudo-metaphase arrest in MDA-MB-231 and HeLa cells.
(A) Representative live cell images of Control and Vif-expressing MDA-MB-231 cells. (B) Average mitotic duration for Control and Vif-expressing MDA-MB-231 cells (n=100 from two replicates). (C) Population frequency of cell fate after mitosis. (D) Frequency of cells which achieve metaphase plate for cells in (B). (E) Average time taken to achieve metaphase plate from NEBD for cells in (D). (F) Representative live cell images of Control and Vif-expressing HeLa cells. (G) Average mitotic duration for Control and Vif-expressing HeLa cells (n=100). (H) Population frequency of cell fate after mitosis. (I) Frequency of cells which achieve metaphase plate for cells in (G). (J) Average time taken to achieve metaphase plate from NEBD for cells in (I). (K) Representative IF images stained for DNA, Tubulin, and CFP in Control and Vif-expressing HeLa cells at 72 hr post-infection (left) and mitotic index (right). (n>500 cells for each replicate).
Figure 3 with 1 supplement
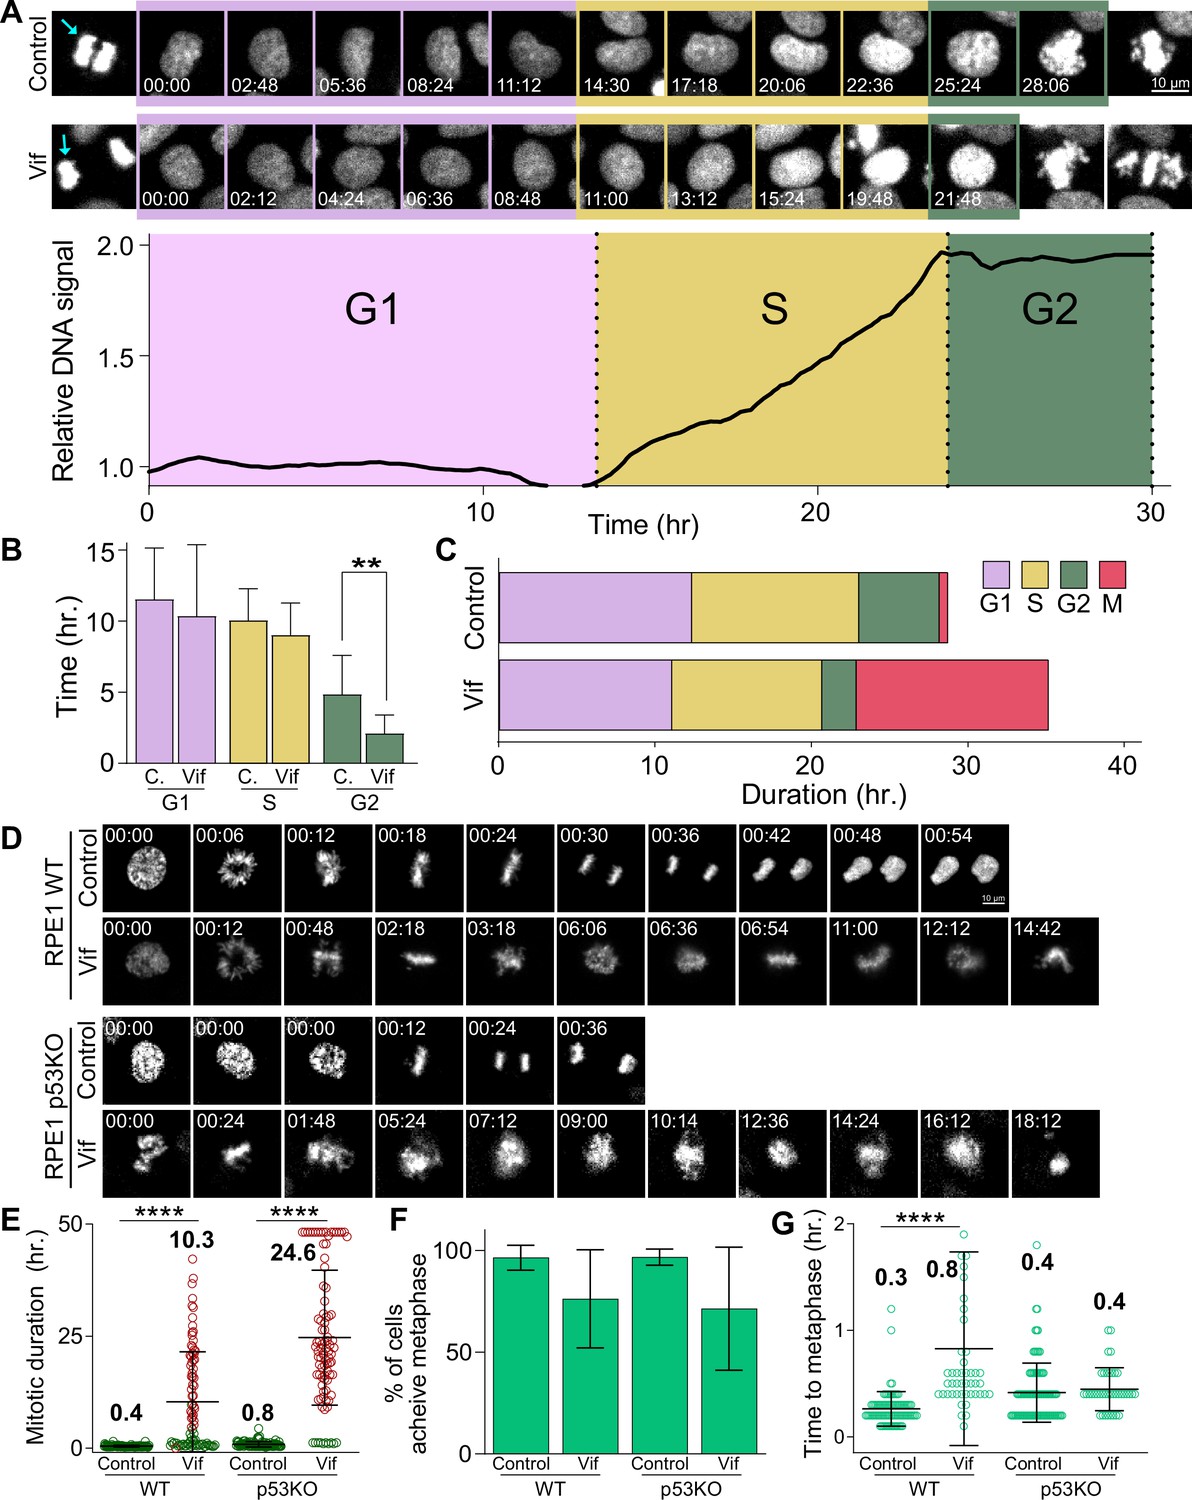
Vif does not alter G1 or S phase progression, accelerates G2 progression, and induces pseudo-metaphase arrest independent of p53.
(A) Top: Representative image of Cal51 cells progressing through G1, S, and G2. Bottom: Representative trace for relative signal intensity of the nucleus through cell cycle. (B) Average duration of G1, S, and G2 phases in Control and Vif-expressing cells (n=9 for Control and 11 for Vif, from two replicates). (C) Total cell cycle duration for Control and Vif-expressing cells. (D) Representative live cell images for Control and Vif-expressing WT or p53 KO RPE1 cells. (E) Average mitotic duration in WT or p53 KO RPE1 cells (n=>85 cells, from two replicates). (F) Frequency of cells which achieve metaphase plate for cells in (E). (G) Average time taken to achieve metaphase plate for cells in (F).
Figure 3—figure supplement 1
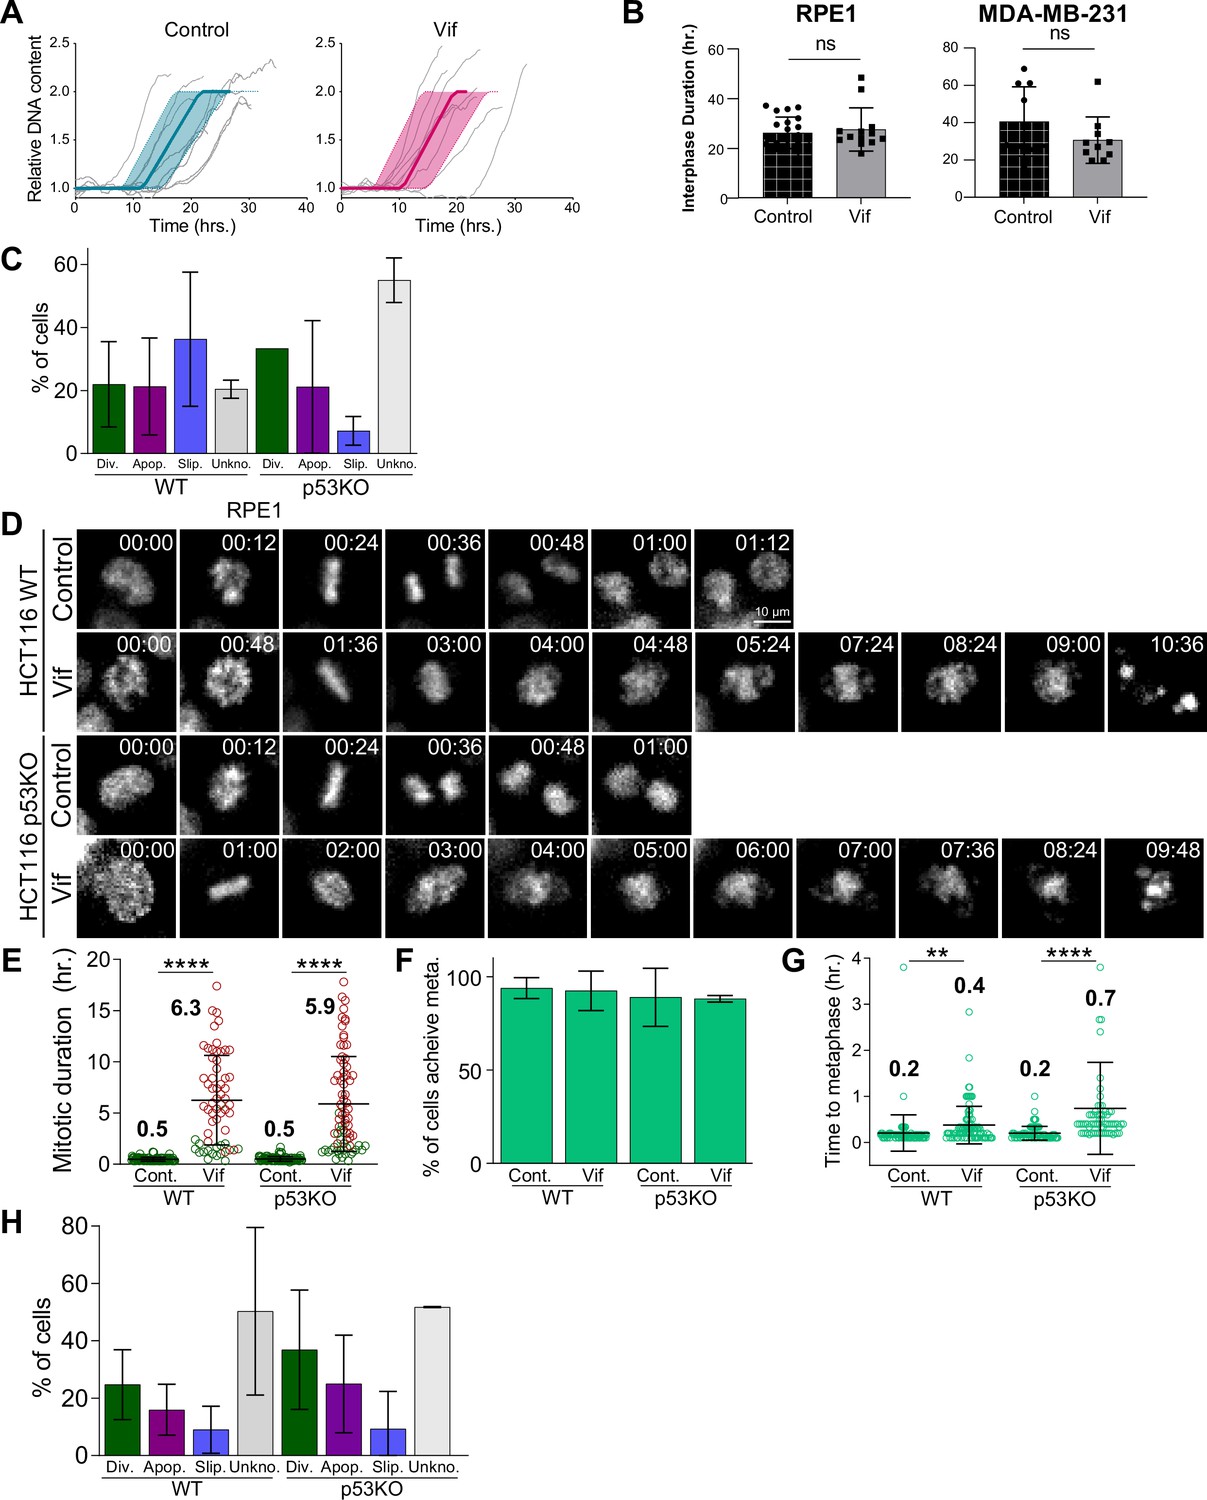
Vif specifically induces pseudo-metaphase arrest independent of p53 status.
(A) Average cell cycle progression from G1 to G2 phase in Cal51 cells for Control and Vif-expressing cells. (B) Duration between consecutive mitosis for RPE1 and MDA-MB-231 cells (C) Distribution of cell fate outcomes following mitosis in wild-type (WT) and p53 KO RPE1 cells under control conditions and upon Vif expression. (D) Representative live cell images for Control and Vif-expressing WT and p53 KO HCT116 cells. (E) Comparative analysis of average mitotic duration in wild-type and p53 KO HCT116 cells (n>70 cells). Green highlights cells that successfully divided, whereas red indicates those undergoing apoptotic cell death. (F) Frequency of cells which achieve metaphase for cells in (E). (G) Average time taken to achieve metaphase plate from NEBD for cells in (F). (H) Population frequency of cell fate after mitosis for WT and p53 KO HCT116 cells.
Figure 4 with 1 supplement
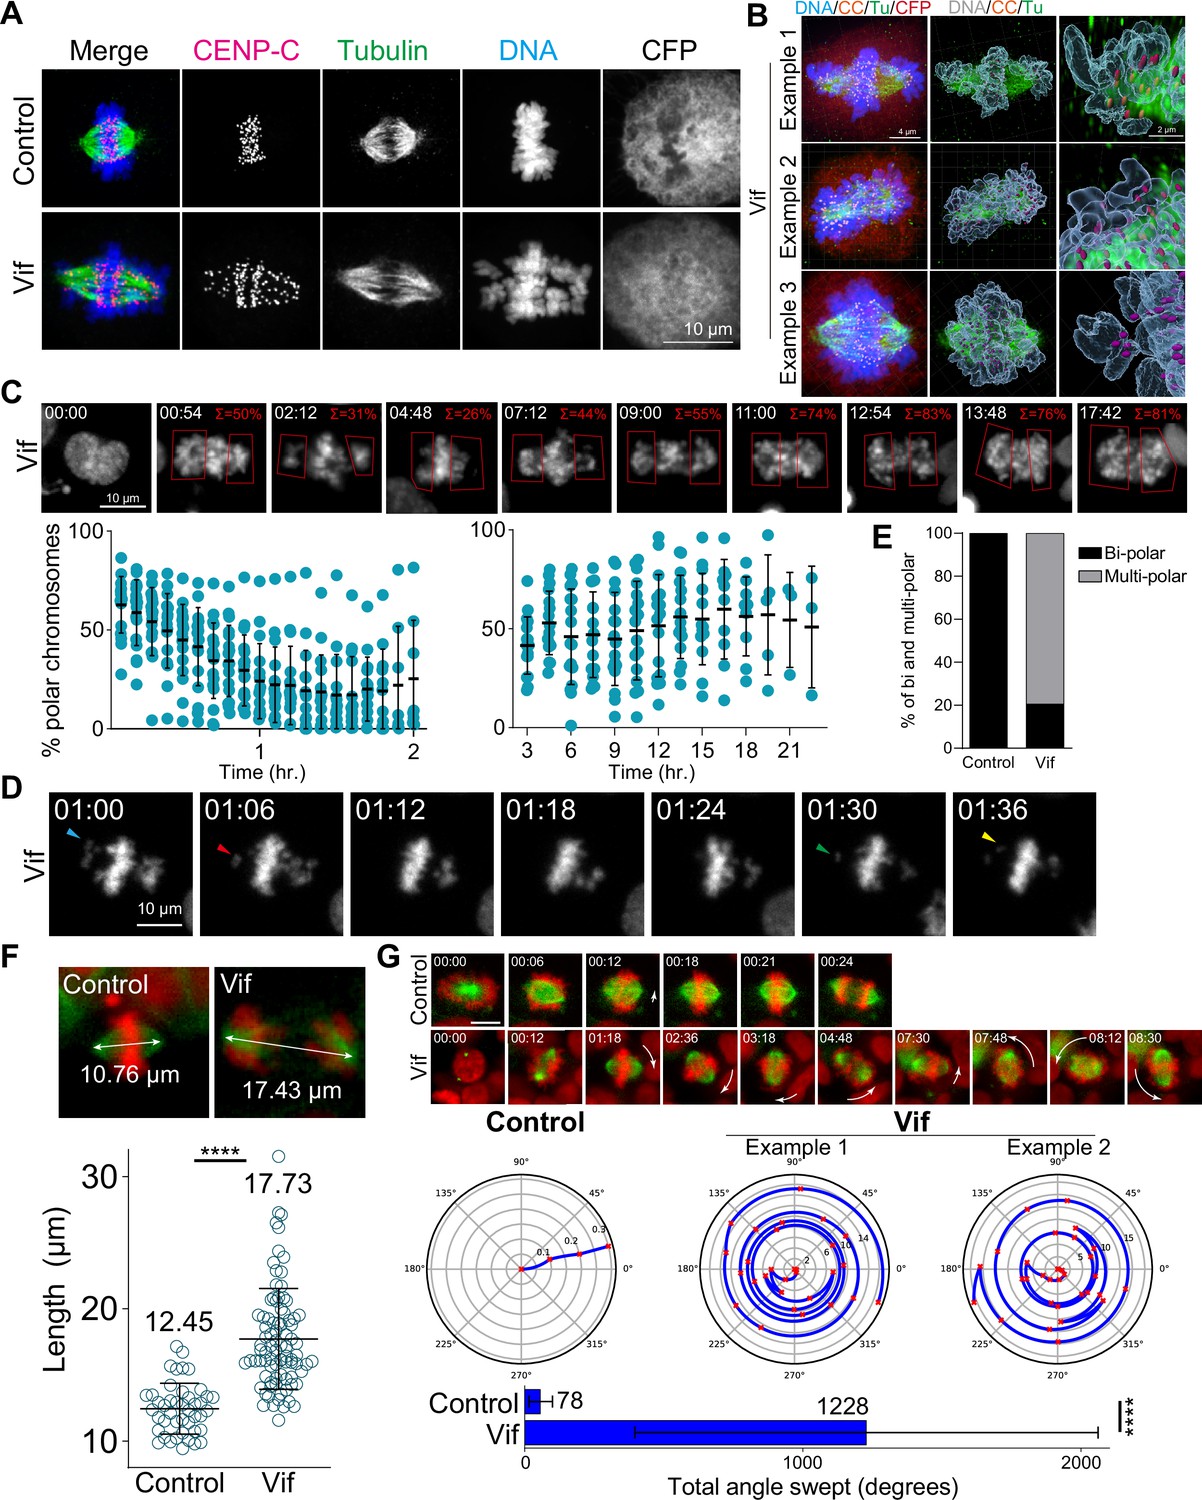
Vif induces polar chromosomes, multi-polar spindles, and abnormal chromosome movements.
(A) Representative immunofluorescence images labeled for CENP-C (as a kinetochore marker), microtubule, and DNA in Control and Vif-expressing HeLa cells. (B) Example super-resolution images labeled for CENP-C (CC), microtubule (Tu), CFP, and DNA in Vif-expressed HeLa cells showing polar chromosomes. (C) Representative live cell image of Vif-expressing cells where polar chromosomes were quantified by compartmentalizing polar regions. Bottom: Quantification of polar chromosome frequency overtime. (D) Representative high-temporal live cell images (6 min interval) showing rapid chromosome movement towards and away from the spindle poles. (E) Fraction of Cal51 cells showing abnormal number of poles at some point during mitosis. (F) Top: Representative images of maximum mitotic spindle length for Control and Vif-expressing Cal51 cells. Bottom: Average maximum mitotic spindle length of Control and Vif-expressing cells. (G) Top: Representative live cell image of Control and Vif-expressing Cal51 cells over time showing dynamic spindle spinning. Center: Representative figures showing relative orientation (angle) of the spindle axis over time (radius). Bottom: Average total angle swept during mitosis.
Figure 4—figure supplement 1
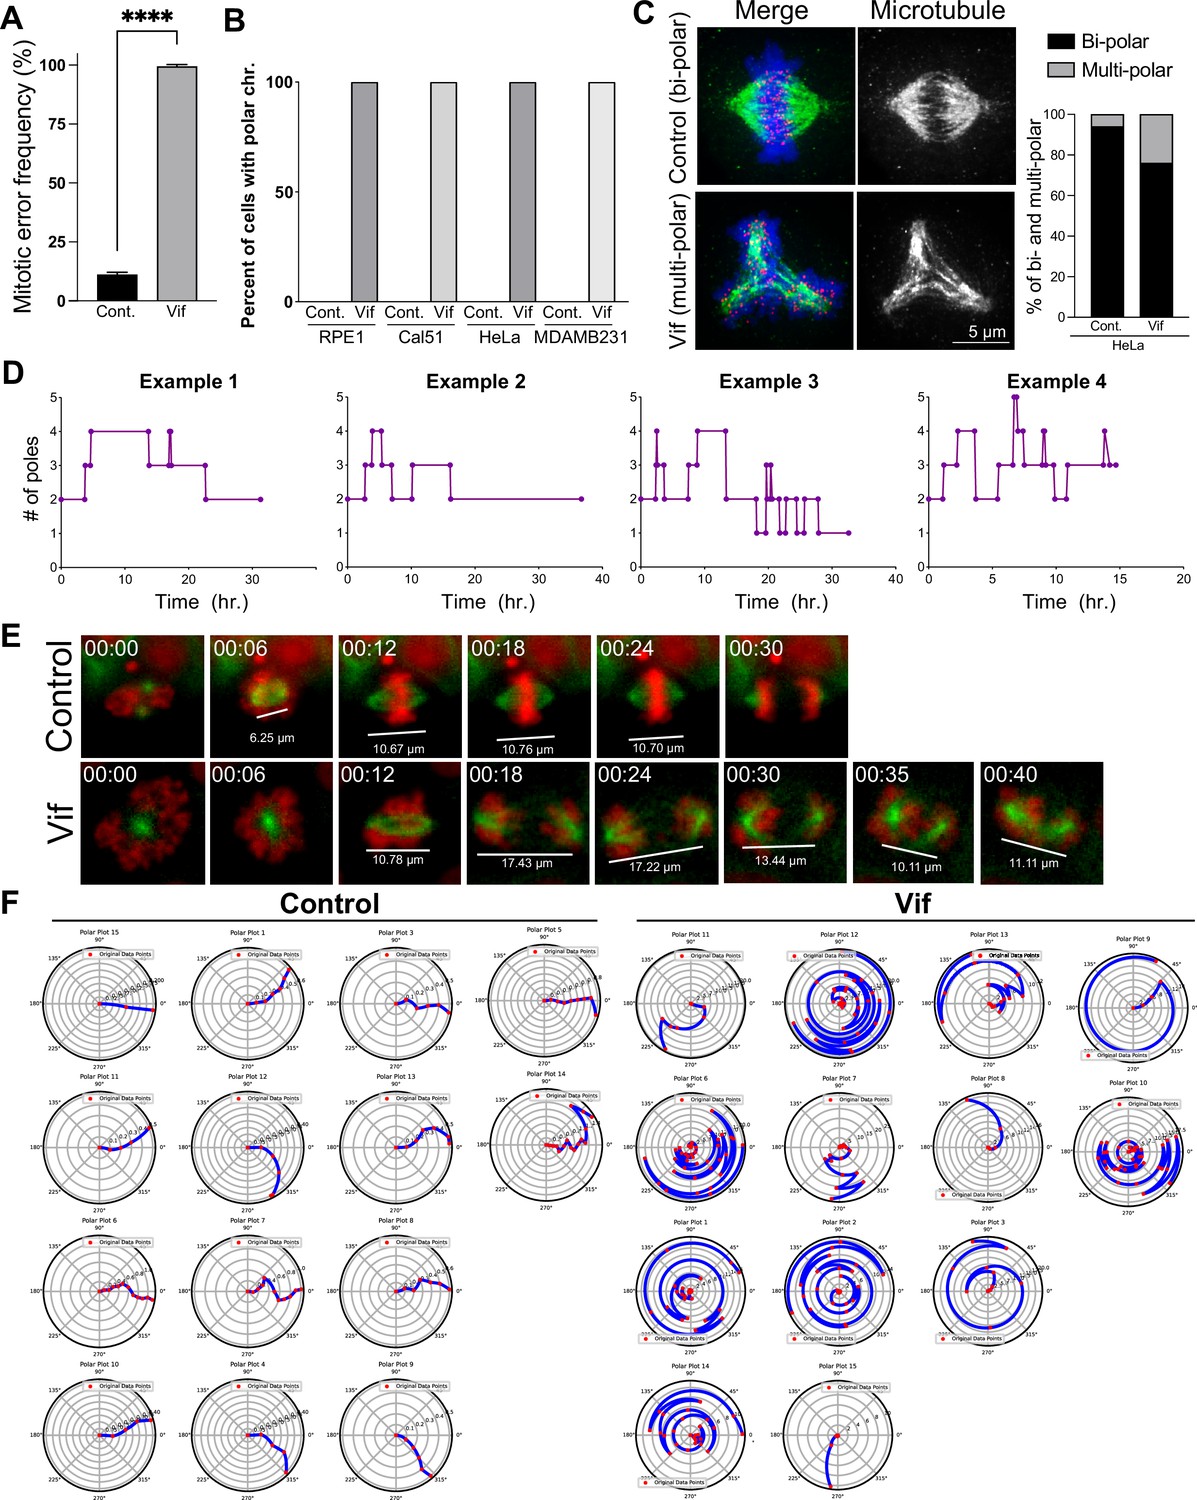
Vif induces unaligned chromosomes, multi-polar spindle, and abnormal chromosome and spindle movements.
(A) Frequency of cells showing at least one mitotic error at 48 hr after doxycycline-induced Vif expression in HeLa cells. (B) Population frequency of Control and Vif-expressing cells of various cell lines with polar chromosomes measured with timelapse imaging. (C) Representative fixed cell image of Control and Vif-expressing HeLa cell showing normal vs multipolar spindle along with quantification. (D) Representative plots of individual Cal51 cells showing variable pole number over time. (E) Representative live cell image of Cal51 cells with measured spindle length. (F) Representative plots showing relative position (angle) of spindle axis overtime (radius) for Control and Vif-expressing Cal51 cells.
Figure 5
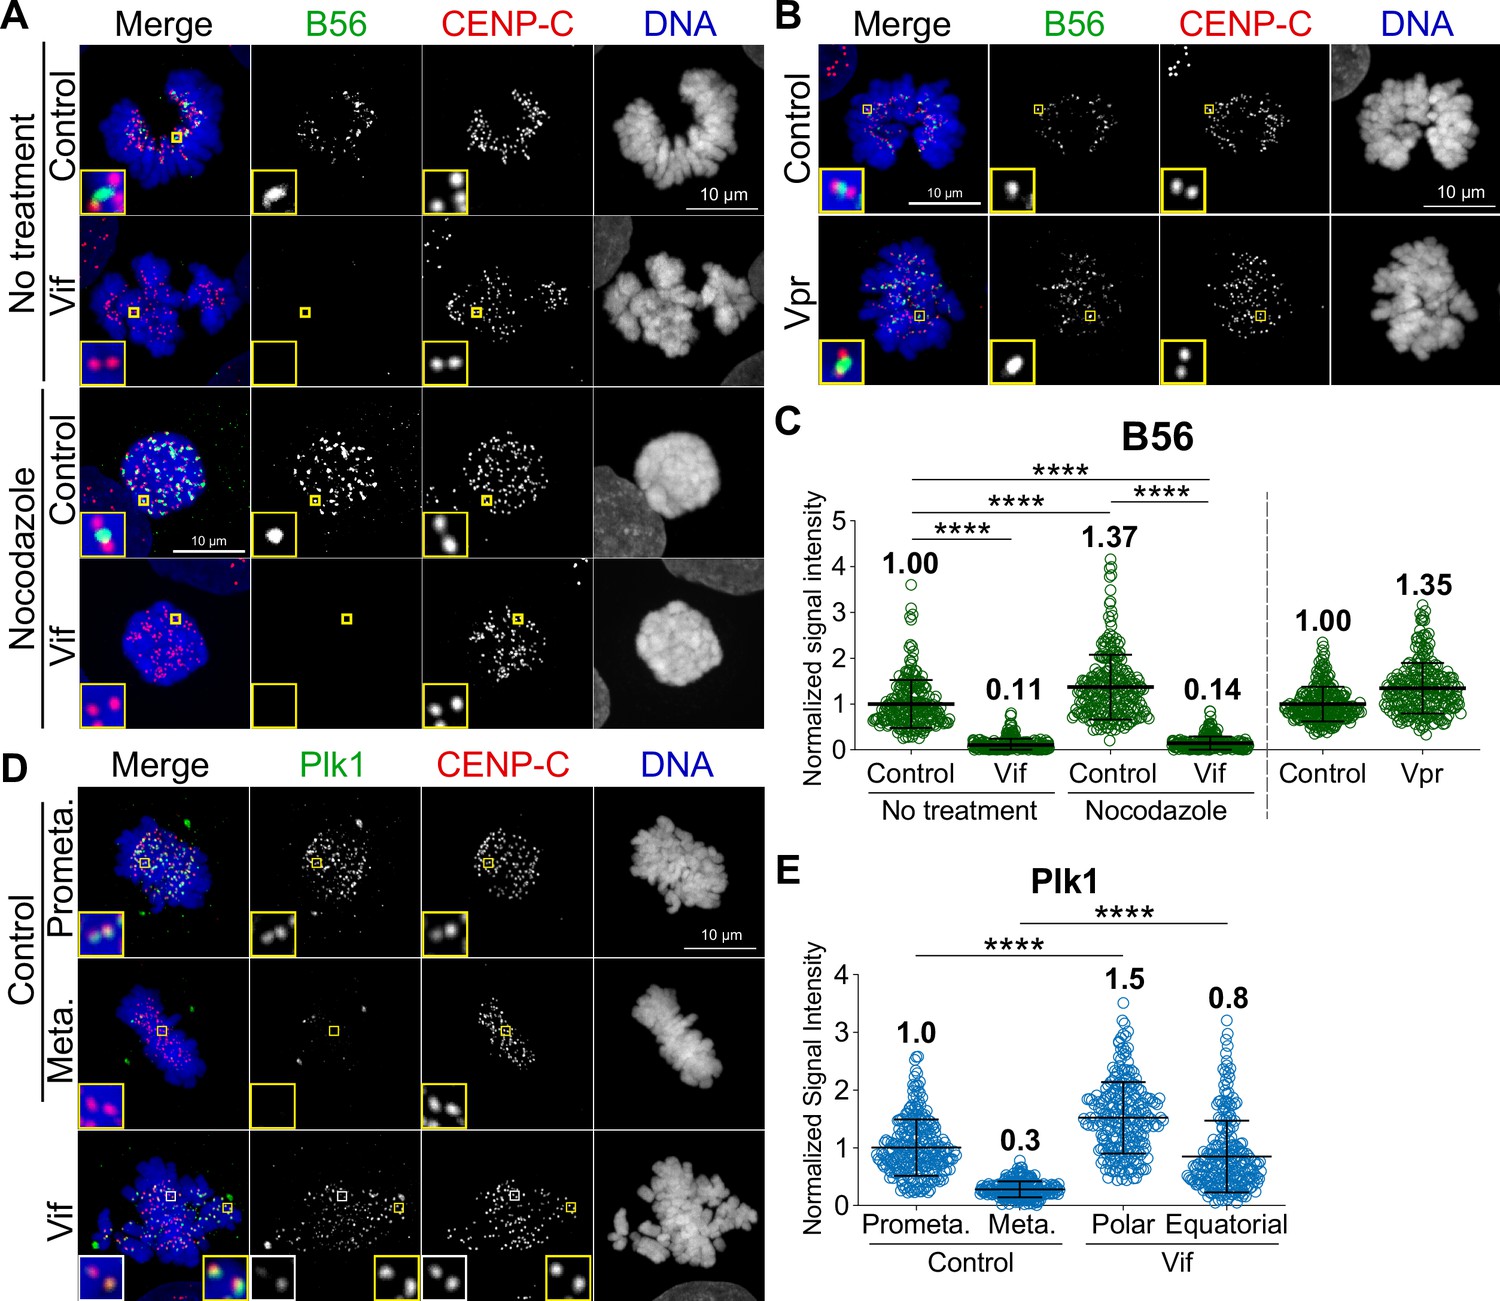
Vif, but not Vpr, disrupts the proper localization of PP2A-B56 at the kinetochores.
(A) Representative immunofluorescence images labeled for B56, CENP-C, and DNA in Control and Vif-expressing HeLa cells with or without nocodazole treatment. (B) Representative immunofluorescence images labeled B56, CENP-C, and DNA in Control and Vpr-expressing HeLa cells. (C) Normalized B56 intensities at kinetochores for cells in (A) and (B) (n=200 kinetochores from 8 cells from two independent replicates for each condition). (D) Representative immunofluorescence images labeled for Plk1, CENP-C, and DNA of Control and Vif-expressing HeLa cells. (E) Normalized Plk1 intensities at kinetochore for cells in (D) (n=200 kinetochores from 8 cells from two independent replicates for each condition).
Figure 6 with 1 supplement
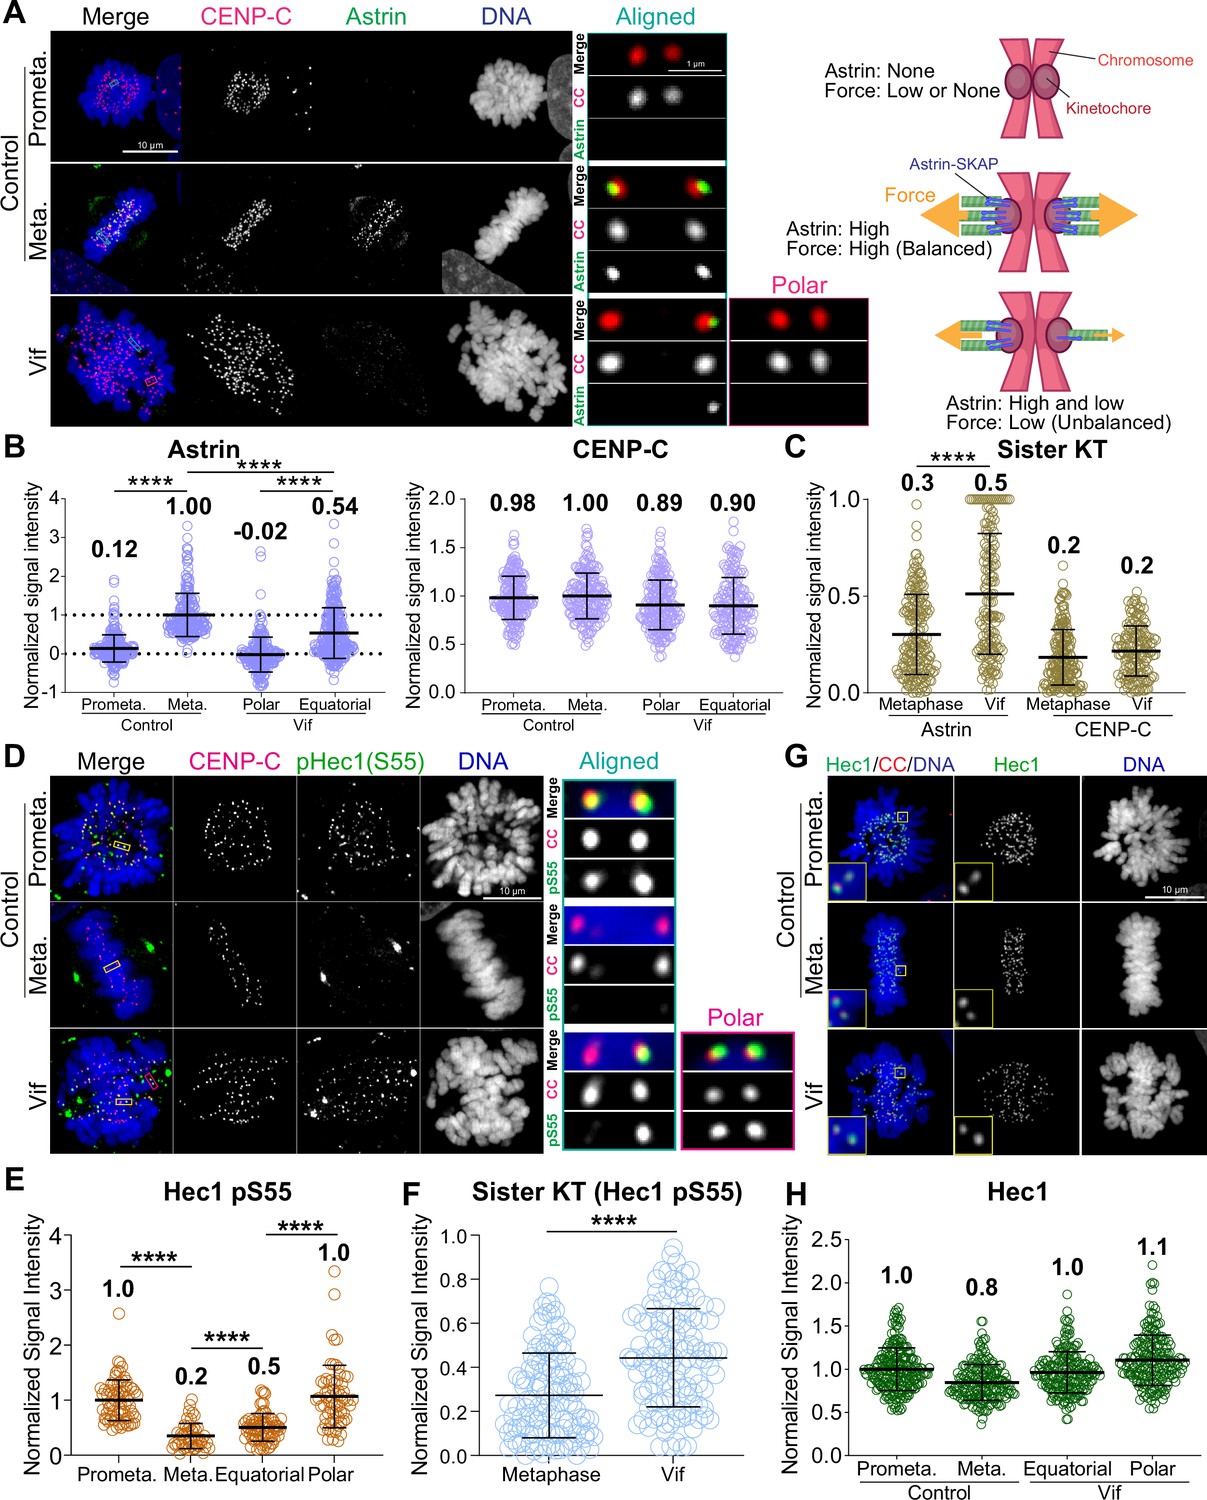
Vif impairs stable and balanced kinetochore microtubule attachments.
(A) Left: Representative immunofluorescence images labeled for CENP-C, Astrin, and DNA in Control and Vif-expressing HeLa cells, Right: Illustrative interpretation of images on the left. (B) Normalized Astrin and CENP-C intensities at kinetochores for cells in (A) (n=200 kinetochores from 8 cells from two independent replicates for each condition) (C) Relative signal intensities of Astrin and CENP-C between sister kinetochores, values normalized with formula: 1 – (lower intensity value/higher intensity value). (D) Representative immunofluorescence images labeled for CENP-C, pHec1(S55), and DNA in Control and Vif-expressing HeLa cells. (E) Normalized pHec1(S55) intensities at kinetochores for cells in (D). (n=200 kinetochores from 8 cells from two independent replicates for each condition). (F) Relative pHec1(S55) intensities between sister kinetochores, values normalized with formula: 1 – (lower intensity value/higher intensity value). (G) Representative immunofluorescence images labeled for Hec1, CENP-C, and DNA in HeLa cells expressing Vif. (H) Normalized Hec1 intensities at kinetochores for cells in (G) (n=200 kinetochores over 8 cells from two independent replicates for each condition). Representative whole-cell images in (A) and (D) are maximum intensity projections of multiple z-slices encompassing entire cells, while the zoomed-in images of a single kinetochore pair are presented as either a single z-plane or maximum intensity projections of 2–3 z-slices. This figure was created using BioRender.com.
Figure 6—figure supplement 1
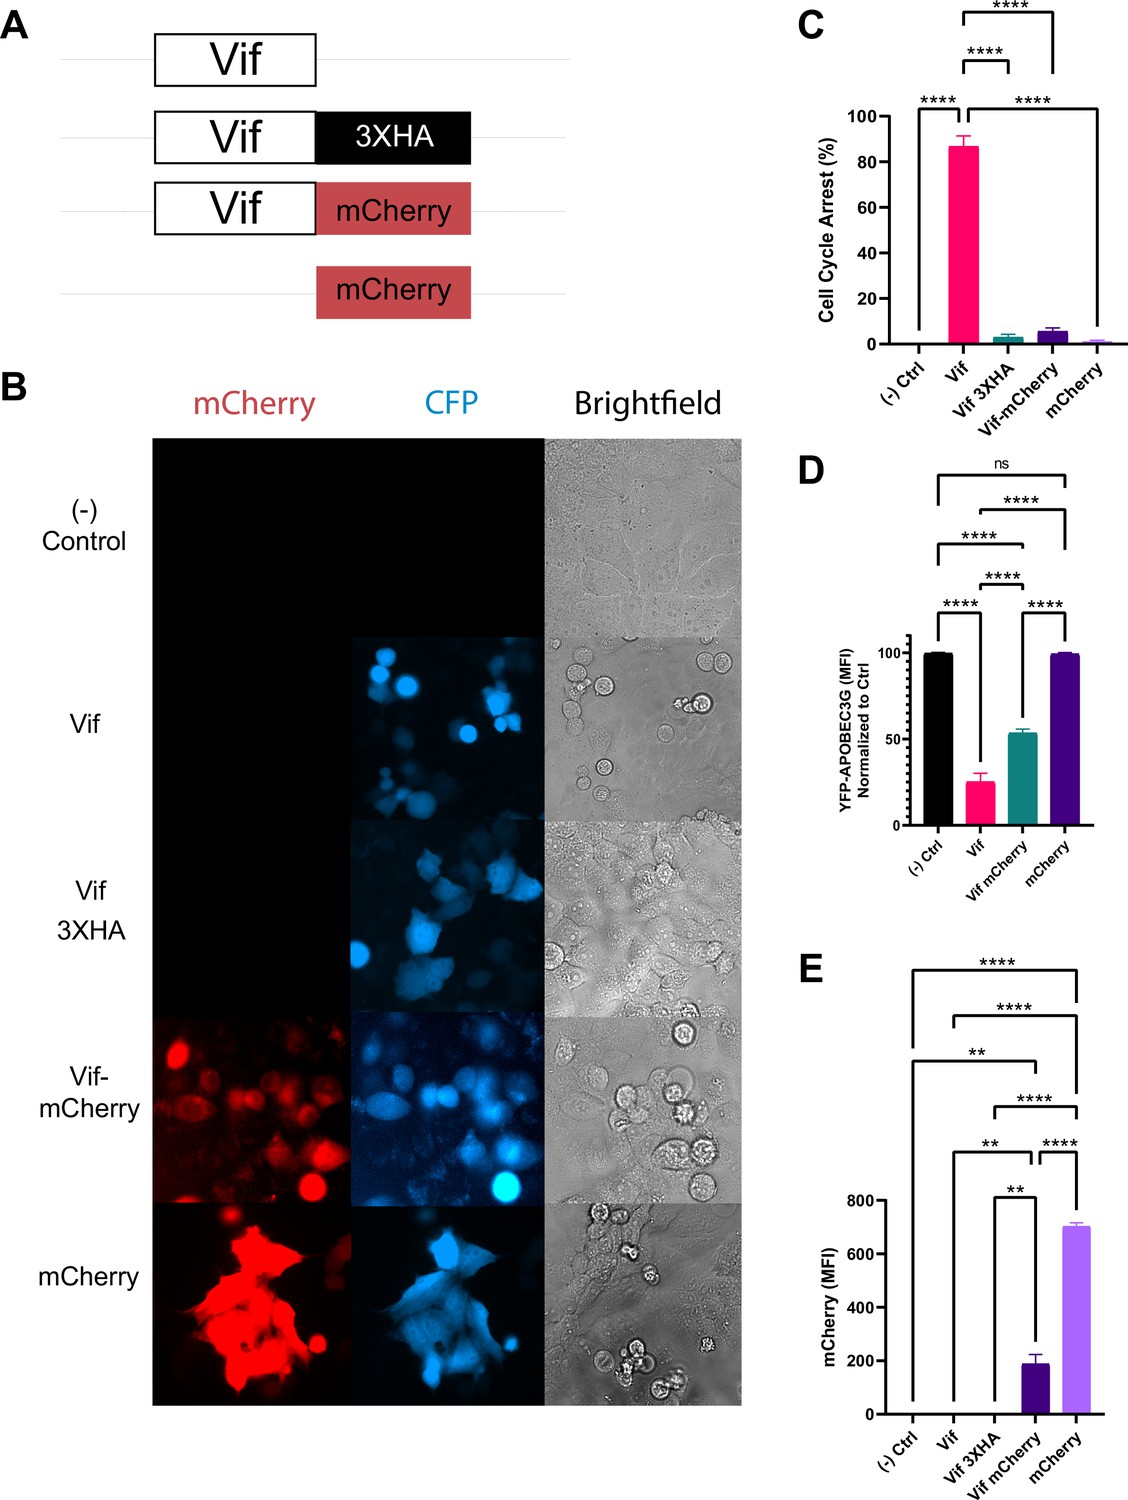
A protein tag to Vif inhibits Vif’s pseudo-metaphase arrest.
(A) Various constructs used to tag Vif. (B) Representative widefield images of cells expressing constructs in (A). (C) Frequency of cells arrested by expression of constructs in (A). (D) Average cellular APOBEC3G levels after expression of constructs in (A). (E) Average signal intensity of mCherry after expression of constructs in (A).
Figure 7
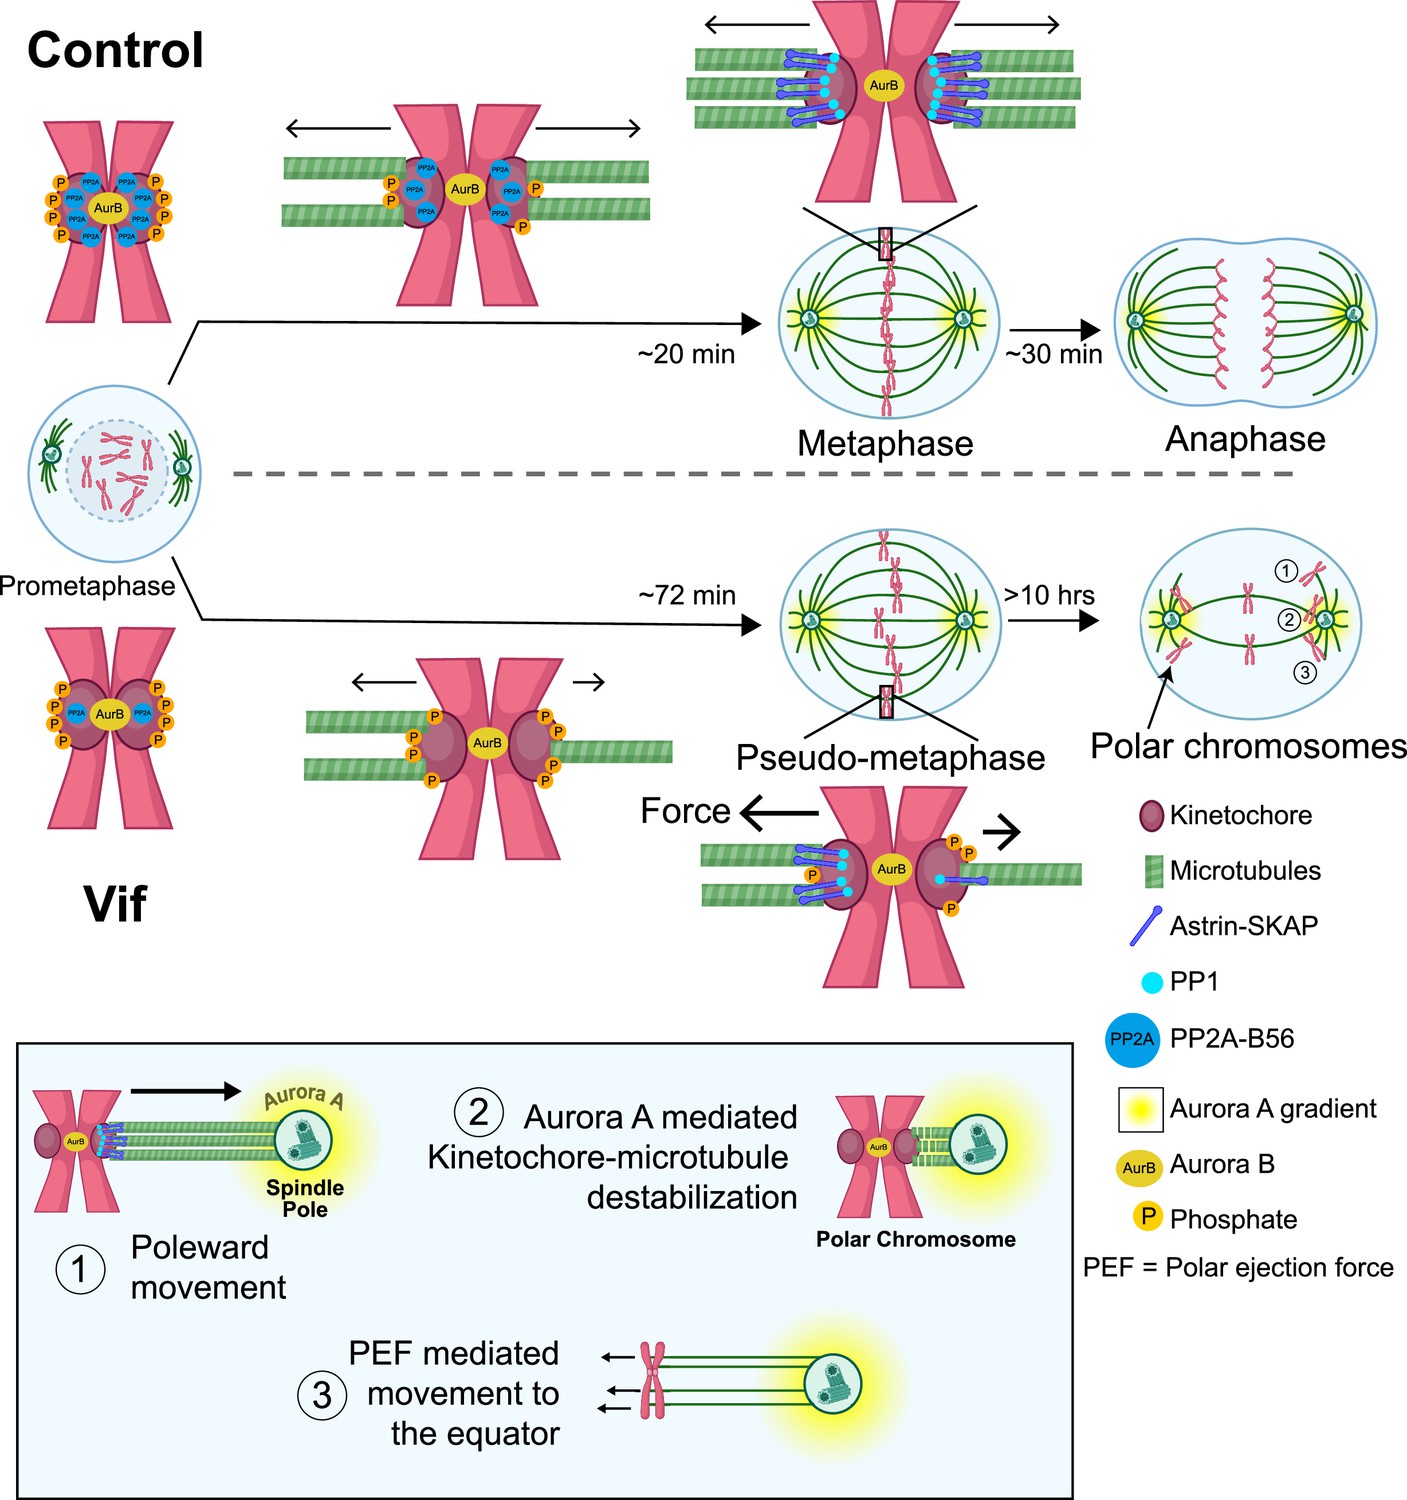
Proposed model for the molecular mechanism underlying Vif’s pseudo-metaphase arrest.
Top: Cartoon model depicting metaphase alignment of Control cells followed by anaphase. Middle: Cartoon model depicting pseudo-metaphase alignment of Vif-expressing cells with unbalanced microtubule attachment followed by three-step polar chromosome cycle. Bottom: Cartoon depiction of three-step polar chromosome cycle, (1) chromosome at the equator is pulled towards a spindle pole due to unbalanced pulling force, (2) kinetochore-microtubule destabilization at the spindle pole, (3) equator-directed movement of chromosome by to polar ejection forces for realignment. This figure was created using BioRender.com.
Videos
Video 1
CFP-positive Control Cal51 live cell imaging.
Scale bar represents 10 µm.
Video 2
CFP-positive Vif-expressing Cal51 live cell imaging.
Scale bar represents 10 µm.
Video 3
Tet-on control (mNeonGreen) HeLa live cell imaging.
Video 4
Tet-on Vif expressing HeLa live cell imaging.
Video 5
Super-resolution 3D images of Control HeLa cell.
Video 6
Super-resolution 3D images of Vif-expressing HeLa cell.
Additional files
Download links
A two-part list of links to download the article, or parts of the article, in various formats.
Downloads (link to download the article as PDF)
Open citations (links to open the citations from this article in various online reference manager services)
Cite this article (links to download the citations from this article in formats compatible with various reference manager tools)
HIV-1 Vif disrupts phosphatase feedback regulation at the kinetochore, leading to a pronounced pseudo-metaphase arrest
eLife 13:RP101136.
https://doi.org/10.7554/eLife.101136.3


