Subtypes and proliferation patterns of small intestine neuroendocrine tumors revealed by single-cell RNA sequencing
- Department of Molecular Cell Biology, Weizmann Institute of Science, Israel
- ENTIRE – Endocrine Neoplasia Translational Research Center, Division of Endocrinology, Diabetes and Metabolism, Chaim Sheba Medical Center, and Gray Faculty of Medical and Health Sciences, Tel Aviv University, Israel
- Department of Immunology and Regenerative Biology, Weizmann Institute of Science, Israel
Figures
Figure 1 with 1 supplement
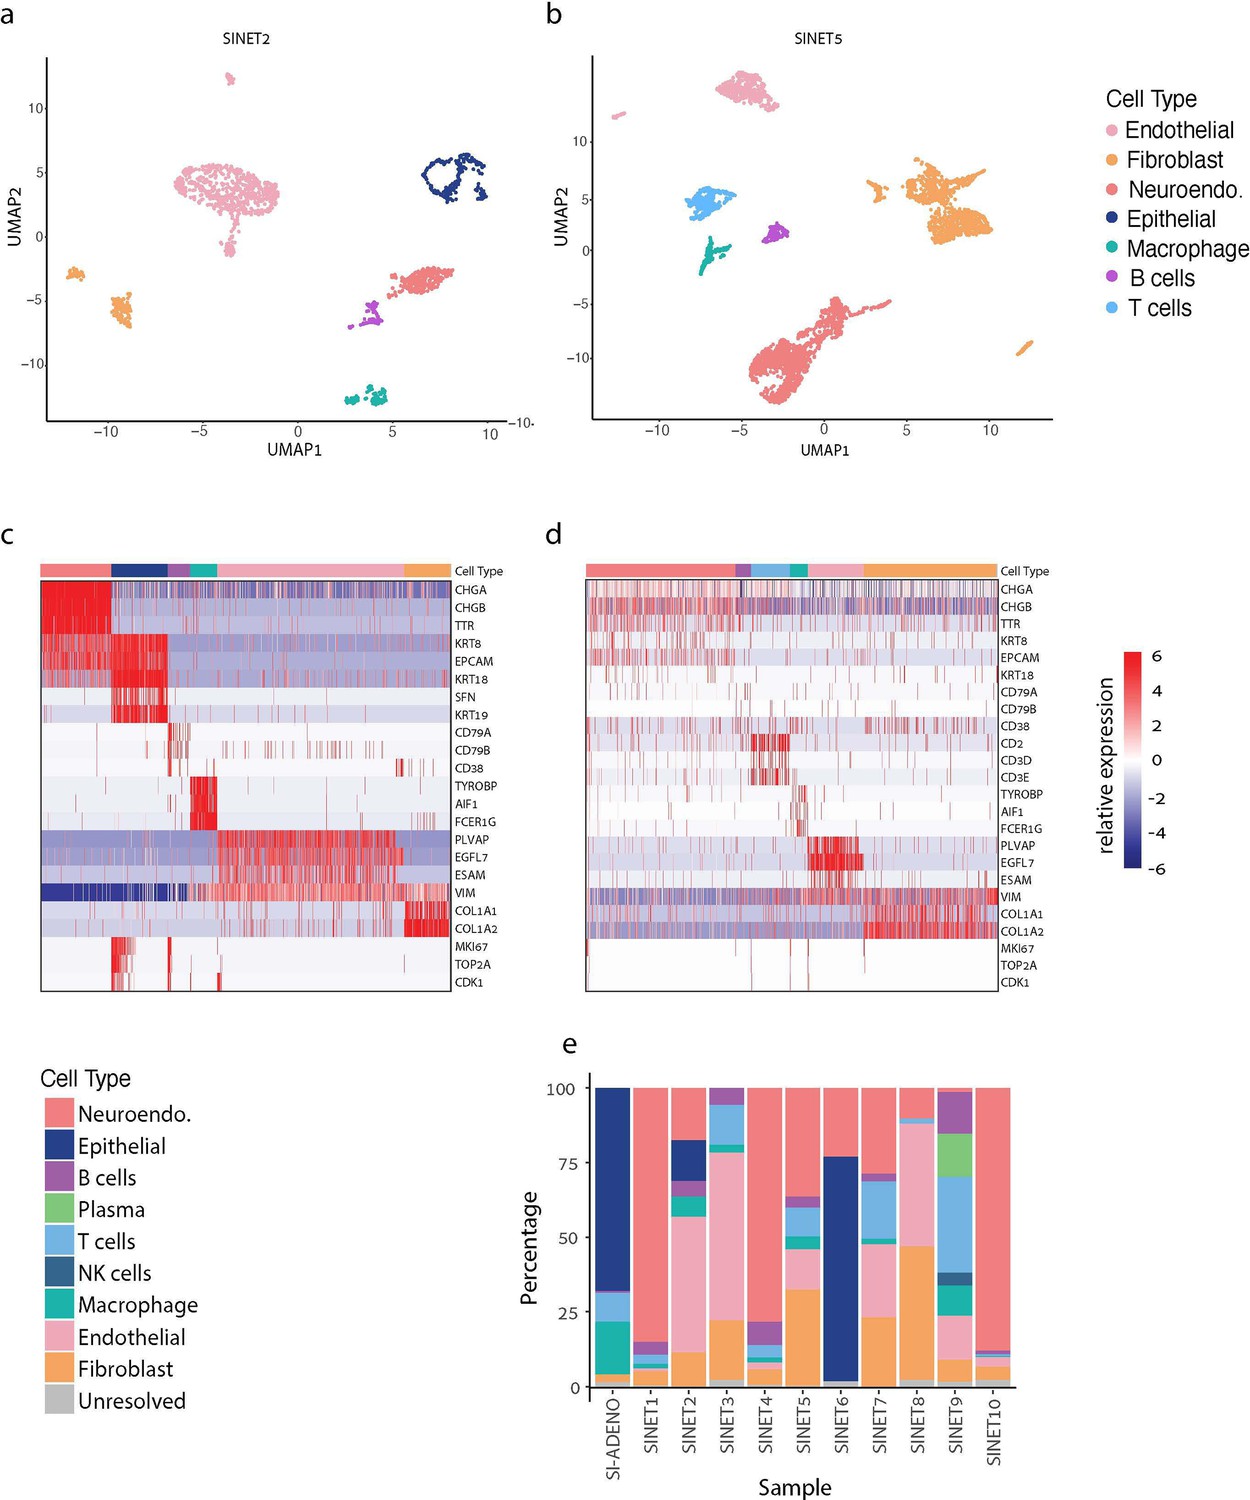
Cellular composition of small intestine neuroendocrine tumors (SiNETs) as determined by single-cell and single-nuclei sequencing.
(A, B) UMAP plots showing the diversity of single cells from SiNET2 (A) and SiNET5 (B), colored by their cluster assignment. (C, D) Cluster annotations (top bar) in SiNET2 (C) and SiNET5 (D) are supported by the expression of canonical cell type markers (rows). Also shown are three cell cycle markers (bottom rows). (E) Cell type frequencies in each of the 10 SiNETs that we profiled, along with one SiAdeno sample.
Figure 1—figure supplement 1
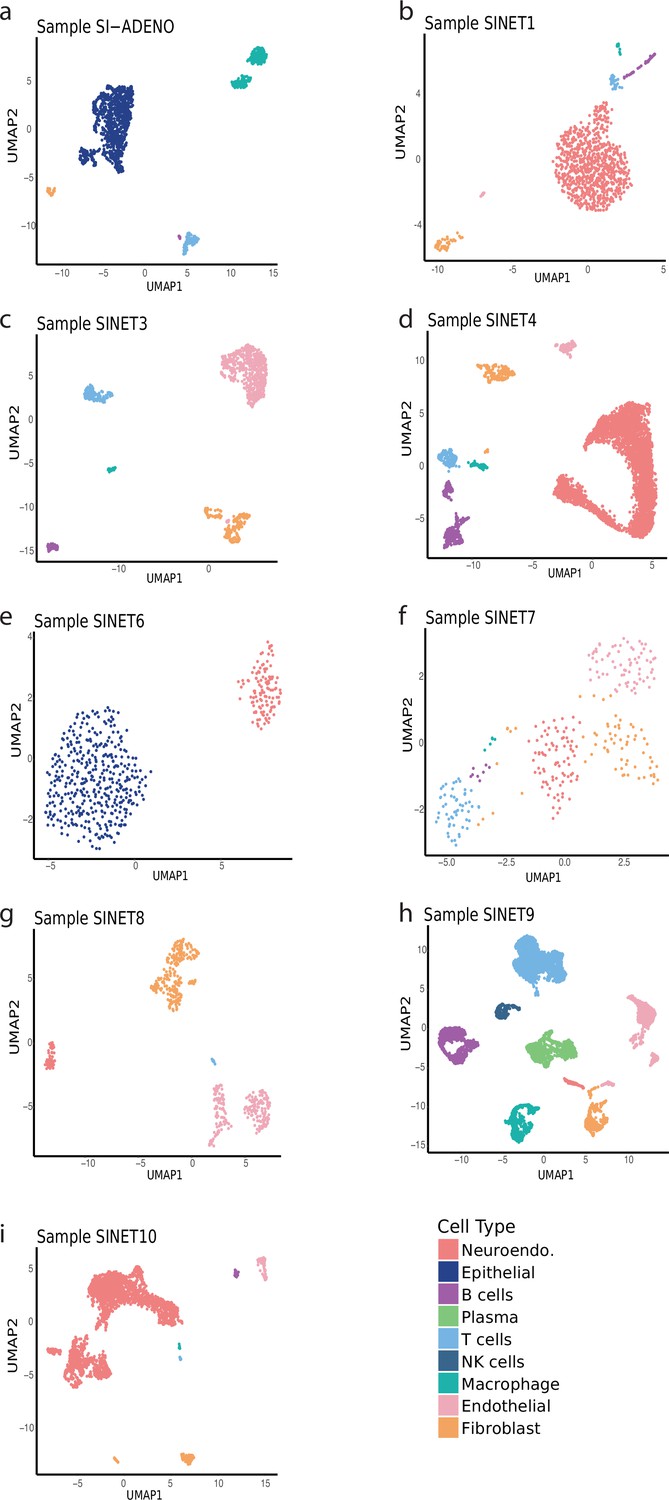
Cellular composition of small intestine neuroendocrine tumors (SiNETs) as determined by single-cell and single-nuclei sequencing.
(A–I) UMAP plots showing the diversity of single cells from each sample, colored by their clustering.
Figure 2 with 1 supplement
Small intestine neuroendocrine tumors (SiNETs) broadly classify into two major subtypes.
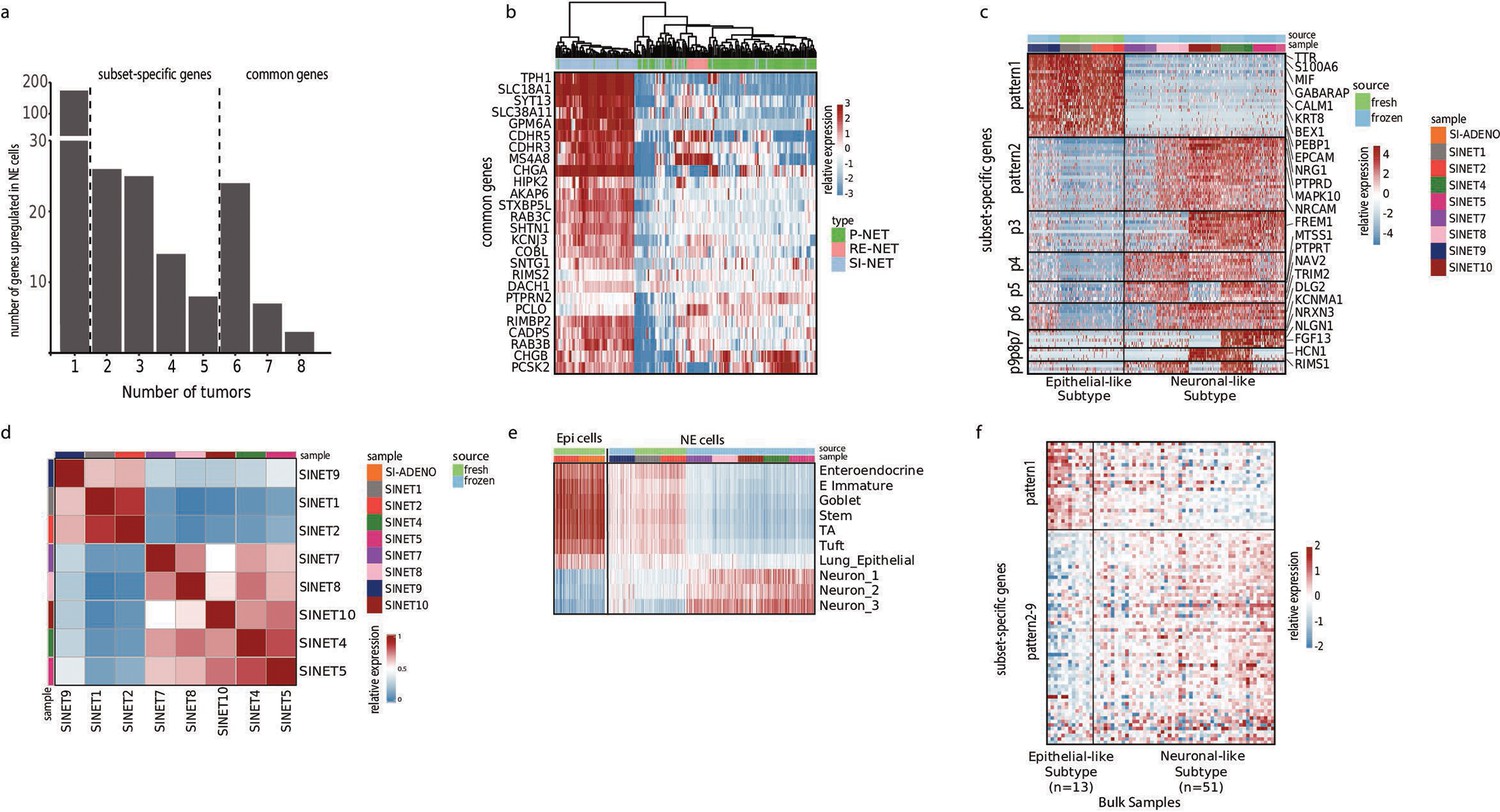
(A) Bar plot showing the number of upregulated genes against a common threshold, number of genes (y-axis) vs number of tumors (x-axis). (B) Heat map showing a list of 25 representative genes that define SiNET signature of our single-nuclei RNA sequencing (scRNA-seq) cohort used to cluster neuroendocrine tumor (NET) samples from a bulk-seq dataset (Alvarez et al., 2018). Type of NET is color-coded on the top panel, with P-NET and RE-NET referring to pancreatic and rectal NETs. (C) Heatmap representing clustering of SiNET samples in our cohort based on genes that were differentially expressed and shared between 2–5 samples, showing two major variable gene programs. (D) Correlation heat map between the NET samples. (E) Heatmap showing average expression of epithelial and neuronal gene sets (rows) in the neuroendocrine and epithelial cells from our SiNET samples (columns). Epithelial gene sets include signatures of multiple cell types from the small intestine (Haber et al., 2017), and neuronal gene sets include three clusters of neurons (Mahalingam et al., 2020). (F) Heatmap of the SiNET-dominated cluster from the bulk dataset (Alvarez et al., 2018) was subjected to differential expression analysis using the same set of genes as (C).
Figure 2—figure supplement 1

Specific upregulated genes expressed in neuroendocrine cells per small intestine neuroendocrine tumor (SiNET) sample.
Figure 3 with 1 supplement
Heterogeneity in the small intestine neuroendocrine tumor (SiNET) microenvironment.
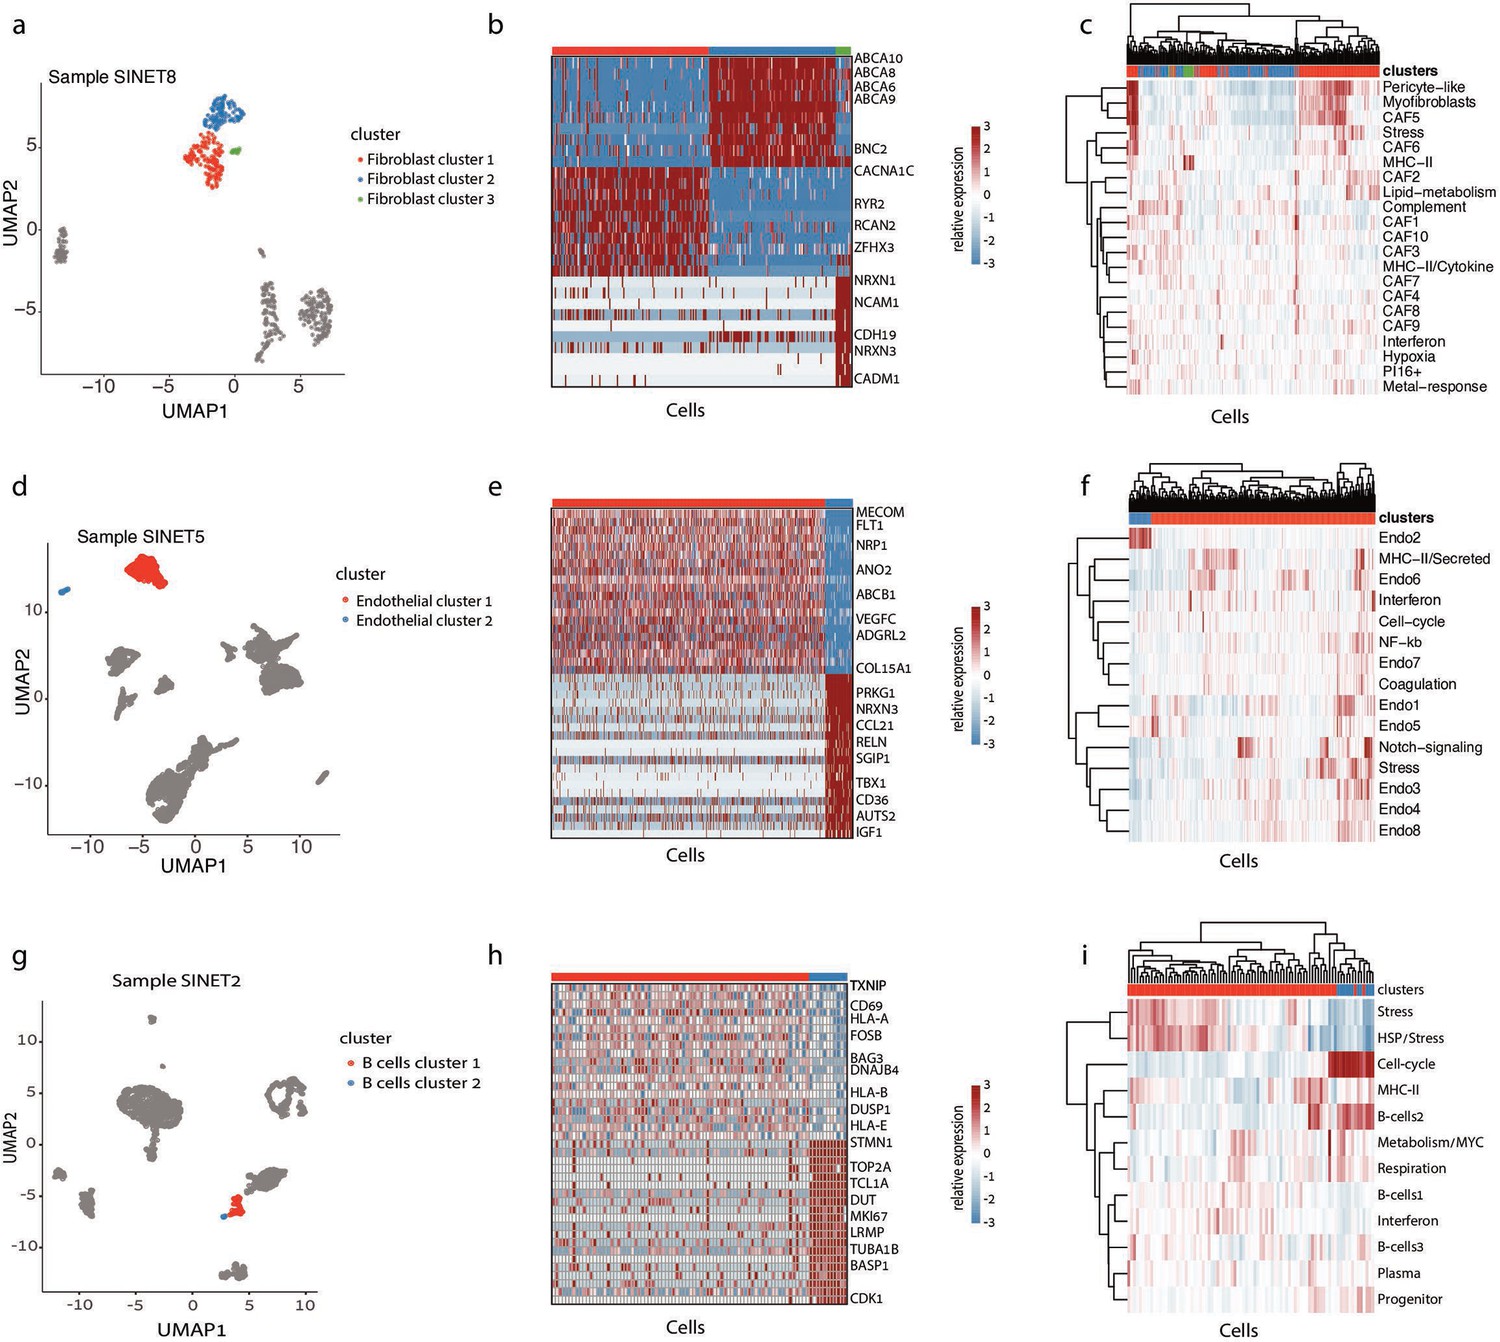
For each of the three non-malignant cell types, the diversity of that cell type is shown in one exemplary tumor: fibroblast heterogeneity in SiNET8 is shown in (A–C), endothelial cell heterogeneity in SiNET5 is shown in (D–F), and B-cell heterogeneity in SiNET2 is shown in (G–I). For each cell type, three panels depict three types of analyses. The first panel (A, D, G) is a UMAP plot of the respective tumor, where only the respective cell type is colored, and distinct colors highlight the clusters of that cell type. The second panel (B, E, H) shows differential expression analysis between the first two clusters using heatmaps, with labeling of selected genes. The third panel (C, F, I) shows clustering of cells from that cell type (columns) based on their relative expression of previously defined (Gavish et al., 2023) signatures of diversity in that cell type (rows); the top panel shows assignment of cells to clusters.
Figure 3—figure supplement 1
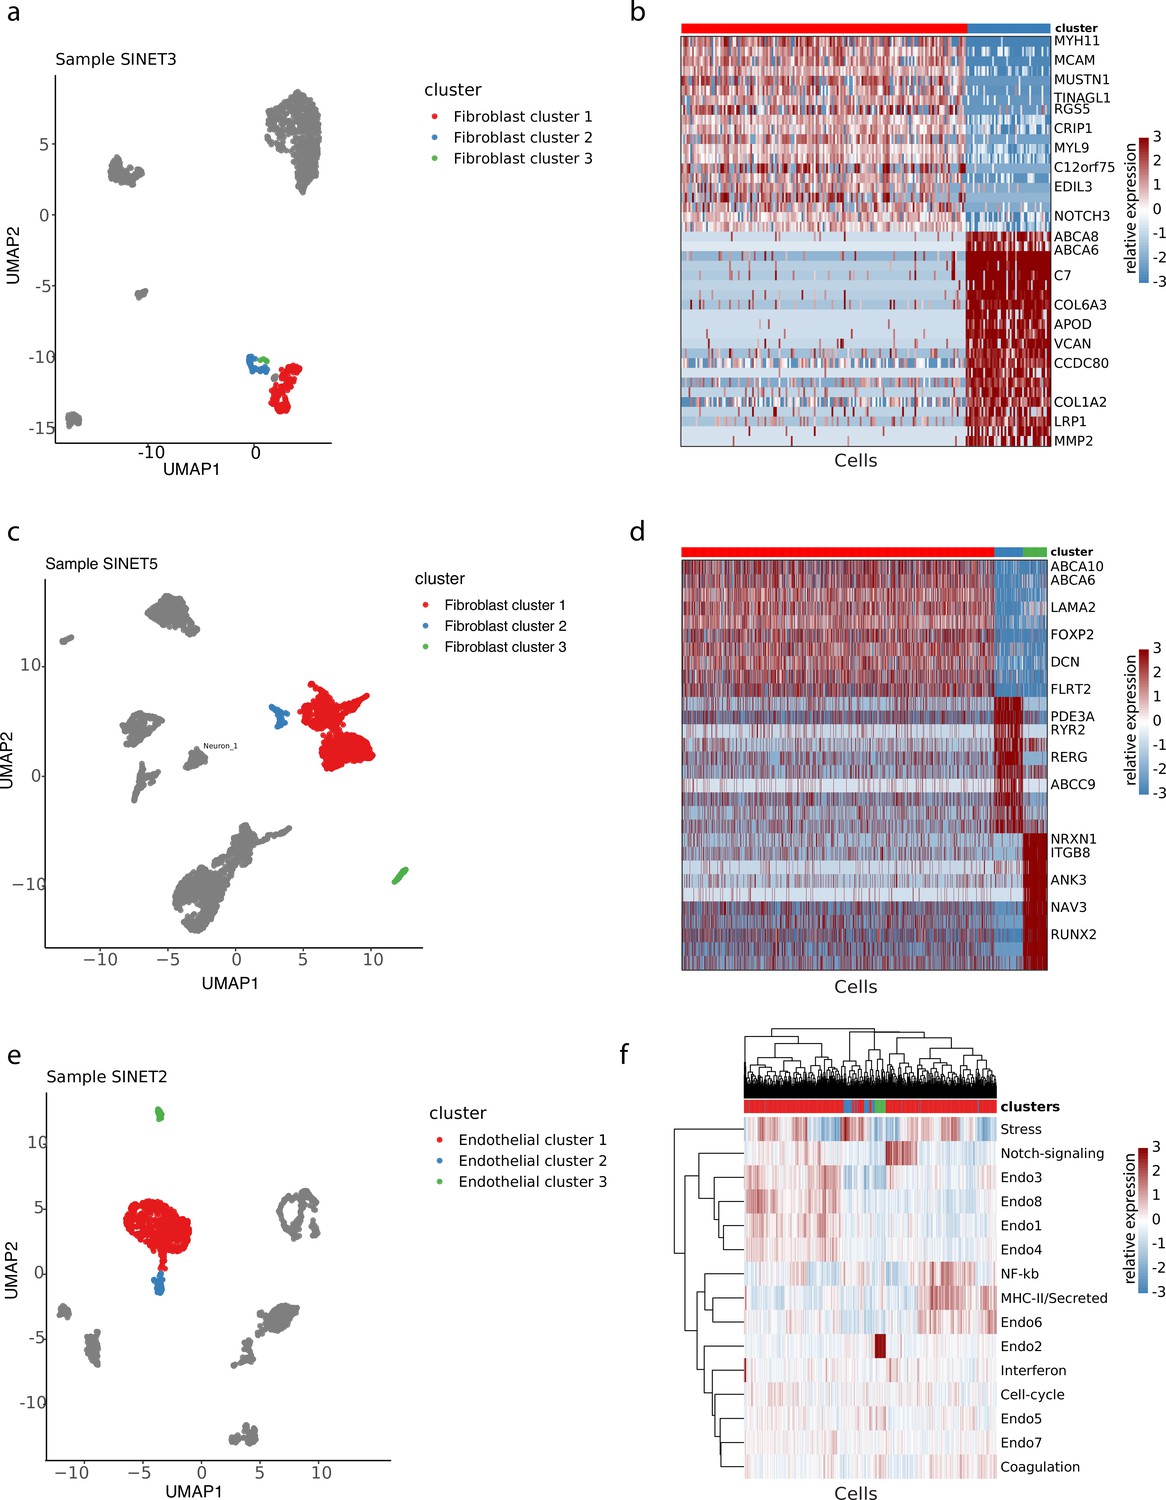
Heterogeneity in the small intestine neuroendocrine tumor (SiNET) microenvironment.
For each of three non-malignant cell types, the diversity of that cell type is shown in one exemplary tumor: fibroblast heterogeneity in SiNET3 is shown in (A, B), fibroblast cell heterogeneity in SiNET5 is shown in (C, D), and endothelial heterogeneity in SiNET2 is shown in (E, F). For each cell type, panels depict types of analyses. The first panel (A, C, E) is a UMAP plot of the respective tumor, where only the respective cell type is colored, and distinct colors highlight the clusters of that cell type. The second panel (B, D) shows differential expression analysis between the first two clusters using a heatmap, with labeling of selected genes. The third panel (F) shows clustering of cells from that cell type (columns) based on their relative expression of previously defined (Haber et al., 2017) signatures of diversity in that cell type (rows); the top panel shows assignment of cells to clusters.
Figure 4 with 2 supplements
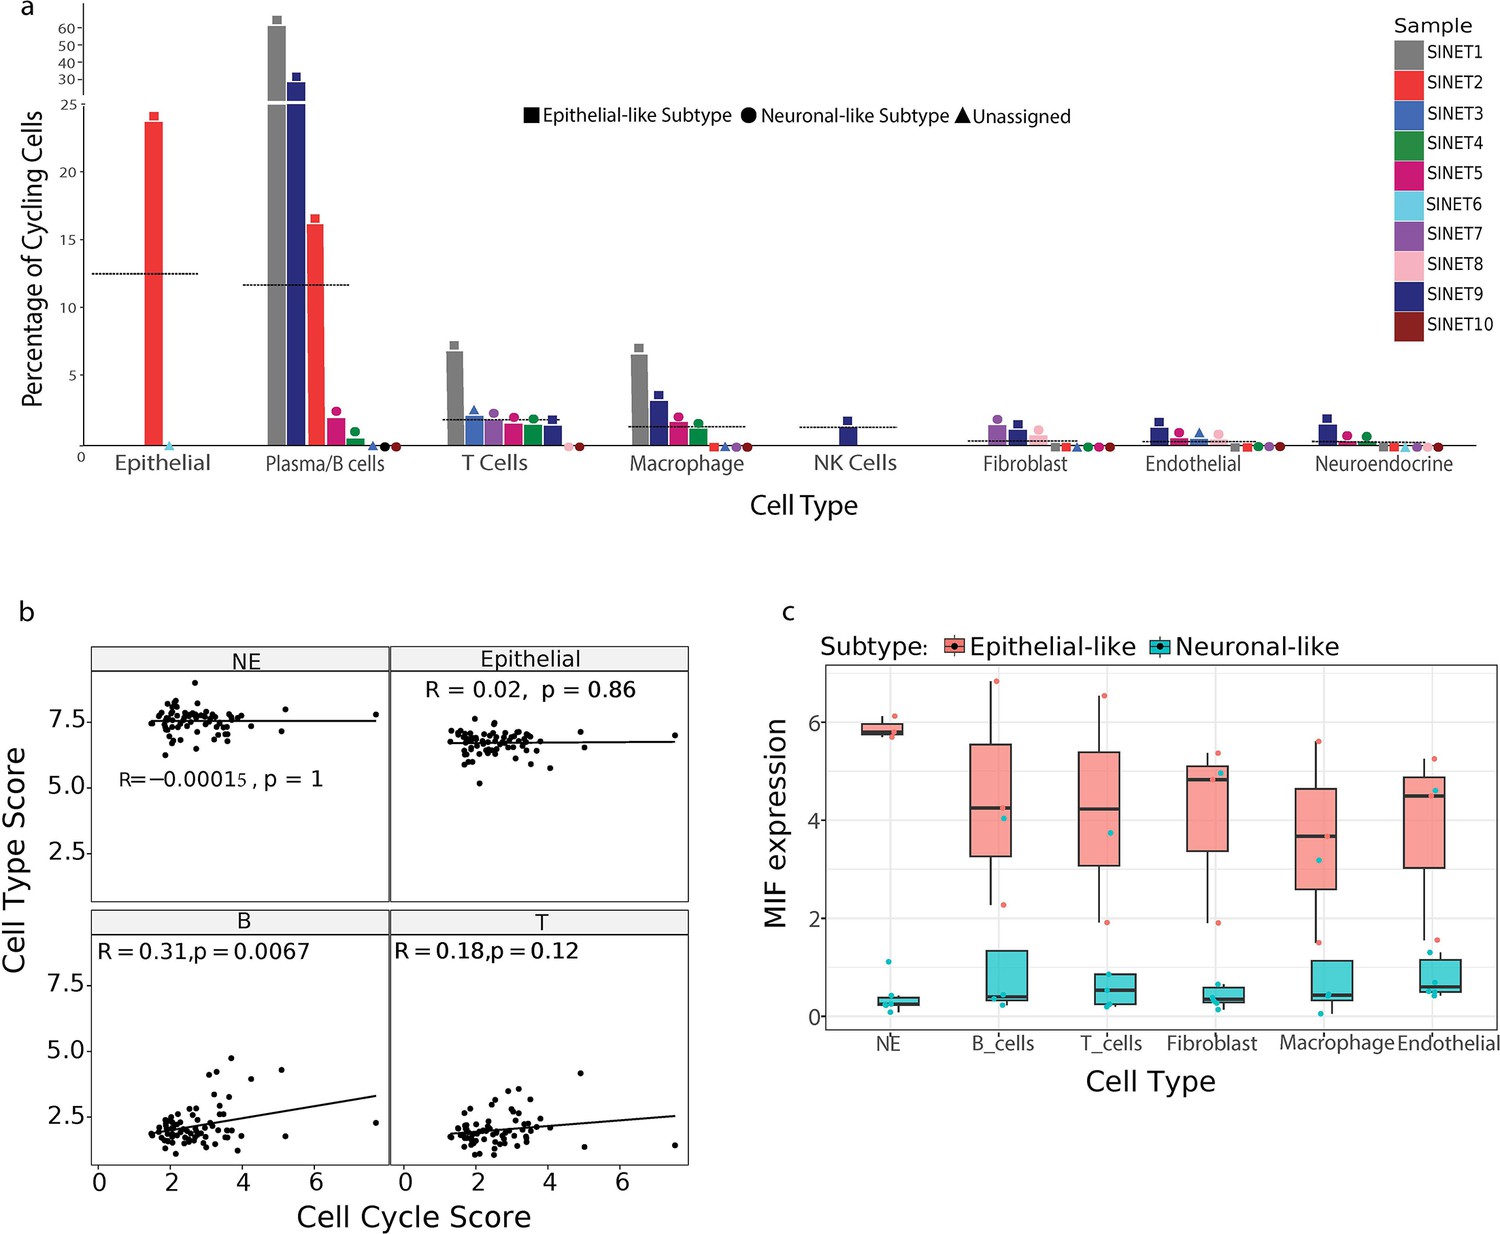
Cell cycle analysis reveals proliferating B cells in small intestine neuroendocrine tumors (SiNETs).
(A) Bars show the percentage of cycling cells (y-axis) per cell type and per tumor (x-axis). Tumors are color-coded, the two subtypes, epithelial-like and neuronal-like, are differentiated by distinct shapes, represented as square and circle, respectively. Information regarding the presence of cell types with zero percentage of cycling cells is provided along the x-axis. Horizontal lines indicate average percentages of cycling cells per cell type. (B) Correlation between cell type and cell-cycle program as computed from an SiNET bulk RNA-seq dataset (Alvarez et al., 2018). Score for each cell type is represented at the top of individual panels. (C) Boxplot depicting the expression of migration inhibitory factor (MIF) in each SiNET cell type, for each of the two SiNET subtypes.
Figure 4—figure supplement 1
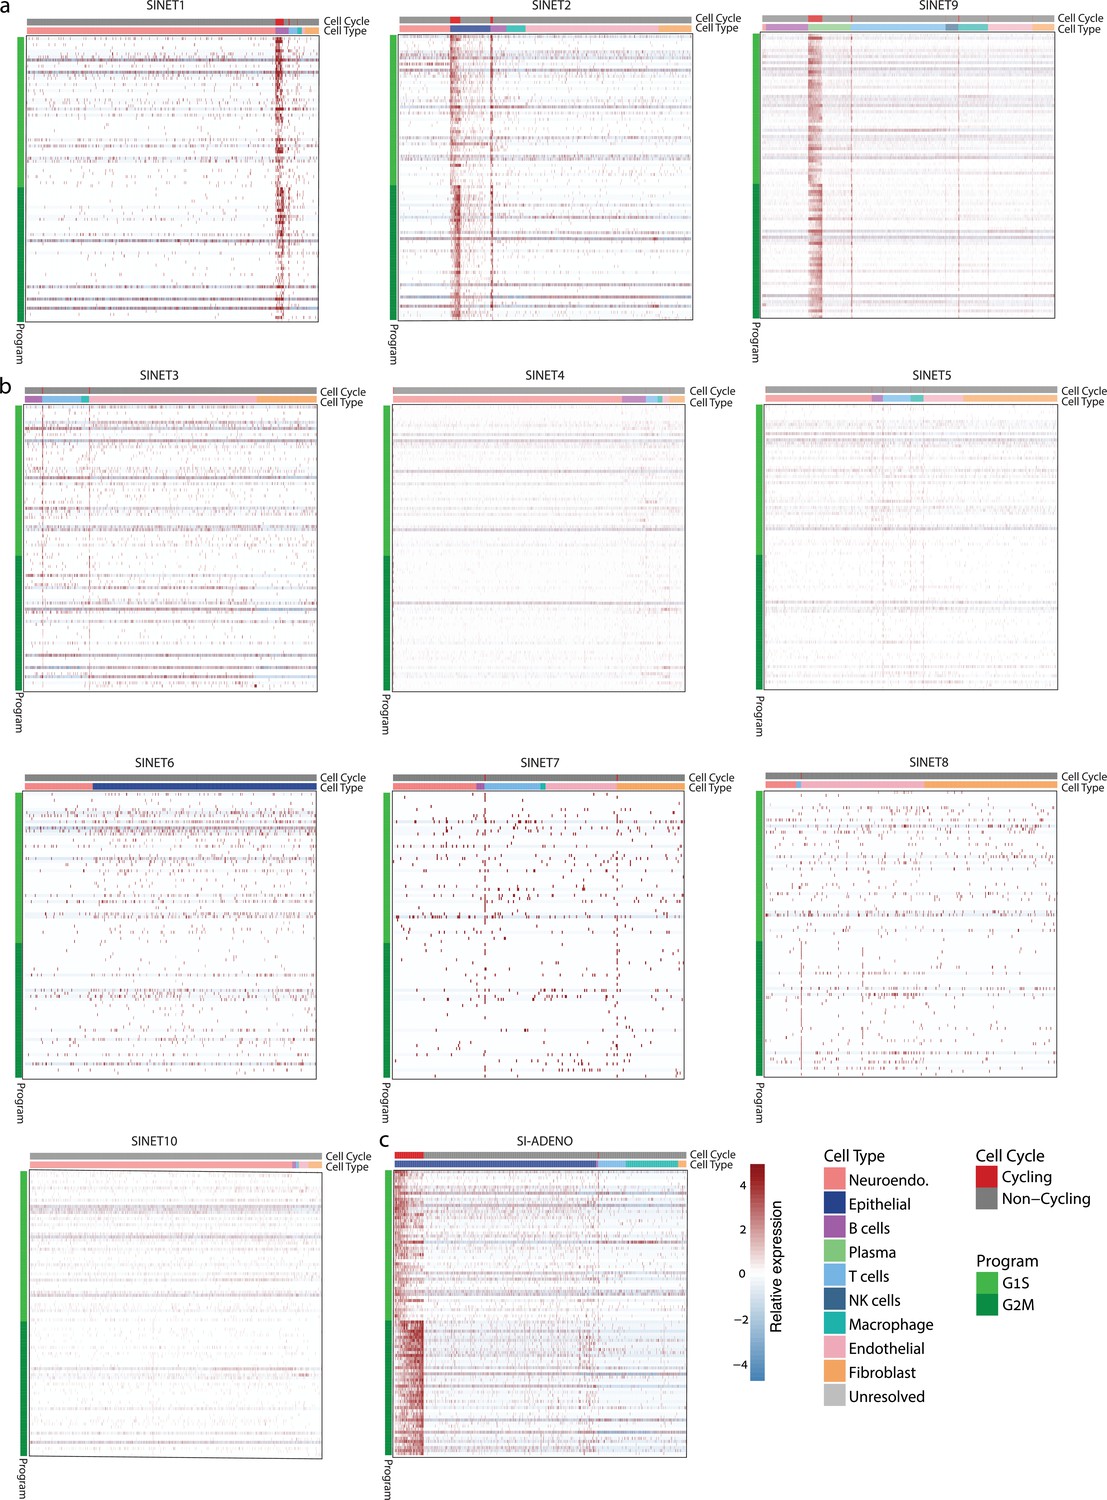
Heat map illustrating the expression of G1/S and G2/M genes across various cell types in the Epithelial-like Subtype (A), Neuronal-like Subtype (B) and the siAdeno sample (C).
The annotated cell types include epithelial cells, macrophages, T cells, and fibroblasts that were sampled for illustrative purposes.
Figure 4—figure supplement 2
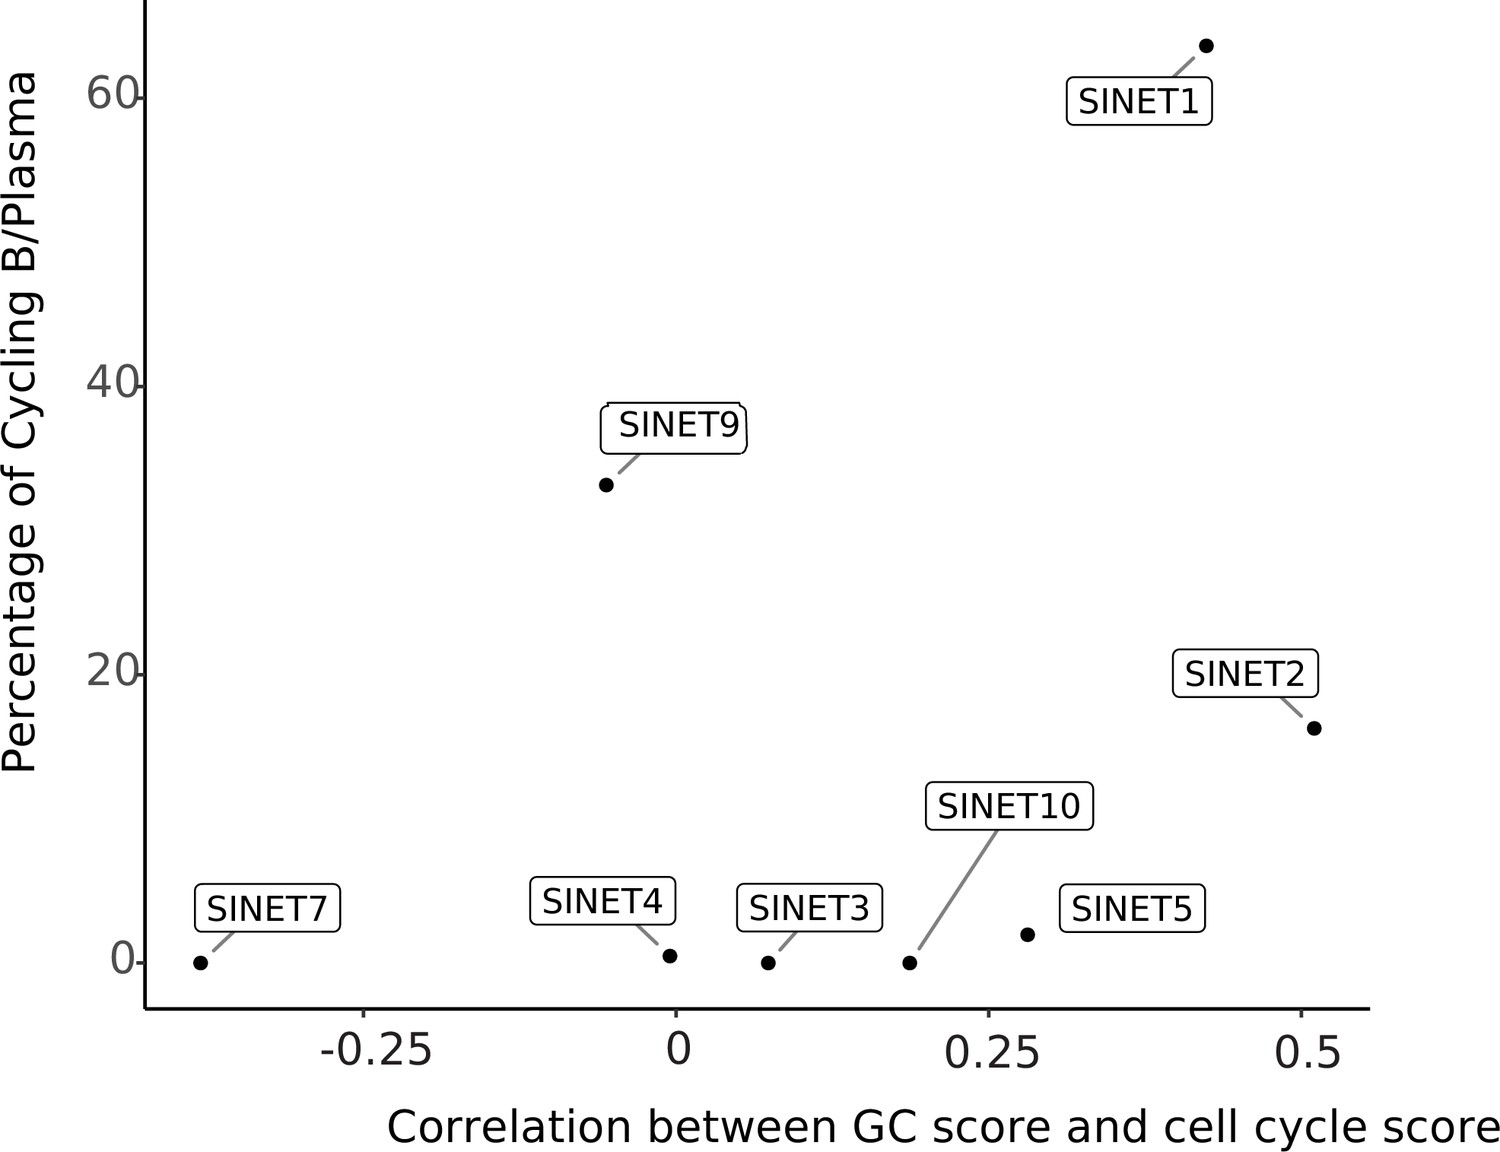
Scatter plot illustrates the percentage of cycling B/Plasma cells and the correlation between the germinal center signature and cycling B/Plasma cells signature.
In SiNET1 and SiNET2, we observe high correlation between cell cycle and germinal centers (GC) score, but not in SiNET9.
Figure 5
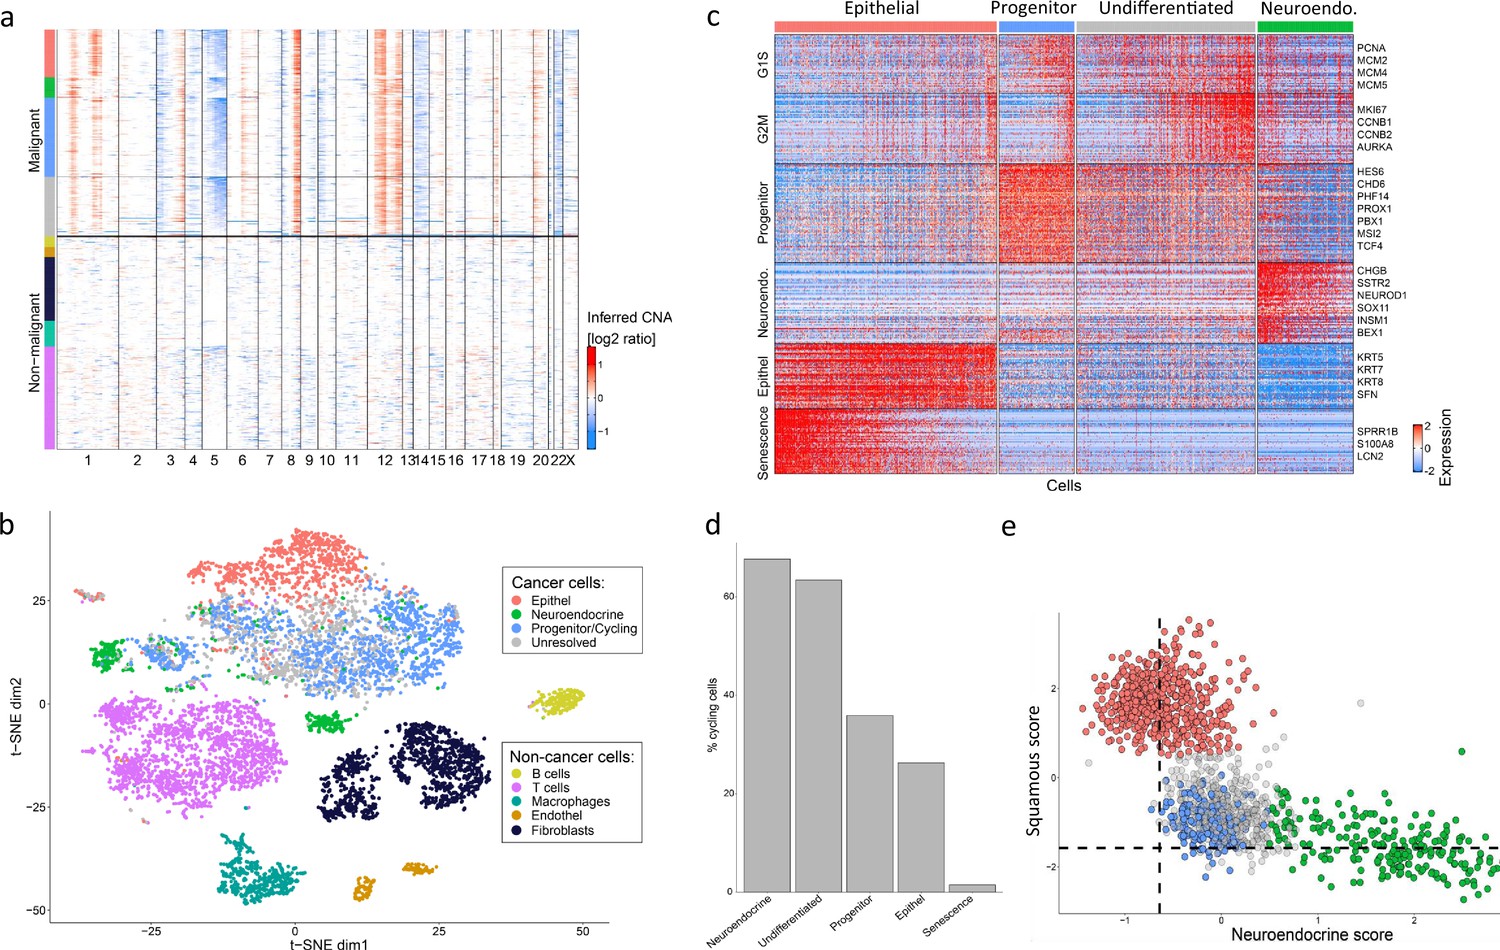
A putative progenitor population in mixed Large Cell Neuroendocrine Carcinoma (LCNEC).
(A) Copy number variation (CNV) profiles inferred from single-nuclei RNA sequencing (scRNA-seq) data for all cells from the LCNEC sample. Malignant and non-malignant cells are annotated based on their CNV profiles, using the same color codes as in the next panels. (B) tSNE plot showing the diversity of single cells from the mixed lung tumor, colored by their clustering. (C) Heatmap shows relative expression of differentially expressed genes (rows), separated by horizontal lines into programs that distinguish between the four populations of cells detected in the LCNEC sample. Also included are two cell cycle programs (G1/S and G2/M). Columns correspond to malignant cells, separated into the four populations by vertical lines and as indicated by color at the top. Selected genes are labeled for each program. (D) Bars show the percentage of cycling cells in each malignant cluster. (E) Malignant cells scored against an epithelial vs. neuroendocrine program (gene set), colored by their assignment into four populations.
Additional files
-
Supplementary file 1
Table of patient samples analyzed and their clinical characteristics.
- https://cdn.elifesciences.org/articles/101153/elife-101153-supp1-v1.xlsx
-
Supplementary file 2
Table of cell type markers used to annotate clusters of cells.
- https://cdn.elifesciences.org/articles/101153/elife-101153-supp2-v1.xlsx
-
Supplementary file 3
Tables listing the genes upregulated in neuroendocrine cells (compared to other cells in the same tumors), divided into those commonly found as upregulated across most SiNETs, those found only in a subset and those found in a specific tumor.
- https://cdn.elifesciences.org/articles/101153/elife-101153-supp3-v1.xlsx
-
Supplementary file 4
Table per cell type, listing the differentially expressed genes of that cell type between the two small intestine neuroendocrine tumor (SiNET) subsets (Epithelial-like and Neuronal-like, abbreviated as EPI and NEU).
Only genes with at least sixfold differential expression are listed. For each of those genes, log2-fold change, t-test p-value, and FDR-adjusted p-values are listed, and genes with unadjusted p-value below 0.05 were considered as significant and marked in red. An additional table lists the genes which were found as differentially expressed (between SiNET subsets) in all of the cell types.
- https://cdn.elifesciences.org/articles/101153/elife-101153-supp4-v1.xlsx
-
Supplementary file 5
Table of gene signatures for malignant subpopulations identified in a sample of Large Cell Neuroendocrine Carcinoma (LCNEC) mixed with squamous cell carcinoma.
- https://cdn.elifesciences.org/articles/101153/elife-101153-supp5-v1.xlsx
-
MDAR checklist
- https://cdn.elifesciences.org/articles/101153/elife-101153-mdarchecklist1-v1.pdf
Download links
A two-part list of links to download the article, or parts of the article, in various formats.
Downloads (link to download the article as PDF)
Open citations (links to open the citations from this article in various online reference manager services)
Cite this article (links to download the citations from this article in formats compatible with various reference manager tools)
Subtypes and proliferation patterns of small intestine neuroendocrine tumors revealed by single-cell RNA sequencing
eLife 13:RP101153.
https://doi.org/10.7554/eLife.101153.3


