Effects of experiencing the COVID-19 pandemic on optimistically biased belief updating
- Control-interception-attention team, Paris Brain Institute (ICM), UMR 7225, U1127, Institut National de la Santé et de la Recherche Médicale/Centre National de la Recherche Scientifique/Sorbonne Universités, Hôpital Pitié-Salpêtrière, France
- Département de Psychiatrie Adulte, Hôpital Pitié-Salpêtrière, Assistance Publique Hôpitaux de Paris (APHP), France
Figures
Figure 1 with 2 supplements
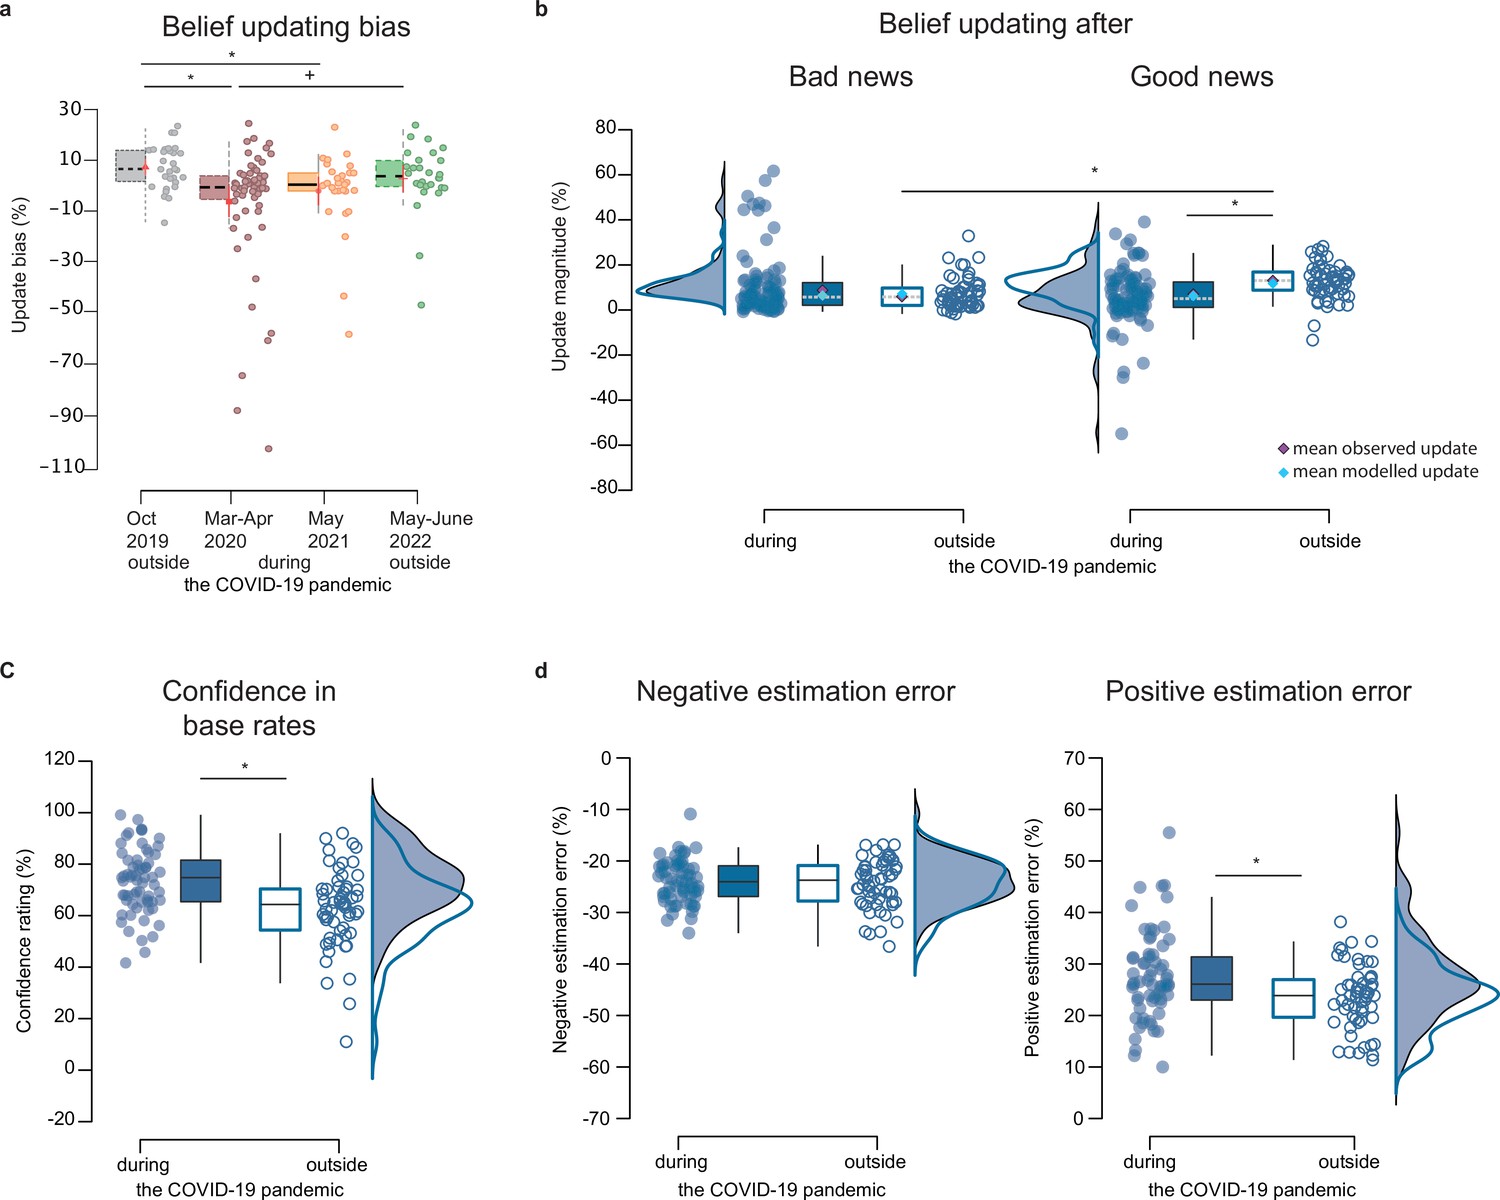
Behavioral results.
(a) Boxplots display the belief-updating bias (i.e. the difference between the belief update for good news and belief update for bad news) in each of the four participant groups, tested before the pandemic in October 2019 (n=30), during the first lockdown from March to April 2020 (n=34), with less restrictive measures in May 2021 (n=31), and at the end of the pandemic in June 2022 (n=28). (b) Belief updating for good and bad news during (n=65) and outside the pandemic (n=58). (c) Confidence ratings, and (d) estimation errors for bad and good news during and outside the pandemic. Boxplots in all panels display 95% confidence intervals, with boxes indicating the interquartile range from Q1 25th to Q3 75th percentile. The horizontal black lines indicate medians, and whiskers range from minimum to maximum values and span 1.5 times the interquartile range. The dots correspond to individual participants. The squares in the boxplots in (b) correspond to mean observed updates (purple) and mean modelled updates (blue; averaged across 1000 estimations) from the best-fitting models in each context, which were the optimistically biased RL-like model of belief updating outside and the rational Bayesian model of belief updating during the Covid-19 pandemic. The source data file provides exact values. *<0.05 two-sampled, two-tailed t-tests, * p<0.05 two-sampled, one-tailed t-tests.
-
Figure 1—source data 1
Average values across trials for each participant on behavioral outcome measures.
- https://cdn.elifesciences.org/articles/101157/elife-101157-fig1-data1-v1.xlsx
Figure 1—figure supplement 1
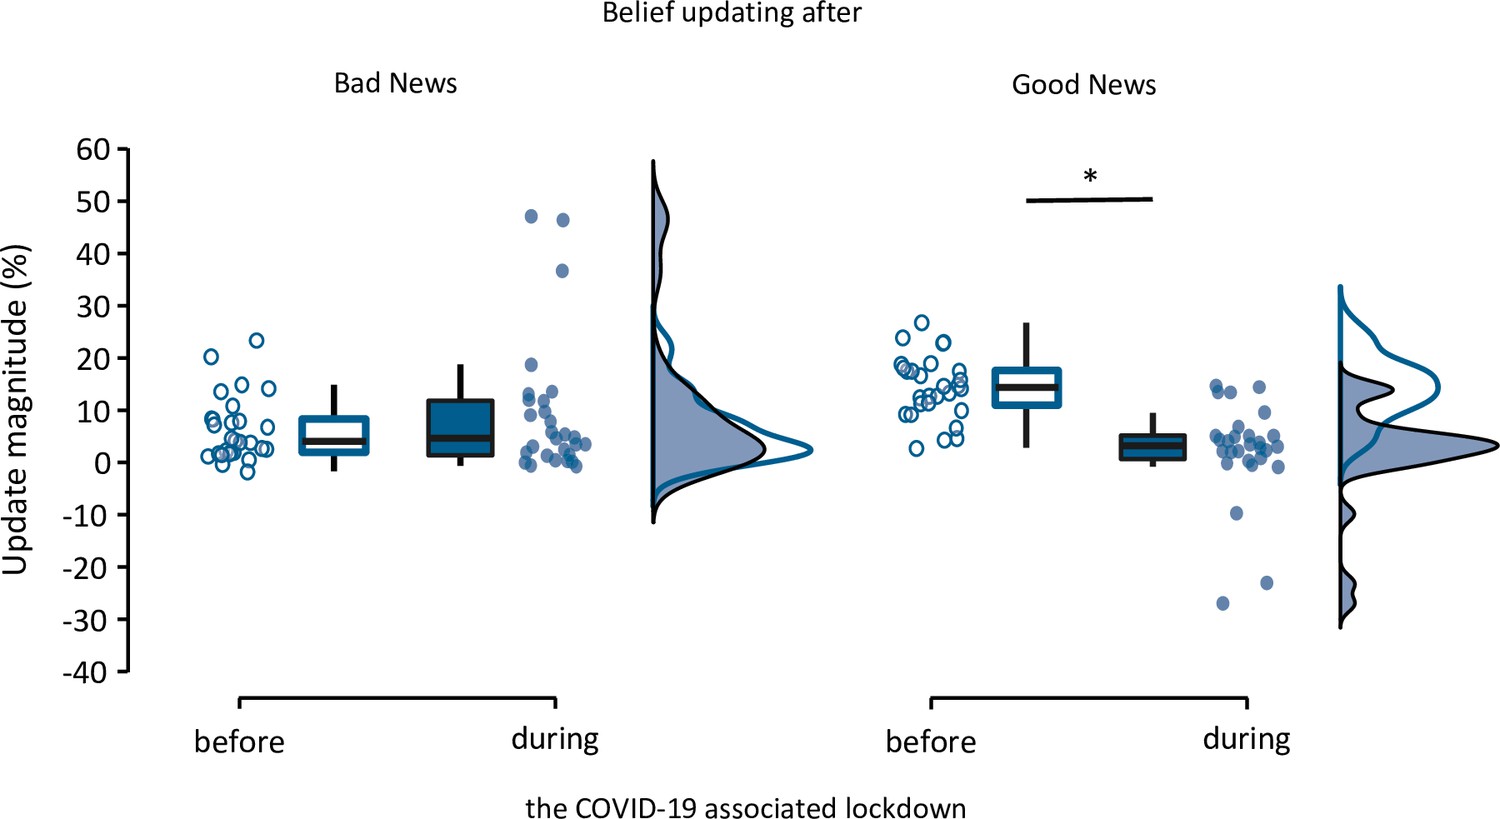
Belief updating within the same group of participants tested before and during the COVID-19 pandemic (n=28).
Boxplots display 95% confidence intervals for belief updating after bad (left panel) and good (right panel) news and during and outside the pandemic. Boxes indicate the interquartile range from Q1 25th to Q3 75th percentile. The horizontal black lines indicate medians and whiskers range from minimum to maximum values and span 1.5 times the interquartile range. The dots correspond to individual participants. The source data file provides exact p-values. *p < 0.05 two-sampled, two-tailed t-tests.
-
Figure 1—figure supplement 1—source data 1
Average belief update across trials for each participant tested both before and during the pandemic (within-subjects).
- https://cdn.elifesciences.org/articles/101157/elife-101157-fig1-figsupp1-data1-v1.xlsx
Figure 1—figure supplement 2
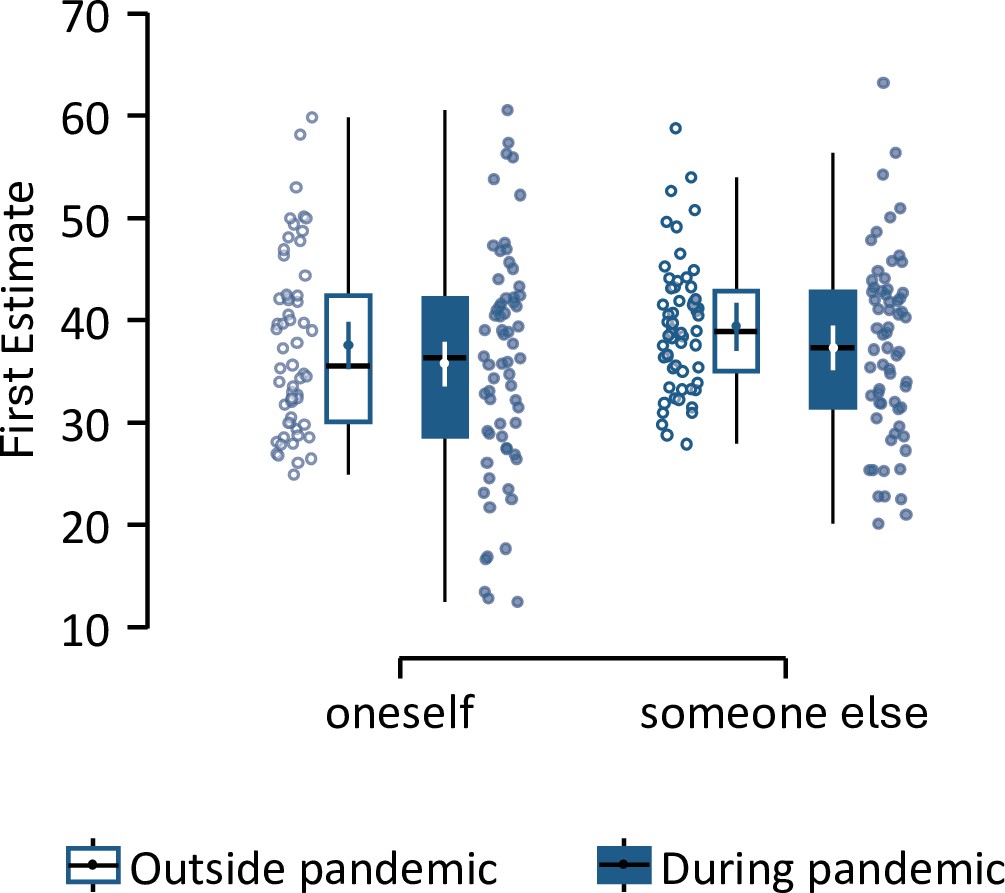
Optimism bias in initial beliefs about adverse future life events.
First estimates of the likelihood of and adverse life event happening to oneself (left) or someone else (right) and before (n=58) and during (n=65) the COVID-19 pandemic. Boxplots display 95% confidence intervals with boxes indicating the interquartile range from Q1 25th to Q3 75th percentile. The horizontal black lines indicate medians and whiskers range from minimum to maximum values and span 1.5 times the interquartile range. The individual dot and vertical line in the middle correspond to the means and standard errors. The contiguous dots correspond to individual participants.
-
Figure 1—figure supplement 2—source data 1
Average first estimate across trials for each participant.
- https://cdn.elifesciences.org/articles/101157/elife-101157-fig1-figsupp2-data1-v1.xlsx
Figure 2 with 3 supplements
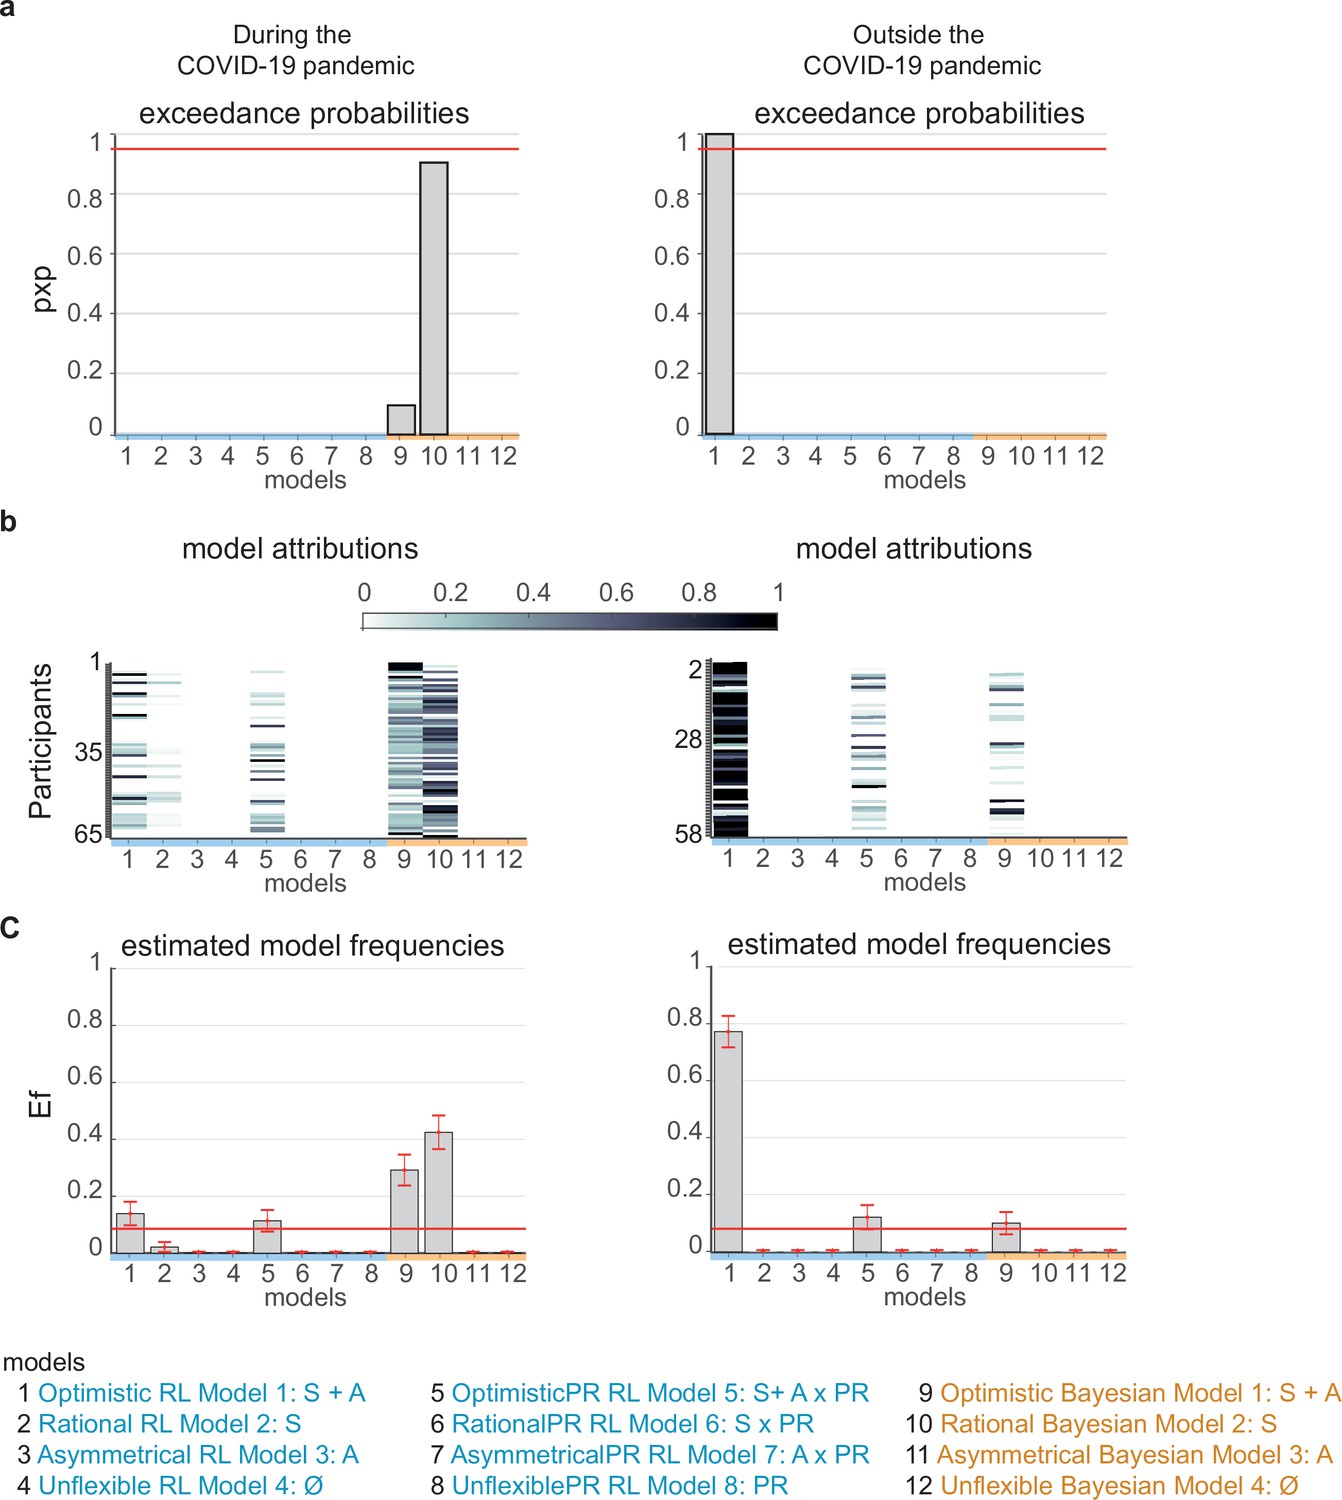
Computational model comparisons.
Twelve alternative models from RL-like (blue) and Bayesian (orange) updating model families were fitted to observed belief updates for participants tested during the COVID-19 pandemic (left panel columns) and outside the pandemic (right column panels). (a) Protected exceedance probabilities for each of the 12 alternative models, which is the probability that the model predominates in the population above and beyond chance. (b) Posterior model attributions. Colored cells display the probability that individual participants (y-axis) will be best explained by a model version (x-axis). (c) Estimated model frequencies correspond to how many participants are expected to be best described by a model version, with error bars corresponding to standard deviations. The red line indicates the null hypothesis that all model versions are equally likely in the cohort (chance level). Labels on the x-axis of the histogram and bar graphs indicate the model versions with non-silenced parameters (S – scaling, A – asymmetry) and PR – personal relevance of events. The source data file provides exact values.
-
Figure 2—source data 1
Model comparison metrics.
- https://cdn.elifesciences.org/articles/101157/elife-101157-fig2-data1-v1.xlsx
Figure 2—figure supplement 1
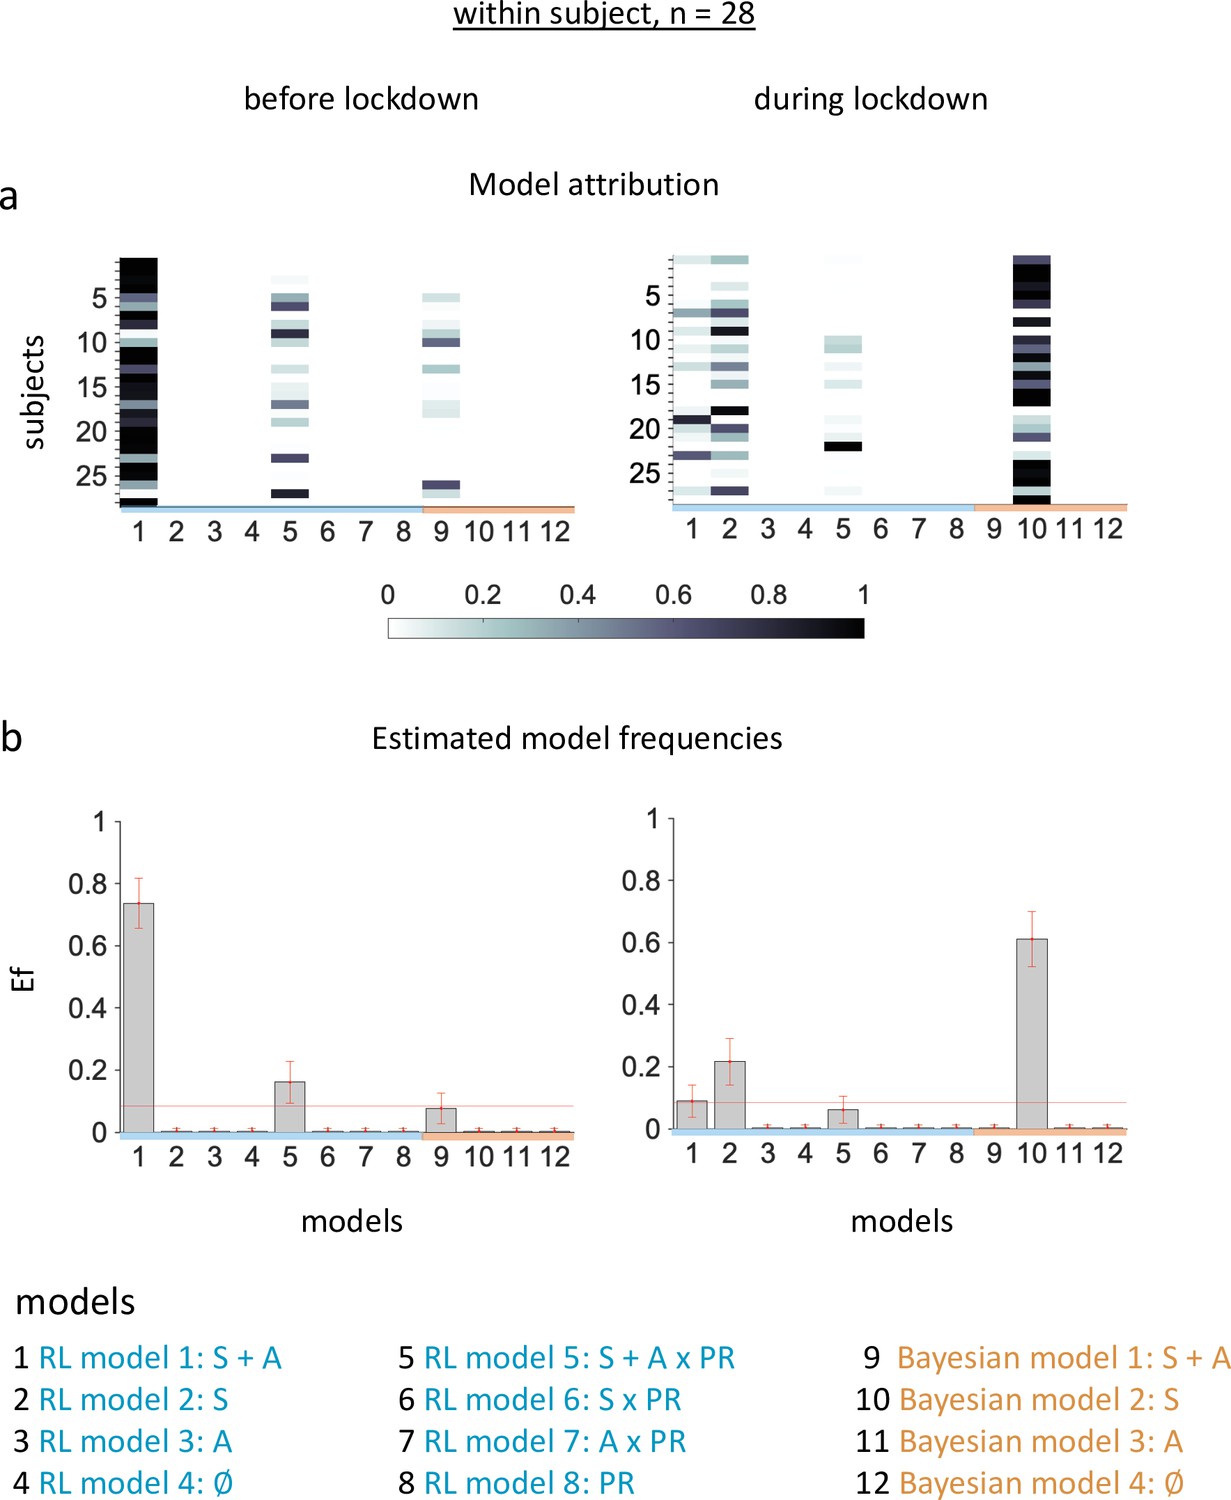
Estimated model frequencies for participants tested both before and during the COVID-19 pandemic.
(a) Posterior model attributions. Colored cells display the probability that individual participants (y-axis) will be best explained by a model version (x-axis). (b) Estimated model frequencies. The histograms display average posterior model frequencies that reflect how many participants are expected to be best described by a model version, with error bars corresponding to standard deviations. The red line indicates the null hypothesis that all model versions are equally likely in the cohort (chance level). Labels on the x-axis of the histograms indicate the model versions with non-silenced parameters (S – scaling, A–asymmetry), and PR – personal relevance factor.
-
Figure 2—figure supplement 1—source data 1
Model comparison metrics for the within-subjects analysis.
- https://cdn.elifesciences.org/articles/101157/elife-101157-fig2-figsupp1-data1-v1.xlsx
Figure 2—figure supplement 2
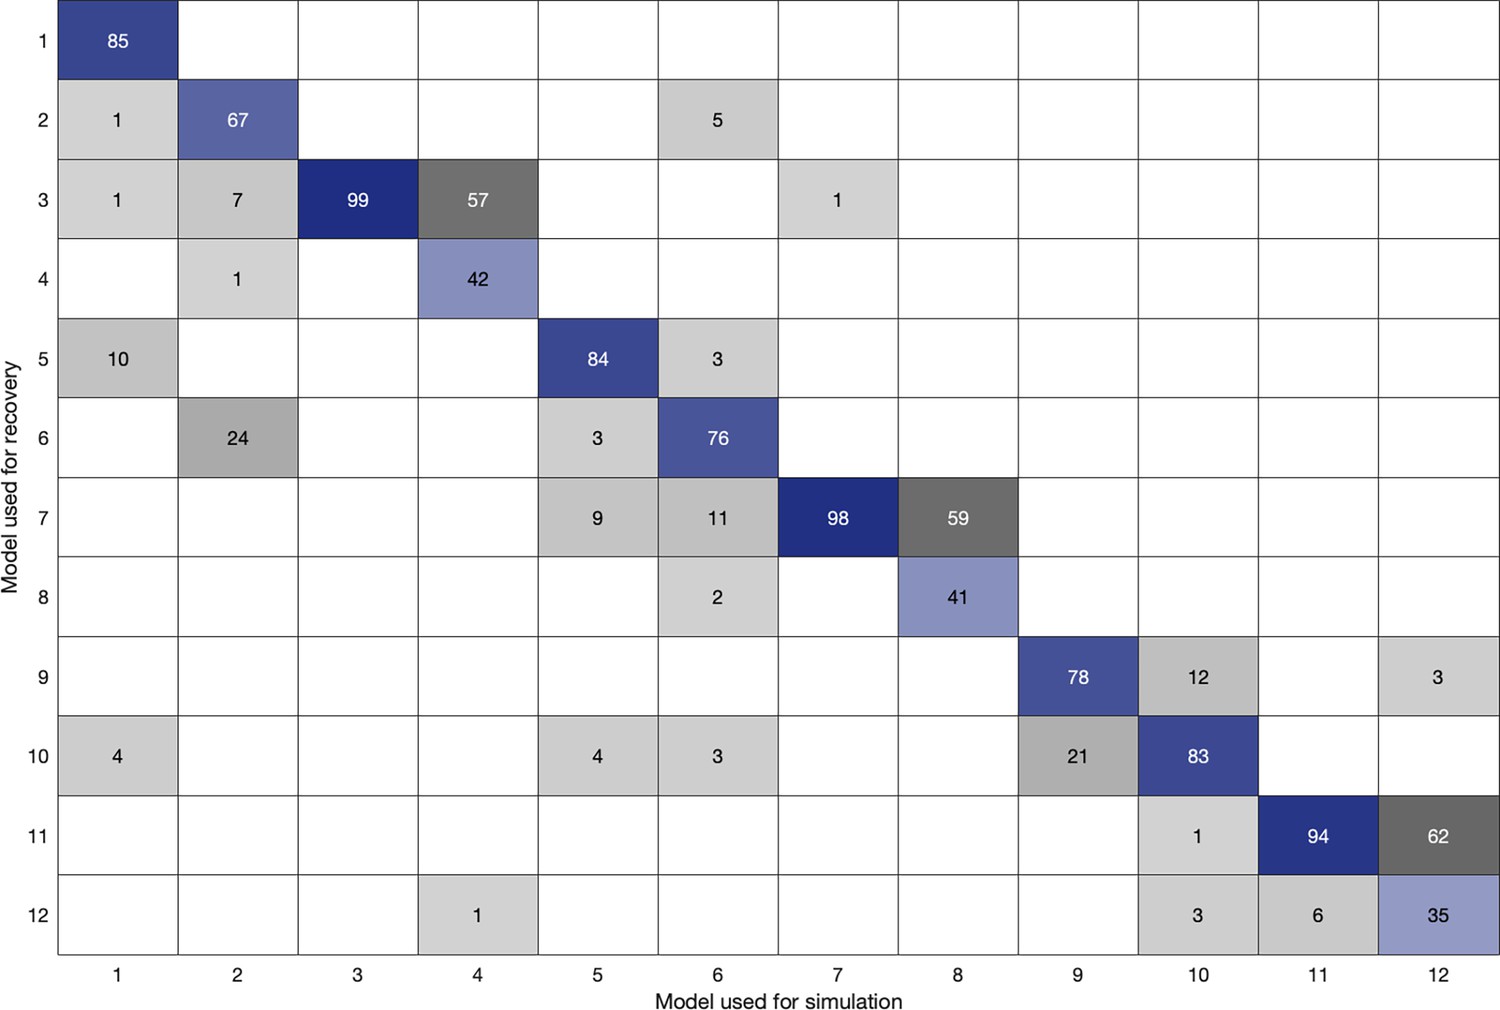
Model recovery confusion matrix.
The matrix displays the estimated model frequencies from the model recovery analysis. Each column represents the generative model used to simulate behavioral data, while each row indicates the model used to recover data during the fitting procedure. Higher values along the diagonal (blue) indicate successful recovery, confirming that each model can be reliably distinguished from the others. Off-diagonal values (gray) reflect potential misattributions.
-
Figure 2—figure supplement 2—source data 1
Estimated model frequencies from the model recovery analysis.
- https://cdn.elifesciences.org/articles/101157/elife-101157-fig2-figsupp2-data1-v1.xlsx
Figure 2—figure supplement 3
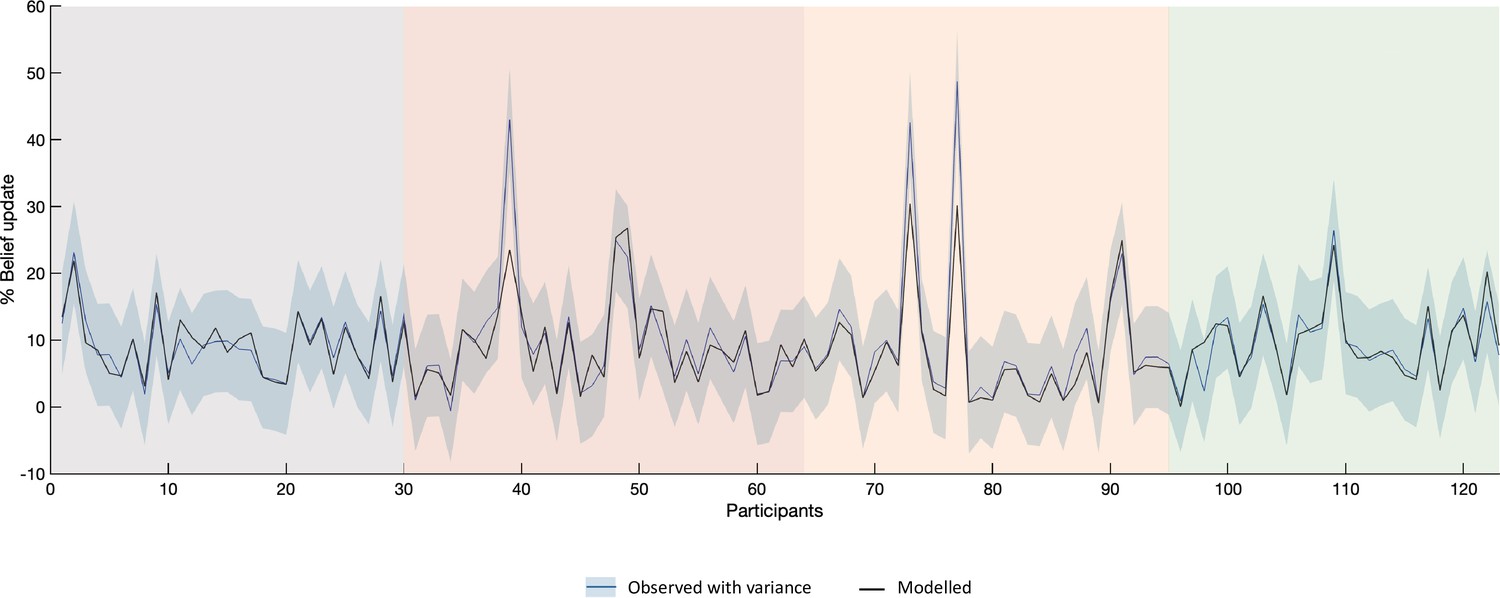
Observed and modelled belief updating for the whole participant sample (n=123).
This figure illustrates the percentage of belief update for each participant (blue line) and the estimated belief update (black line) from the overall best fitting optimistically biased RL-like model of belief updating. The shaded blue area reflects the variance in observed data. The colored background highlights the four groups of participants tested in different contexts – before the COVID-19 pandemic (gray), during the 1st lockdown (red), at time of last lockdown release (beige), and one year later (green).
-
Figure 2—figure supplement 3—source data 1
Average observed and modelled belief update across trials for each participant.
- https://cdn.elifesciences.org/articles/101157/elife-101157-fig2-figsupp3-data1-v1.xlsx
Figure 3 with 1 supplement
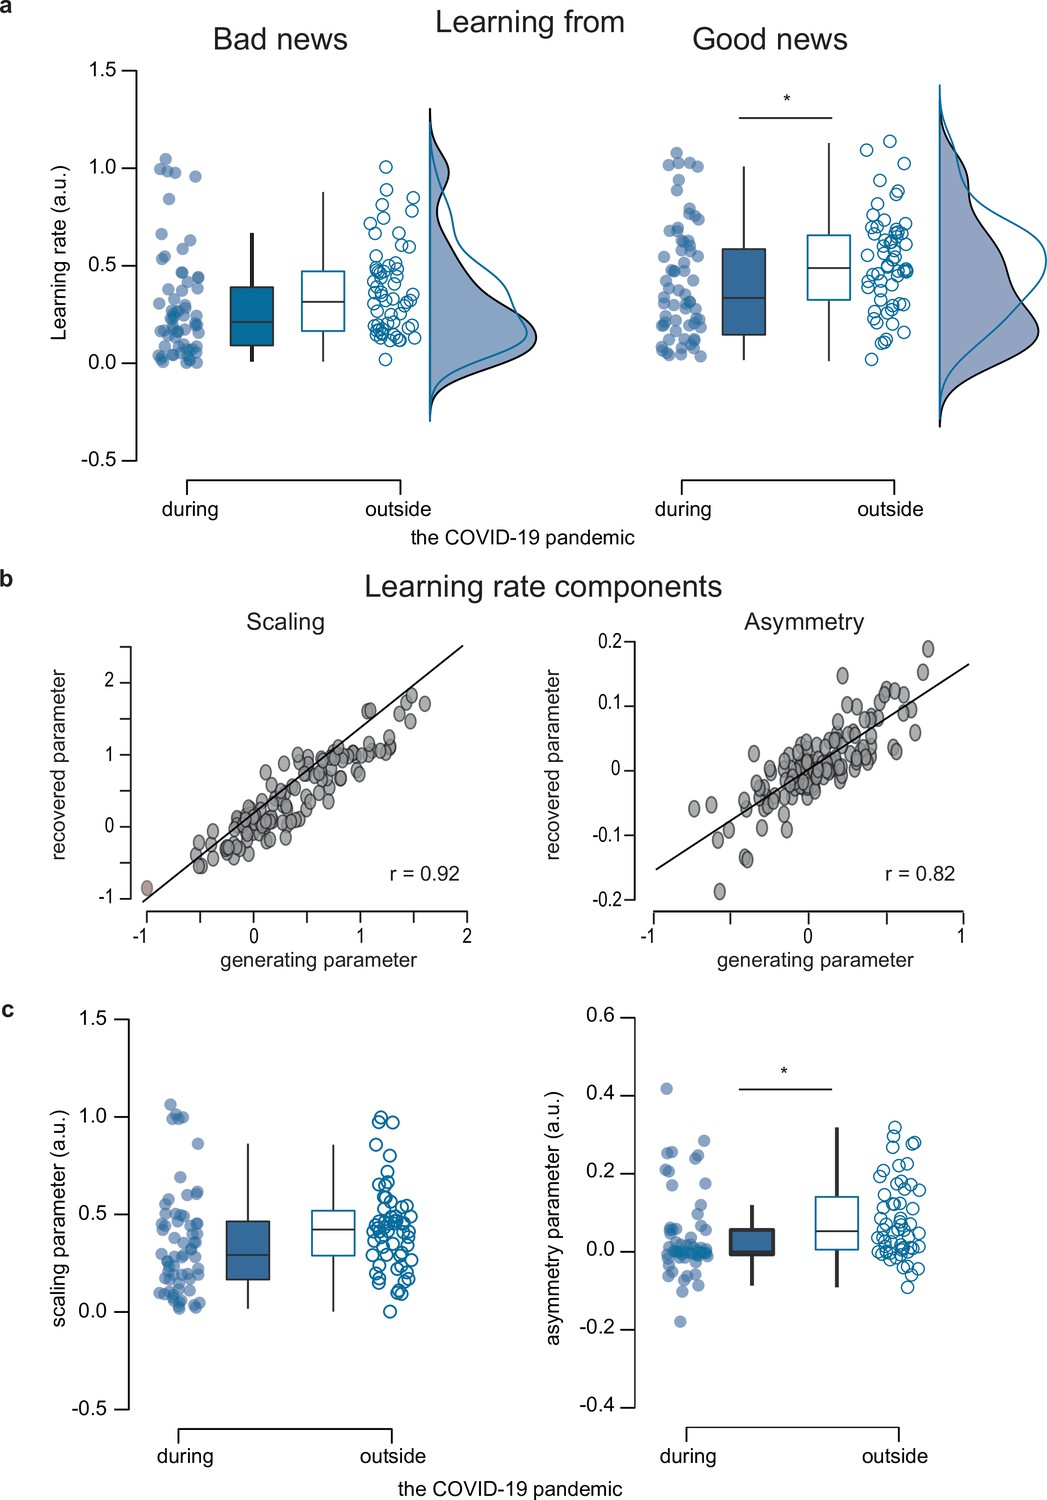
Parameter comparisons between participants tested during (n=65) and outside (n=58) the COVID-19 pandemic.
(a) Learning rates. Boxplots display 95% confidence intervals for learning rates from the RL-like updating model that assumed updating is proportional to the estimation error with an asymmetry and a scaling learning rate component. (b) Parameter recovery for learning rate components of the overall best fitting Model 1 (n=123). Pearson’s correlation between generating and recovered parameters for scaling (left panel) and asymmetry (right panel) learning rate component. r –Pearson’s correlation coefficient against zero. Source data and exact p-values are provided as a Source Data file. (c) Group comparisons for scaling and asymmetry components. Boxplots display 95% confidence intervals for the learning rate’s scaling (left panel) and the asymmetry (right panel) component. Boxes in all boxplots correspond to the interquartile range from Q1 (25th percentile) to Q3 (75th percentile). The horizontal black lines indicate medians, and whiskers range from minimum to maximum values and span 1.5 times the interquartile range. The dots correspond to individual participants. *p<0.05. p-values were obtained with two-sampled, two-tailed t-tests between groups, and exact values are provided in the source data file.
-
Figure 3—source data 1
Computational model parameters per participant.
- https://cdn.elifesciences.org/articles/101157/elife-101157-fig3-data1-v1.xlsx
Figure 3—figure supplement 1
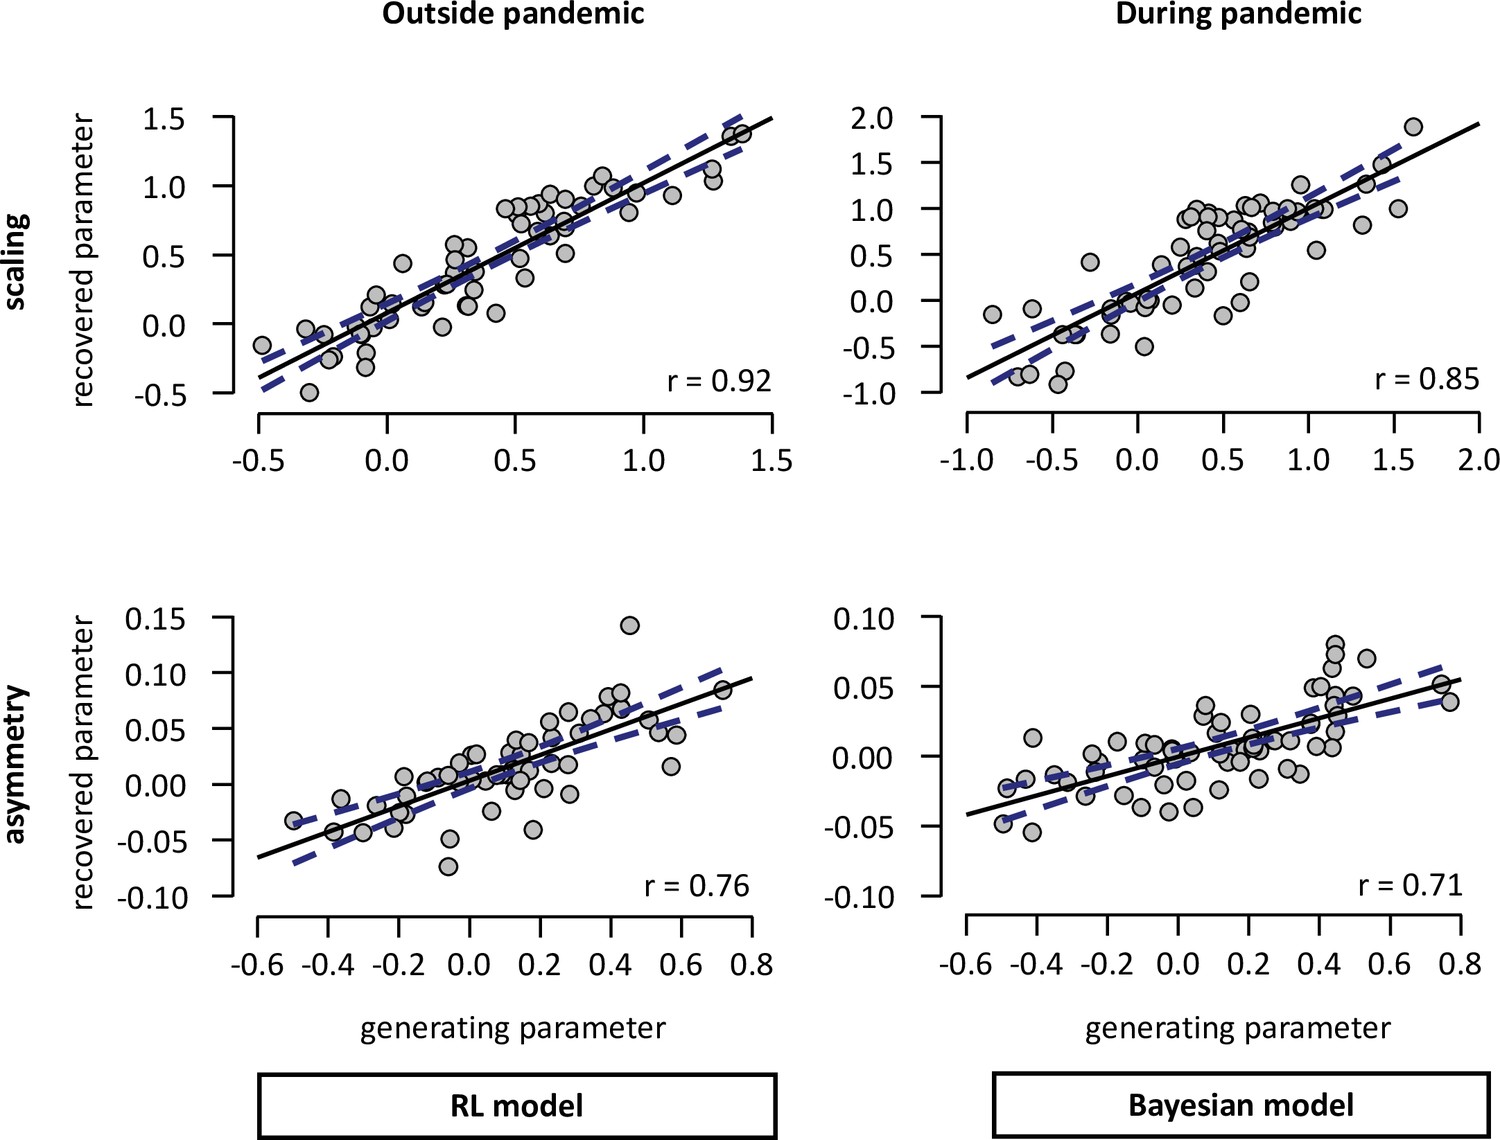
Parameter recovery for the wining model family according to context.
Pearson’s correlation between generating and recovered parameters for scaling (upper panel) and asymmetry (lower panel) learning rate component in participants tested outside (n = 58; left panel) and during (n = 65; right panel). The blue doted lines correspond to 95% confidence intervals. r – Pearson’s correlation coefficient against zero.
-
Figure 3—figure supplement 1—source data 1
Pearson correlation coefficients per participant for parameter recovery.
- https://cdn.elifesciences.org/articles/101157/elife-101157-fig3-figsupp1-data1-v1.xlsx
Figure 4
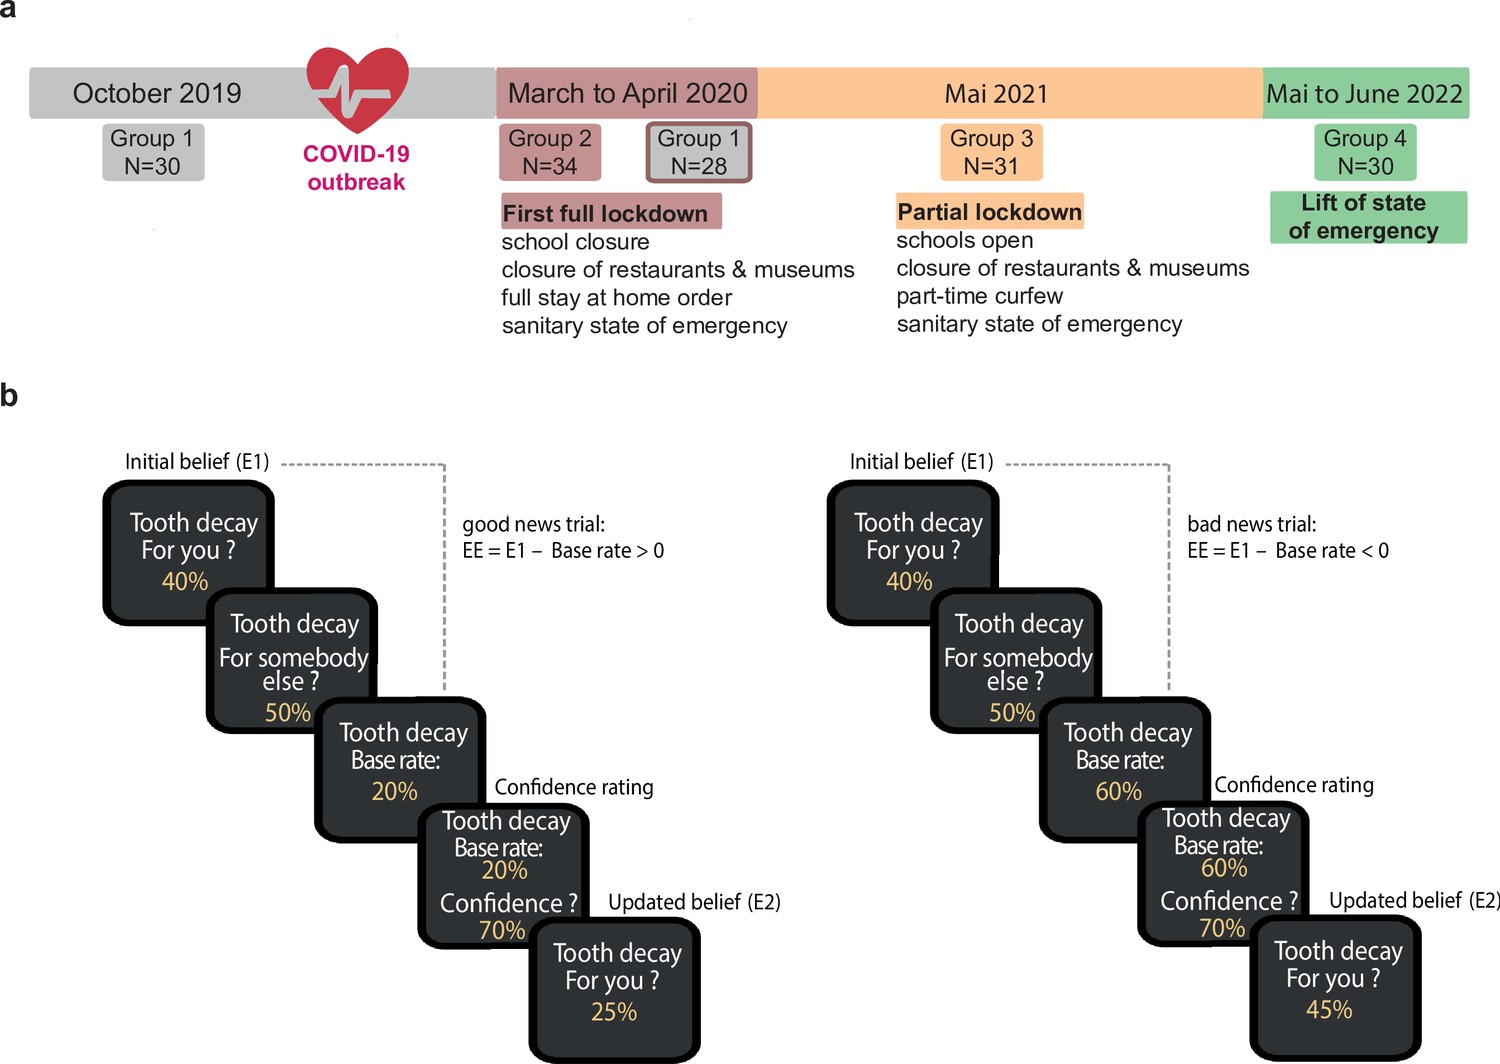
Experimental design.
(a) Timeline of testing. Four groups were tested, before the COVID-19 outbreak in October 2019, during the first complete lockdown of social and economic life in March and April 2020, after a partial lockdown in May 2021, and after the lift of the pandemic-related state of emergency in June 2022. (b) Belief updating task. Panels show subsequent appearances on the screen within a good news trial (left panels) and a bad news trial (right panel). Responses were self-paced. The task goal was to estimate the risk of experiencing different adverse future life events (e.g. tooth decay) for oneself (E1) and for somebody else (eBR) before and after (E2) being presented with information about the event’s prevalence in the general population (i.e. base rate (BR)).
Tables
Table 1
Sociodemographic data for all four groups (N=123).♀: Female; ♂: Male; Note: education is the number of years completed in higher education after a high school diploma.
| October2019(N=30) | March – April 2020(N=34) | May2021(N=31) | June2022(N=28) | |
|---|---|---|---|---|
| Age (years) | 34±2 | 42±3 | 42±3 | 35±3 |
| Gender | 18 ♀, 12 ♂ | 25 ♀, 9 ♂ | 20 ♀, 11 ♂ | 14 ♀, 14 ♂ |
| Education (years) | 5±0.4 | 4±0.3 | 5±0.2 | 4±0.4 |
Appendix 7—table 1
Survey responses in n=40 participants tested during the pandemic.
| Category | Specific question | Mean | sem |
|---|---|---|---|
| Risk perception | COVID-19 risk | 2.9 | 0.2 |
| General risk perception | 1.8 | 0.1 | |
| COVID-19 mortality risk | 3.1 | 0.2 | |
| Adoption of protective measures | Mask wearing | 3.7 | 0.2 |
| Social distancing outside home (shops, work) | 4.4 | 0.1 | |
| Hand washing | 4.2 | 0.2 | |
| Social distancing at home | 4.0 | 0.1 | |
| Gloves wearing | 1.4 | 0.1 | |
| Shaking hands, hugging | 2.2 | 0.2 | |
| Leave home for work, errands | 3.7 | 0.1 | |
| Hand sanitizer use | 4.0 | 0.2 | |
| Need for social interaction | Social craving | 3.8 | 0.2 |
| Feeling isolated | 2.6 | 0.2 | |
| Calling friends, parents, family, acquaintances | 4.5 | 0.1 | |
| Losing contact with friends, acquaintances | 2.3 | 0.2 | |
| Social media use | 3.6 | 0.2 | |
| Feeling of isolation from loved ones | 2.9 | 0.2 | |
| Quality of social interactions | 3.9 | 0.1 | |
| Mood | Sadness and anxiety | 2.5 | 0.2 |
| Anxiety | Level of anxiety | 2.6 | 0.2 |
| Living | 1 – alone, 2 – alone with pet, 3 – couple w/o children, 4 – couple w/ children, 5 – Family | 3.3 | 0.2 |
| Housing | 1 – apartment, 2 – apartment w/ outdoor space, 3 – house, 4 – house w/ outdoor space | 2.3 | 0.2 |
| Occupation | 1 – no occupation. 2 – remote work. 3 – work | 2.2 | 0.1 |
| Displacement | 1 – no displacement, 2 – public transportation, 3 – car | 2.4 | 0.1 |
-
5–point Likert scale from 1 to 5, 1 – minimal, 3 – medium, 5 – maximum; sem – standard error of the mean.
Appendix 7—table 2
Linear Mixed-Effects Model results fitting the average Belief Updates (UPD) in participants tested outside (n=58) and during (n=65) the pandemic.
| UPD ~1 + context +valence + EE+confidence + age+gender + education +design + valence*context + (1 | subject) + (1+valence | subject) + (1+EE | subject) | ||||||||||||
| Model fit statistics: | ||||||||||||
| AIC | BIC | LogLikelihood | Deviance | |||||||||
| 1851.1 | 1913.9 | –907.54 | 1815.1 | |||||||||
| Fixed effects coefficients (95% CIs): | ||||||||||||
| Name | Estimate | SE | tStat | DF | pValue | 95% CIs | ||||||
| Lower | Upper | |||||||||||
| Intercept | –2.1975 | 5.033 | –0.4366 | 232 | 0.6628 | –12.114 | 7.7188 | |||||
| valence | 3.2418 | 1.2297 | 2.6363 | 232 | 0.00895 | 0.81898 | 5.6646 | |||||
| context | –0.76328 | 1.9987 | –0.3819 | 232 | 0.7029 | –4.7013 | 3.1747 | |||||
| EE | 0.4187 | 0.11434 | 3.662 | 232 | 0.00031 | 0.19343 | 0.64397 | |||||
| confidence | 0.02234 | 0.03859 | 0.5789 | 232 | 0.56323 | –0.0537 | 0.09836 | |||||
| age | –0.00690 | 0.03181 | –0.2169 | 232 | 0.82845 | –0.0696 | 0.05577 | |||||
| gender | –0.62168 | 1.0909 | –0.5698 | 232 | 0.56932 | –2.7711 | 1.5277 | |||||
| education | –0.29937 | 0.29786 | –1.005 | 232 | 0.31592 | –0.8862 | 0.2875 | |||||
| design | 1.797 | 1.9642 | 0.9149 | 232 | 0.36121 | –2.0729 | 5.6669 | |||||
| valence:context | –5.5395 | 1.6879 | –3.2819 | 232 | 0.00119 | –8.8652 | –2.2139 | |||||
| Random effects covariance parameters (95% CIs): | ||||||||||||
| Group: subject (121 Levels) | ||||||||||||
| Name1 | Name2 | Type | Estimate | 95% CIs | ||||||||
| Lower | Upper | |||||||||||
| Intercept | Intercept | std | 2.0778 | NaN | NaN | |||||||
| Group: subject (121 Levels) | ||||||||||||
| Name1 | Name2 | Type | Estimate | 95% CIs | ||||||||
| Lower | Upper | |||||||||||
| Intercept | Intercept | std | 3.1204 | NaN | NaN | |||||||
| valence | Intercept | corr | –0.38448 | NaN | NaN | |||||||
| valence | valence | std | 8.3125 | NaN | NaN | |||||||
| Group: subject (121 Levels) | ||||||||||||
| Name1 | Name2 | Type | Estimate | 95% CIs | ||||||||
| Lower | Upper | |||||||||||
| Intercept | Intercept | std | 12.117 | 6.4527 | 22.755 | |||||||
| EE | Intercept | corr | –0.99998 | NaN | NaN | |||||||
| EE | EE | std | 0.53486 | 0.31495 | 0.90834 | |||||||
| Group: Error | ||||||||||||
| Name | Estimate | 95% CIs | ||||||||||
| Lower | Upper | |||||||||||
| Res Std | 5.0881 | NaN | NaN | |||||||||
Appendix 7—table 3
Linear Mixed-Effects Model results fitting the average Belief Updates (UPD) in participants tested outside (n=58) and during (n=65) the pandemic, corrected for distance defined by the difference between the estimate for oneself (E1) and for others (eBR).
| UPD ~1 + context +valence + EE+confidence + distance +age + gender +education + design +valence*context + (1 | subject) + (1+valence | subject) + (1+EE | subject) | |||||||||||||||
| Model fit statistics: | |||||||||||||||
| AIC | BIC | LogLikelihood | Deviance | ||||||||||||
| 1852.8 | 1919.1 | –907.42 | 1814.8 | ||||||||||||
| Fixed effects coefficients (95% CIs): | |||||||||||||||
| Name | Estimate | SE | tStat | DF | pValue | 95% CIs | |||||||||
| Lower | Upper | ||||||||||||||
| Intercept | –1.6107 | 5.1877 | –0.3105 | 231 | 0.7565 | –11.832 | 8.6105 | ||||||||
| valence | 3.2539 | 1.2307 | 2.6439 | 231 | 0.0088 | 0.82908 | 5.6788 | ||||||||
| context | –0.7479 | 1.9932 | –0.3752 | 231 | 0.7078 | –4.6751 | 3.1793 | ||||||||
| EE | 0.4324 | 0.11745 | 3.6817 | 231 | 0.0003 | 0.201 | 0.66382 | ||||||||
| confidence | 0.0191 | 0.0391 | 0.4892 | 231 | 0.6252 | –0.0578 | 0.0961 | ||||||||
| distance | –0.0619 | 0.1262 | –0.500 | 231 | 0.6239 | –0.3105 | 0.1866 | ||||||||
| age | –0.0075 | 0.0317 | –0.2371 | 231 | 0.8128 | –0.0700 | 0.0550 | ||||||||
| gender | –0.6504 | 1.0889 | –0.5973 | 231 | 0.5509 | –2.7959 | 1.4951 | ||||||||
| education | –0.3289 | 0.3053 | –1.0775 | 231 | 0.2824 | –0.9304 | 0.2725 | ||||||||
| design | 1.8887 | 1.9654 | 0.9610 | 231 | 0.3376 | –1.9837 | 5.7611 | ||||||||
| valence:context | –5.5767 | 1.6903 | –3.2992 | 231 | 0.0011 | –8.9071 | –2.2463 | ||||||||
| Random effects covariance parameters (95% CIs): | |||||||||||||||
| Group: subject (121 Levels) | |||||||||||||||
| Name1 | Name2 | Type | Estimate | 95% CIs | |||||||||||
| Lower | Upper | ||||||||||||||
| Intercept | Intercept | std | 3.3422 | NaN | NaN | ||||||||||
| valence | Intercept | corr | –0.3646 | NaN | NaN | ||||||||||
| valence | valence | std | 8.3923 | NaN | NaN | ||||||||||
| Group: subject (121 Levels) | |||||||||||||||
| Name1 | Name2 | Type | Estimate | 95% CIs | |||||||||||
| Lower | Upper | ||||||||||||||
| Intercept | Intercept | std | 12.344 | NaN | NaN | ||||||||||
| EE | Intercept | corr | –0.9994 | NaN | NaN | ||||||||||
| EE | EE | std | 0.5443 | 0.3238 | 0.9149 | ||||||||||
| Group: Error | |||||||||||||||
| Name | Estimate | 95% CIs | |||||||||||||
| Lower | Upper | ||||||||||||||
| Res Std | 4.8289 | NaN | NaN | ||||||||||||
Appendix 7—table 4
Linear Mixed-Effects Model results fitting the average Belief Updates (UPD) in participants tested before the COVID-19 outbreak in France (October 2019, n=30, baseline), and comparing them to participants tested during the first lockdown in March/April 2020 (n=34, context 1), 1 year later in May 2021 with less strict measures in place (n=31, context 2), and at the lift of the sanitary state of emergency in June 2022 (n=28, context 3).
| UPD ~1 + context +valence + EE+confidence + age+gender + education +design + valence*context + (1 | subject) + (1+valence | subject) + (1+EE | subject) | ||||||||||||
| Model fit statistics: | ||||||||||||
| AIC | BIC | LogLikelihood | Deviance | |||||||||
| 1857 | 1933.8 | –906.5 | 1813 | |||||||||
| Fixed effects coefficients (95% CIs): | ||||||||||||
| Name | Estimate | SE | tStat | DF | pValue | 95% CIs | ||||||
| Lower | Upper | |||||||||||
| Intercept | –5.041 | 6.1791 | –0.8158 | 228 | 0.41546 | –17.216 | 7.1345 | |||||
| valence | 4.2371 | 1.6732 | 2.5324 | 228 | 0.012 | 0.94033 | 7.534 | |||||
| EE | 0.42432 | 0.11572 | 3.6668 | 228 | 0.00031 | 0.1963 | 0.65233 | |||||
| confidence | 0.02225 | 0.0386 | 0.57687 | 228 | 0.5646 | –0.0538 | 0.098252 | |||||
| age | –0.0062 | 0.0317 | –0.1955 | 228 | 0.8452 | –0.0686 | 0.0562 | |||||
| gender | –0.4786 | 1.1083 | –0.4319 | 228 | 0.6663 | –2.6625 | 1.7052 | |||||
| education | –0.2686 | 0.2992 | –0.8978 | 228 | 0.3703 | –0.8582 | 0.3210 | |||||
| design | 2.7278 | 2.2643 | 1.2047 | 228 | 0.2296 | –1.734 | 7.1894 | |||||
| Context 1 | 0.9516 | 2.6961 | 0.3529 | 228 | 0.7245 | –4.361 | 6.2641 | |||||
| Context 2 | 0.5282 | 2.7112 | 0.1948 | 228 | 0.8457 | –4.814 | 5.8703 | |||||
| Context 3 | 1.7166 | 1.8127 | 0.9470 | 228 | 0.3446 | –1.855 | 5.2883 | |||||
| Valence by context 1 | –7.3853 | 2.2942 | –3.2191 | 228 | 0.0015 | –11.906 | –2.8647 | |||||
| Valence by context 2 | –5.5876 | 2.3627 | –2.365 | 228 | 0.0189 | –10.243 | –0.9321 | |||||
| Valence by context 3 | –2.1096 | 2.456 | –0.8590 | 228 | 0.3913 | –6.9489 | 2.7297 | |||||
| Random effects covariance parameters (95% CIs): | ||||||||||||
| Group: subject (121 Levels) | ||||||||||||
| Name1 | Name2 | Type | Estimate | 95% CIs | ||||||||
| Lower | Upper | |||||||||||
| Intercept | Intercept | std | 1.8256 | NaN | NaN | |||||||
| Group: subject (121 Levels) | ||||||||||||
| Name1 | Name2 | Type | Estimate | 95% CIs | ||||||||
| Lower | Upper | |||||||||||
| Intercept | Intercept | std | 2.7322 | NaN | NaN | |||||||
| valence | Intercept | corr | –0.4591 | NaN | NaN | |||||||
| valence | valence | std | 8.0804 | NaN | NaN | |||||||
| Group: subject (121 Levels) | ||||||||||||
| Name1 | Name2 | Type | Estimate | 95% CIs | ||||||||
| Lower | Upper | |||||||||||
| Intercept | Intercept | std | 12.429 | 6.8097 | 22.687 | |||||||
| EE | Intercept | corr | –0.99996 | NaN | NaN | |||||||
| EE | EE | std | 0.54549 | 0.32728 | 0.90917 | |||||||
| Group: Error | ||||||||||||
| Name | Estimate | 95% CIs | ||||||||||
| Lower | Upper | |||||||||||
| Res Std | 5.6331 | NaN | NaN | |||||||||
Appendix 7—table 5
Linear Mixed-Effects Model results fitting the average Belief Updates (UPD) in participants tested both before and during the pandemic (n=28).
| UPD ~1 + context +valence + EE+confidence + age+gender + education +valence*context + (1 | subject) + (1+valence | subject) + (1+EE | subject) | ||||||||||||
| Model fit statistics: | ||||||||||||
| AIC | BIC | LogLikelihood | Deviance | |||||||||
| 830.29 | 876.5 | –398.14 | 796.29 | |||||||||
| Fixed effects coefficients (95% CIs): | ||||||||||||
| Name | Estimate | SE | tStat | DF | pValue | 95% CIs | ||||||
| Lower | Upper | |||||||||||
| Intercept | 10.333 | 7.5518 | 1.3683 | 103 | 0.1742 | –4.6443 | 25.31 | |||||
| valence | 4.0497 | 1.2219 | 3.3142 | 103 | 0.00127 | 1.6263 | 6.4732 | |||||
| context | –4.4101 | 1.4926 | –2.9546 | 103 | 0.00388 | –7.3704 | –1.4499 | |||||
| EE | 0.08869 | 0.14664 | 0.6046 | 103 | 0.54678 | –0.2022 | 0.37948 | |||||
| confidence | 0.00141 | 0.04768 | 0.02948 | 103 | 0.97654 | –0.0932 | 0.09597 | |||||
| age | –0.05015 | 0.08563 | –0.5856 | 103 | 0.55941 | –0.2199 | 0.11968 | |||||
| gender | 3.5299 | 1.6424 | 2.1492 | 103 | 0.03396 | 0.27253 | 6.7873 | |||||
| education | –0.5649 | 0.42109 | –1.3415 | 103 | 0.1827 | –1.4 | 0.27023 | |||||
| valence:context | –7.6601 | 1.4923 | –5.1332 | 103 | 1.35e-06 | –10.62 | –4.7005 | |||||
| Random effects covariance parameters (95% CIs): | ||||||||||||
| Group: subject (28 Levels) | ||||||||||||
| Name1 | Name2 | Type | Estimate | 95% CIs | ||||||||
| Lower | Upper | |||||||||||
| Intercept | Intercept | std | 2.2282e-07 | NaN | NaN | |||||||
| Group: subject (121 Levels) | ||||||||||||
| Name1 | Name2 | Type | Estimate | 95% CIs | ||||||||
| Lower | Upper | |||||||||||
| Intercept | Intercept | std | 1.4291 | 0.80997 | 2.5215 | |||||||
| valence | Intercept | corr | -1 | NaN | NaN | |||||||
| valence | valence | std | 3.3249 | 1.9554 | 5.6537 | |||||||
| Group: subject (28 Levels) | ||||||||||||
| Name1 | Name2 | Type | Estimate | 95% CIs | ||||||||
| Lower | Upper | |||||||||||
| Intercept | Intercept | std | 8.274e-07 | NaN | NaN | |||||||
| EE | Intercept | corr | –0.99994 | NaN | NaN | |||||||
| EE | EE | std | 3.0154e-08 | NaN | NaN | |||||||
| Group: Error | ||||||||||||
| Name | Estimate | 95% CIs | ||||||||||
| Lower | Upper | |||||||||||
| Res Std | 7.8366 | 6.7914 | 9.0426 | |||||||||
Appendix 7—table 6
Linear Mixed-Effects Model results fitting the average belief updates (UPD) in participants tested outside (n=58) and during (n=65) the pandemic, corrected for distance, and with estimation errors (EE) calculated based on the estimate for someone else (eBR).
| UPD ~1 + context +valence + EE+confidence + distance +age + gender +education + design +valence*context + (1 | subject) + (1+valence | subject) + (1+EE | subject) | ||||||||||||
| Model fit statistics: | ||||||||||||
| AIC | BIC | LogLikelihood | Deviance | |||||||||
| 1822.9 | 1889.2 | –892.44 | 1784.9 | |||||||||
| Fixed effects coefficients (95% CIs): | ||||||||||||
| Name | Estimate | SE | tStat | DF | pValue | 95% CIs | ||||||
| Lower | Upper | |||||||||||
| Intercept | –8.2881 | 5.0873 | –1.6292 | 231 | 0.1046 | –18.311 | 1.7353 | |||||
| valence | 2.4409 | 1.2913 | 1.8902 | 231 | 0.0600 | –0.1034 | 4.9852 | |||||
| context | –0.7860 | 1.7408 | –0.4515 | 231 | 0.6520 | –4.2159 | 2.6438 | |||||
| EE | 0.5057 | 0.1220 | 4.1459 | 231 | 4.8e-05 | 0.2654 | 0.7460 | |||||
| confidence | 0.0948 | 0.0349 | 2.7202 | 231 | 0.0070 | 0.0261 | 0.1635 | |||||
| distance | –0.1582 | 0.1054 | –1.5013 | 231 | 0.1347 | –0.3659 | 0.0494 | |||||
| age | –0.0025 | 0.0274 | –0.0916 | 231 | 0.9271 | –0.0566 | 0.0515 | |||||
| gender | 0.6055 | 0.9504 | 0.6371 | 231 | 0.5247 | –1.2671 | 2.4781 | |||||
| education | –0.2419 | 0.2640 | –0.9160 | 231 | 0.3606 | –0.7621 | 0.2784 | |||||
| design | 0.9142 | 1.7301 | 0.5284 | 231 | 0.5977 | –2.4945 | 4.3229 | |||||
| valence:context | –5.0968 | 1.7627 | –2.8914 | 231 | 0.0042 | –8.5698 | –1.6237 | |||||
| Random effects covariance parameters (95% CIs): | ||||||||||||
| Group: subject (121 Levels) | ||||||||||||
| Name1 | Name2 | Type | Estimate | 95% CIs | ||||||||
| Lower | Upper | |||||||||||
| Intercept | Intercept | std | 1.5868 | NaN | NaN | |||||||
| Group: subject (121 Levels) | ||||||||||||
| Name1 | Name2 | Type | Estimate | 95% CIs | ||||||||
| Lower | Upper | |||||||||||
| Intercept | Intercept | std | 2.9714 | NaN | NaN | |||||||
| valence | Intercept | corr | 0.2994 | NaN | NaN | |||||||
| valence | valence | std | 9.2418 | NaN | NaN | |||||||
| Group: subject (121 Levels) | ||||||||||||
| Name1 | Name2 | Type | Estimate | 95% CIs | ||||||||
| Lower | Upper | |||||||||||
| Intercept | Intercept | std | 1.1447 | NaN | NaN | |||||||
| EE | Intercept | corr | –0.9956 | NaN | NaN | |||||||
| EE | EE | std | 0.1645 | NaN | NaN | |||||||
| Group: Error | ||||||||||||
| Name | Estimate | 95% CIs | ||||||||||
| Lower | Upper | |||||||||||
| Res Std | 3.9480 | NaN | NaN | |||||||||
Appendix 7—table 7
Linear Mixed-Effects Model results fitting the average confidence ratings in participants tested outside (n=58) and during (n=65) the pandemic.
| confidence ~1 + context +valence + EE+age + gender +education + design +valence*context + (1 | subject) | |||||||||||||
| Model fit statistics: | |||||||||||||
| AIC | BIC | LogLikelihood | Deviance | ||||||||||
| 1908.6 | 1946.9 | –943.28 | 1886.6 | ||||||||||
| Fixed effects coefficients | |||||||||||||
| Name | Estimate | SE | tStat | DF | pValue | 95% CIs | |||||||
| Lower | Upper | ||||||||||||
| Intercept | 61.051 | 9.1552 | 6.6685 | 233 | 1.86e-10 | 43.013 | 79.088 | ||||||
| valence | –0.4795 | 0.7288 | –0.6580 | 233 | 0.5112 | –1.9154 | 0.9563 | ||||||
| context | 14.105 | 4.524 | 3.1177 | 233 | 0.0021 | 5.1915 | 23.018 | ||||||
| EE | –0.2398 | 0.1177 | –2.0376 | 233 | 0.0427 | –0.4717 | –0.0079 | ||||||
| age | 0.0451 | 0.0747 | 0.6037 | 233 | 0.5466 | –0.1021 | 0.1923 | ||||||
| gender | –2.415 | 2.5148 | –0.9603 | 233 | 0.3379 | –7.3697 | 2.5397 | ||||||
| education | 0.0563 | 0.6898 | 0.0816 | 233 | 0.935 | –1.3027 | 1.4153 | ||||||
| design | 3.8568 | 4.6503 | 0.8294 | 233 | 0.4077 | –5.3052 | 13.019 | ||||||
| valence:context | 0.0969 | 1.0256 | 0.0944 | 233 | 0.9248 | –1.9237 | 2.1174 | ||||||
| Random effects covariance parameters | |||||||||||||
| Group: subject (121 Levels) | |||||||||||||
| Name1 | Name2 | Type | Estimate | 95% CIs | |||||||||
| Lower | Upper | ||||||||||||
| Intercept | Intercept | std | 11.892 | 10.188 | 13.88 | ||||||||
| Group: Error | |||||||||||||
| Name | Estimate | 95% CIs | |||||||||||
| Lower | Upper | ||||||||||||
| Res Std | 7.6935 | 6.7828 | 8.7265 | ||||||||||
Appendix 7—table 8
Linear Mixed-Effects Model results fitting the average absolute Estimation Error (EE) in participants tested outside (n=58) and during (n=65) the pandemic.
| EE ~1 + context +valence + confidence +age + gender +education + design +valence*context + (1 | subject) | |||||||||||||
| Model fit statistics: | |||||||||||||
| AIC | BIC | LogLikelihood | Deviance | ||||||||||
| 1569 | 1607.3 | –773.48 | 1547 | ||||||||||
| Fixed effects coefficients (95% CIs): | |||||||||||||
| Name | Estimate | SE | tStat | DF | pValue | 95% CIs | |||||||
| Lower | Upper | ||||||||||||
| Intercept | 24.602 | 3.5887 | 6.8553 | 233 | 6.32e-11 | 17.531 | 31.672 | ||||||
| valence | –0.4550 | 0.4902 | –0.9282 | 233 | 0.3543 | –1.4209 | 0.5108 | ||||||
| context | 3.686 | 1.6893 | 2.1819 | 233 | 0.0301 | 0.3577 | 7.0143 | ||||||
| confidence | –0.0496 | 0.0289 | –1.7123 | 233 | 0.0882 | –0.1067 | 0.0075 | ||||||
| age | 0.0403 | 0.0272 | 1.4801 | 233 | 0.1402 | –0.0133 | 0.0939 | ||||||
| gender | –1.073 | 0.9181 | –1.1688 | 233 | 0.2437 | –2.8818 | 0.7358 | ||||||
| education | –0.3296 | 0.2511 | –1.3128 | 233 | 0.1906 | –0.8243 | 0.1651 | ||||||
| design | 1.7037 | 1.6971 | 1.0039 | 233 | 0.3165 | –1.64 | 5.0473 | ||||||
| valence:context | 2.1942 | 0.6688 | 3.2808 | 233 | 0.0012 | 0.8765 | 3.5119 | ||||||
| Random effects covariance parameters | |||||||||||||
| Group: subject (121 Levels) | |||||||||||||
| Name1 | Name2 | Type | Estimate | 95% CIs | |||||||||
| Lower | Upper | ||||||||||||
| Intercept | Intercept | std | 3.046 | 2.1255 | 4.3652 | ||||||||
| Group: Error | |||||||||||||
| Name | Estimate | 95% CIs | |||||||||||
| Lower | Upper | ||||||||||||
| Res Std | 5.1867 | 4.5717 | 5.8845 | ||||||||||
Appendix 7—table 9
Linear Mixed-Effects Model results fitting the average Learning Rates from the RL-like model in participants tested outside (n=58) and during (n=65) the pandemic.
| LR ~1 + context +valence + age+gender + education +design + valence*context + (1 | subject) | |||||||||||||
| Model fit statistics: | |||||||||||||
| AIC | BIC | LogLikelihood | Deviance | ||||||||||
| –54.291 | –19.319 | 37.146 | –74.291 | ||||||||||
| Fixed effects coefficients | |||||||||||||
| Name | Estimate | SE | tStat | DF | pValue | 95% CIs | |||||||
| Lower | Upper | ||||||||||||
| Intercept | 0.5189 | 0.1546 | 3.3566 | 236 | 0.0009 | 0.2144 | 0.8235 | ||||||
| valence | 0.0856 | 0.0120 | 7.1351 | 236 | 1.18e-11 | 0.0620 | 0.1092 | ||||||
| context | –0.0492 | 0.0797 | –0.6172 | 236 | 0.5377 | –0.2062 | 0.1078 | ||||||
| age | –0.0005 | 0.0014 | –0.3404 | 236 | 0.7339 | –0.0031 | 0.0022 | ||||||
| gender | –0.0287 | 0.0457 | –0.6267 | 236 | 0.5315 | –0.1187 | 0.0614 | ||||||
| education | –0.0227 | 0.0126 | –1.8091 | 236 | 0.0717 | –0.0474 | 0.0020 | ||||||
| design | 0.0269 | 0.0822 | 0.3272 | 236 | 0.7438 | –0.1351 | 0.1889 | ||||||
| valence:context | –0.0347 | 0.0164 | –2.1126 | 236 | 0.0357 | –0.0671 | –0.0023 | ||||||
| Random effects covariance parameters | |||||||||||||
| Group: subject (122 Levels) | |||||||||||||
| Name1 | Name2 | Type | Estimate | 95% CIs | |||||||||
| Lower | Upper | ||||||||||||
| Intercept | Intercept | std | 0.22053 | 0.19016 | 0.25575 | ||||||||
| Group: Error | |||||||||||||
| Name | Estimate | 95% CIs | |||||||||||
| Lower | Upper | ||||||||||||
| Res Std | 0.12808 | 0.11297 | 0.1452 | ||||||||||
Appendix 7—table 10
Linear Mixed-Effects Model results fitting the average Learning Rates for RL-like model in participants tested both before and during the pandemic (n=28).
| LR ~1 + context +valence + age+gender + education +valence*context + (1 | subject) | |||||||||||||
| Model fit statistics: | |||||||||||||
| AIC | BIC | LogLikelihood | Deviance | ||||||||||
| –15.954 | 8.5125 | 16.977 | –33.954 | ||||||||||
| Fixed effects coefficients | |||||||||||||
| Name | Estimate | SE | tStat | DF | pValue | 95% CIs | |||||||
| Lower | Upper | ||||||||||||
| Intercept | 0.3529 | 0.1869 | 1.8887 | 105 | 0.0617 | –0.0176 | 0.7234 | ||||||
| valence | 0.0752 | 0.0234 | 3.2175 | 105 | 0.0017 | 0.0288 | 0.1215 | ||||||
| context | –0.1024 | 0.0330 | –3.1011 | 105 | 0.0025 | –0.1679 | –0.0369 | ||||||
| age | 0.0010 | 0.0035 | 0.2876 | 105 | 0.7742 | –0.0060 | 0.0080 | ||||||
| gender | 0.1858 | 0.0704 | 2.6385 | 105 | 0.0096 | 0.0462 | 0.3254 | ||||||
| education | –0.0216 | 0.0178 | –1.2130 | 105 | 0.2279 | –0.0570 | 0.0137 | ||||||
| valence:context | –0.0616 | 0.0330 | –1.8662 | 105 | 0.0648 | –0.1271 | 0.0039 | ||||||
| Random effects covariance parameters | |||||||||||||
| Group: subject (28 Levels) | |||||||||||||
| Name1 | Name2 | Type | Estimate | 95% CIs | |||||||||
| Lower | Upper | ||||||||||||
| Intercept | Intercept | std | 0.15167 | 0.10662 | 0.21576 | ||||||||
| Group: Error | |||||||||||||
| Name | Estimate | 95% CIs | |||||||||||
| Lower | Upper | ||||||||||||
| Res Std | 0.17479 | 0.15026 | 0.20332 | ||||||||||
Appendix 7—table 11
Linear Mixed-Effects Model results fitting the average asymmetry in the RL-like model in participants tested outside (n=58) and during (n=65) the pandemic.
| asymmetry ~1 + context +age + gender +education + (1 | subject) | |||||||||||||
| Model fit statistics: | |||||||||||||
| AIC | BIC | LogLikelihood | Deviance | ||||||||||
| –204.79 | –185.16 | 109.39 | –218.79 | ||||||||||
| Fixed effects coefficients | |||||||||||||
| Name | Estimate | SE | tStat | DF | pValue | 95% CIs | |||||||
| Lower | Upper | ||||||||||||
| Intercept | 0.0264 | 0.0323 | 0.818 | 117 | 0.415 | –0.0375 | 0.0903 | ||||||
| context | –0.04 | 0.0172 | –2.3202 | 117 | 0.0221 | –0.0741 | –0.0058 | ||||||
| age | 0.0006 | 0.0005 | 1.1752 | 117 | 0.2423 | –0.0004 | 0.0016 | ||||||
| gender | 0.0089 | 0.0045 | 2.0024 | 117 | 0.0475 | 0.0001 | 0.0178 | ||||||
| education | –0.0048 | 0.0172 | –0.2815 | 117 | 0.7788 | –0.0388 | 0.0291 | ||||||
| Random effects covariance parameters | |||||||||||||
| Group: subject (122 Levels) | |||||||||||||
| Name1 | Name2 | Type | Estimate | 95% CIs | |||||||||
| Lower | Upper | ||||||||||||
| Intercept | Intercept | std | 0.063415 | NaN | NaN | ||||||||
| Group: Error | |||||||||||||
| Name | Estimate | 95% CIs | |||||||||||
| Lower | Upper | ||||||||||||
| Res Std | 0.063415 | NaN | NaN | ||||||||||
Appendix 7—table 12
Linear Mixed-Effects Model results fitting the average scaling in the RL-like model in participants tested outside (n=58) and during (n=65) the pandemic.
| scaling ~1 + context +age + gender +education + (1 | subject) | |||||||||||||
| Model fit statistics: | |||||||||||||
| AIC | BIC | LogLikelihood | Deviance | ||||||||||
| 10.519 | 30.147 | 1.7406 | –3.4813 | ||||||||||
| Fixed effects coefficients | |||||||||||||
| Name | Estimate | SE | tStat | DF | pValue | 95% CIs | |||||||
| Lower | Upper | ||||||||||||
| Intercept | 0.561 | 0.0858 | 6.5375 | 117 | 1.71e-09 | 0.3911 | 0.731 | ||||||
| context | –0.0705 | 0.0458 | –1.5406 | 117 | 0.1261 | –0.1612 | 0.0201 | ||||||
| age | –0.0004 | 0.0014 | –0.3263 | 117 | 0.7448 | –0.0031 | 0.0022 | ||||||
| gender | –0.0214 | 0.0119 | –1.7993 | 117 | 0.0745 | –0.0449 | 0.0022 | ||||||
| education | –0.0297 | 0.0456 | –0.6517 | 117 | 0.5159 | –0.1201 | 0.0606 | ||||||
| Random effects covariance parameters | |||||||||||||
| Group: subject (122 Levels) | |||||||||||||
| Name1 | Name2 | Type | Estimate | 95% CIs | |||||||||
| Lower | Upper | ||||||||||||
| Intercept | Intercept | std | 0.16865 | NaN | NaN | ||||||||
| Group: Error | |||||||||||||
| Name | Estimate | 95% CIs | |||||||||||
| Lower | Upper | ||||||||||||
| Res Std | 0.16865 | NaN | NaN | ||||||||||
Appendix 7—table 13
Linear Mixed-Effects Model results fitting the average asymmetry in the RL-like model in participants tested both before and during the pandemic (n=28).
| asymmetry ~1 + context +age + gender +education + (1 | subject) | |||||||||||||
| Model fit statistics: | |||||||||||||
| AIC | BIC | LogLikelihood | Deviance | ||||||||||
| –138.71 | –124.53 | 76.354 | –152.71 | ||||||||||
| Fixed effects coefficients | |||||||||||||
| Name | Estimate | SE | tStat | DF | pValue | 95% CIs | |||||||
| Lower | Upper | ||||||||||||
| Intercept | 0.0471 | 0.0473 | 0.9969 | 51 | 0.3235 | –0.0478 | 0.1420 | ||||||
| context | –0.0615 | 0.0165 | –3.7185 | 51 | 0.0005 | –0.0947 | –0.0283 | ||||||
| age | 0.0005 | 0.0009 | 0.6121 | 51 | 0.5432 | –0.0012 | 0.0023 | ||||||
| gender | –0.0023 | 0.0176 | –0.1285 | 51 | 0.8983 | –0.0376 | 0.0331 | ||||||
| education | 0.0019 | 0.0045 | 0.4158 | 51 | 0.6793 | –0.0071 | 0.0108 | ||||||
| Random effects covariance parameters | |||||||||||||
| Group: subject (28 Levels) | |||||||||||||
| Name1 | Name2 | Type | Estimate | 95% CIs | |||||||||
| Lower | Upper | ||||||||||||
| Intercept | Intercept | std | 9.1905e-09 | NaN | NaN | ||||||||
| Group: Error | |||||||||||||
| Name | Estimate | 95% CIs | |||||||||||
| Lower | Upper | ||||||||||||
| Res Std | 0.06189 | 0.051427 | 0.074482 | ||||||||||
Appendix 7—table 14
Linear Mixed-Effects Model results fitting the average scaling in the RL-like model in participants tested both before and during the pandemic (n=28).
| scaling ~1 + context +age + gender +education + (1 | subject) | |||||||||||||
| Model fit statistics: | |||||||||||||
| AIC | BIC | LogLikelihood | Deviance | ||||||||||
| 3.4809 | 17.658 | 5.2595 | –10.519 | ||||||||||
| Fixed effects coefficients | |||||||||||||
| Name | Estimate | SE | tStat | DF | pValue | 95% CIs | |||||||
| Lower | Upper | ||||||||||||
| Intercept | 0.3529 | 0.1880 | 1.8776 | 51 | 0.0662 | –0.0244 | 0.7302 | ||||||
| context | –0.1024 | 0.0524 | –1.9554 | 51 | 0.0560 | –0.2076 | 0.0027 | ||||||
| age | 0.0010 | 0.0035 | 0.2876 | 51 | 0.7748 | –0.0061 | 0.0081 | ||||||
| gender | 0.1858 | 0.0704 | 2.6385 | 51 | 0.0110 | 0.0444 | 0.3272 | ||||||
| education | –0.0216 | 0.0178 | –1.2130 | 51 | 0.2307 | –0.0575 | 0.0142 | ||||||
| Random effects covariance parameters | |||||||||||||
| Group: subject (28 Levels) | |||||||||||||
| Name1 | Name2 | Type | Estimate | 95% CIs | |||||||||
| Lower | Upper | ||||||||||||
| Intercept | Intercept | std | 0.10692 | 0.046689 | 0.24485 | ||||||||
| Group: Error | |||||||||||||
| Name | Estimate | 95% CIs | |||||||||||
| Lower | Upper | ||||||||||||
| Res Std | 0.19601 | 0.15084 | 0.2547 | ||||||||||
Appendix 7—table 15
Sociodemographical data (N=123).
| N | gender | age | education level | |
|---|---|---|---|---|
| Outside pandemic | 58 | 32 females | 33.84±1.68 | 4.54±0.29 |
| During pandemic | 65 | 45 females | 42.32±2.35 | 4.59±0.19 |
| Group tested before and during | 28 | 18 females | 34.14±2.08 | 5.00±0.41 |
-
Note: education is reported as years of higher education (university level).
Appendix 7—table 16
Linear Mixed-Effects Model results fitting the average number of paradoxical trials in participants tested outside (n=58) and during (n=65) the pandemic.
| Nb of trials ~1 + valence +context + age+gender + education +design + context*valence + (1 | subject) | |||||||||||||
| Model fit statistics: | |||||||||||||
| AIC | BIC | LogLikelihood | Deviance | ||||||||||
| 1623.5 | 1644.6 | –805.76 | 1611.5 | ||||||||||
| Fixed effects coefficients | |||||||||||||
| Name | Estimate | SE | tStat | DF | pValue | 95% CIs | |||||||
| Lower | Upper | ||||||||||||
| Intercept | 19.427 | 3.059 | 6.3508 | 234 | 1.10e-09 | 13.4 | 25.454 | ||||||
| valence | –1.9732 | 0.6083 | –3.2436 | 234 | 0.0014 | –3.1717 | –0.7747 | ||||||
| context | –0.1904 | 1.57 | –0.1213 | 234 | 0.9036 | –3.2836 | 2.9028 | ||||||
| age | 0.0010 | 0.0260 | 0.0402 | 234 | 0.9680 | –0.0501 | 0.0522 | ||||||
| gender | –0.1403 | 0.8746 | –0.1604 | 234 | 0.8727 | –1.8633 | 1.5828 | ||||||
| education | 0.0022 | 0.2397 | 0.0092 | 234 | 0.9926 | –0.4701 | 0.4745 | ||||||
| design | 0.1215 | 1.6177 | 0.0751 | 234 | 0.9402 | –3.0656 | 3.3085 | ||||||
| context:valence | –2.3576 | 0.8300 | –2.8404 | 234 | 0.0049 | –3.9928 | –0.7223 | ||||||
| Random effects covariance parameters | |||||||||||||
| Group: subject (123 Levels) | |||||||||||||
| Name1 | Name2 | Type | Estimate | 95% CIs | |||||||||
| Lower | Upper | ||||||||||||
| Intercept | Intercept | std | 2.8591e-15 | NaN | NaN | ||||||||
| Group: Error | |||||||||||||
| Name | Estimate | 95% CIs | |||||||||||
| Lower | Upper | ||||||||||||
| Res Std | 6.4381 | 5.8893 | 7.038 | ||||||||||
Appendix 7—table 17
Linear Mixed-Effects Model results fitting the average number of under- and overshooting in participants tested outside (n=58) and during (n=65) the pandemic.
| Nb of shoot ~1 + type+context + EE+age + gender +education + design +context*type + (1 | subject) | |||||||||||||
| Model fit statistics: | |||||||||||||
| AIC | BIC | LogLikelihood | Deviance | ||||||||||
| 1623.5 | 1644.6 | –805.76 | 1611.5 | ||||||||||
| Fixed effects coefficients | |||||||||||||
| Name | Estimate | SE | tStat | DF | pValue | 95% CIs | |||||||
| Lower | Upper | ||||||||||||
| Intercept | 3.5229 | 2.0186 | 1.7452 | 233 | 0.0823 | –0.4542 | 7.5001 | ||||||
| type | –1.0751 | 0.3611 | –2.9769 | 233 | 0.0032 | –1.7866 | –0.3636 | ||||||
| context | 0.2141 | 0.9390 | 0.2280 | 233 | 0.8199 | –1.6359 | 2.064 | ||||||
| EE | –0.0288 | 0.0406 | –0.7102 | 233 | 0.4783 | –0.1088 | 0.0511 | ||||||
| age | 0.0079 | 0.0155 | 0.5099 | 233 | 0.6106 | –0.0226 | 0.0384 | ||||||
| gender | –0.4039 | 0.5200 | –0.7766 | 233 | 0.4382 | –1.4284 | 0.6207 | ||||||
| education | –0.4182 | 0.1428 | –2.9286 | 233 | 0.0037 | –0.6995 | –0.1369 | ||||||
| design | 1.4082 | 0.9612 | 1.4651 | 233 | 0.1443 | –0.4855 | 3.3019 | ||||||
| context:type | 1.6648 | 0.5003 | 3.3277 | 233 | 0.0010 | 0.6792 | 2.6505 | ||||||
| Random effects covariance parameters | |||||||||||||
| Group: subject (123 Levels) | |||||||||||||
| Name1 | Name2 | Type | Estimate | 95% CIs | |||||||||
| Lower | Upper | ||||||||||||
| Intercept | Intercept | std | 2.2037e-06 | NaN | NaN | ||||||||
| Group: Error | |||||||||||||
| Name | Estimate | 95% CIs | |||||||||||
| Lower | Upper | ||||||||||||
| Res Std | 3.8174 | 3.492 | 4.1731 | ||||||||||
Appendix 7—table 18
Linear Mixed-Effects Model results fitting initial beliefs about the likelihood of adverse future life events for oneself (E1) and for others (eBR) in participants tested outside (n=58) and during (n=65) the pandemic.
Note the perspective regressor (coded 0 for E1 and 1 for eBR) tested if and how beliefs differed when assessed for oneself than for others.
| Estimate ~1 + context +perspective + EE+confidence + age+gender + education +design + context*perspective + (1 | subject) | ||||||||||||
| Model fit statistics: | ||||||||||||
| AIC | BIC | LogLikelihood | Deviance | |||||||||
| 1630.4 | 1672.3 | –803.22 | 1606.4 | |||||||||
| Fixed effects coefficients (95% CIs): | ||||||||||||
| Name | Estimate | SE | tStat | DF | pValue | 95% CIs | ||||||
| Lower | Upper | |||||||||||
| Intercept | 31.472 | 6.6809 | 4.7108 | 232 | 4.25e-06 | 18.309 | 44.635 | |||||
| perspective | 3.0194 | 0.8564 | 3.5257 | 232 | 0.0005 | 1.3321 | 4.7067 | |||||
| context | –1.9127 | 2.9993 | –0.6377 | 232 | 0.5243 | –7.8221 | 3.9966 | |||||
| EE | 0.3146 | 0.1261 | 2.4955 | 232 | 0.0133 | 0.0662 | 0.5629 | |||||
| confidence | 0.0598 | 0.0350 | 1.7069 | 232 | 0.0892 | –0.0092 | 0.1287 | |||||
| age | –0.0808 | 0.0481 | –1.6793 | 232 | 0.09444 | –0.1756 | 0.0140 | |||||
| gender | 0.1048 | 1.6285 | 0.0643 | 232 | 0.9488 | –3.1037 | 3.3133 | |||||
| education | –0.6857 | 0.4443 | –1.5433 | 232 | 0.1241 | –1.5612 | 0.1897 | |||||
| design | 0.2792 | 2.9999 | 0.0931 | 232 | 0.9259 | –5.6313 | 6.1897 | |||||
| context: perspective | 0.0678 | 0.9811 | 0.0691 | 232 | 0.9450 | –1.8652 | 2.0007 | |||||
| Random effects covariance parameters (95% CIs): | ||||||||||||
| Group: subject (121 Levels) | ||||||||||||
| Name1 | Name2 | Type | Estimate | 95% CIs | ||||||||
| Lower | Upper | |||||||||||
| Intercept | Intercept | std | 8.0025 | 6.9443 | 9.2219 | |||||||
| Group: Error | ||||||||||||
| Name | Estimate | 95% CIs | ||||||||||
| Lower | Upper | |||||||||||
| Res Std | 3.7506 | 3.3033 | 4.2584 | |||||||||
Additional files
Download links
A two-part list of links to download the article, or parts of the article, in various formats.
Downloads (link to download the article as PDF)
Open citations (links to open the citations from this article in various online reference manager services)
Cite this article (links to download the citations from this article in formats compatible with various reference manager tools)
Effects of experiencing the COVID-19 pandemic on optimistically biased belief updating
eLife 13:RP101157.
https://doi.org/10.7554/eLife.101157.3


