Human brain ancestral barcodes
- Department of Pathology, University of Southern California, Keck School of Medicine, United States
Figures
Figure 1
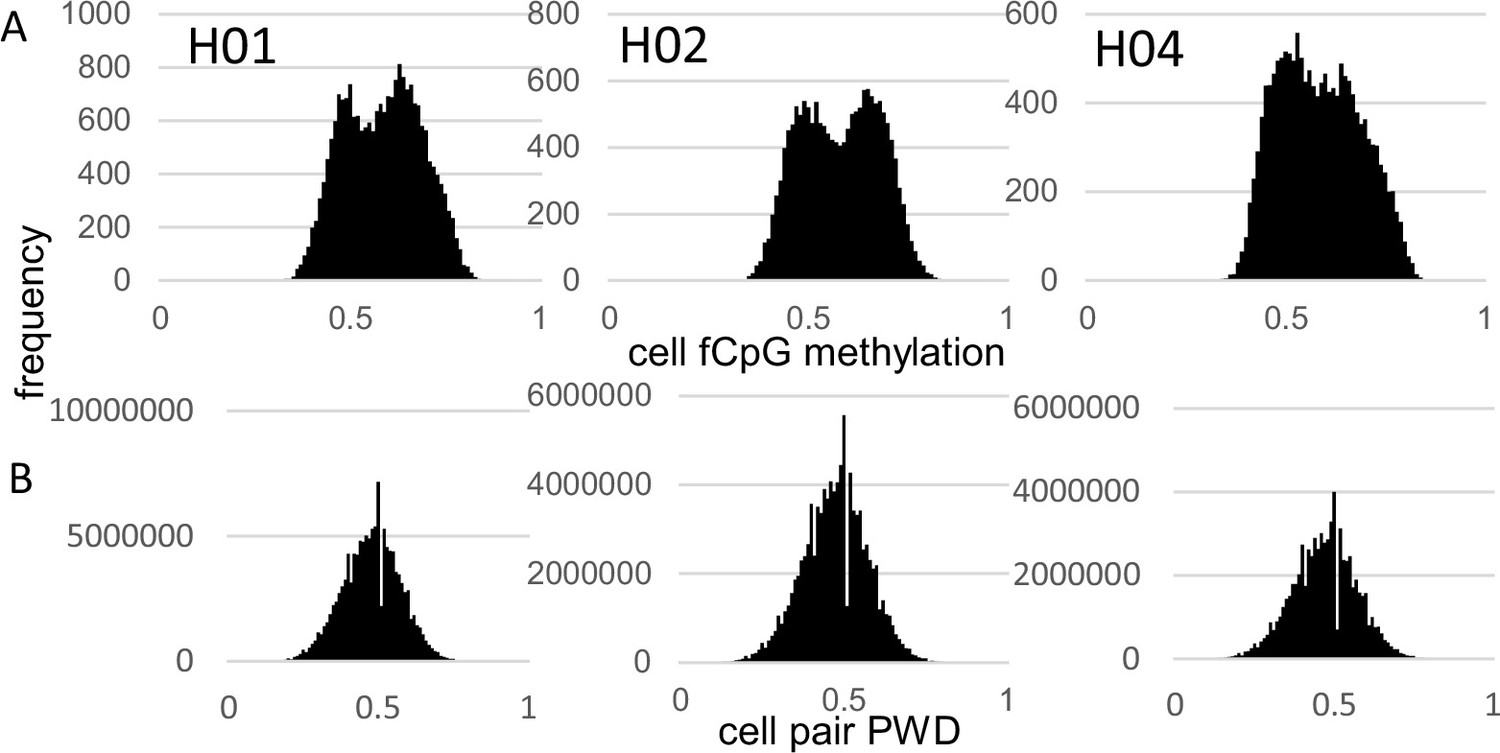
Fluctuating CpG (fCpG) barcode methylation 0.5.
(A) Barcode methylation was variable between cells with averages ~50% (B) Most cells had different barcodes with average pairwise differences (PWDs) ~0.5.
Figure 2 with 2 supplements
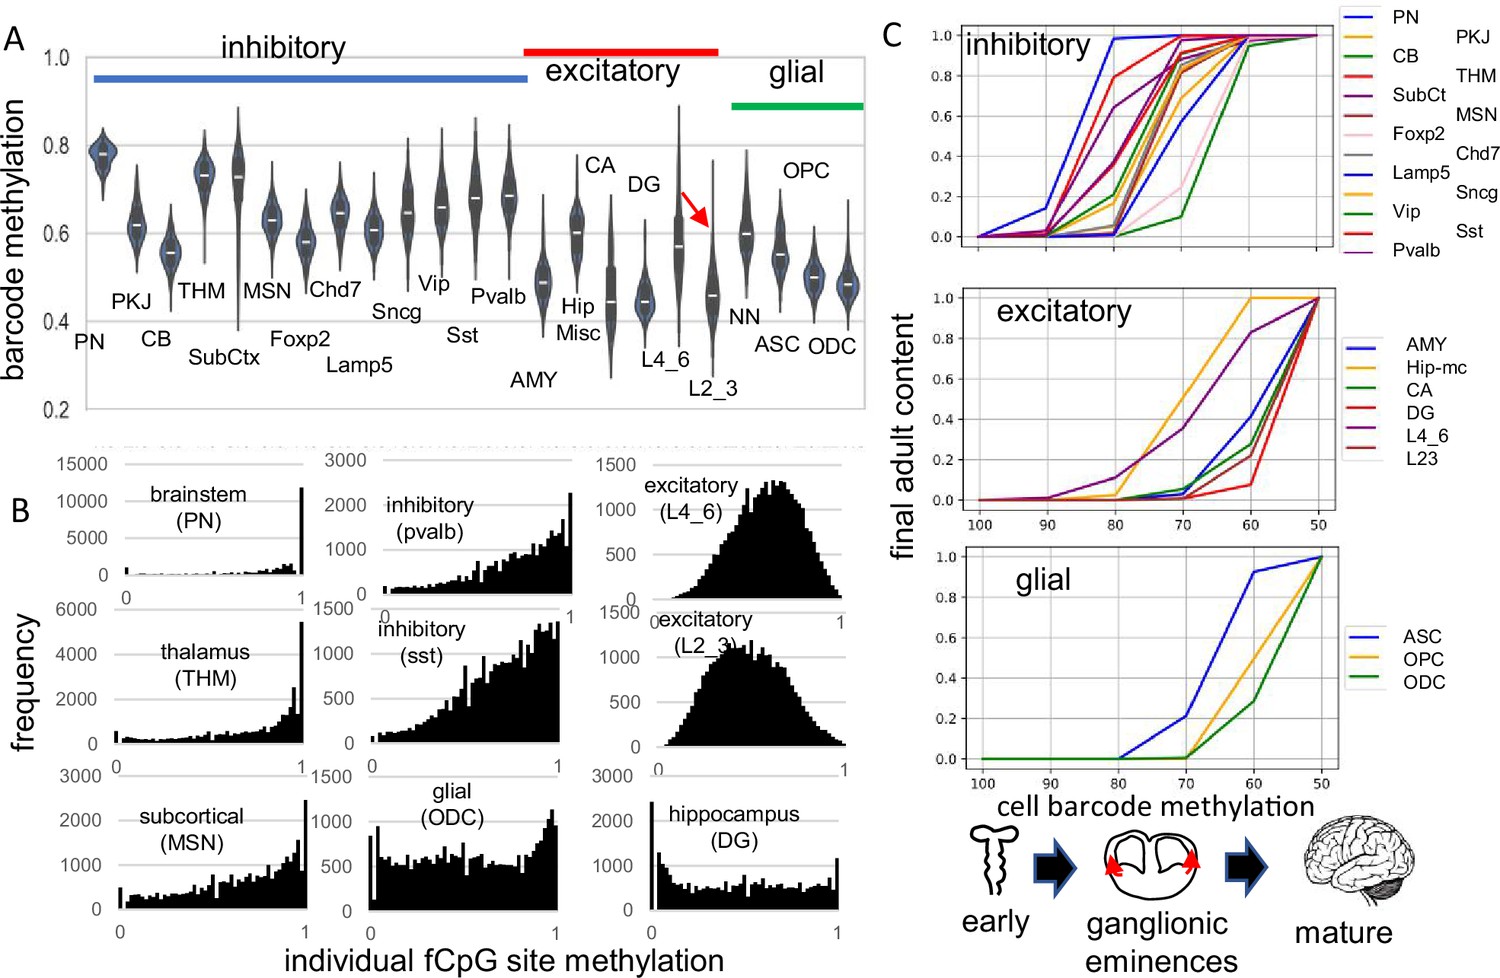
Higher fluctuating CpG (fCpG) barcode methylation in earlier emerging cells PN CB SubCt Foxp2 Lamp5 Vip Pvalb excitatory THM MSN Chd7 Sncg Sst AMY Hip-mc CA DG L4_6 L23 glial cell barcode methylation ASC OPC ODC ganglionic eminences mature.
(A) Average barcode methylation was higher in the brainstem and inhibitory neurons. Barcode methylation was lower for excitatory neurons, cerebellar, and glial cells. Notably, average methylation was lower for outer cortical (L2_3) compared to earlier appearing inner (L4_6) cortical excitatory neurons. Abbreviations are as in reference 3, with L2_3 all outer and L4_6 all inner cortical excitatory neurons, and NN are non-neuronal cells other than ASC, OPC, and ODC. (B) Most fCpGs appear to start methylated in a progenitor because nearly all individual fCpGs are methylated in inhibitory neurons in the subcortex (PN, THM, MSN). Many fCpGs in inhibitory neurons (pvalb, sst) are still predominately methylated. Few fCpGs in excitatory neurons that differentiate later in development are fully methylated. Glial cells that also emerge late in development, and hippocampal cells that may divide postnatally had variable methylation with both highly methylated and unmethylated fCpGs. (C) Barcodes are assumed to become fixed when their cells stop dividing and differentiate. Therefore, barcode methylation levels can indicate when neurons emerge during development, and can be correlated with a cartoon of physical caudal to rostral brain development. The x-axis indicates the barcode methylation of individual cells and is assumed to roughly correlate with calendar time. The y-axis indicates the cumulative proportion of cells of each type present at each methylation level. A value of 0 indicates that cells of given type are not yet present and a value of 1 indicates the adult content of this cell type has been reached. At the start of development, inhibitory neurons (PN) in the pons with highly methylated barcodes appear first. More inhibitory neurons, made in the ganglionic eminences, appear and reach their final adult contents before many cortical excitatory neurons and glial cells appear. Notably, barcode methylation indicates many lower cortical layer neurons appear earlier in life relative to outer cortical neurons that reach adult levels late in development. Brain contents inferred by adult barcodes may differ from actual neonatal brains because neurons that die during development are not sampled in adult brains.
Figure 2—figure supplement 1
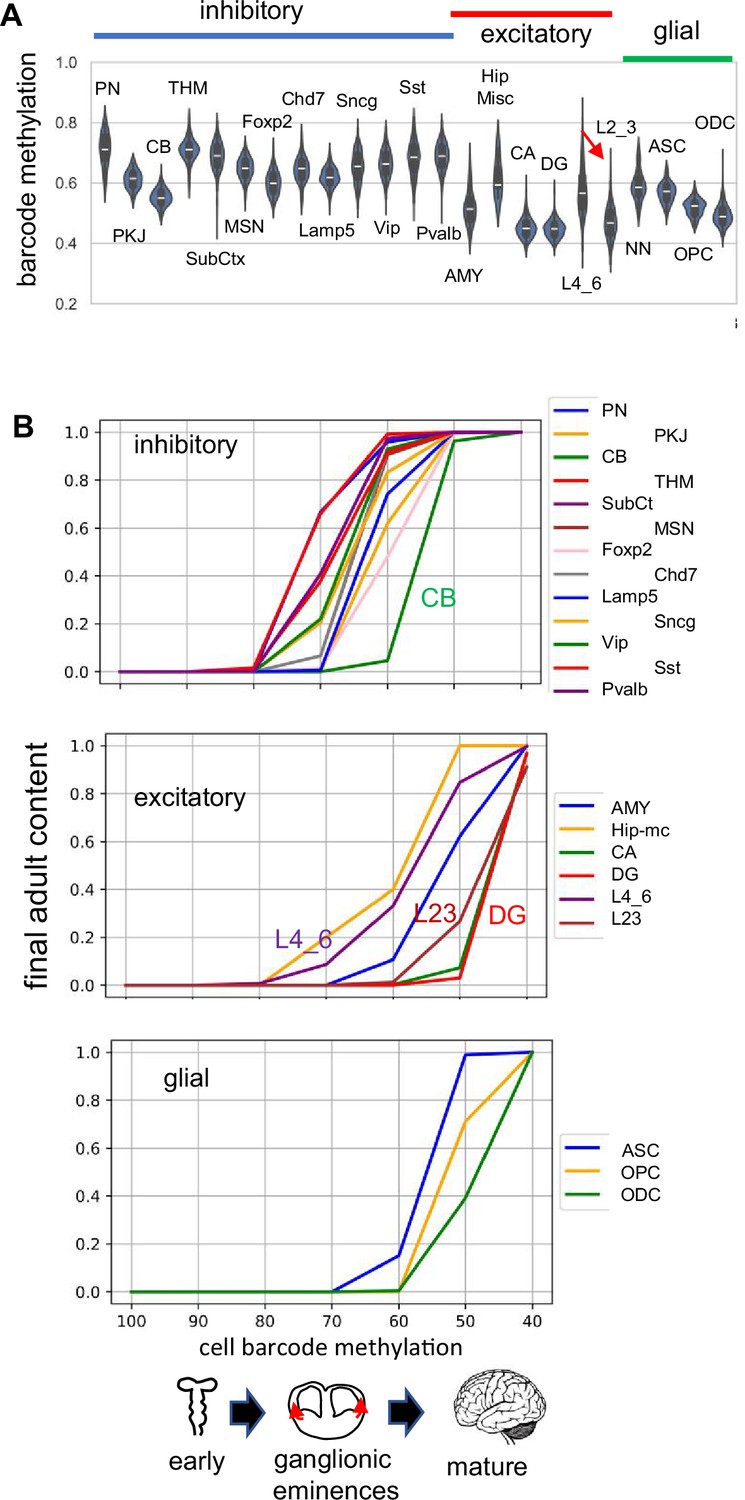
H02 data.
(A) Barcode methylation for different cell types ASC OPC ODC mature (B) Barcode methylation versus final adult brain content indicates that inhibitory neurons appear first and reach their adult levels before excitatory or glial cells.
Figure 2—figure supplement 2
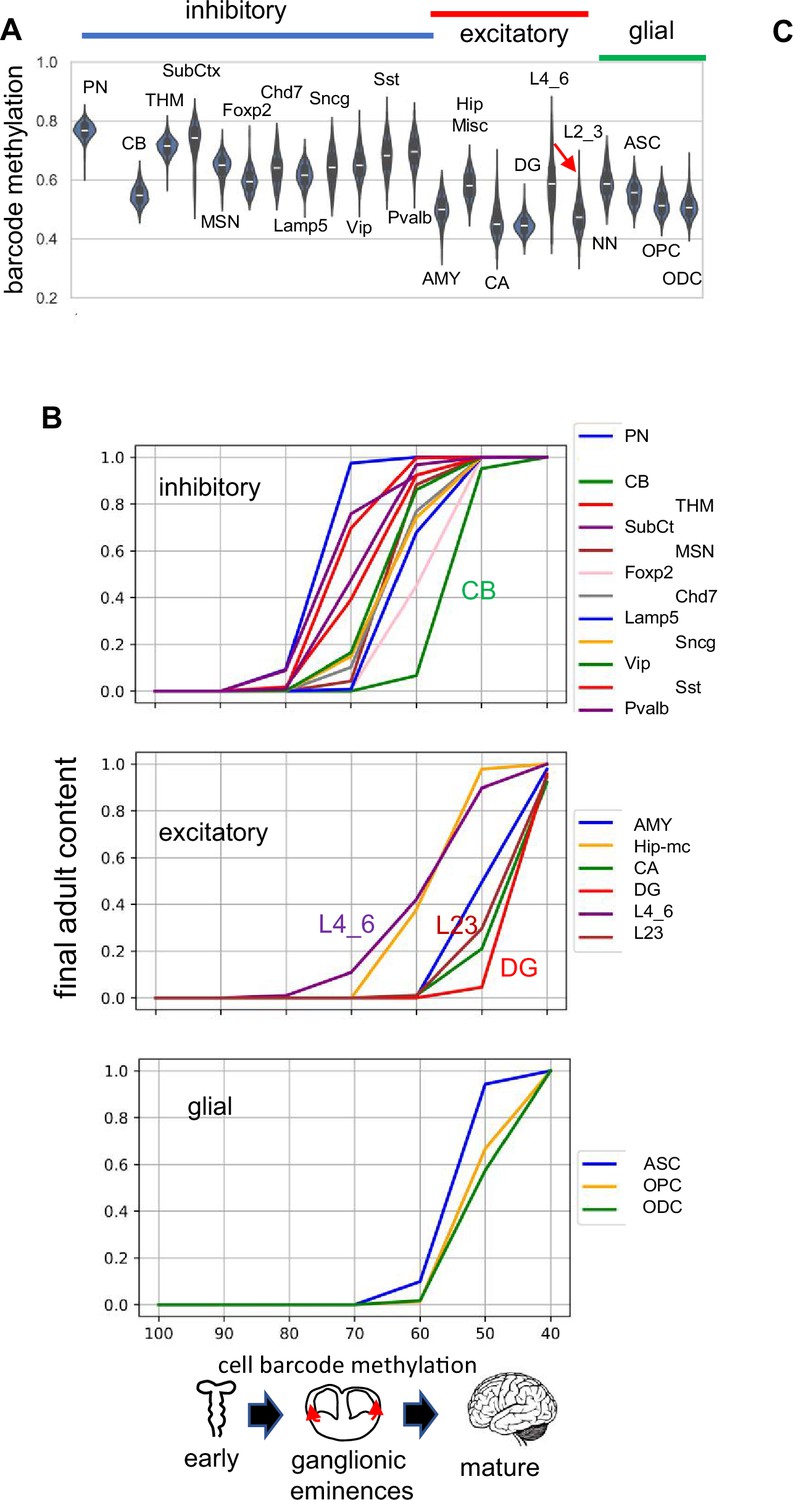
H04 data.
(A) Barcode methylation for different cell types (B) Barcode methylation versus final adult brain content indicates that inhibitory neurons appear first and reach their adult levels before excitatory or glial cells.
Figure 3 with 3 supplements

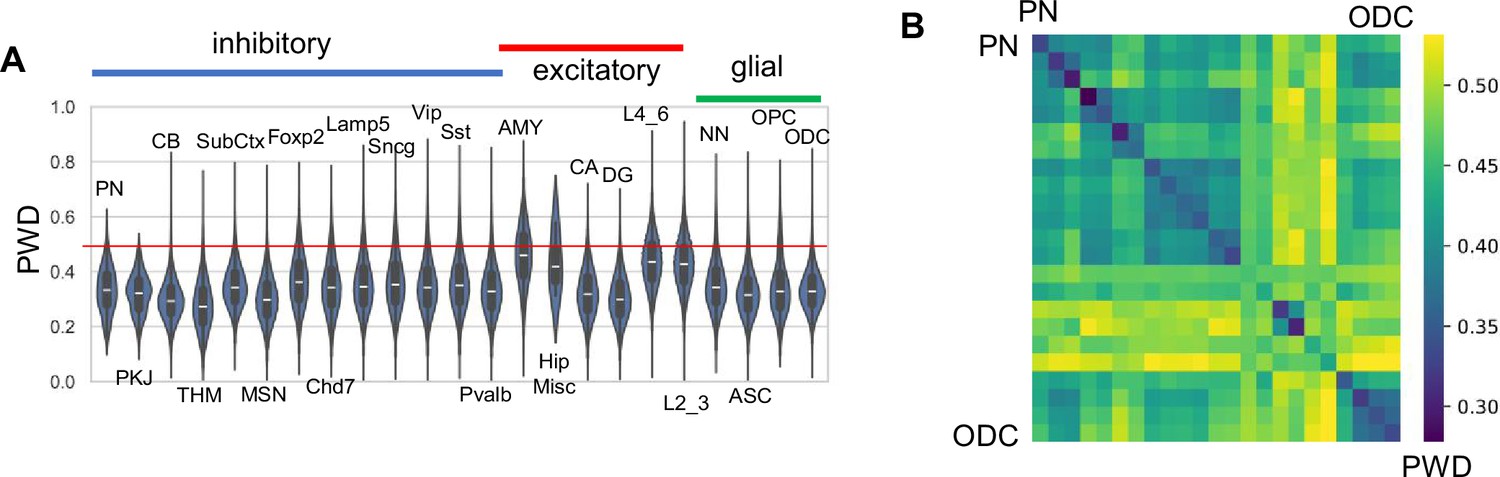
Related cell pairs.
(A) Most cells had different barcodes with average pairwise differences (PWDs) between cell pairs of ~0.5. Cell pairs of the same phenotype had different barcodes but were on average more related to each other. (B) Heatmap showing that cells of the same phenotype are more related. (C) Cells that emerge early in development are more related and more methylated. Closely related nearest neighbors (PWD <0.05) are numerically more common for more methylated cell types.
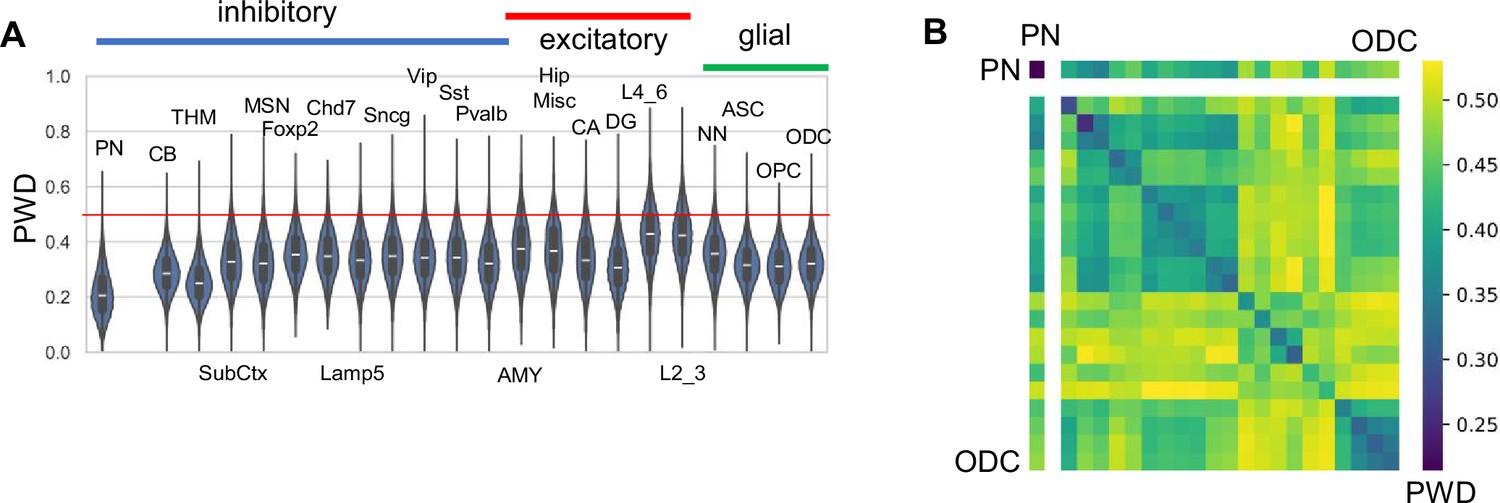
Figure 3—figure supplement 1
H02 data.
(A) Pairwise differences (PWDs) between cells of the same type. (B) PWDs between cell types (order of cell types is the same as in ‘A’).
Figure 3—figure supplement 2
H04 data.
(A) Pairwise differences (PWDs) between cells of the same type.(B) PWDs between cell types (order of cell types is the same as in ‘A’).
Figure 3—figure supplement 3

Brain tumor fCpG methylation: fCpG sites were matched with brain tumor data from methylation arrays.
Average methylation is displayed for each brain tumor sample. PA=pilocytic astrocytoma, GSE44684, 145 fCpGs covered; MB=medulloblastoma, GSE193646, 434f CpGs covered; MB=medulloblastoma, GSE63669, 883 fCpGs covered; GBM=glioblastoma multiforme, GSE109399, 1,138 fCpGs covered; Gliomas=various gliomas, GSE248471, 1,138 fCpGs covered. Includes both male and female tumors.
Figure 4 with 2 supplements
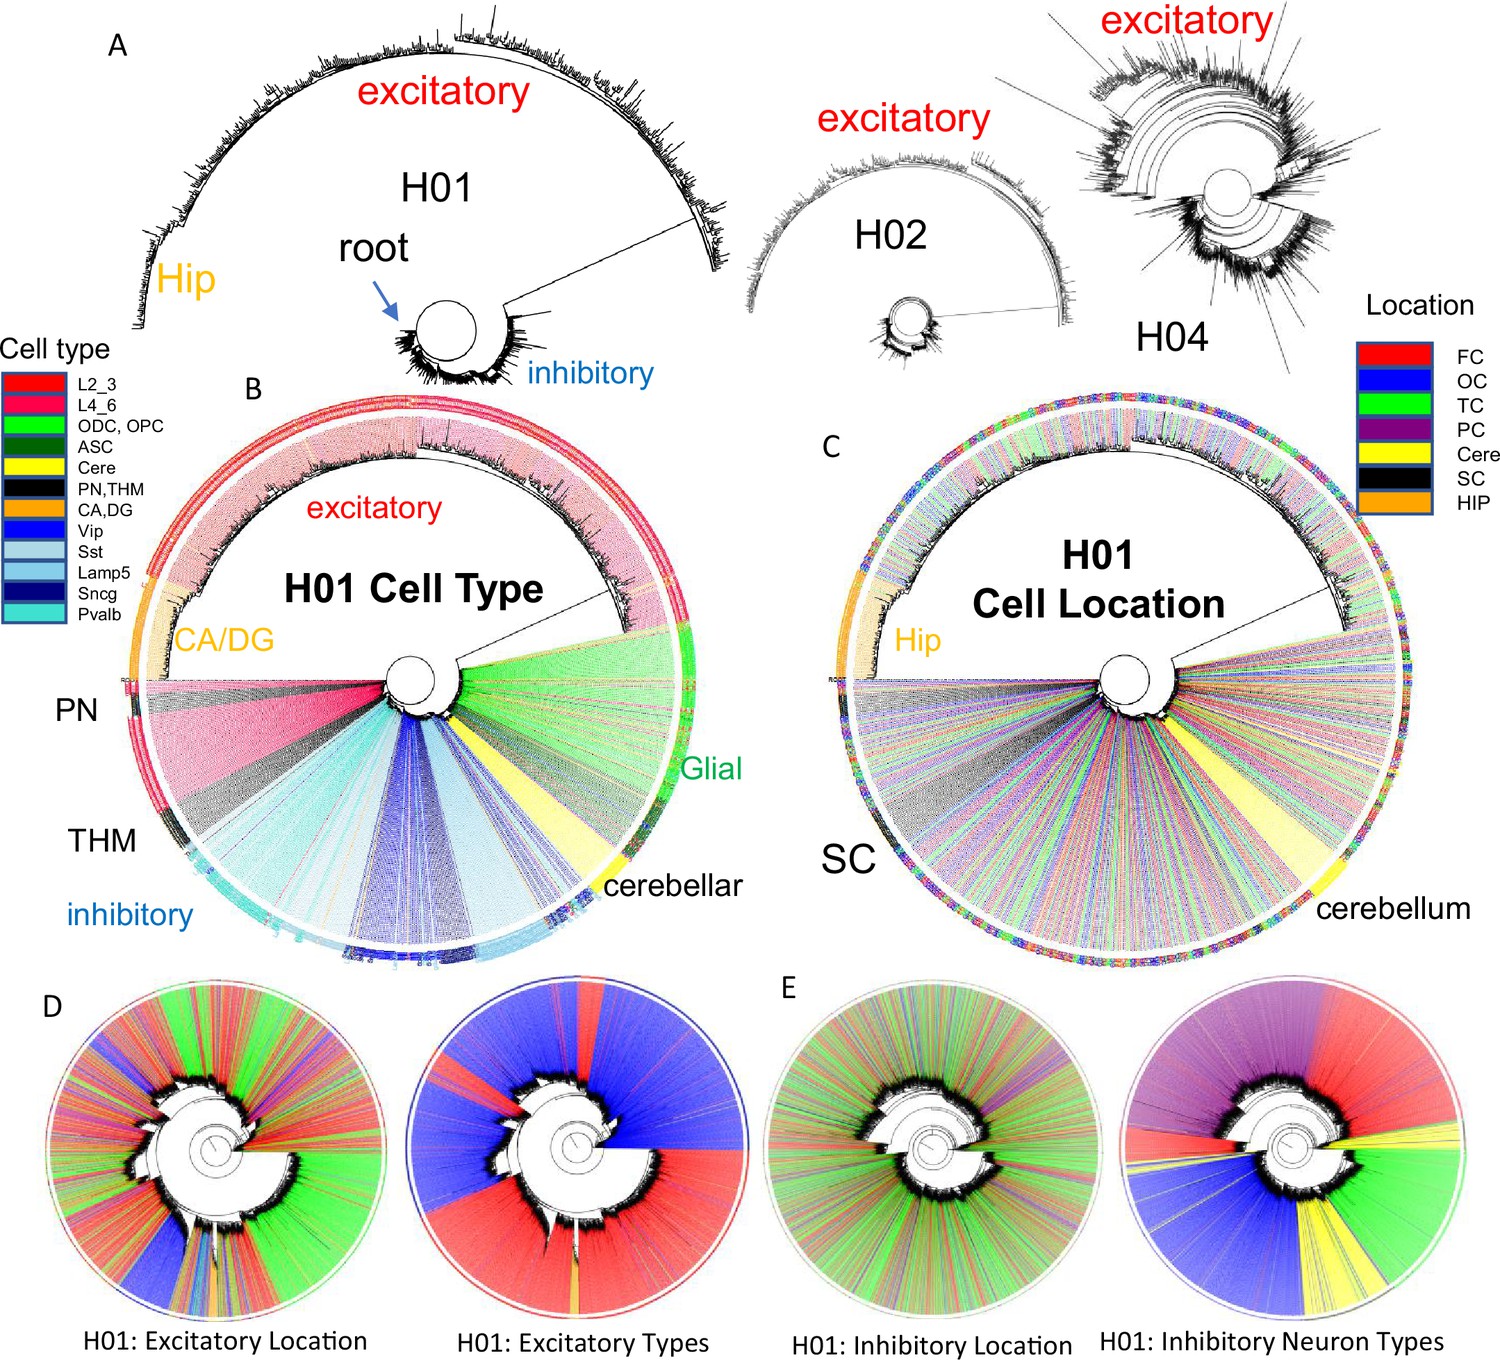
Brain trees.
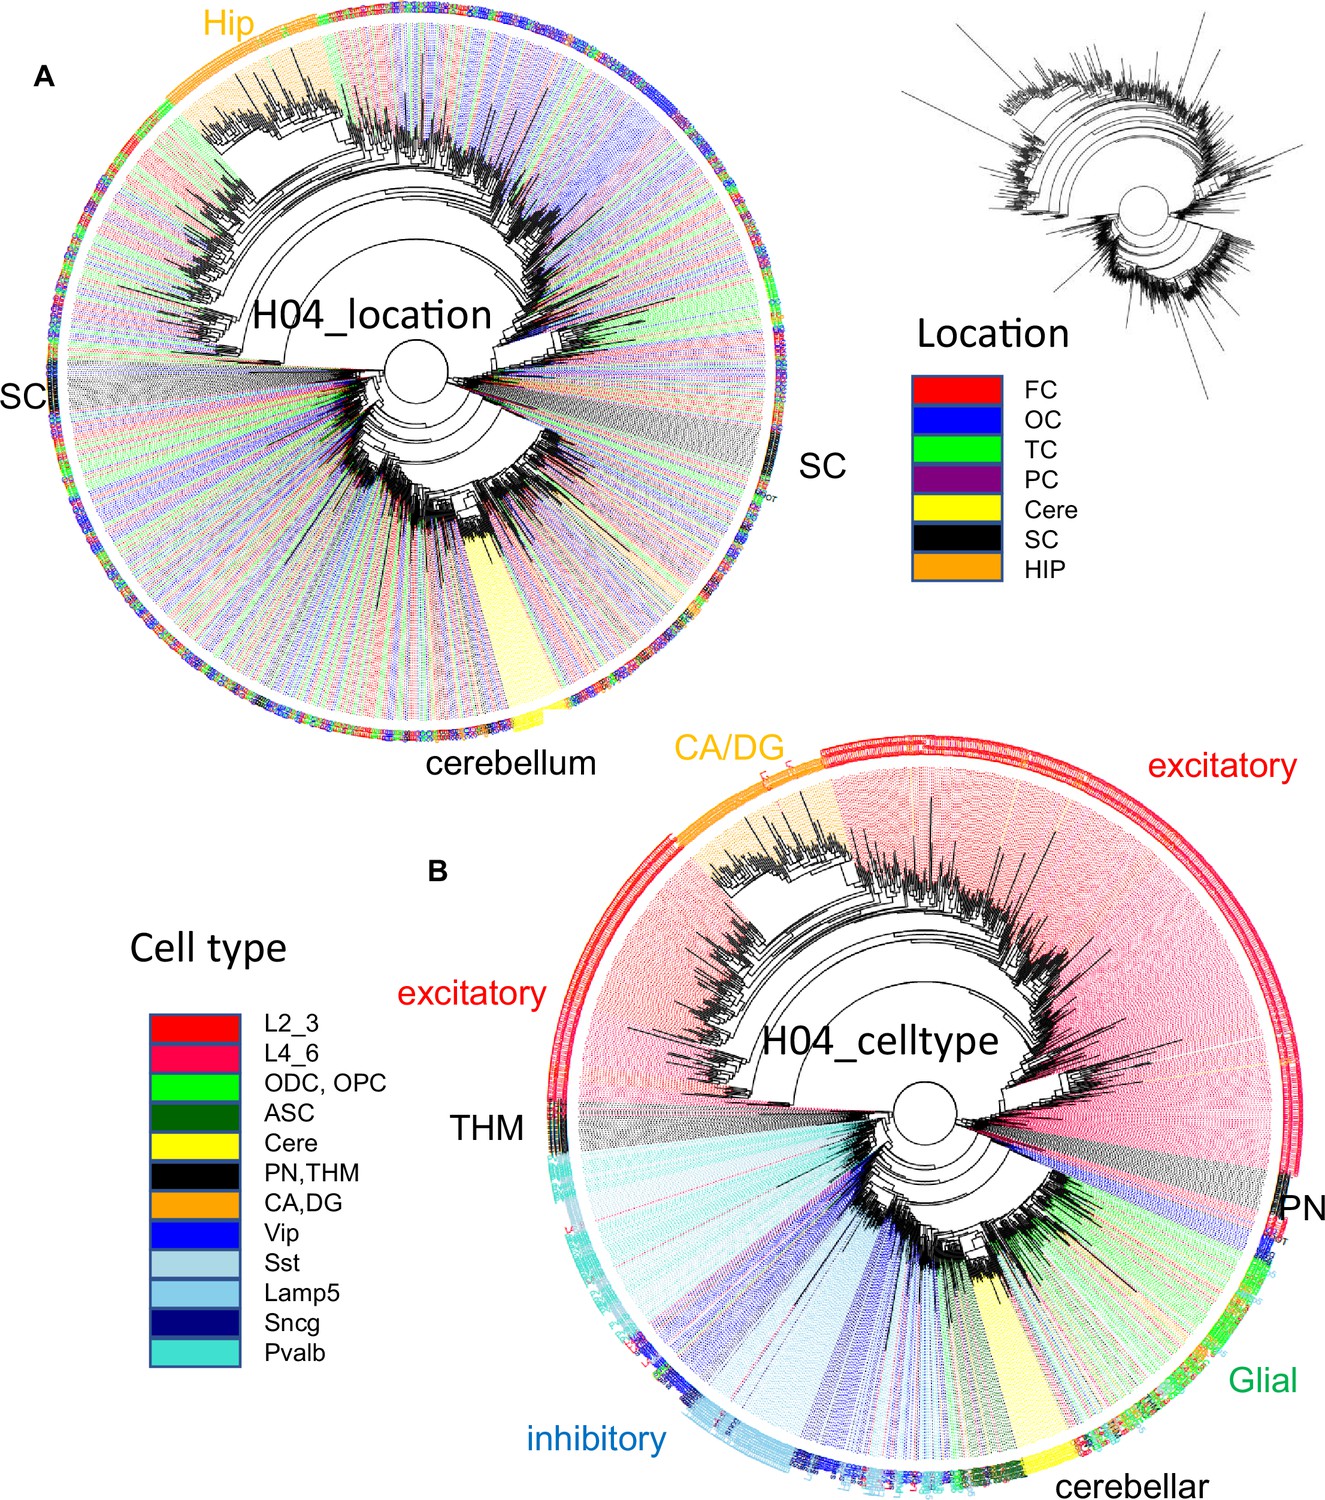
(A) Barcodes from 960 cells form trees using IQtree (Nguyen et al., 2015) that are rooted by a fully methylated progenitor, and generally follow caudal to rostral brain development, with sequential branching of inhibitory neurons, cerebellar neurons, and excitatory neurons, with hippocampal neurons furthest from the start. Trees are similar between the brains, with H04 inferring less distance between inhibitory and excitatory lineages. The trees illustrate the ability to produce phylogenies with IQtree, but the phylogenies are limited by sparse cell sampling and that barcodes may be similar by chance. The degree of confidence was generally low, with bootstrap branch support typically less than 15%. (B) H01 tree with labeled cell types. Neuron types generally clustered by phenotypes with closely branching excitatory and inhibitory neurons more common earlier in development. (C) H01 tree with labeled cell locations. Related inhibitory and excitatory neurons can be found in different parts of the brain FC = frontal (red), TC = temporal, OC = occipital (blue), PC = parietal, HIP = hippocampus (orange), cere = cerebellum (yellow), SC = subcortical (black). (D) H01 tree with ~2853 cortical excitatory neurons has more evidence of localized radial migration because related neurons are more often found in the same cortical region. Excitatory neurons cluster by subtype, and closely related lower and upper excitatory neurons were still few. (E) H01 tree with ~2847 cortical inhibitory neurons still retains evidence of tangential migration with related neurons scattered throughout the cortex. Inhibitory neurons cluster by subtype with switching between some closely related pairs.
Figure 4—figure supplement 1
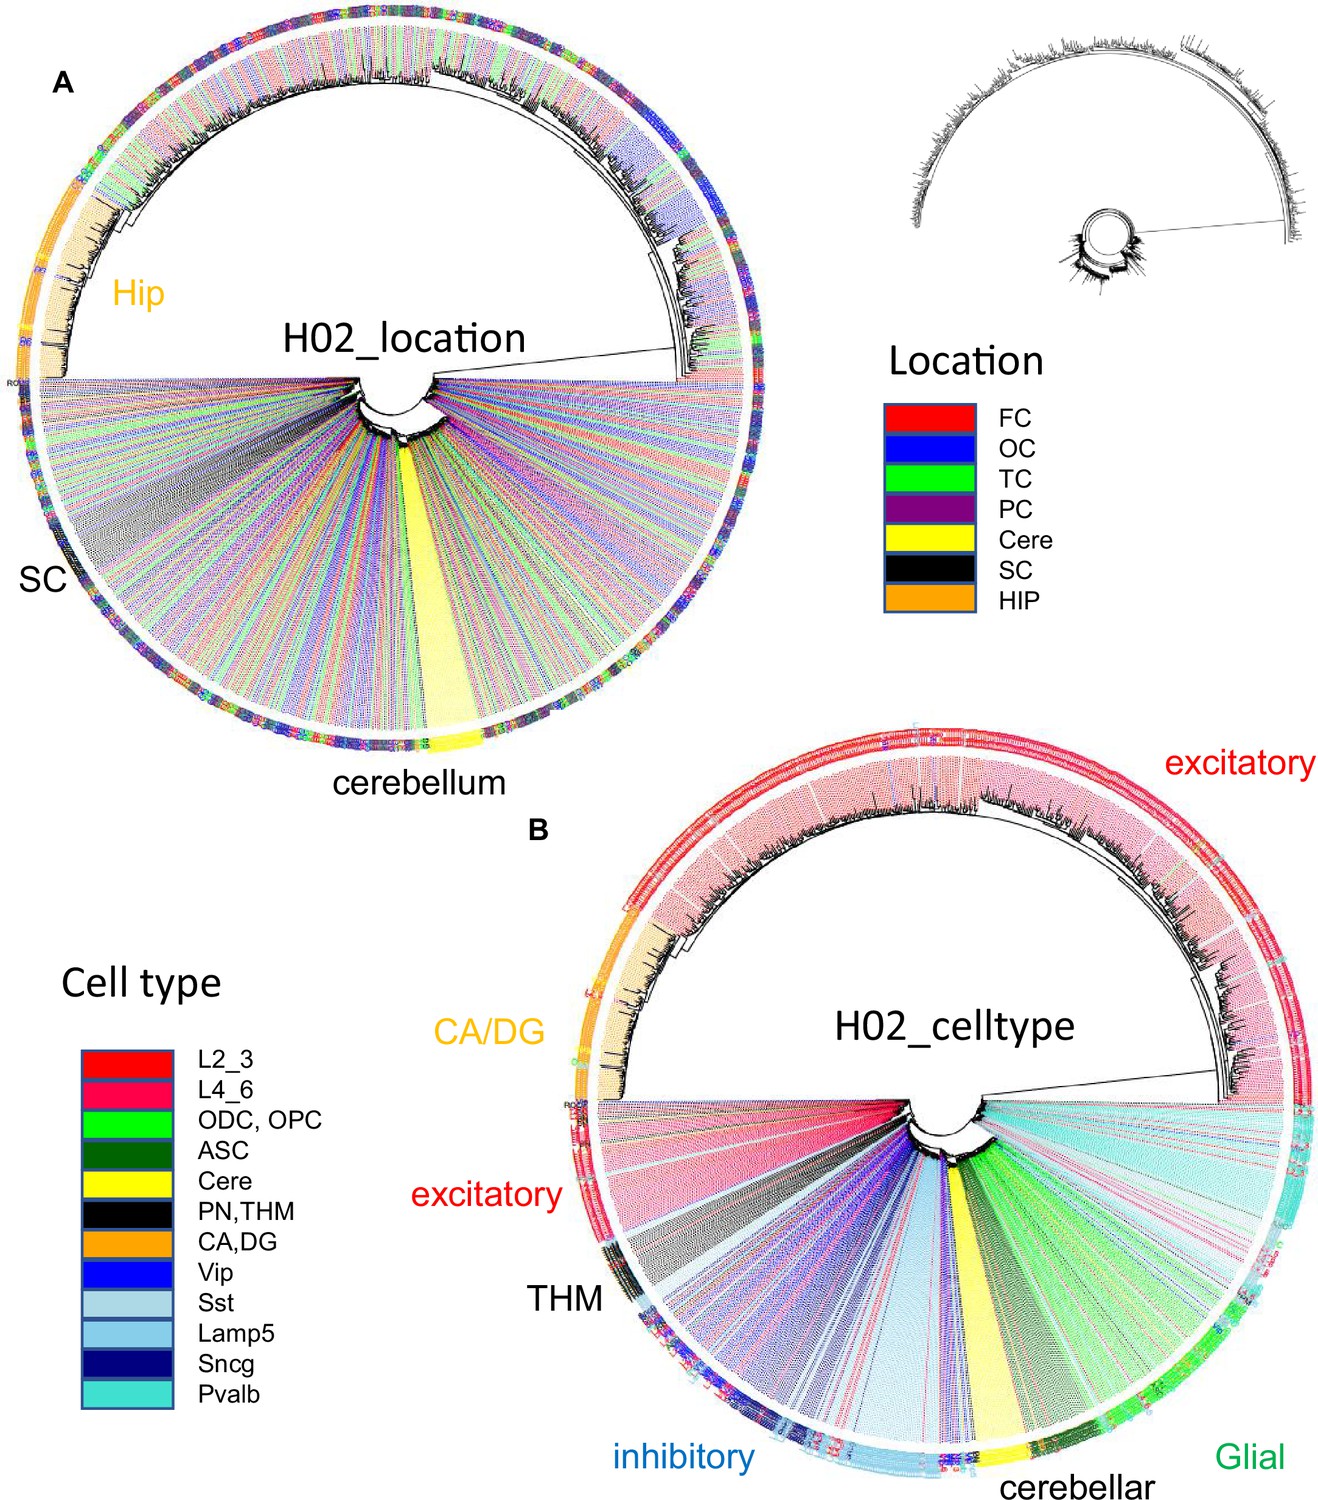
H02 data.
(A) Ancestral tree with 1001 cells rooted at a fully methylated progenitor shows sequential branching with excitatory, then brain stem, inhibitory and cerebellar neurons, then glial cells, and finally excitatory neurons with hippocampal neurons at the end. (B) Related cells colocalize for brain stem, cerebellar, and hippocampal neurons. Inhibitory neurons are more scattered. Excitatory neurons are also scattered with some localization within the cortex.
Figure 4—figure supplement 2
H04 data.
(A) Ancestral tree with 1033 cells rooted at a fully methylated progenitor shows sequential branching with excitatory, then brain stem, inhibitory and cerebellar neurons, then glial cells, and finally excitatory neurons with hippocampal neurons at the end. (B) Related cells colocalize for brain stem, cerebellar, and hippocampal neurons. Inhibitory neurons are more scattered. Excitatory neurons are also scattered with some localization within the cortex.
Figure 5 with 2 supplements
Lineage fidelity, migration, and differentiation.
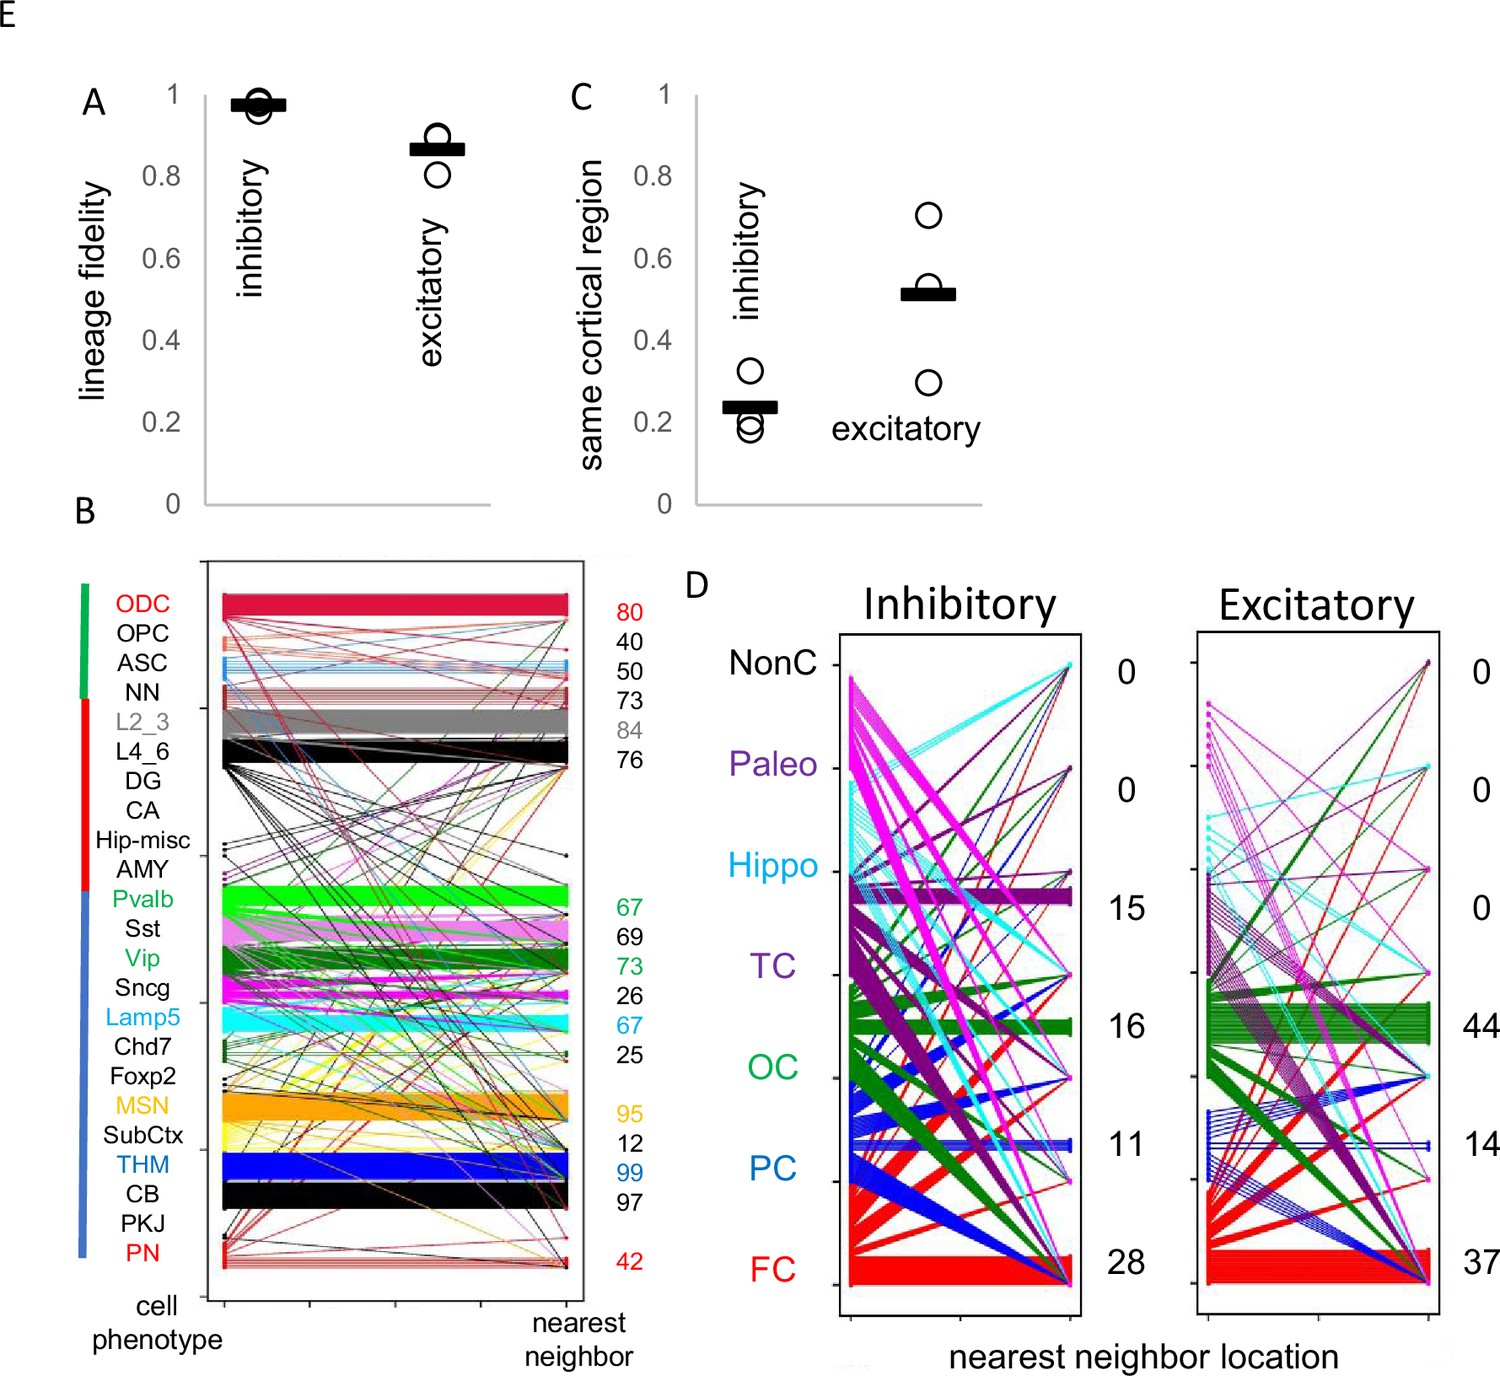
(A) Inhibitory neurons have higher lineage fidelity because nearest neighbor pairs (pairwise difference, PWD <0.05) were nearly always both inhibitory neurons. Excitatory neurons had slightly less lineage fidelity because a nearest neighbor was more often an inhibitory neuron. Data are for all three brains. (B) Nearest neighbor inhibitory neuron pairs often had subtype differences. More lineage fidelity was generally present for subcortical and excitatory neurons. Numbers indicate percent lineage subtype fidelity. (C) Nearest neighbor inhibitory and excitatory neuron pairs showed evidence of tangential migration because they were found in different cortical regions. The data indicate greater evidence of inhibitory neuron tangential migration than for excitatory neurons. However, the extent of migration is uncertain because of sparse sampling and because barcodes may be similar by chance. Data are for all three brains. (D) Nearest neighbor neurons were scattered in the cortex. Numbers indicate percent location fidelity. (NonC = non-cortical location, Paleo = paleocortex).
Figure 5—figure supplement 1
H02 data.
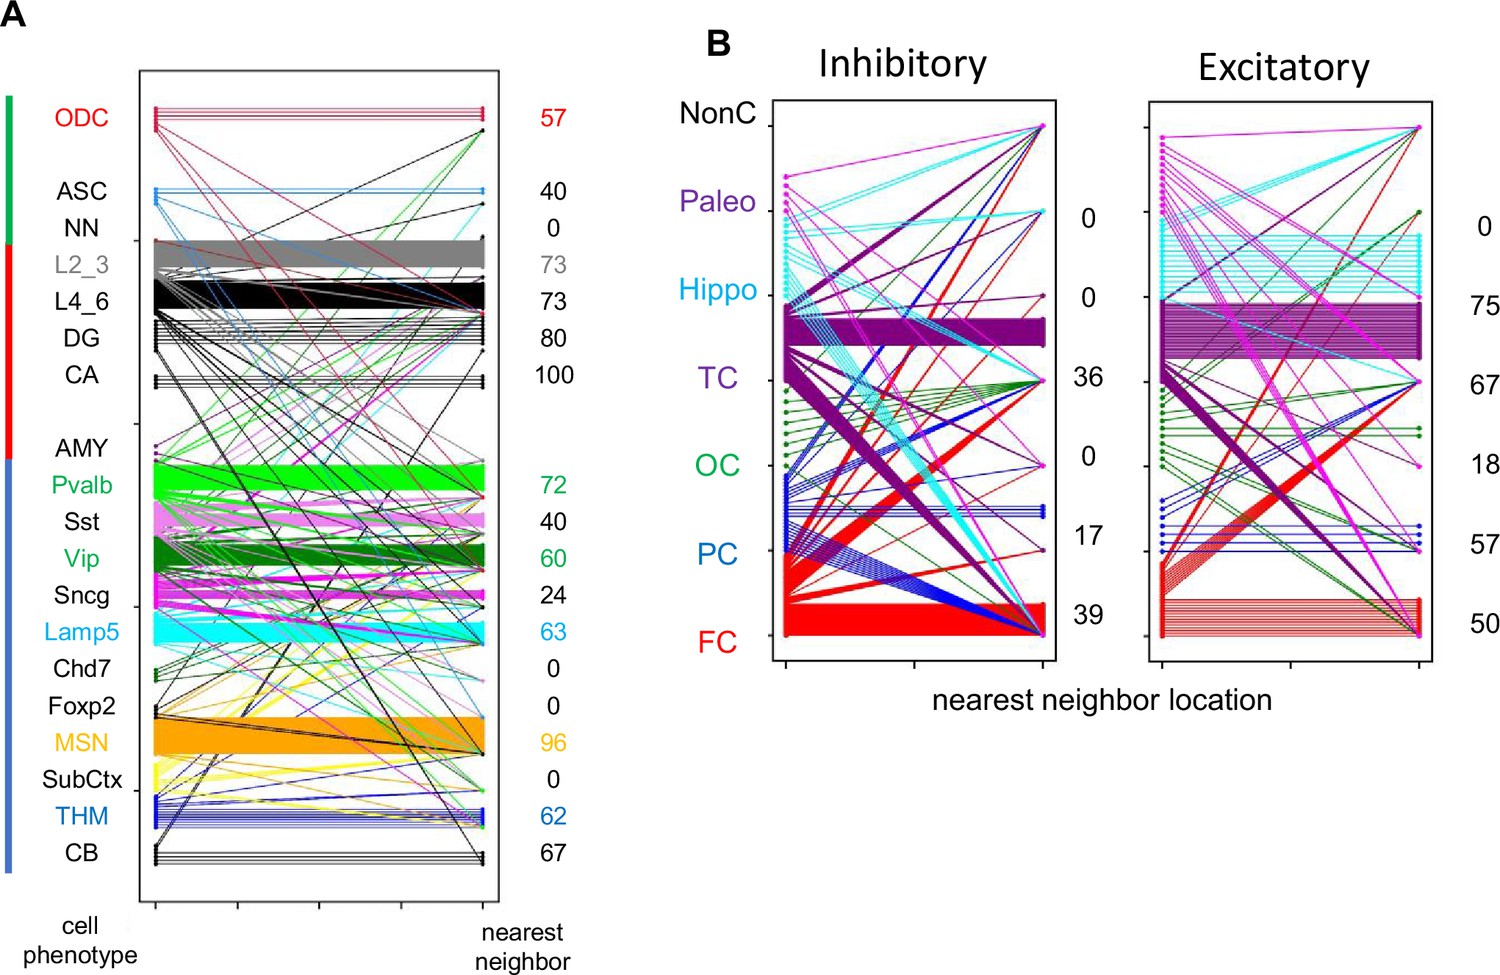
(A) Lineage cell type fidelity between nearest neighbor pairs (pairwise difference, PWD <0.05). Numbers on the right (percentage) indicate how often a closely related cells has the same cell phenotype (B) Location fidelity between nearest neighbor pairs (PWD <0.05). Numbers on the right (percentage) indicate how often a closely related cell is located in the same cortical region. NonC indicates the closely related cell was found outside the cortex.
Figure 5—figure supplement 2
H04 data.
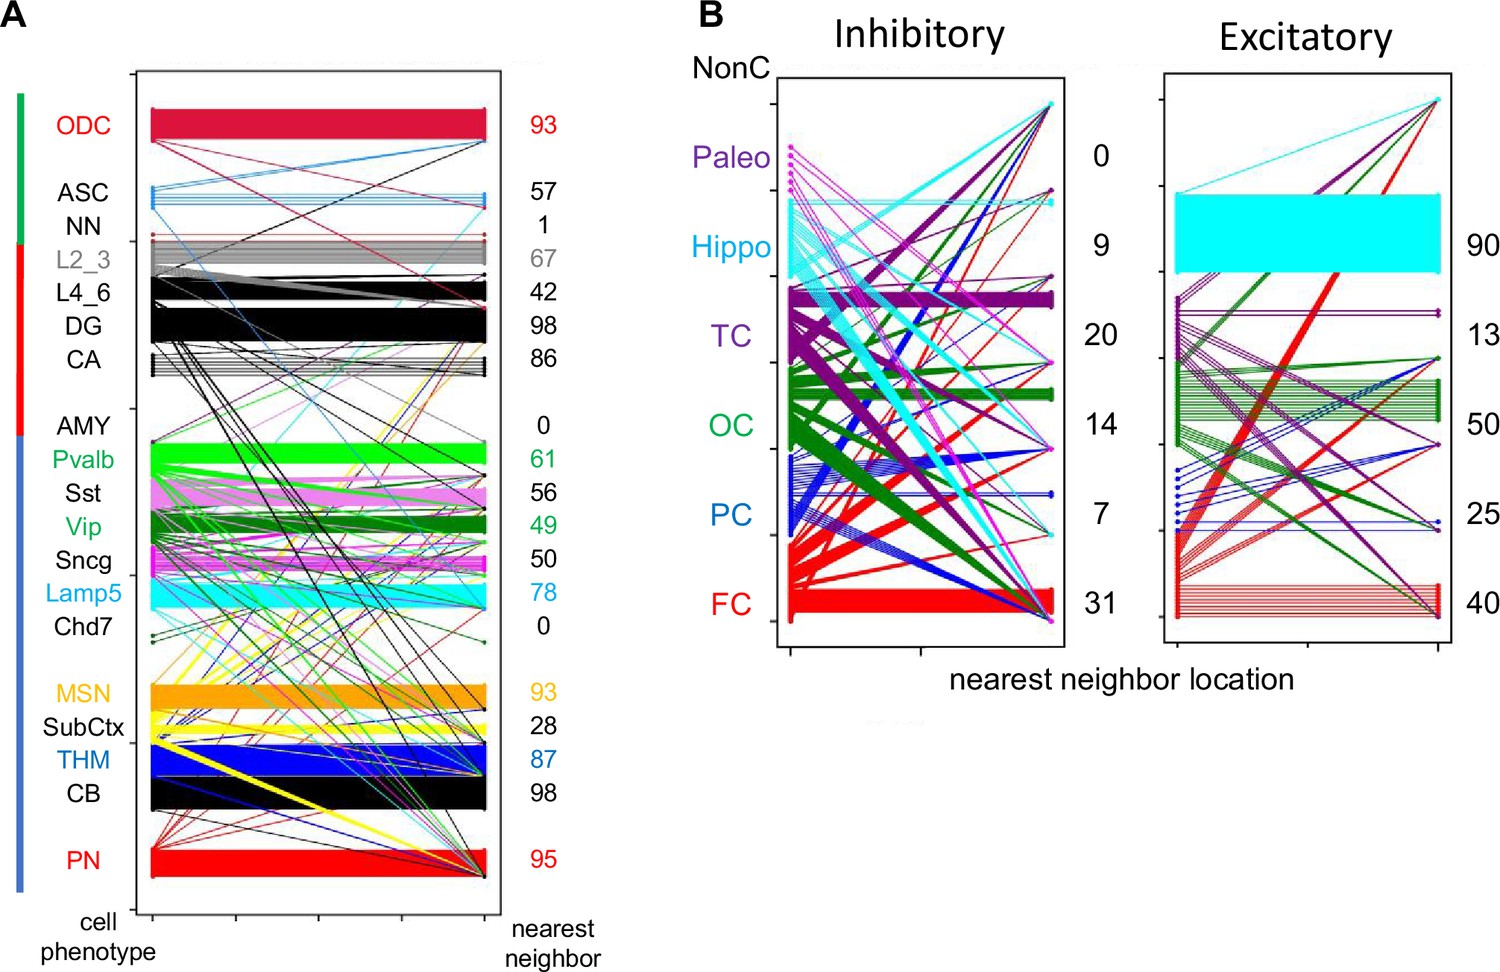
(A) Lineage cell type fidelity between nearest neighbor pairs (pairwise difference, PWD <0.05). Numbers on the right (percentage) indicate how often a closely related cells has the same cell phenotype (B) Location fidelity between nearest neighbor pairs (PWD <0.05). Numbers on the right (percentage) indicate how often a closely related cell is located in the same cortical region. NonC indicates the closely related cell was found outside the cortex.
Appendix 1—figure 1
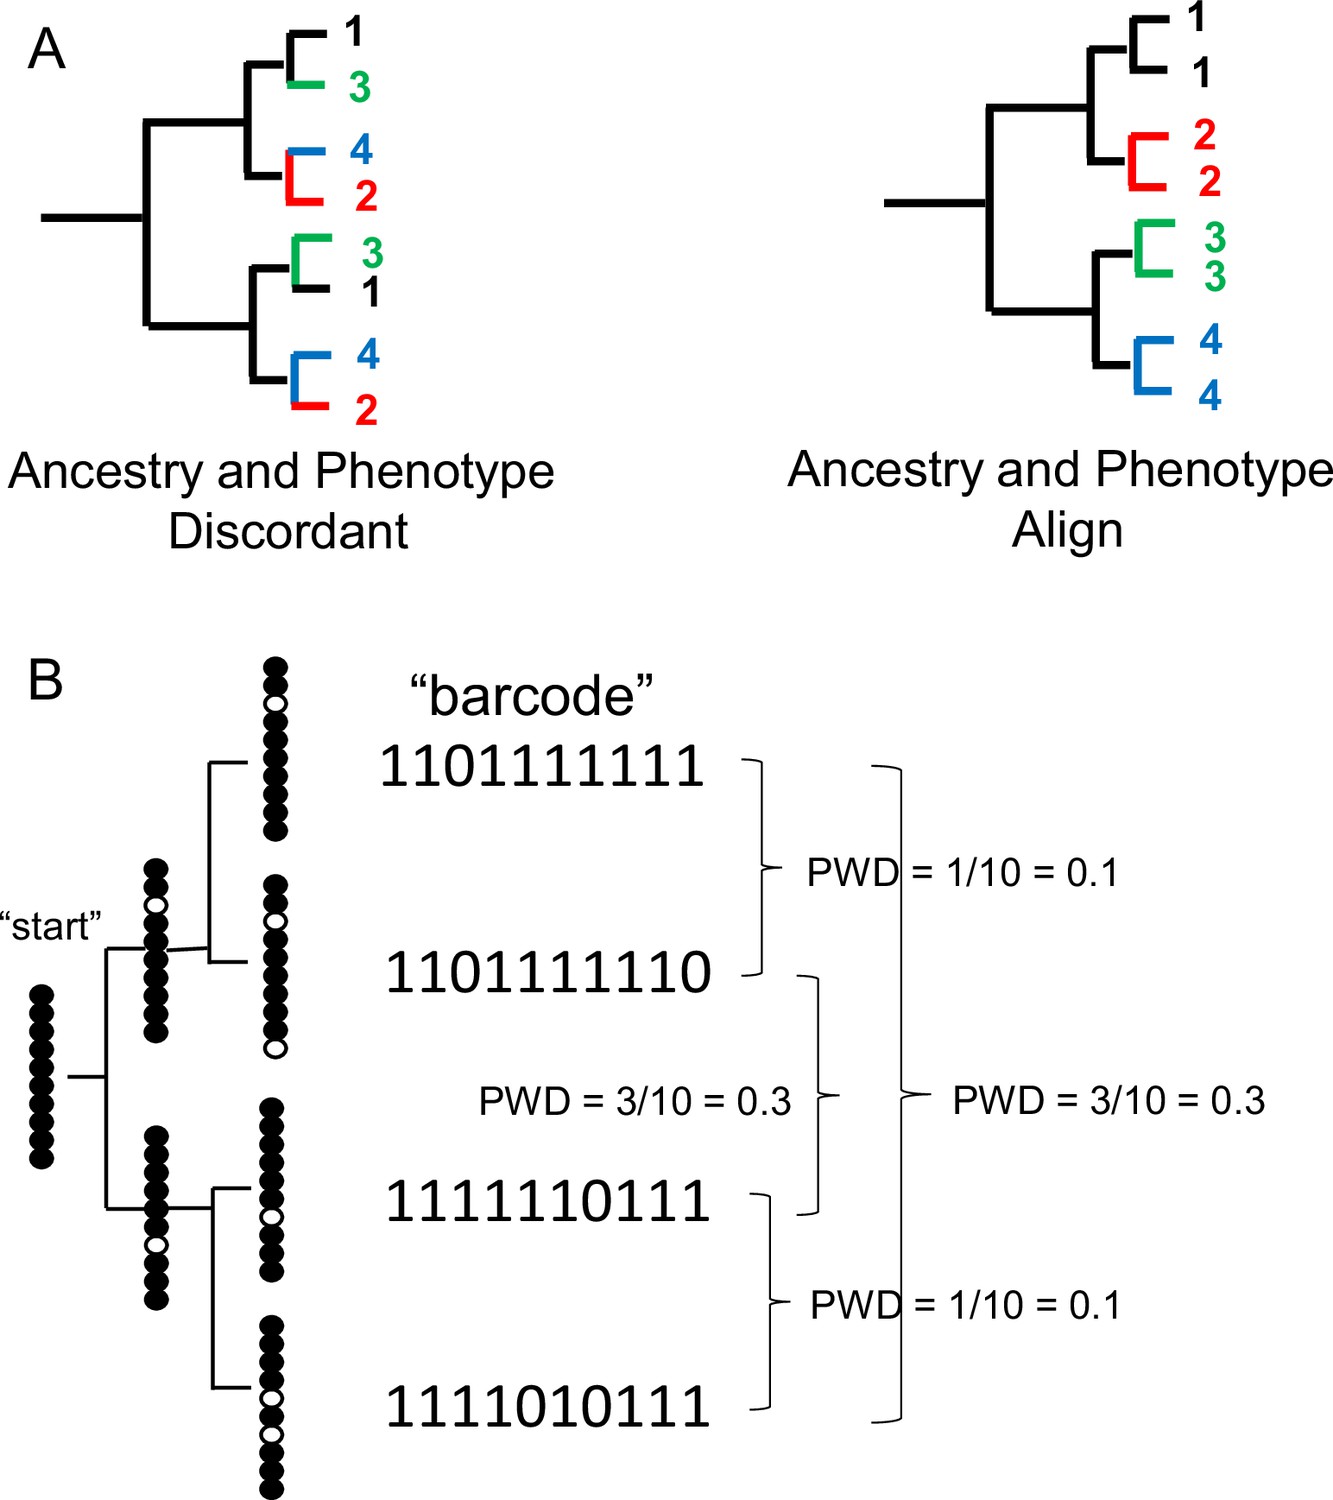
Single cell lineage tracing with dynamic fCpG barcodes.
(A) Trees can be reconstructed by comparing phenotypes or by comparing genomic differences such as fluctuating CpG (fCpG) barcodes. Ancestry and phenotypes may be discordant if progenitor cells produce cells of different phenotypes. More typically, ancestry and phenotypes align because cells with the same phenotypes tend to have common progenitors. For the single-cell brain data, ancestry and phenotype align because cells of the same type are generally more closely related. (B) fCpG barcodes appear to start predominately methylated in the progenitor cell. With division, random replication error occur and are propagated to daughter cells. Counting and then averaging the differences between fCpG sites yields an average pairwise distance (pairwise difference, PWD, range 0–1). More related daughter cells tend to have lower PWDs, but barcodes may also match by chance.
Appendix 1—figure 2
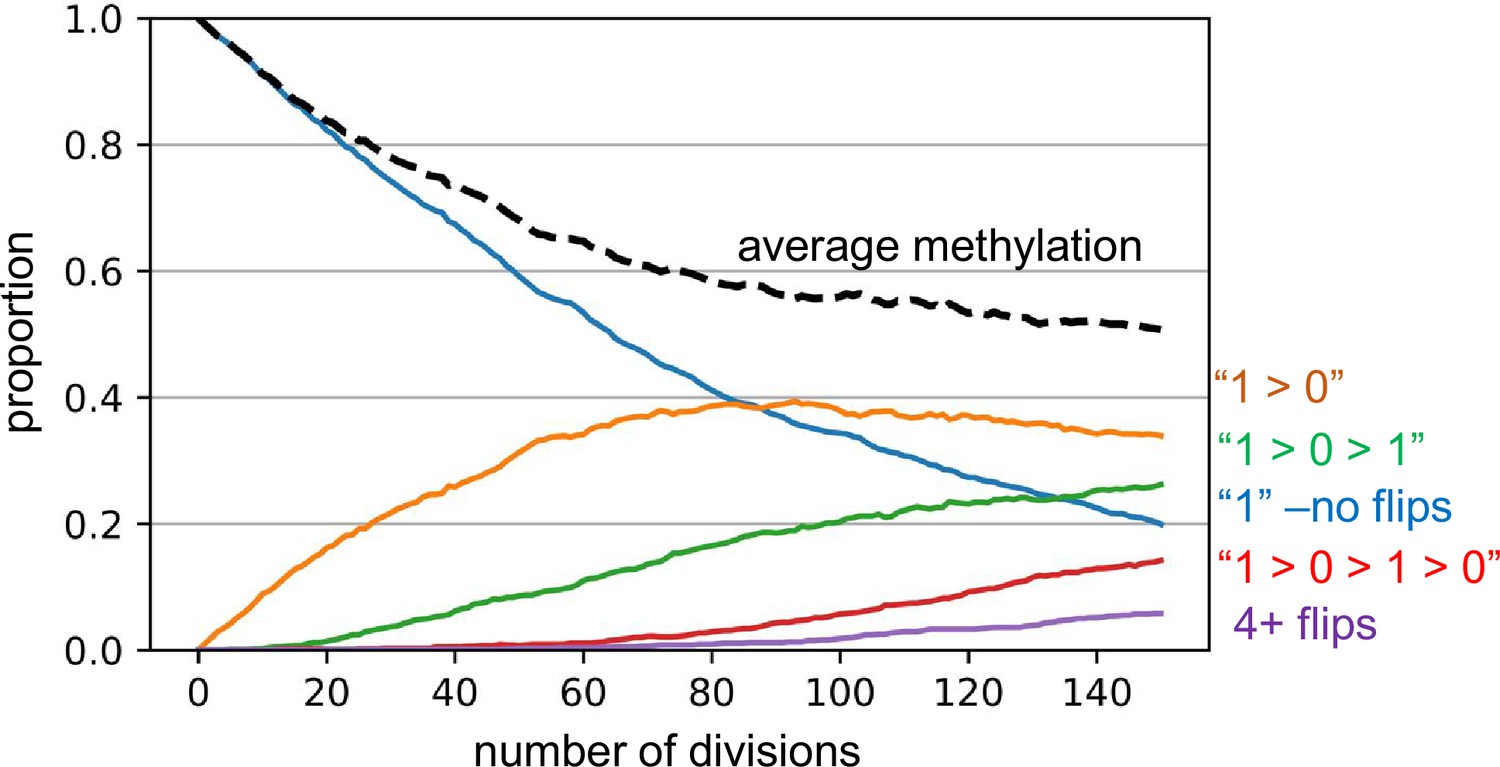
Barcode dynamics.
Simulations broadly consistent with the experimental data indicate a replication error rate of 0.01 per fluctuating CpG (fCpG) site per division, with equal probabilities of changes or flips from methylated to demethylated (1>0) and from 0>1. A simulation for excitatory neurogenesis is shown, where simplistically, excitatory neurons cease division and appear after 150 divisions. The graph displays how individual fCpG sites change through time. The fCpG barcode starts methylated, and barcode methylation decreases with divisions. Even with an error rate of 0.01, after 150 divisions only about 5% of fCpG sites experience four or more flips, and half have had zero or only a single flip. A fCpG barcode can still effectively distinguish between cells if the flips are random and multiple fCpG sites are compared between cells. Although backflips complicate analysis, the large numbers of replication errors facilitate comparisons between neurons that develop during a short prenatal interval.
Appendix 1—figure 3
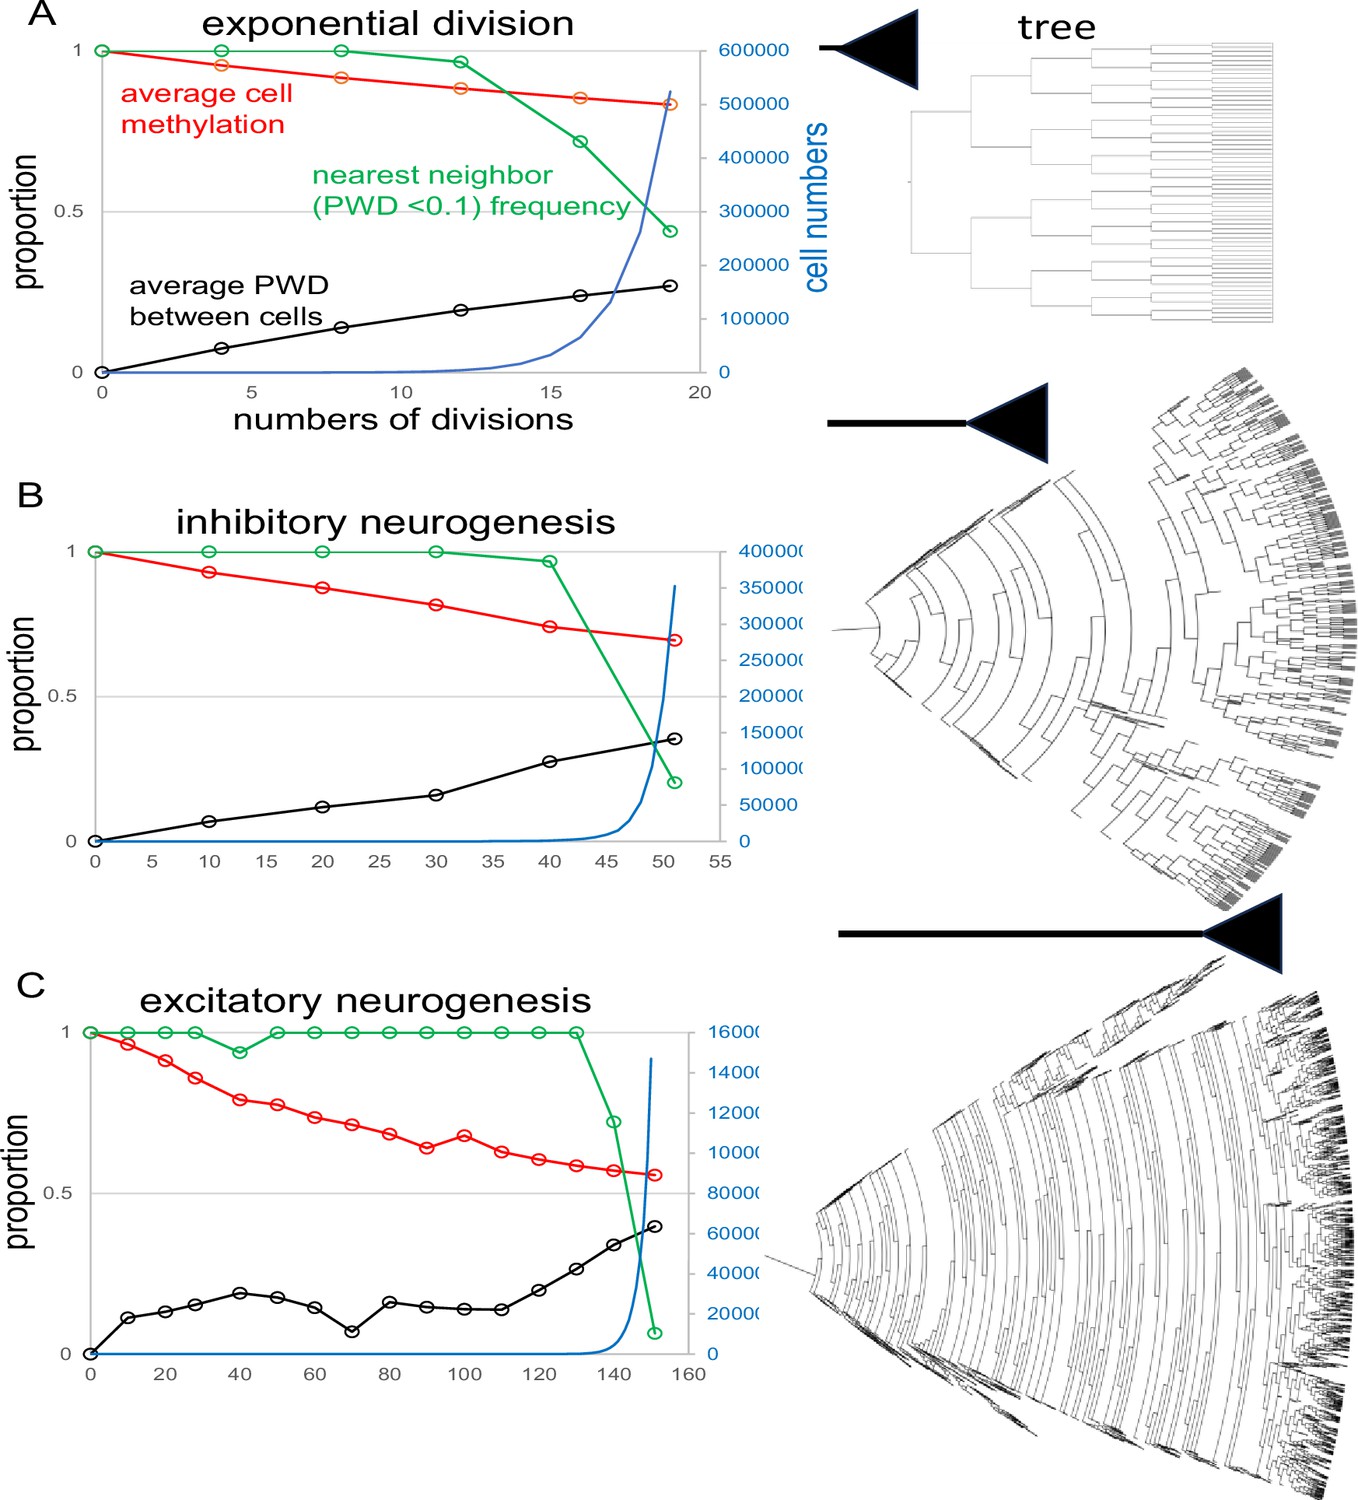
Fluctuating CpG (fCpG) barcode simulations.
The simulations start with a single progenitor and a fully methylated barcode with 200 fCpG sites and an error rate of 0.01 per division. At each time point, up to 1000 cells are sampled from the population to calculate fCpG barcode average methylation, average pairwise difference (PWD), and cell proportions with a nearest neighbor with a PWD <0.1. Final tree expansions are truncated to allow for visualization. A range of simulations are broadly consistent with the experimental data. (A) Simulation of exponential growth where each cell yields two daughter cells broadly models early hindbrain neurogenesis. After 19 divisions, average barcode methylation is ~0.83, PWD is ~0.27, and among the 1000 sampled cells, for about 44% of cells there is another cell with a similar barcode (PWD <0.1). (B) Simulation of inhibitory neurogenesis with differentiation after 50 divisions. Early divisions are characterized by cell death (zero or one daughter, represented by dead ends in the tree), with terminal growth. After 50 divisions, average barcode methylation is ~0.69, average PWD is 0.35, and 20% of sampled cells have a nearest neighbor (PWD <0.1) C: Simulations of excitatory neurogenesis with differentiation after 150 divisions. As with inhibitory neurogenesis, cell death during early divisions limits population size before terminal expansion. After 150 divisions, average methylation is ~0.56, PWD is ~0.4, and ~6% of cells have a nearest neighbor (PWD <0.1) among the 1000 sampled cells.
Appendix 1—figure 4
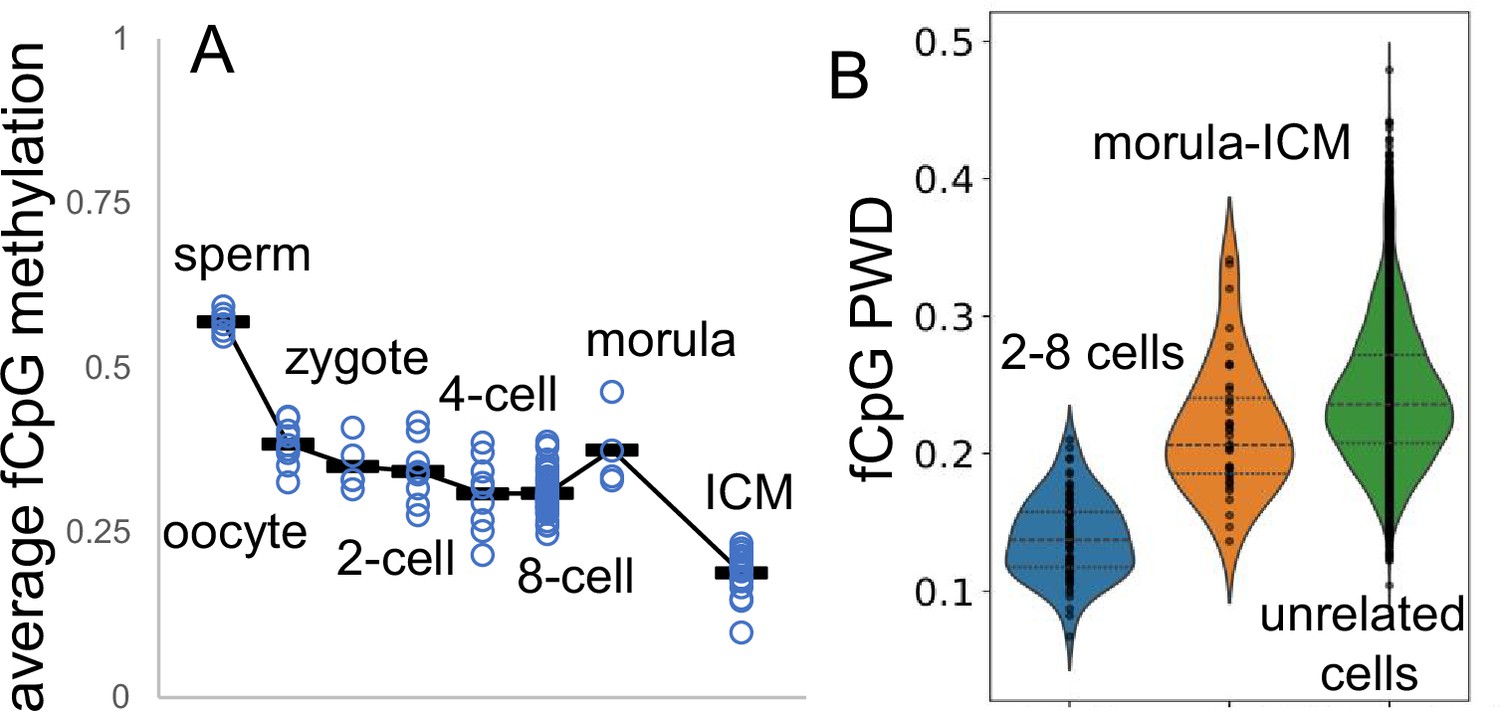
Fluctuating CpG (fCpG) barcodes at conception, when germline methylation is erased by active and passive demethylation.
Whole genome bisulfite single-cell sequencing data are from GSE100272. Male cells were inferred from a paucity of Y chromosome reads. (A) fCpG methylation generally decreases during early development. fCpG barcode methylation is highest in sperm, albeit sperm X chromosomes yield female zygotes. A brain cell progenitor with predominately methylated fCpGs was not evident. (B) Unlike at the start of brain development, fCpG barcodes early in life are polymorphic between unrelated embryos. However, fCpG barcodes are more similar between related cells in 2–8 cell embryos, and less similar between cells in morulae and the ICM. Dots indicate values of cell pairs, with a minimum of 25 comparable fCpG sites.
Appendix 1—figure 5
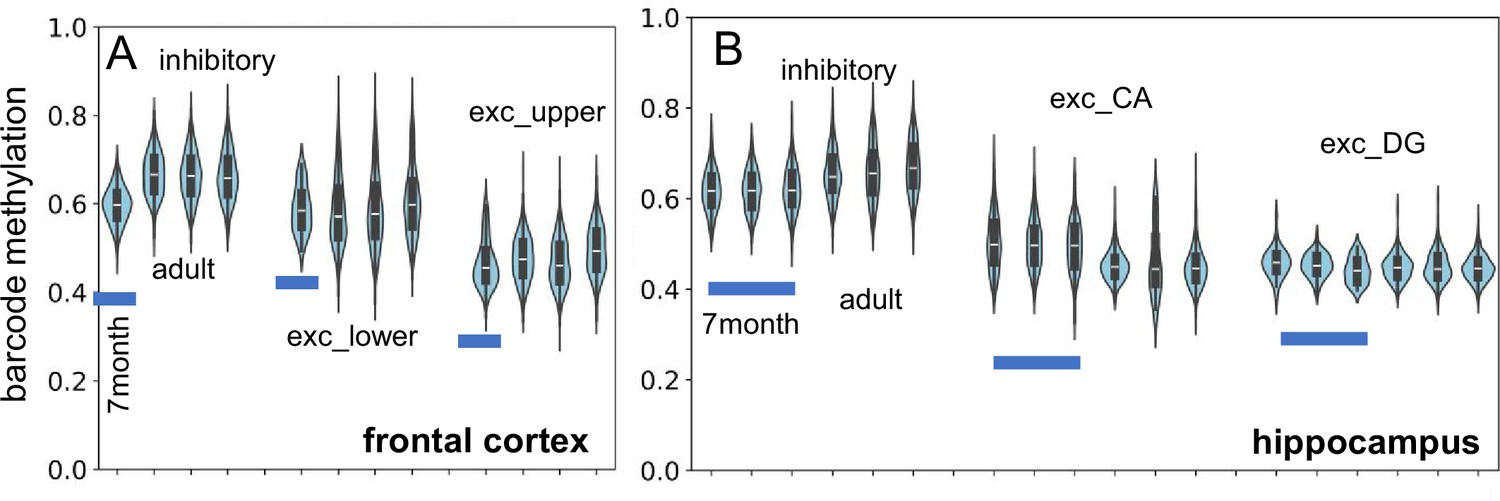
New single-cell data indicate fluctuating CpG (fCpG) barcode methylation at 7 mo of age is similar to adult levels (H02, 29 yo; H01, 42 yo; H04, 58 yo).
(A) Inhibitory, and lower and upper cortical excitatory neuron barcode methylation levels from the frontal cortex are similar. (B) Inhibitory and excitatory (CA and DG) neuron barcode methylation levels are similar between infant (three samples) and adult hippocampus.
Appendix 1—figure 6
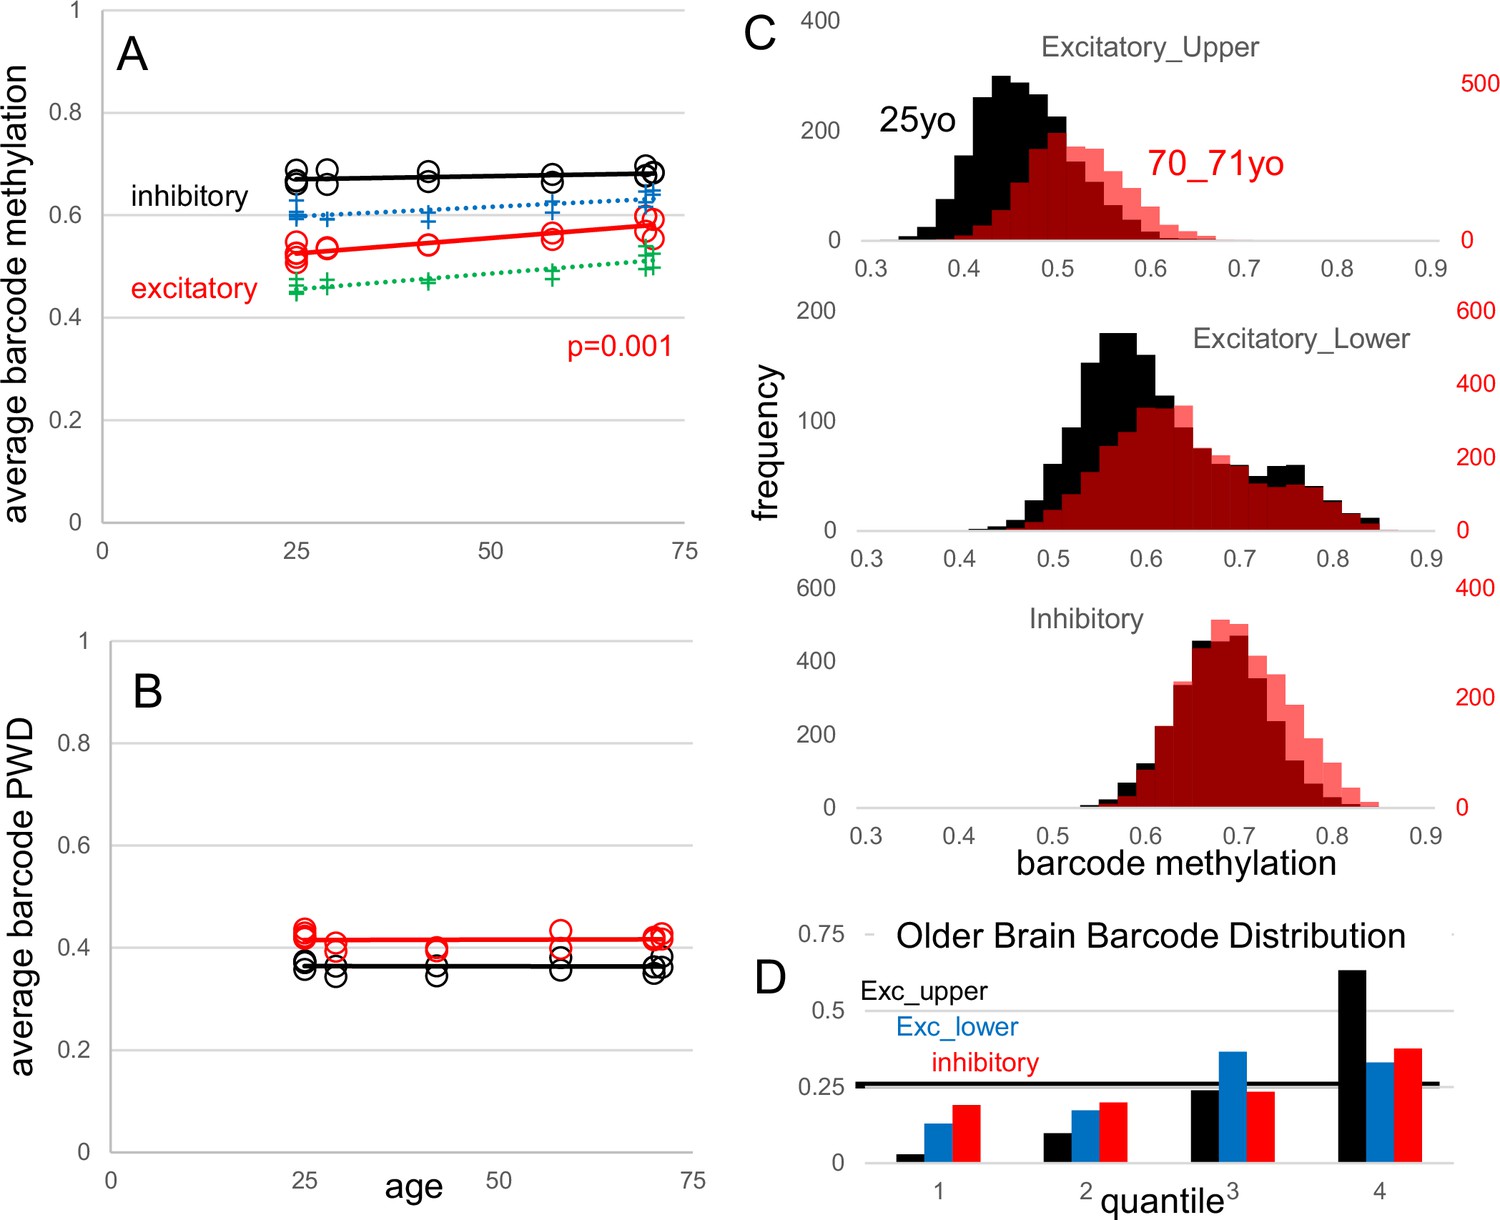
Fluctuating CpG (fCpG) barcode reproducibility and stability with aging.
New data are frontal cortex (Broadman area 46) WGBS single-cells from young (25 y-old, three individuals and five samples) and older (70–71 y-old, three individuals and fivesamples) males. Data from the manuscript are also shown (H02, 29 yo; H01, 42 yo; H04, 58 yo). (A) Average neuron barcode methylation levels were similar between different aged individuals. Excitatory neuron barcode methylation in older males (70–71 yo) was significantly greater than the 25 yo males (t-test comparing only the 25 yo and 70–71 yo groups). Both upper (green) and lower (blue) cortical excitatory neurons showed greater average barcode methylation with aging. (B) Average inhibitory and excitatory neuron barcode pairwise differences (PWDs) (comparing within subtypes in each brain) were similar between different aged individuals, indicating that barcodes remain polymorphic. (C) Composite histograms of individual neuron barcode methylation levels for younger (black, 25 yo) and older (red, 70-71 yo) brains. There is a preferential loss of neurons with less methylated barcodes, especially with excitatory neurons. (D) Younger brain neuron barcodes were used to define quantiles. Older brain neurons with less methylated barcodes were depleted in the less methylated quantiles, with significant differences for all quantiles (Mann Whitney U test, p<10–9).
Tables
Table 1
Brain data.
| brain | age | cells | ave fCpG per cell | ave Meth per cell | ave PWD between cell pairs | cell pairs per million | fCpG per pair | closely related pairs (PWD <0.05) | closely related pairs per million | fCpG per nearest neighbor pair* |
|---|---|---|---|---|---|---|---|---|---|---|
| H01 | 42y | 21,836 | 1170 | 0.58 | 0.47 | 197 | 51 | 1385 | 7.0 | 35 |
| H02 | 29y | 16,161 | 1128 | 0.58 | 0.47 | 99 | 48 | 743 | 7.5 | 34 |
| H04 | 58y | 15,434 | 1060 | 0.58 | 0.47 | 73 | 45 | 1078 | 14.8 | 35 |
| between brains | ||||||||||
| H02-H01 | 0.47 | 281 | 49 | 785 | 2.8 | 35 | ||||
| H02-H04 | 0.47 | 178 | 46 | 653 | 3.7 | 34 | ||||
| H04-H01 | 0.47 | 254 | 47 | 943 | 3.7 | 35 | ||||
Additional files
-
MDAR checklist
- https://cdn.elifesciences.org/articles/101163/elife-101163-mdarchecklist1-v1.docx
-
Supplementary file 1
fCpG annotations.
- https://cdn.elifesciences.org/articles/101163/elife-101163-supp1-v1.xlsx
-
Supplementary file 2
fCpG genomic locations.
- https://cdn.elifesciences.org/articles/101163/elife-101163-supp2-v1.xlsx
-
Supplementary file 3
fCpG Brain H01 data.
- https://cdn.elifesciences.org/articles/101163/elife-101163-supp3-v1.zip
-
Supplementary file 4
fCpG H02 brain data.
- https://cdn.elifesciences.org/articles/101163/elife-101163-supp4-v1.xlsx
-
Supplementary file 5
fCpG H04 brain data.
- https://cdn.elifesciences.org/articles/101163/elife-101163-supp5-v1.xlsx
-
Supplementary file 6
Cells used for IQtree analysis.
- https://cdn.elifesciences.org/articles/101163/elife-101163-supp6-v1.xlsx
-
Source code 1
Python code used for analysis.
- https://cdn.elifesciences.org/articles/101163/elife-101163-code1-v1.zip
Download links
A two-part list of links to download the article, or parts of the article, in various formats.
Downloads (link to download the article as PDF)
Open citations (links to open the citations from this article in various online reference manager services)
Cite this article (links to download the citations from this article in formats compatible with various reference manager tools)
Human brain ancestral barcodes
eLife 13:RP101163.
https://doi.org/10.7554/eLife.101163.3


