Comparative analysis of the syncytiotrophoblast in placenta tissue and trophoblast organoids using snRNA sequencing
- Duke University School of Medicine, Department of Cell Biology, United States
- Duke University School of Medicine, Department of Integrative Immunobiology, United States
- Duke University School of Medicine, Department of Biostatistics and Bioinformatics, United States
- Duke Human Vaccine Institute, United States
Figures
Figure 1 with 4 supplements
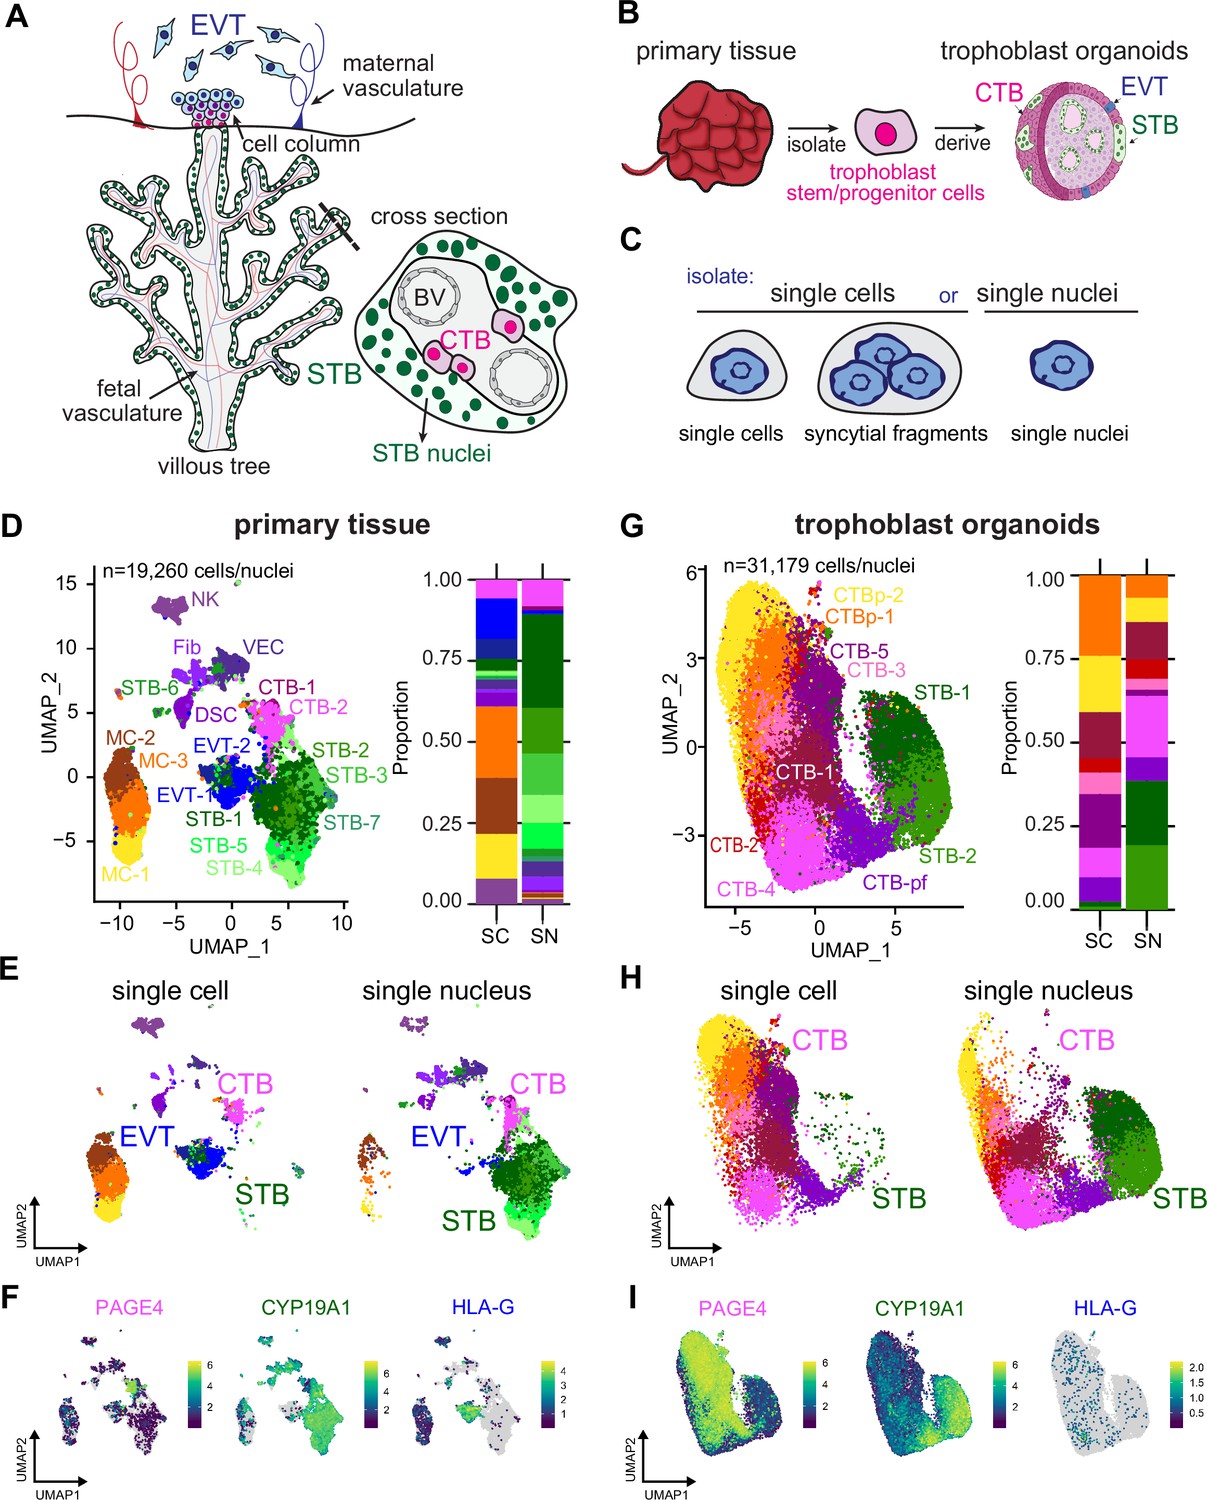
Single-nucleus sequencing is essential to capture the STB lineage in full-term tissue and TOs.
(A) Cartoon of placenta villous tree and cross-section, with the multinucleated STB highlighted in green, progenitor CTB cells in magenta, and extravillous cytotrophoblasts in blue. (B) Schematic of organoid generation via isolation of trophoblast progenitor cells from full-term placental tissue. (C) Schematic of experimental setup. Both tissue and TOs were processed into either single cells/syncytial fragments or single nuclei and sequenced. UMAP of integrated SC and SN datasets collected from primary tissue (D) and TOs (G). Cell/nucleus types are annotated as follows: cytotrophoblast (CTB), cytotrophoblast pre-fusion (CTB-pf), syncytiotrophoblast (STB), extravillous trophoblast (EVT), dendritic stem cell (DSC), vascular endothelial cell (VEC), fibroblasts (Fib), natural killer cell (NK), and macrophage (MC). Cell/nucleus types that contained multiple clusters are identified with -number after the name. (E and H) UMAP of the integrated SC and SN dataset separated into individual UMAPs by single cell or nucleus processing type for primary tissue (E) and TOs (H). (F and I) Expression of key trophoblast markers, including PAGE4 (CTB), CYP19A1 (STB), and HLA-G (EVT) in primary tissue (F) and TOs (I).
Figure 1—figure supplement 1
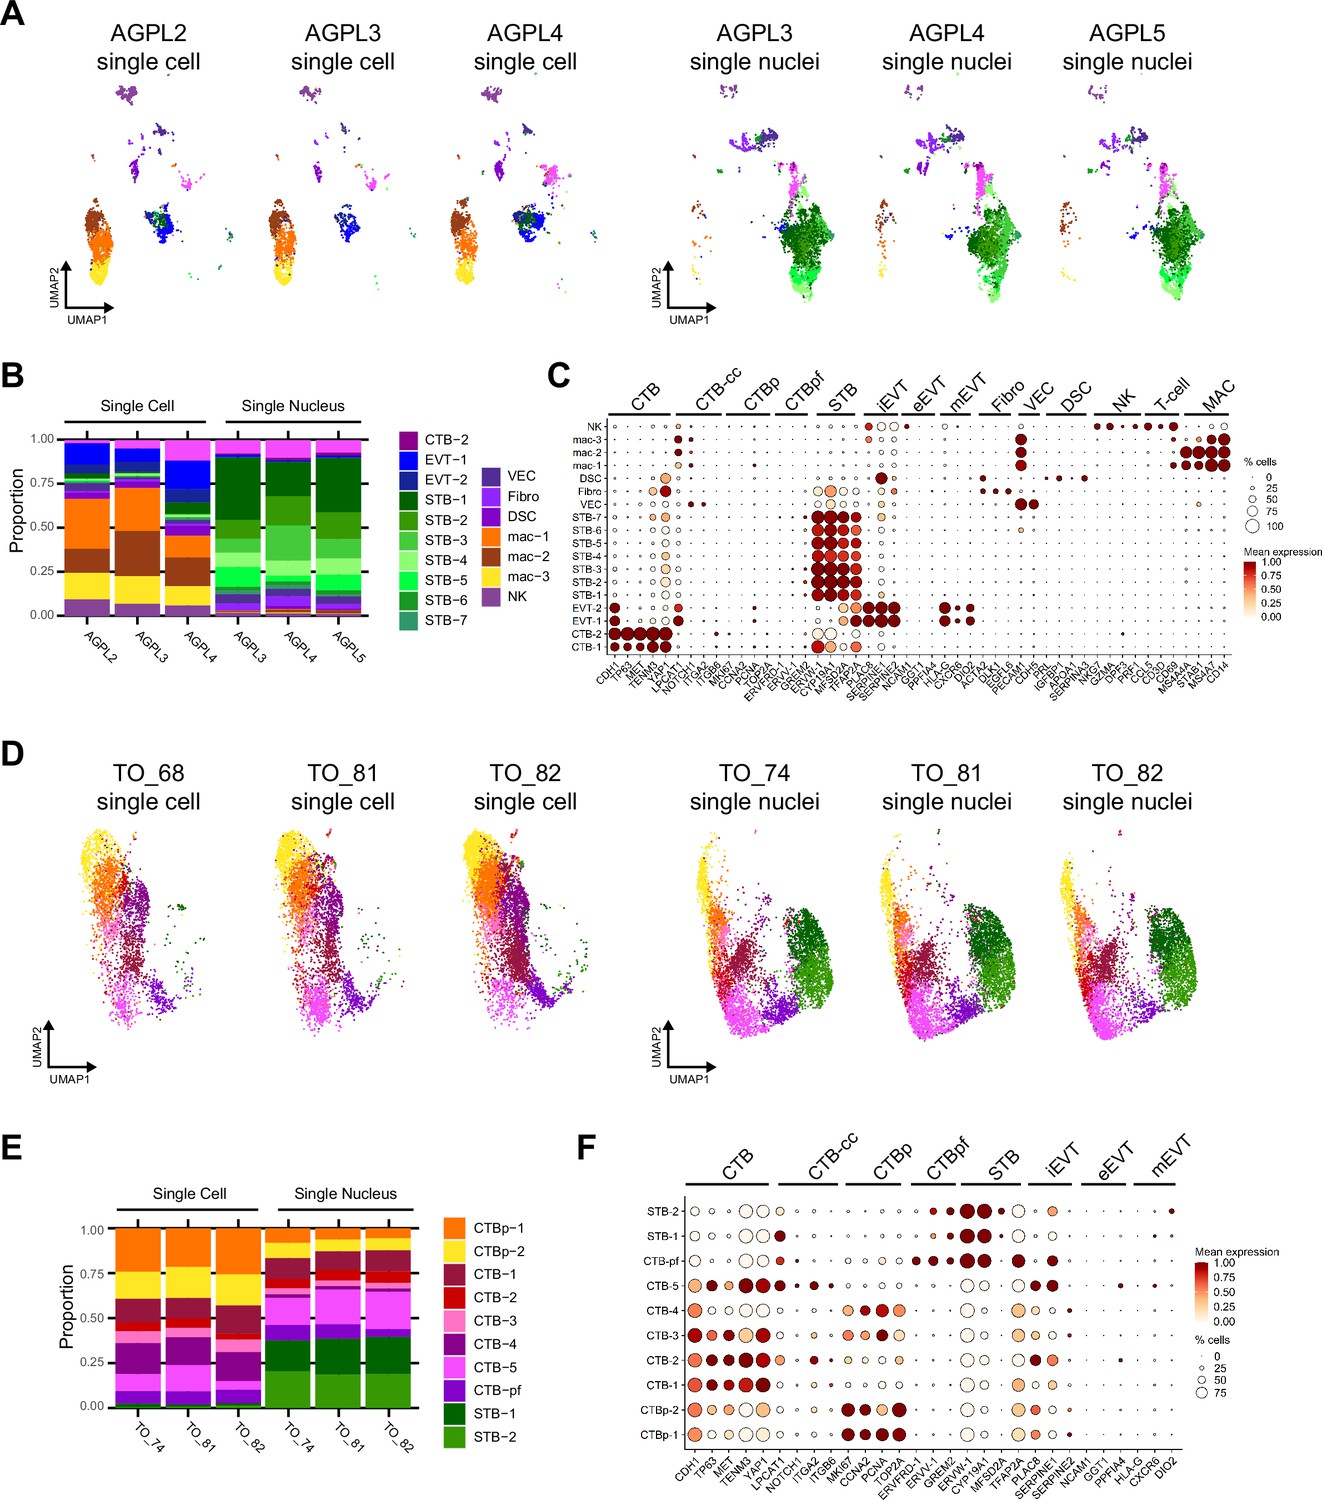
Characterization of cell/nucleus types in the integrated SC/SN dataset.
Each patient (3 tissues) and sequencing approach (SC or SN) for the integrated SC/SN full-term tissue dataset was individually plotted on a UMAP in (A), cell/nucleus type proportions are plotted as a barplot in (B), and dot plot of gene expression for the marker genes of each cell/nucleus type shown in (C). Each TO line and sequencing approach (SC or SN) for the integrated SC/SN TO dataset was individually plotted on a UMAP in (D), cell/nucleus type proportions are plotted as a barplot in (E), and dot plot of gene expression for the marker genes of each cell/nucleus type shown in (F). For the dot plots in (C and F), the size of the dot demonstrates the percent of cells/nuclei expressing a given gene and color represents the mean expression value. The labels on the top of the graph refer to the established marker genes used to identify the identity of each cluster. Cell/nucleus types are annotated as follows: cytotrophoblasts (CTB), cytotrophoblast pre-fusion (CTB-pf), syncytiotrophoblast (STB), extravillous trophoblast (EVT), dendritic stem cell (DSC), vascular endothelial cell (VEC), fibroblast (Fib), natural killer cell (NK), and macrophage (Mac). Cell/nucleus types that contained multiple clusters are identified with -number after the cell name.
Figure 1—figure supplement 2

Characterization of cell types in the full-term tissue SC dataset.
(A) UMAP visualization of cell types found via Louvain clustering in Seurat. (B) Barplot demonstrating proportions of each cell type in the dataset. (C) Dot plot visualization of the gene expression of each cell type. The size of the dot demonstrates the percent of cells expressing a given gene and color represents the mean expression value. The labels on the top of the graph refer to the established marker genes used to identify each cluster. (D) Featureplots of gene expression of specific marker genes for CTB (CDH1), CTB-pf (ERVFRD-1), STB (CYP19A1), and HLA-G (EVT). Cell types are annotated as follows: cytotrophoblasts (CTB), cytotrophoblast pre-fusion (CTB-pf), syncytiotrophoblast (STB), extravillous trophoblast (EVT), dendritic stem cell (DSC), vascular endothelial cell (VEC), fibroblast (Fib), natural killer cell (NK), and macrophage (Mac). Cell types that contained multiple clusters are identified with -number after the cell name.
Figure 1—figure supplement 3
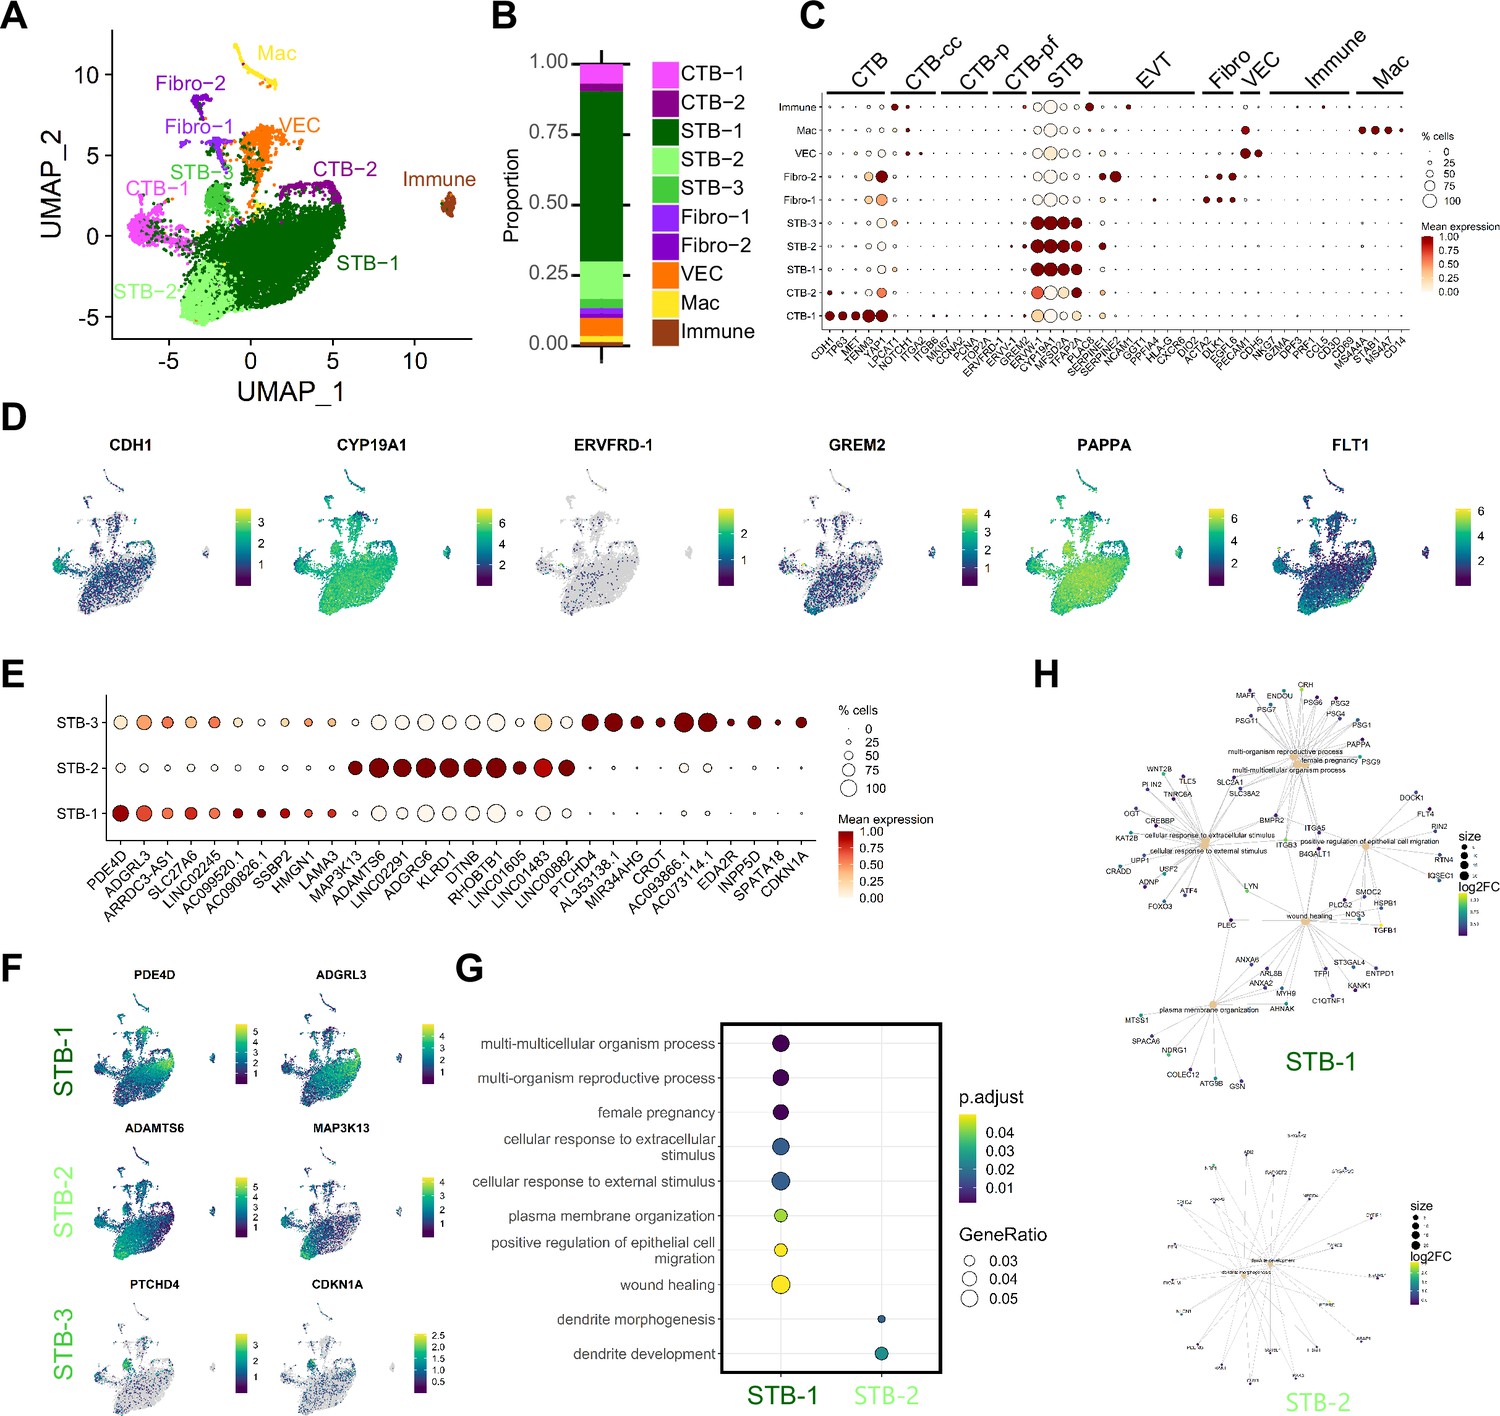
Characterization of nucleus types in tissue SN dataset.
(A) UMAP visualization of nucleus types found via Louvain clustering in Seurat. (B) Barplot demonstrating proportions of each nucleus type in the dataset. Nucleus types are annotated as follows: cytotrophoblasts (CTB), cytotrophoblast pre-fusion (CTB-pf), syncytiotrophoblast (STB), vascular endothelial cell (VEC), fibroblast (Fibo), macrophage (Mac), unidentified immune cell (Immune). Nucleus types that contained multiple clusters are identified with -number after the cell name. (C) Dot plot visualization of the gene expression of each nucleus type. The size of the dot demonstrates the percent of nuclei expressing a given gene and color represents the mean expression value. The labels on the top of the graph refer to the established marker genes used to identify the identity of each cluster. (D) Featureplots of gene expression of specific marker genes for CTB (CDH1), STB (CYP19A1), CTB-pf, (ERVFRD-1 and GREM2). In addition, markers for the two terminally differentiated nucleus subtypes found in Wang et al., were visualized (PAPPA and FLT1). (E). Top 10 differentially expressed genes (DEGs) of each STB subtype is shown as a dotplot. (F) Featureplots of selected genes in E enriched in each STB-subtype. (G) Biological GO terms associated with the DEGs of each subtype were found and plotted with ClusterProfiler. No GO terms were statistically associated with STB-3. (H) The genes associated with each GO term in G are plotted as a CNET plot in ClusterProfiler. The size of the GO term node is scaled by the number of associated genes (scale bar to right) while each gene is colored with the relative log2FC gene expression.
Figure 1—figure supplement 4
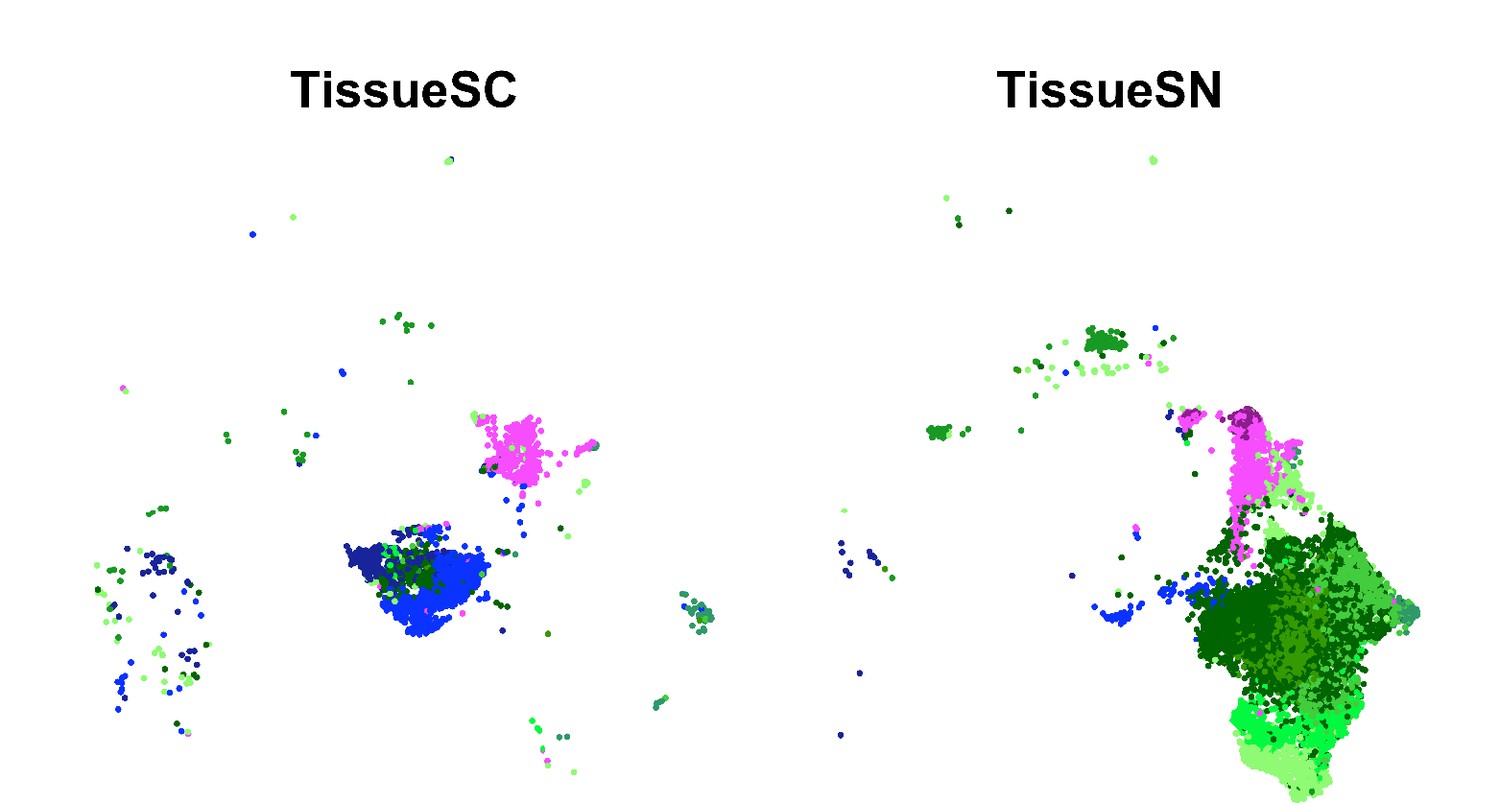
UMAP of the integrated SC and SN dataset separated into individual UMAPs by single cell or nucleus processing type for primary tissue.
Only the trophoblast cell types are included with EVTs in blue, CTBs in pink, and STBs in green.
Figure 2 with 3 supplements
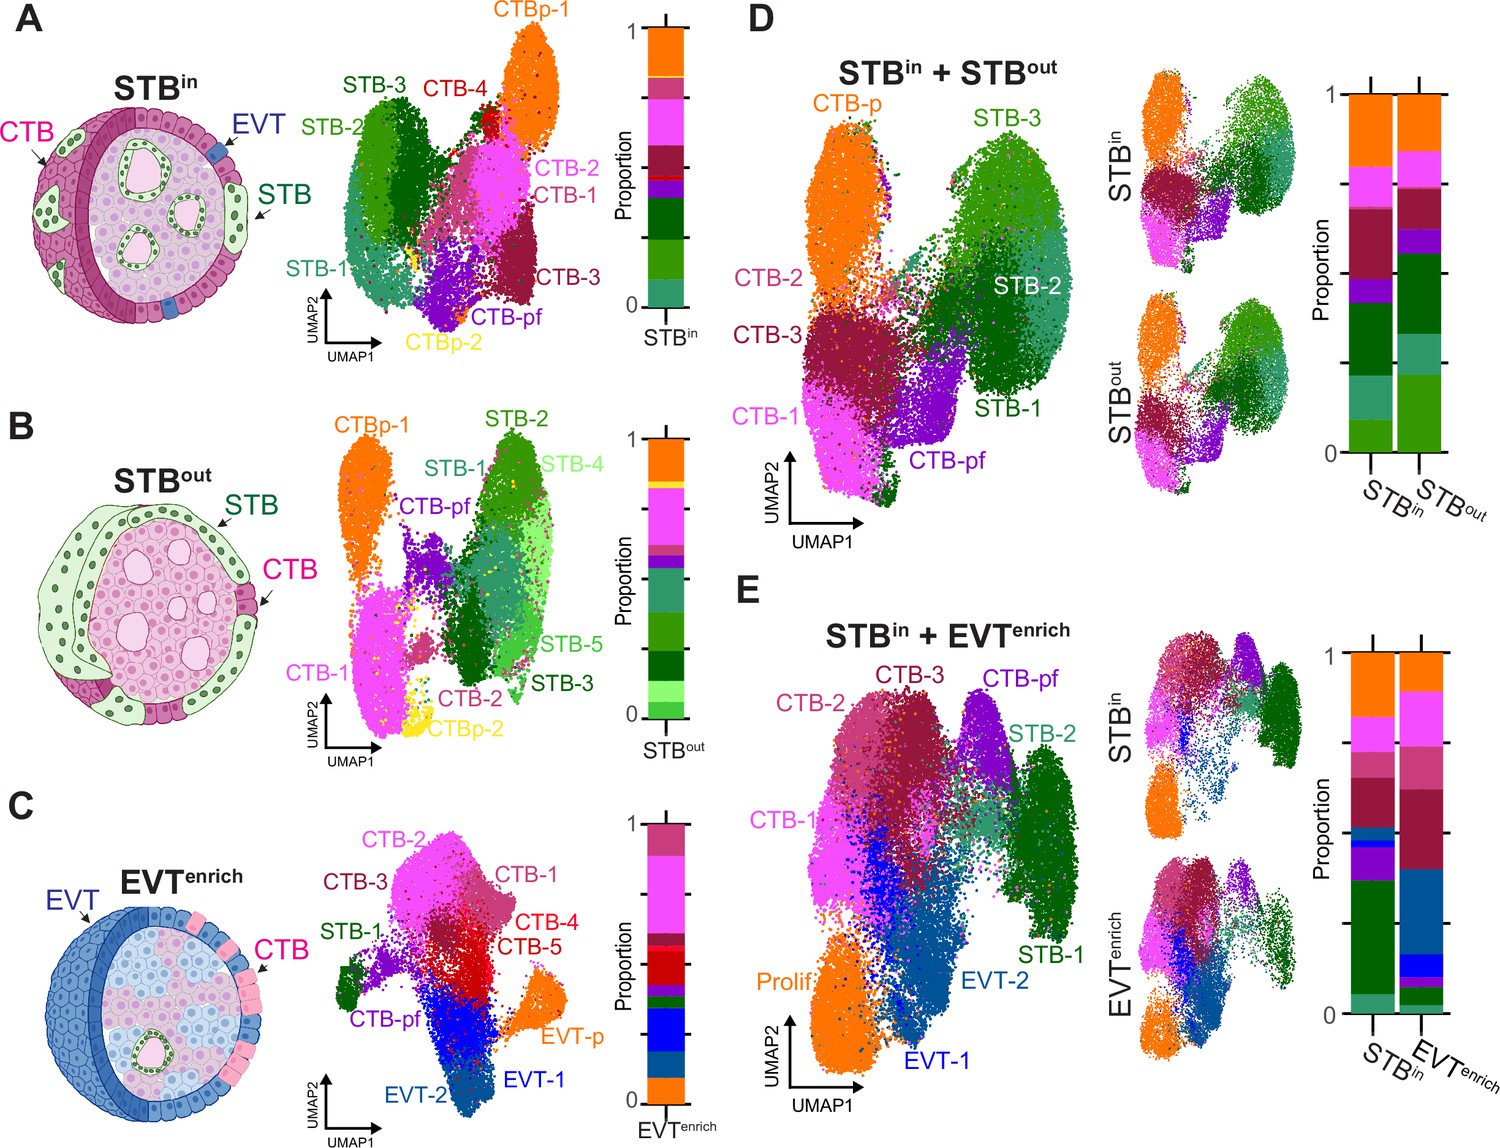
Comparison of TO gene expression in different culture conditions by SN RNA sequencing.
TOs were grown with the STB facing inward (STBin), outward (STBout), or induced to differentiate into EVT (EVTenrich). Schematic of TO nucleus type composition (left), UMAP of the individual SN datasets (middle), and barplot showing the proportions of each nucleus type (right) are shown for STBin (A), STBout (B), or EVTenrich (C). UMAP of the integrated datasets (left), integrated dataset split by culture condition (middle), and barplot showing the proportions of each nucleus type (right) are shown for the STBin +STBout integrated dataset (D) or STBin +EVTenrich dataset (E). Prolif in E refers to proliferative subtype encapsulating both EVT-p and CTB-p.
Figure 2—figure supplement 1
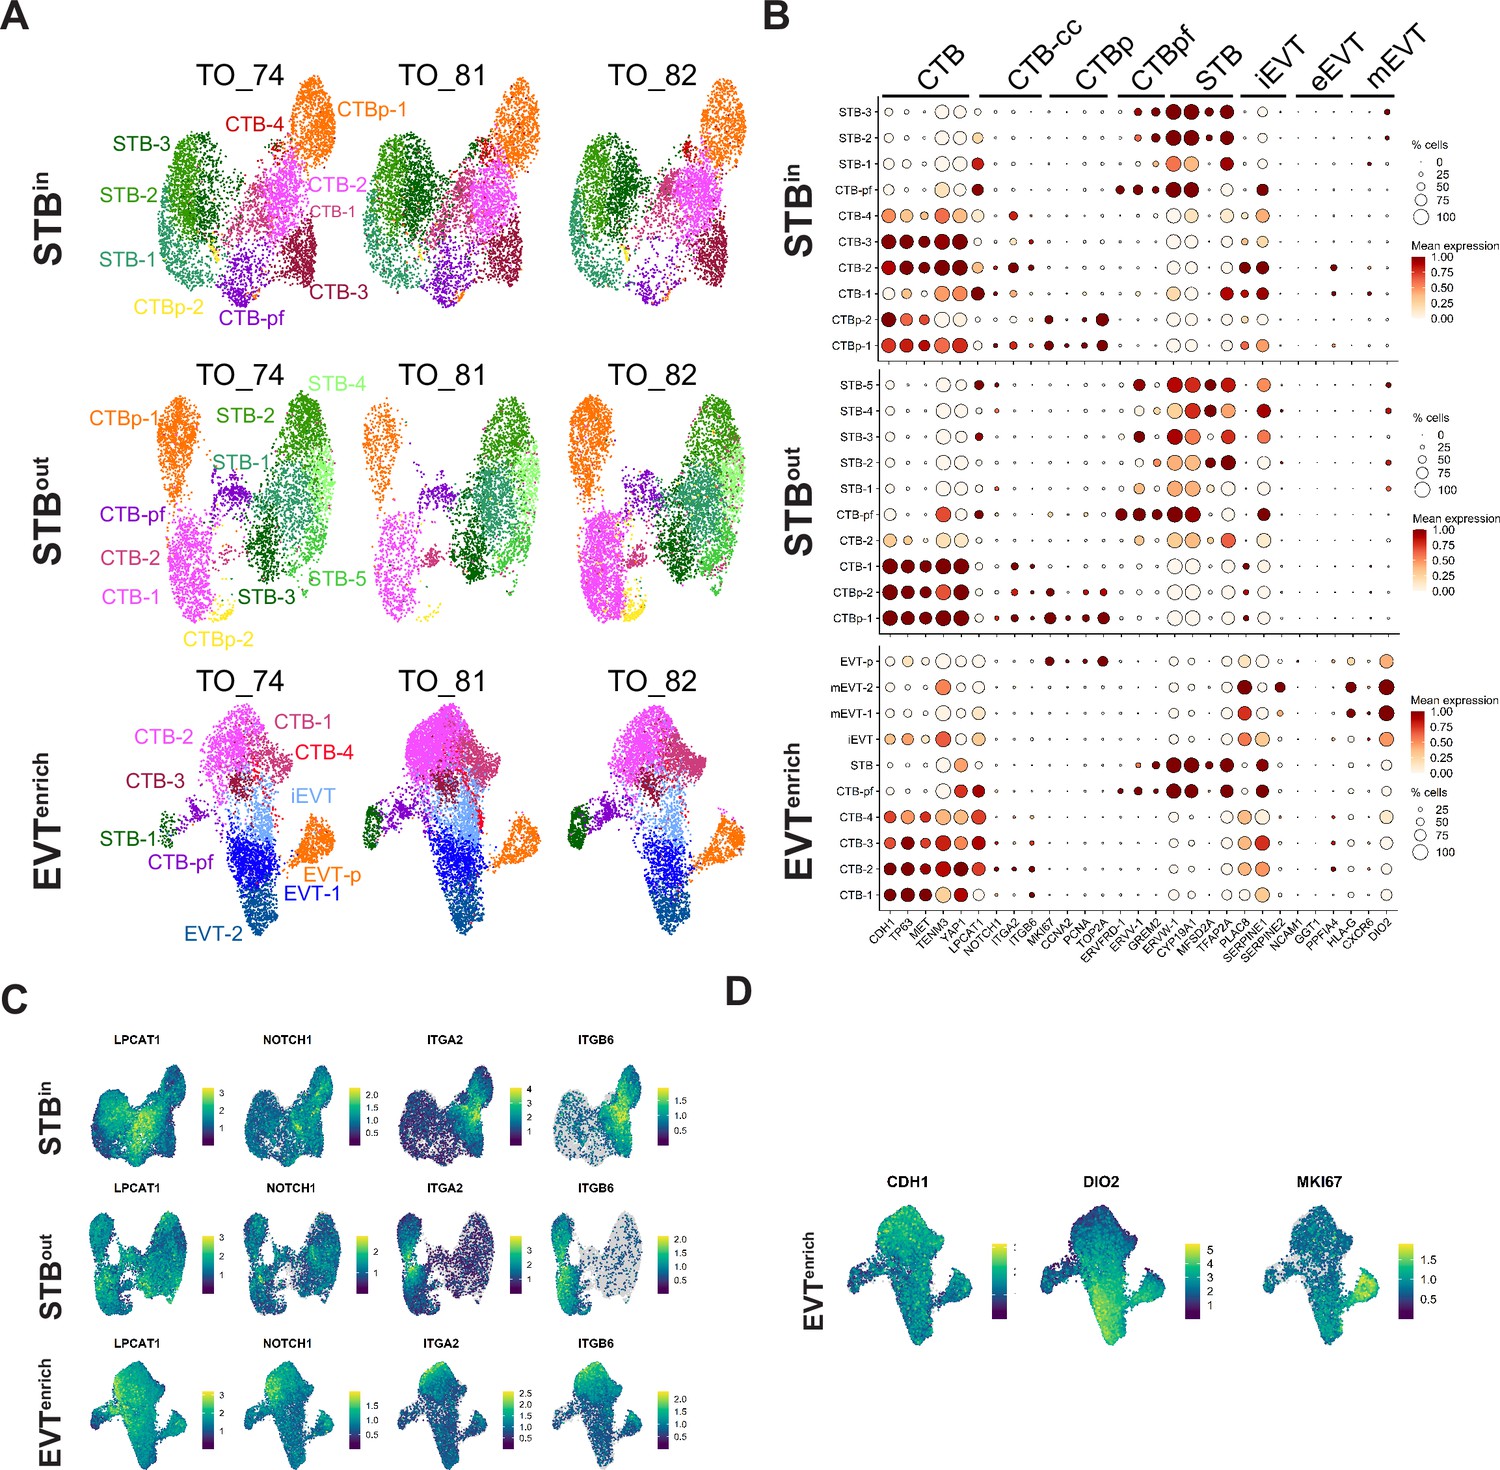
Characterization of nucleus subtypes in individual TO datasets.
A Each TO cell line was individually plotted on a UMAP for the integrated SN STBin, STBout, or EVTenrich datsets. (B) Dot plot of gene expression for the marker genes of each nucleus type. The size of the dot demonstrates the percent of nuclei expressing a given gene and color represents the mean expression value. The labels on the top of the graph refer to the established marker genes used to identify the identity of each cluster. (C) Feature Plot demonstrating gene expression of the CTB-CC markers in each TO culture condition. (D) Feature Plot demonstrating gene expression of a CTB marker (CDH1), an EVT marker (DIO2), and a mitotic marker (MKI67).
Figure 2—figure supplement 2
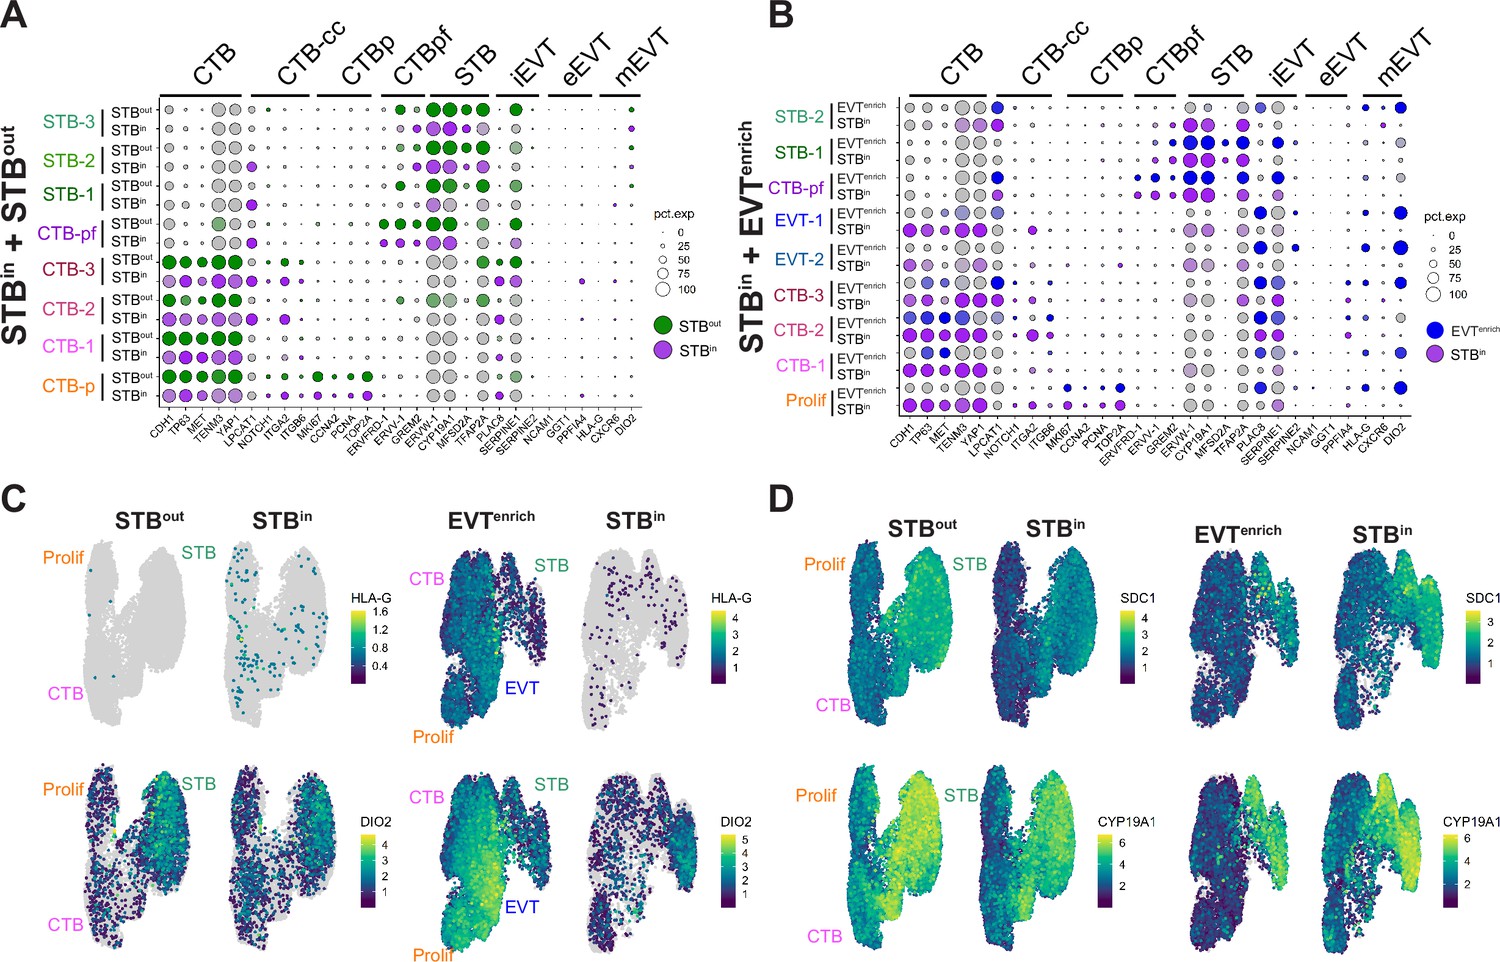
Characterization of nucleus types in the merged TO SN datasets.
Dot plot of gene expression for the marker genes of each nucleus type for the integrated STBin +STBout dataset (A) or STBin +EVTenrich dataset (B). Individual gene expression is shown for each nucleus type of each culture condition and labels are found on the left-hand axis of the graph. The size of the dot demonstrates the percent of nuclei expressing a given gene and color represents the mean expression value. The labels on the top of the graph refer to the established marker genes used to identify the identity each cluster. Feature Plot of integrated datasets split by culture condition of EVT markers (HLA-G and DIO2, C) or STB markers (SDC1 and CYP19A1, D).
Figure 2—figure supplement 3
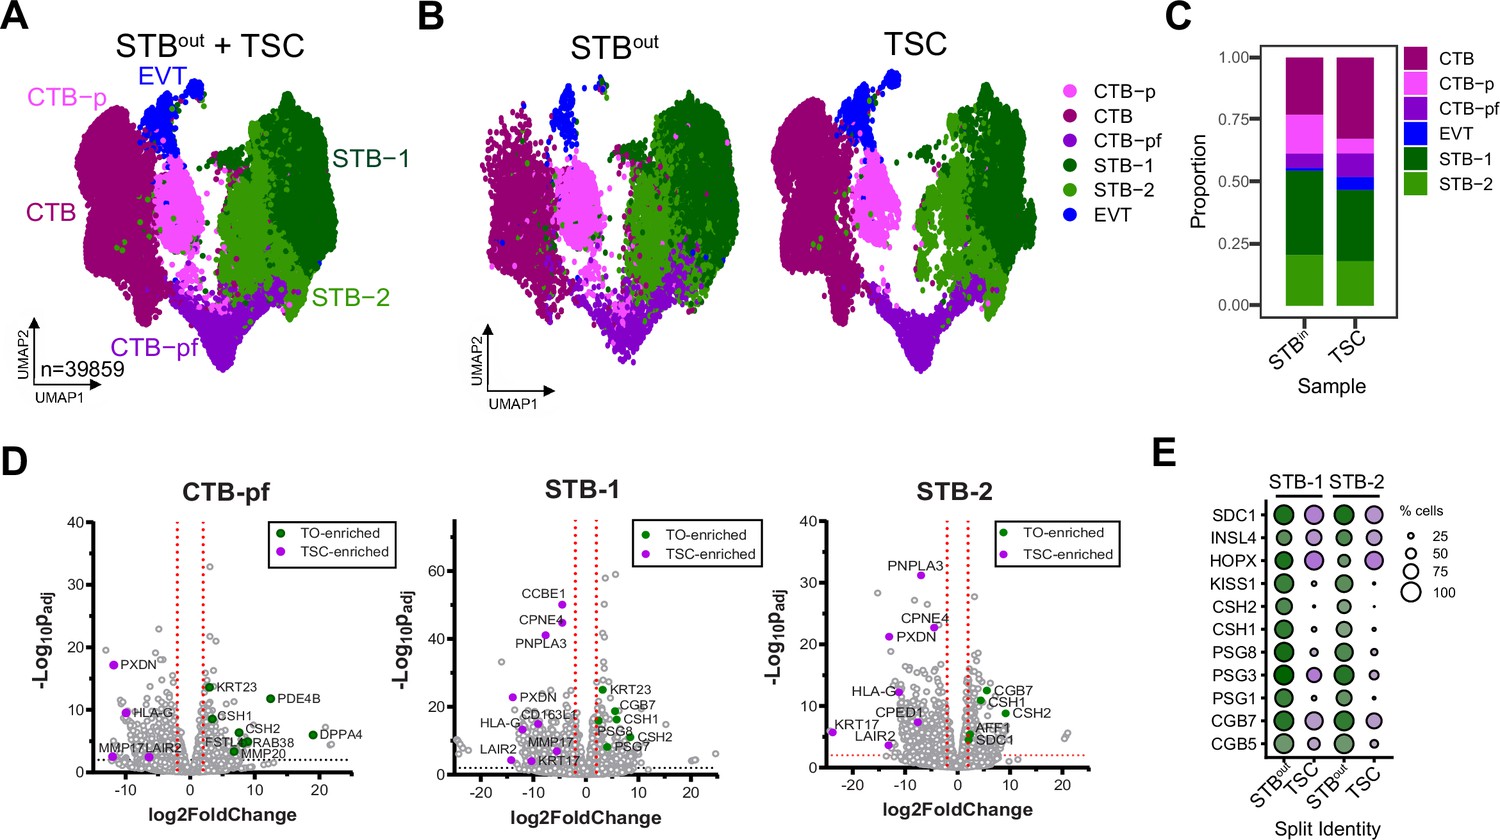
Comparison of TO and TSC SN datasets.
UMAP of integrated STBout and TSC dataset (A) or plotted individually (B) with nucleus types found via Louvain clustering in Seurat and pseudocolored. (C) Barplot demonstrating proportions of each nucleus type in the integrated dataset. (D) DEseq2 was used to find differentially expressed genes between TO and TSC datasets in CTB-pf, STB-1, and STB-2 clusters and plotted as a volcano plot. Select representative genes are highlighted for TO (green) or TSC (purple). (E) Dot plot of individual genes in the STB-1 and STB-2 subtypes split into either TSC or TO populations.
Figure 3 with 3 supplements
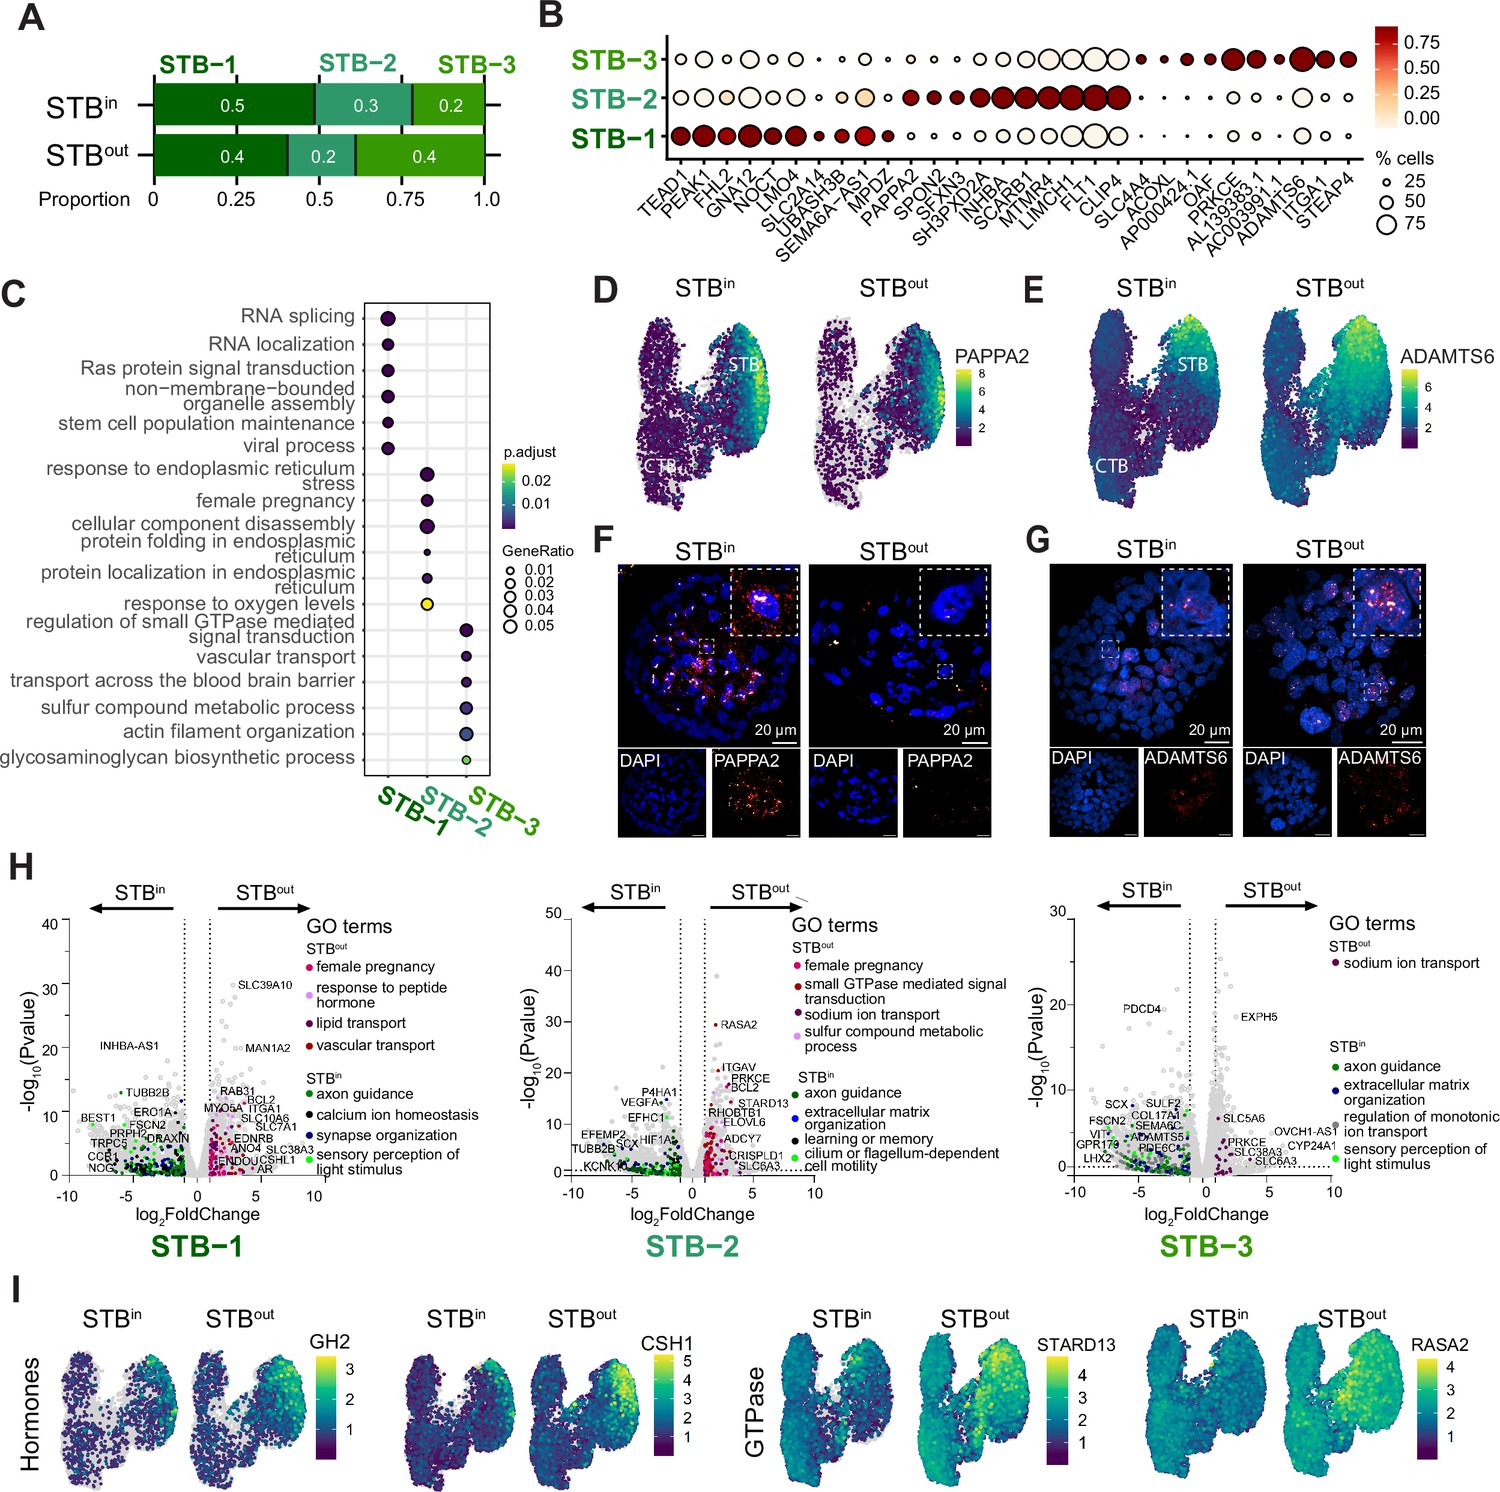
STB subtype analysis and expression differences in STBin vs STBout TOs.
(A) Proportion of each STB subtype in the integrated STBin +STBout dataset. (B) Top differentially expressed genes (DEGs) of each STB subtype is shown as a dot plot. Mean expression is shown as a color scale and percent of nuclei expressing each gene is demonstrated by size of the dot. (C) Top Biological Process GO terms associated with DEGs in each STB subtype was determined with clusterProfiler. (D) Feature Plots of PAPPA2 in STBin and STBout TOs. (E) Feature Plots of ADAMTS6 in STBin and STBout TOs. (F) RNA FISH of PAPPA2 in STBin and STBout TOs. (G) RNA FISH of ADAMTS6 in STBin and STBout TOs. (H) DEseq2 was used to find DEGs between STBin and STBout datasets in STB-1, STB-2, and STB-3 clusters and plotted as a volcano plot. GO terms associated with DEGs in either STBin or STBout were found with clusterProfiler and colored on the UMAP with select representative genes highlighted with text. (I) Feature Plot of representative target genes from E.
Figure 3—figure supplement 1
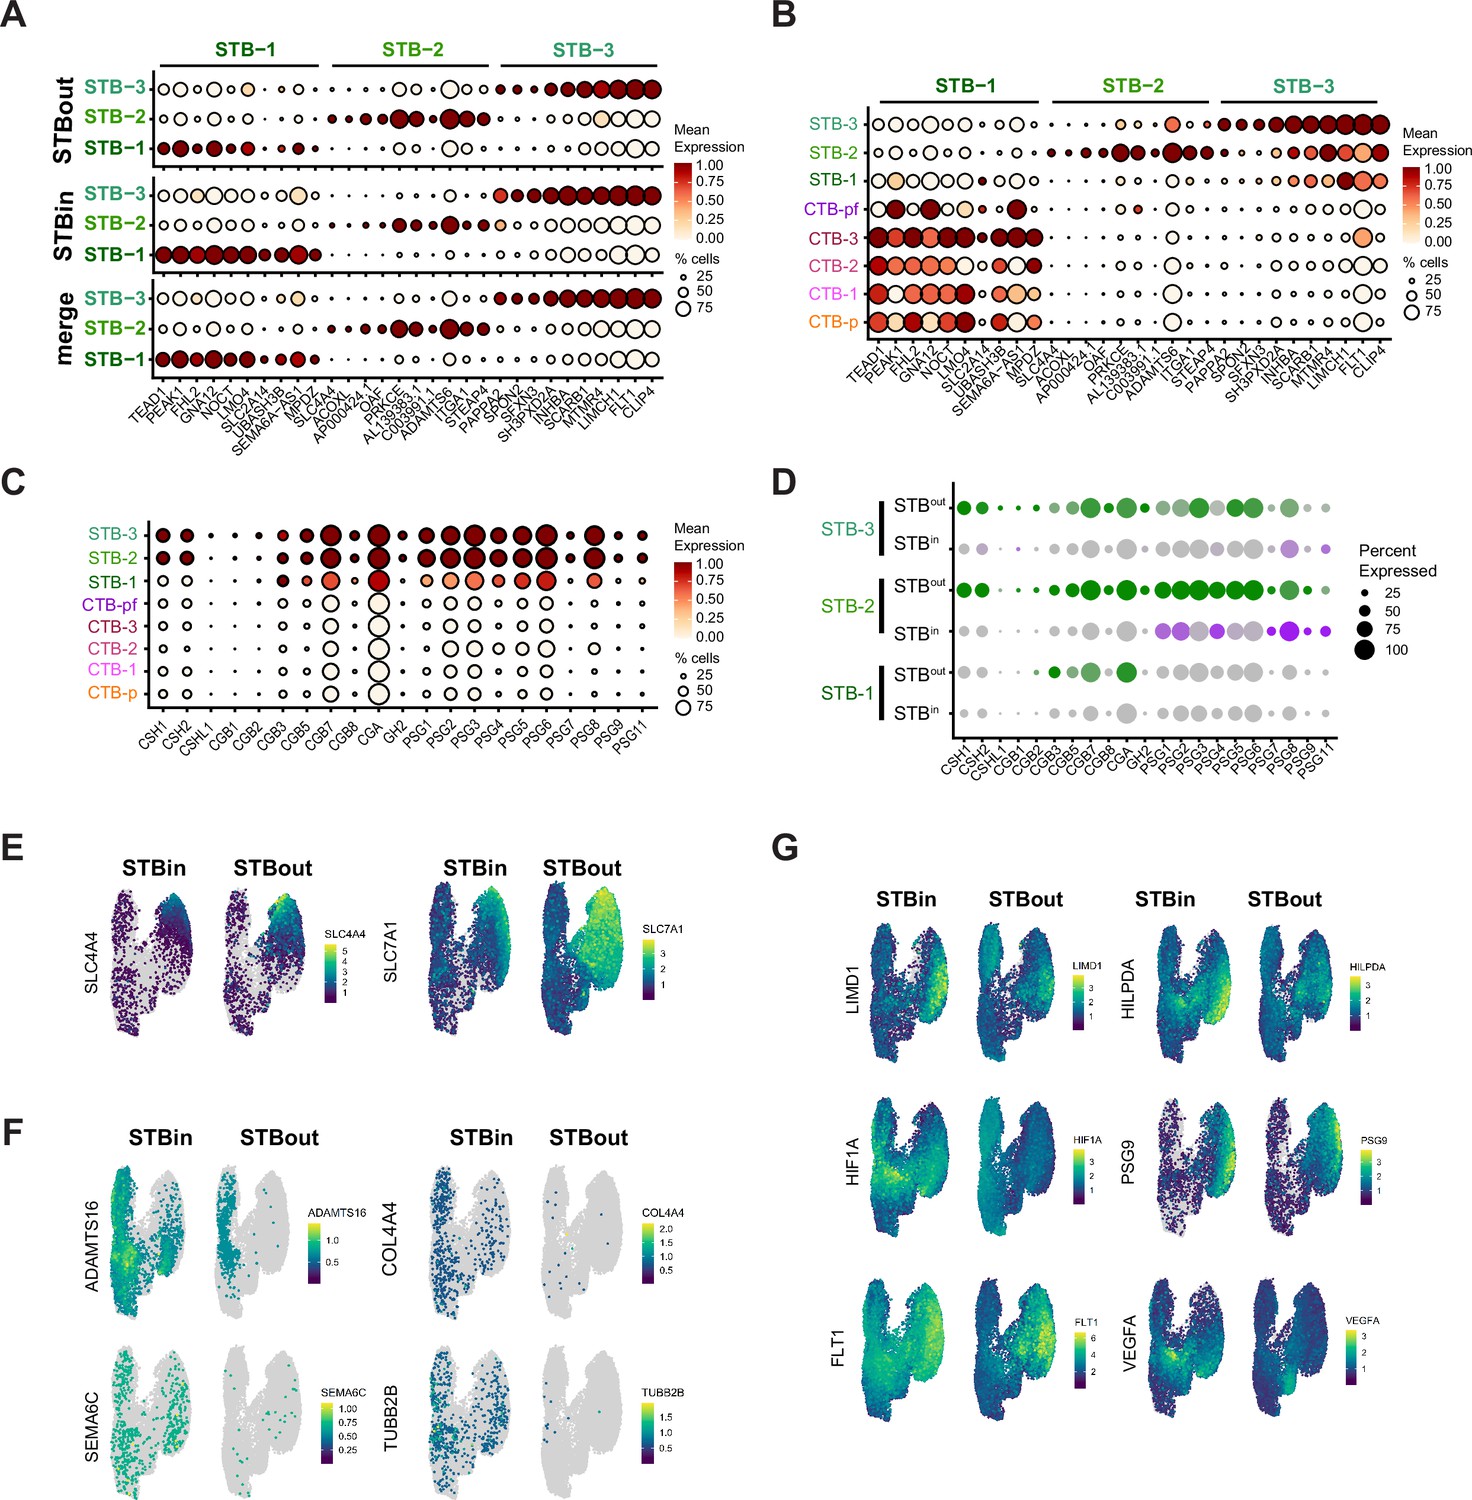
STB subtype analysis and expression differences in STBin vs STBout TOs.
(A) Top 10 differentially expressed genes (DEGs) of each STB subtype was determined in the integrated STBin +STBout dataset comparing just the three STB clusters and plotted for either STBout, STBin, or the merged dataset. The labels on the top of the graph refer to the top DEGs from each STB subtype. (B) The same genes found in A were plotted for every cluster in the STBin +STBout dataset to demonstrate the expression of STB-1 marker genes in the CTB clusters. (C) Dotplot demonstrating the mean expression of key STB pregnancy hormones in each nucleus type of the integrated STBin +STBout dataset. (D) The same hormones plotted in A were plotted as a dot plot and split into either STBout (green) or STBin (purple) expression. For each dotplot in A-D The size of the dot demonstrates the percent of nuclei expressing a given gene and color represents the mean expression value. (E) Featureplot demonstrating expression of transporter proteins enriched in STB-3. (F) Feature plot demonstrating expression of extracellular matrix genes enriched in STBin. (G) Feature plot of the hypoxia associated genes LIMD1, HIF1A, and FLT1.
Figure 3—figure supplement 2
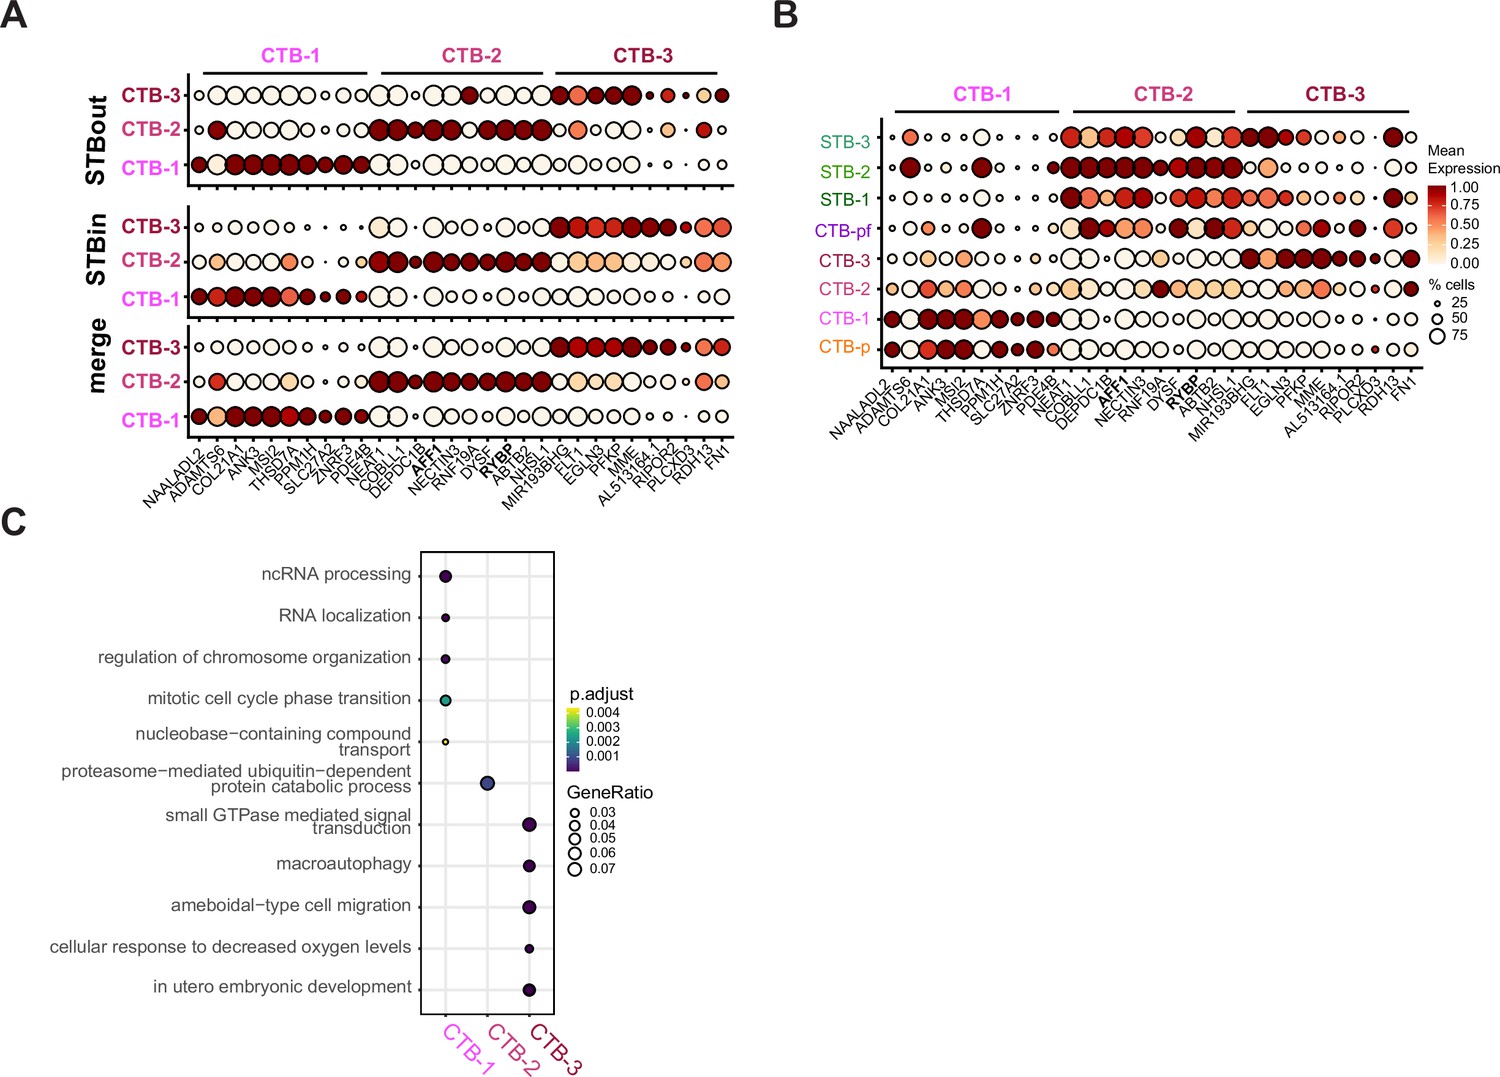
CTB subtype analysis and expression differences in STBin vs STBout TOs.
(A) Top 10 differentially expressed genes (DEGs) of each CTB subtype was determined in the integrated STBin +STBout dataset comparing just the three CTB clusters and plotted for either STBout, STBin, or the merged dataset. The labels on the top of the graph refer to the top DEGs from each CTB subtype. (B) The same genes found in A were plotted for every cluster in the STBin +STBout dataset to demonstrate the expression of CTB-2 marker genes in the STB clusters. (C) Top Biological Process GO terms for each CTB subtype determined with clusterProfiler.
Figure 3—figure supplement 3
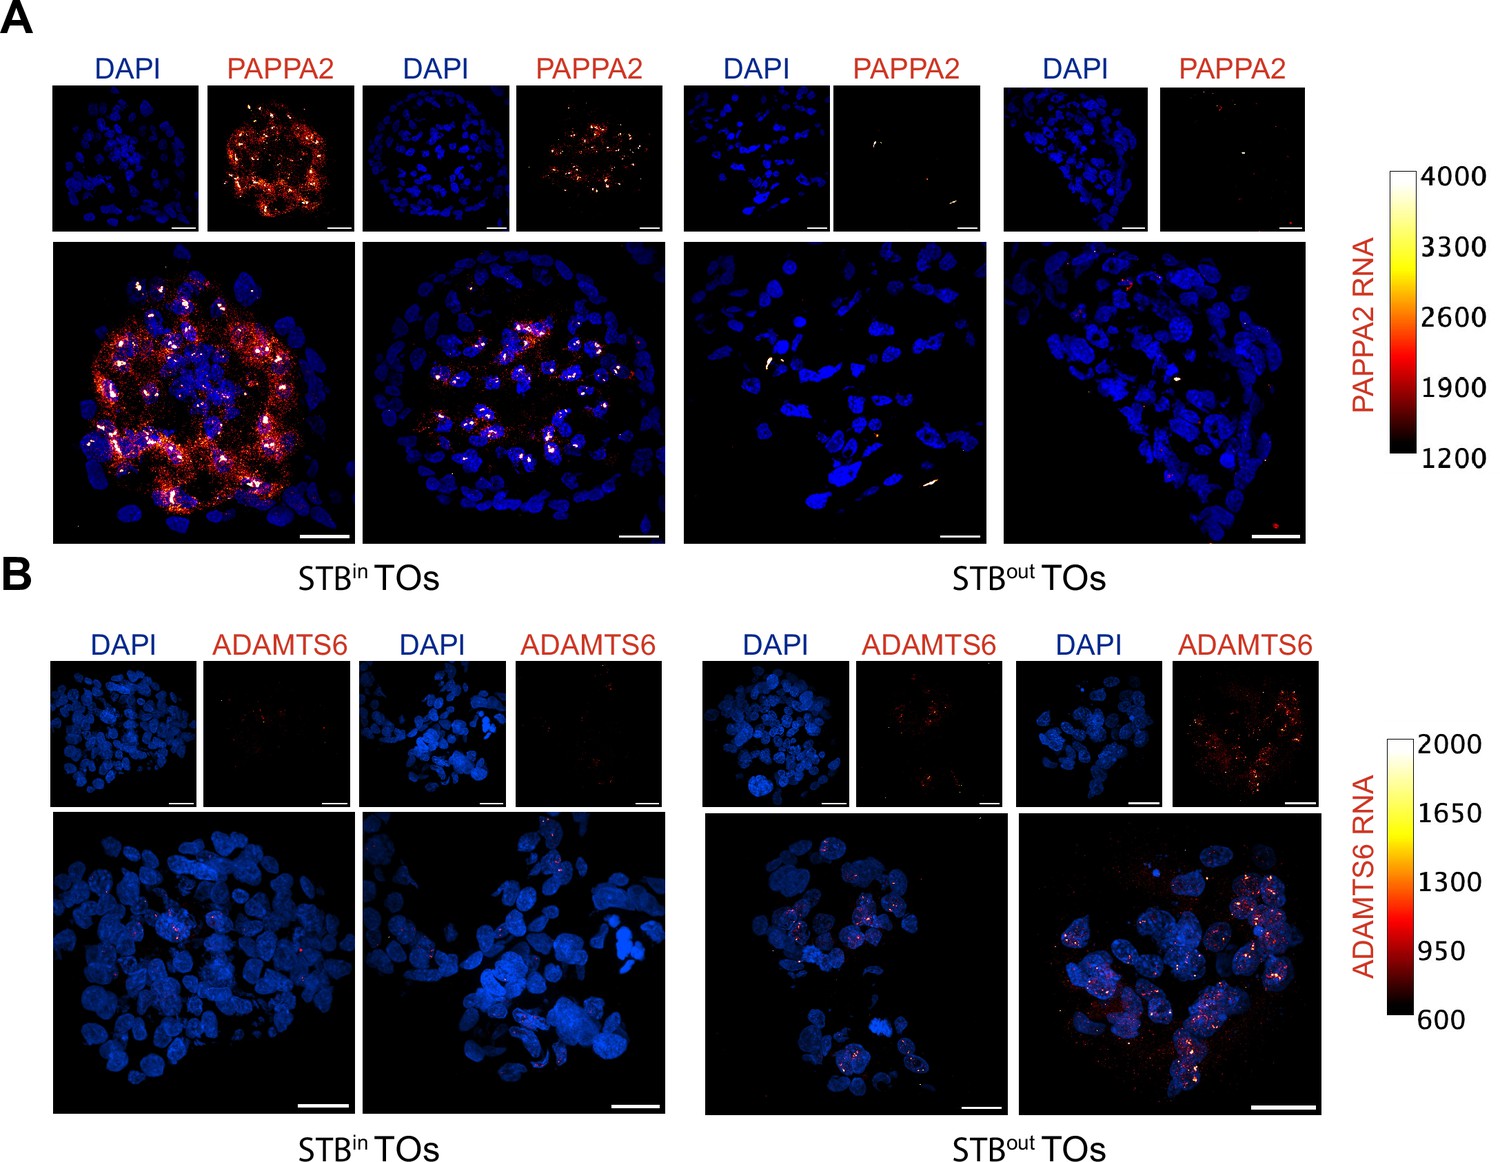
Representative images of RNA FISH in TOs.
RNA fluorescence in situ hybridization (FISH) was performed on STBin and STBout TOs against PAPPA2 in (A) and ADAMTS6 in (B). Cells were stained with DAPI and visualized in blue while RNA expression is represented as the ‘Red Hot’ color in FIJI and the calibration color bar is shown to the right of each image. Images were identically thresholded for RNA expression, but DAPI thresholding was adjusted independently in each image to account for differences in nuclear brightness between STBin and STBout TOs. Each scale bar represents 20 μm.
Figure 4 with 1 supplement
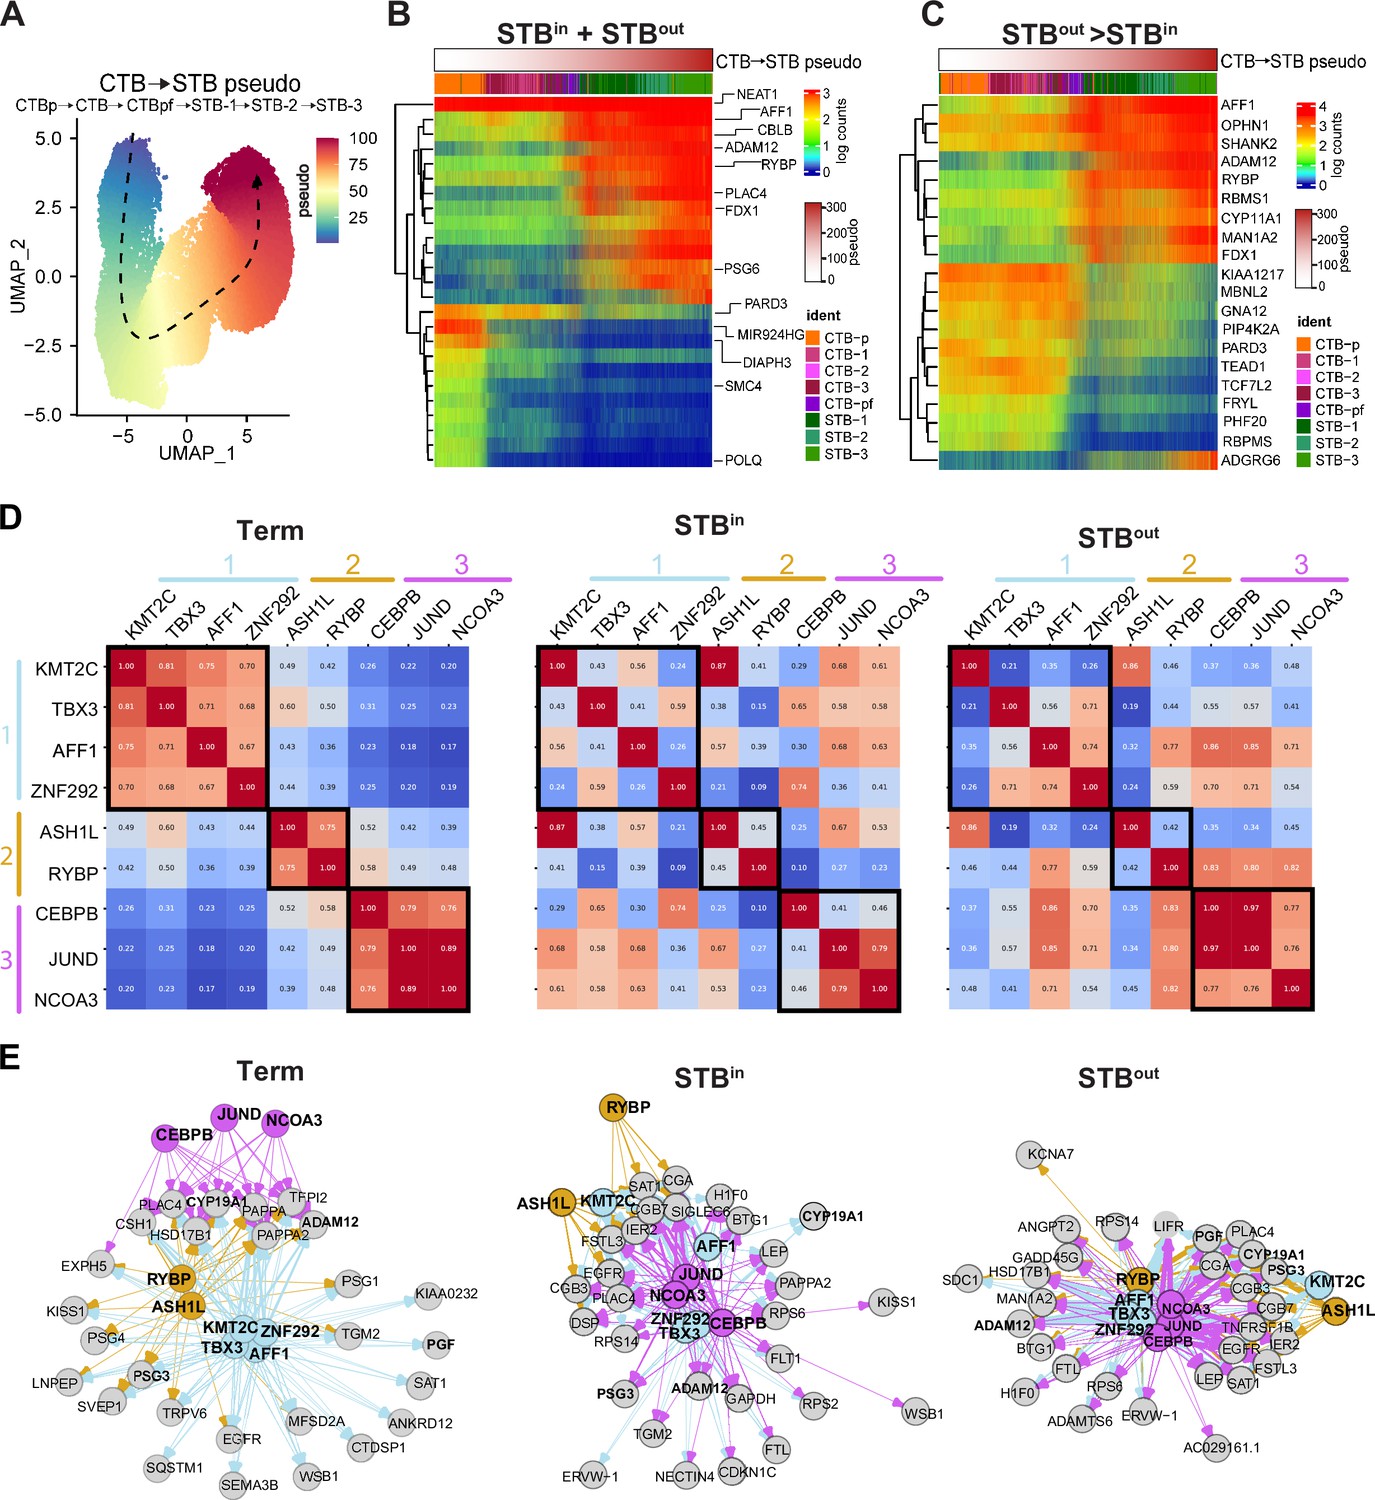
Trajectory and gene regulatory network analysis reveals transcription factors and chromatin remodelers associated with STB differentiation.
(A) Pseudotime was performed with Slingshot and assigned pseudotime value for each nucleus type is overlayed as a color scale on the UMAP from time 0 (blue) to time 100 (red). Arrow demonstrates directionality of the trajectory. Top genes associated with pseudotime (B) or enriched in STBout compared to STBin (C) are plotted on a barplot with nuclei ordered with the pseudotime seen in A. Logcounts and pseudotime are demonstrated as a color scale bar and the identity of each nucleus is labeled with a color as indicated in the legend. (D) TF/CR and TG pairs were identified via Velorama and plotted as a similarity matrix to show the overlap in TGs for each TF/CR. Each module discussed in the text is labeled as 1, 2, or 3 and colored with blue, orange, or pink, respectively. (E) Network graphs of TF/CRs and their respective TGs were plotted with igraph. Each TF/CR and respective arrows were false colored as per the module labels in D. Grey circles represent the target genes. Target genes that are shared among all three sample types are bolded. The width of the arrow from each TF/CR to each TG represents the interaction strength score determined with Velorama and the color of the arrow represents the module from which the interaction arises.
Figure 4—figure supplement 1
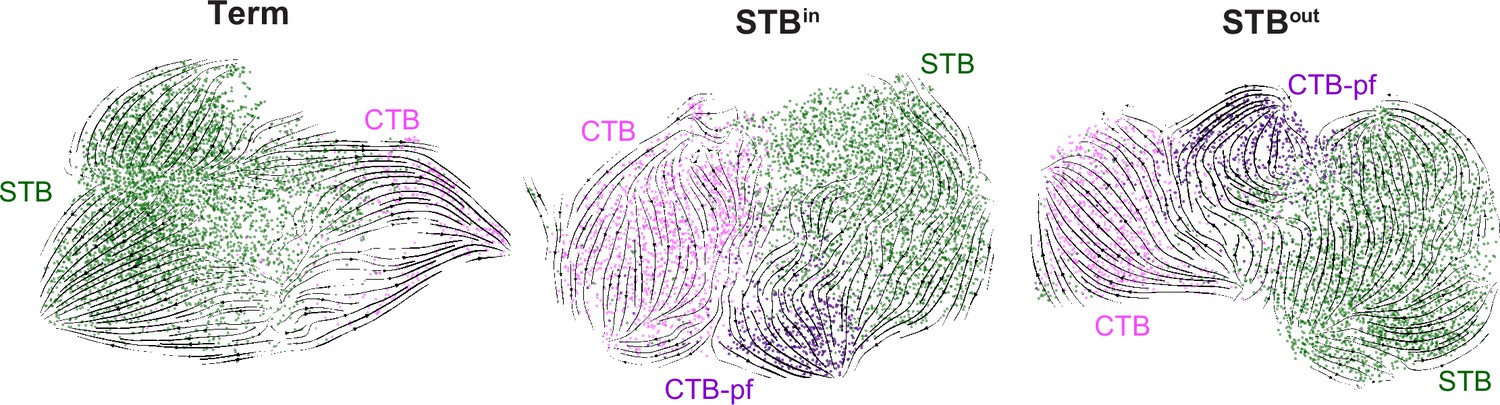
RNA velocity traces.
Velocity derived from scVelo is visualized as streamlines on UMAP for either full-term tissue (Term), STBin, or STBout datasets.
Figure 5 with 3 supplements
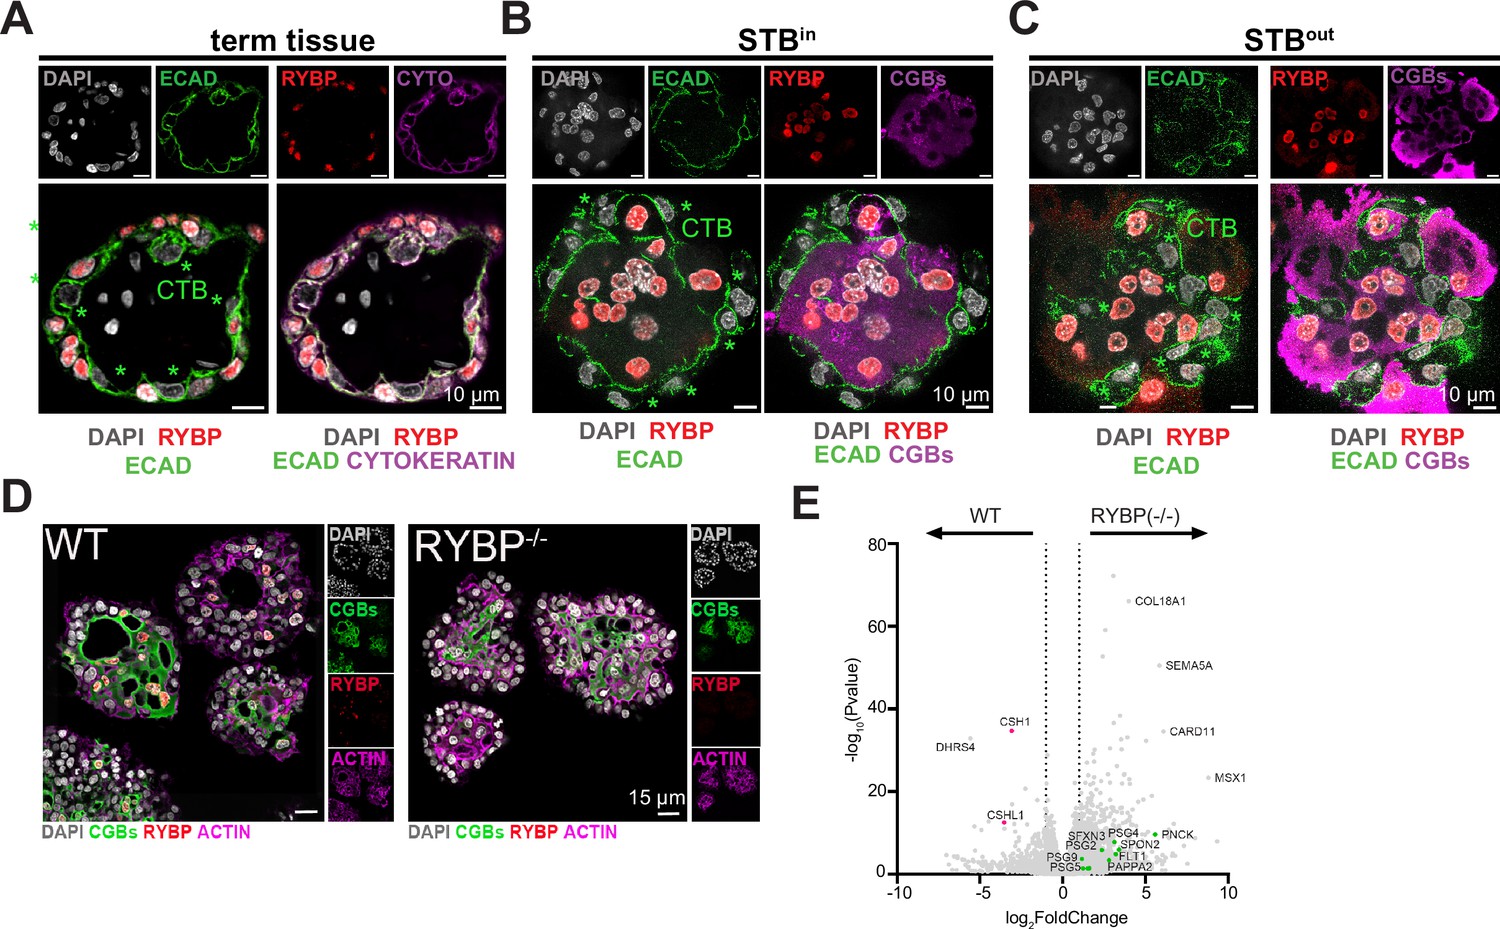
RYBP is a marker of STB and its deletion downregulates STB-2 marker genes.
(A) Immunofluorescence of full-term tissue was performed with E-cadherin (ECAD), cytokeratin (CYTO), and RYBP and stained with DAPI to label nuclei. Immunofluorescence of STBin TOs (B) or STBout TOs (C) was performed with chorionic gonadotropin (CGBs) to label STB, RYBP, and E-cadherin (ECAD) to mark cell boundaries. TOs were further stained with DAPI to label nuclei. Green stars represent CTB cells, as marked by E-cadherin, and are negative for RYBP. (D) Immunofluorescence of WT or RYBP-/- STBin TOs performed with RYBP and CGBs and stained with DAPI and Actin. (E) Bulk RNA sequencing of WT or RYBP(-/-) STBin TOs was performed and analyzed with DESeq2 to determine differential gene expression. Dotted line represents a log2 fold change greater than 1. Genes enriched in the STB-2 subtype are labeled in green.
Figure 5—figure supplement 1

The STB marker ENDOU demonstrates E-cadherin and cytokeratin-7 can designate CTB and STB nuclei in tissue.
Immunofluorescence of full-term tissue was performed with E- cadherin (ECAD), cytokeratin (CYTO), and ENDOU and stained with DAPI to label nuclei. Green stars represent CTB cells.
Figure 5—figure supplement 2
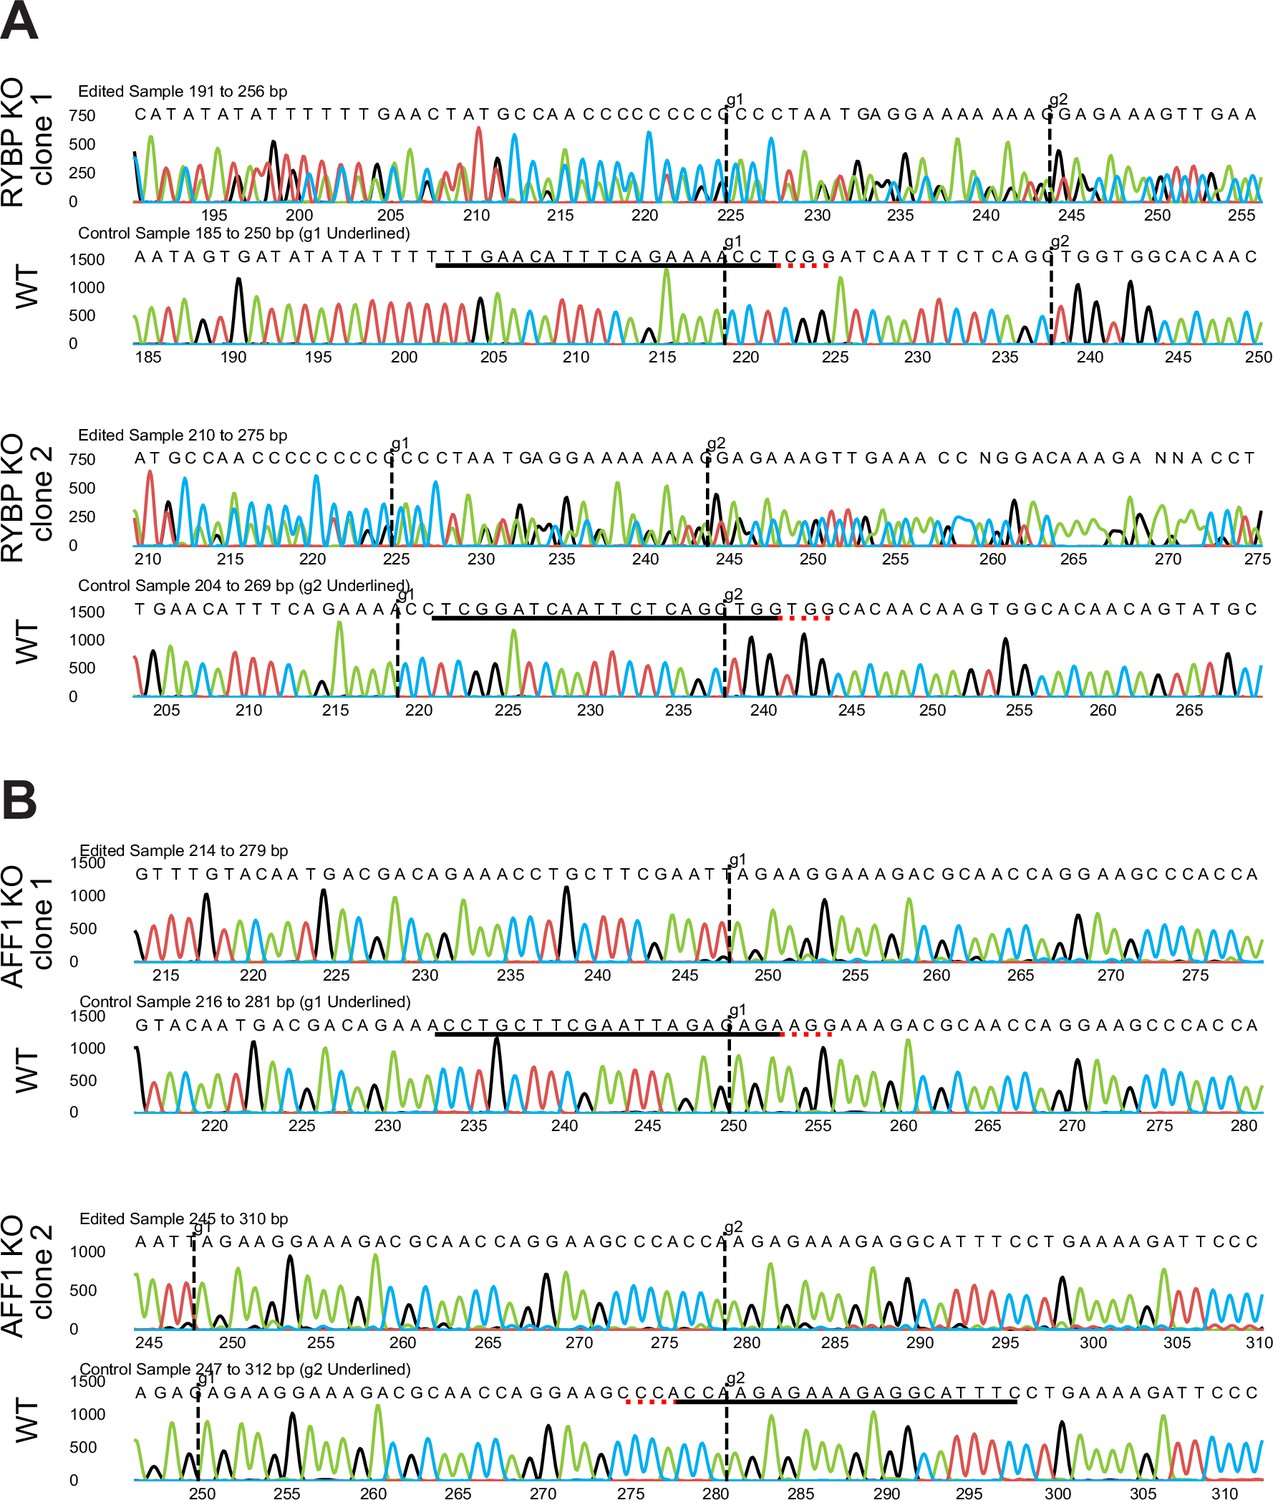
Sanger sequencing validation of RYBP and AFF1 KO TO clones.
Figure 5—figure supplement 3

The deletion of AFF1 in TOs results in the downregulation of STB-2 marker genes.
Bulk RNA sequencing of WT or AFF1(-/-) STBin TOs was performed and analyzed with DESeq2 to determine differential gene expression. Dotted line represents a log2 fold change greater than 1.
Figure 6 with 1 supplement
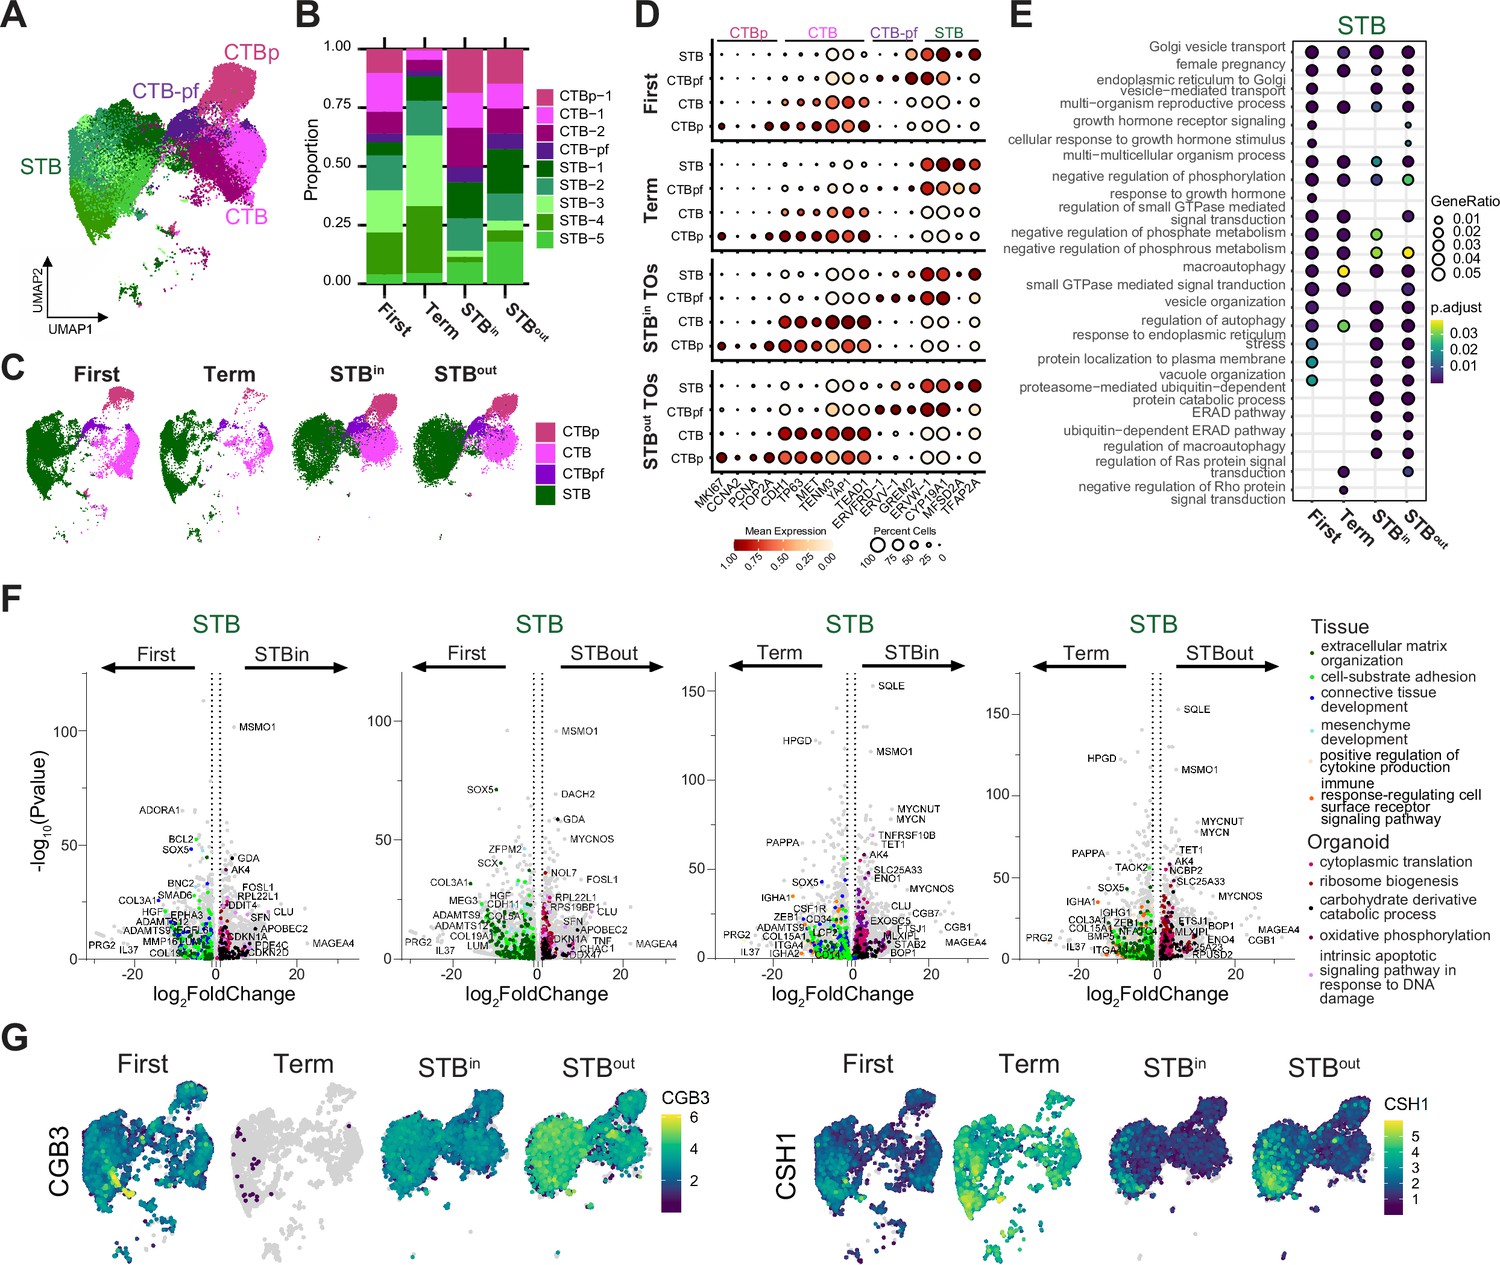
Similarities and differences between STB in first trimester and full-term tissue and TOs.
(A) UMAP of the integrated SN dataset including first trimester, full-term tissue, STBin TOs, and STBout TOs. (B) Relative proportion of each nucleus type for each sample in the integrated dataset in A. (C) UMAP of the integrated dataset split by sample type. The five STB subtypes were merged into a single STB subtype while the two non-proliferative CTB subtypes were merged. (D) Dot plot of key trophoblast marker genes in the STB lineage with heatmap representing mean gene expression and size of the dot representing the percent of nuclei expressing each marker. The labels on the top of the graph refer to the established marker genes used to identify the identity of each cluster. (E) The top DEG in the STB of each sample type were analyzed for biological process GO term enrichment with clusterProfiler and plotted as a dotplot. (F) DEseq2 was used to find DEGs between different sample types for the merged STB cluster. GO terms for DEGs enriched in each sample type were found with ClusterProfiler and colored on the UMAP with select representative genes highlighted in text. (G) Feature plots demonstrating RNA expression of selected genes.
Figure 6—figure supplement 1
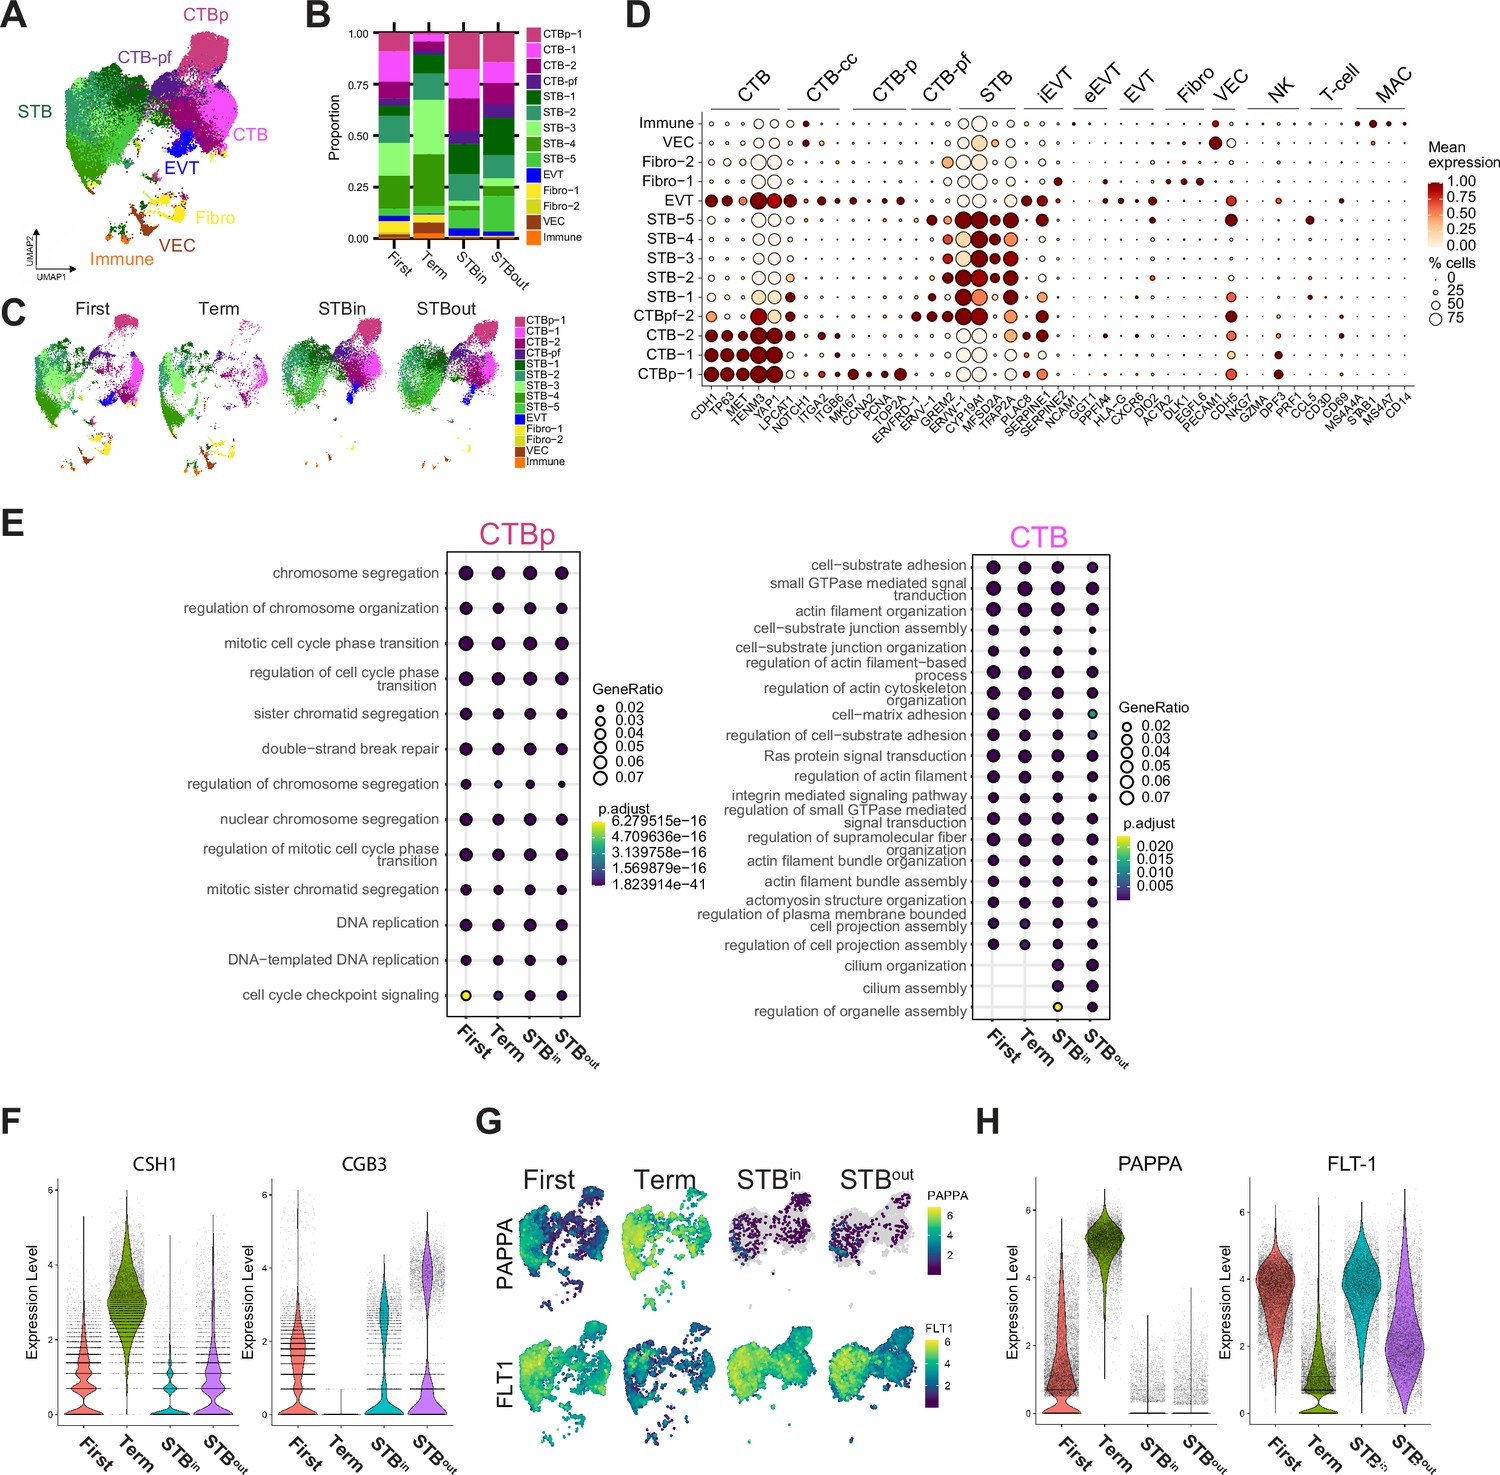
Characterization of nucleus types in merged SN dataset with TOs, first trimester, and full-term tissue.
(A) UMAP of the integrated SN dataset including first trimester, term tissue, STBin TOs, and STBout TOs. (B) Relative proportion of each nucleus type for each sample in the integrated dataset in A. (C) UMAP of each sample type split from the integrated dataset seen in A. (D) Dot plot of gene expression for the marker genes of each nucleus type of the entire integrated dataset, including nucleus types removed in A-C. The size of the dot demonstrates the percent of nuclei expressing a given gene and color represents the mean expression value. The labels on the top of the graph refer to the established marker genes used to identify the identity of each cluster. Nucleus types are annotated as follows: cytotrophoblasts (CTB), cytotrophoblast pre-fusion (CTB-pf), syncytiotrophoblast (STB), extravillous trophoblast (EVT), dendritic stem cell (DSC), vascular endothelial cell (VEC), fibroblast (Fib), natural killer cell (NK), and macrophage (MAC). (E) The top DEG for either CTB-p or CTB of each sample type were analyzed for GO term enrichment with clusterProfiler and plotted as a dotplot. CTB-pf was not analyzed due to the low number of CTB-pf cells found in full-term tissue. (F) Violin plot demonstrating gene expression of CSH1 and CGB3 in each sample type of the integrated dataset. (G) Feature plots demonstrating RNA expression of PAPPA and FLT-1. (H) Violin plot demonstrating gene expression of PAPPA and FLT-1 in each sample type of the integrated dataset.
Additional files
-
Supplementary file 1
Metadata of Tissues and TOs lines used in each experiment.
- https://cdn.elifesciences.org/articles/101170/elife-101170-supp1-v1.xlsx
-
Supplementary file 2
Gene markers used for cell/nucleus type identification.
- https://cdn.elifesciences.org/articles/101170/elife-101170-supp2-v1.xlsx
-
Supplementary file 3
Composition of term trophoblast organoid medium (tTOM).
- https://cdn.elifesciences.org/articles/101170/elife-101170-supp3-v1.xlsx
-
Supplementary file 4
Composition of EVT differentiation medium (EVTM).
- https://cdn.elifesciences.org/articles/101170/elife-101170-supp4-v1.xlsx
-
Supplementary file 5
sgRNAs sequence used for CRISPR/Cas9 mediated gene editing.
- https://cdn.elifesciences.org/articles/101170/elife-101170-supp5-v1.xlsx
-
Supplementary file 6
PCR primers used for sequencing validation.
- https://cdn.elifesciences.org/articles/101170/elife-101170-supp6-v1.xlsx
-
Supplementary file 7
Primary and Secondary FISH probe sequences.
- https://cdn.elifesciences.org/articles/101170/elife-101170-supp7-v1.xlsx
-
Supplementary file 8
Differentially expressed genes in each STB subtype in the STBin +STBout integrated dataset.
- https://cdn.elifesciences.org/articles/101170/elife-101170-supp8-v1.xlsx
-
Supplementary file 9
GO terms and representative genes from each STB subtypes in the STBin +STBout integrated dataset.
- https://cdn.elifesciences.org/articles/101170/elife-101170-supp9-v1.xlsx
-
Supplementary file 10
DEseq analysis of STB subtypes between STBin and STBout in the integrated dataset.
- https://cdn.elifesciences.org/articles/101170/elife-101170-supp10-v1.xlsx
-
Supplementary file 11
DEseq analysis of bulk sequencing from the WT and knock out TO lines.
- https://cdn.elifesciences.org/articles/101170/elife-101170-supp11-v1.xlsx
-
Supplementary file 12
Differentially expressed genes in the STB of STBin, STBout, first trimester tissue, and term tissue in the integrated Figure 6 dataset.
- https://cdn.elifesciences.org/articles/101170/elife-101170-supp12-v1.xlsx
-
Supplementary file 13
GO terms and representative genes from the STB of STBin, STBout, first trimester tissue, and term tissue in the integrated Figure 6 dataset.
- https://cdn.elifesciences.org/articles/101170/elife-101170-supp13-v1.xlsx
-
Supplementary file 14
DEseq analysis of STB between STBin, STBout, first trimester tissue, and term tissue in the integrated Figure 6 dataset.
- https://cdn.elifesciences.org/articles/101170/elife-101170-supp14-v1.xlsx
-
MDAR checklist
- https://cdn.elifesciences.org/articles/101170/elife-101170-mdarchecklist1-v1.pdf
Download links
A two-part list of links to download the article, or parts of the article, in various formats.
Downloads (link to download the article as PDF)
Open citations (links to open the citations from this article in various online reference manager services)
Cite this article (links to download the citations from this article in formats compatible with various reference manager tools)
Comparative analysis of the syncytiotrophoblast in placenta tissue and trophoblast organoids using snRNA sequencing
eLife 13:RP101170.
https://doi.org/10.7554/eLife.101170.3


