Translatome analysis reveals cellular network in DLK-dependent hippocampal glutamatergic neuron degeneration
- Department of Neurobiology, School of Biological Sciences, University of California San Diego, United States
- Biomedical Sciences Graduate Program, School of Medicine, University of California San Diego, United States
- Department of Neurosciences, School of Medicine, University of California San Diego, United States
- Kavli Institute for Brain and Mind, University of California San Diego, United States
Figures
Figure 1 with 2 supplements
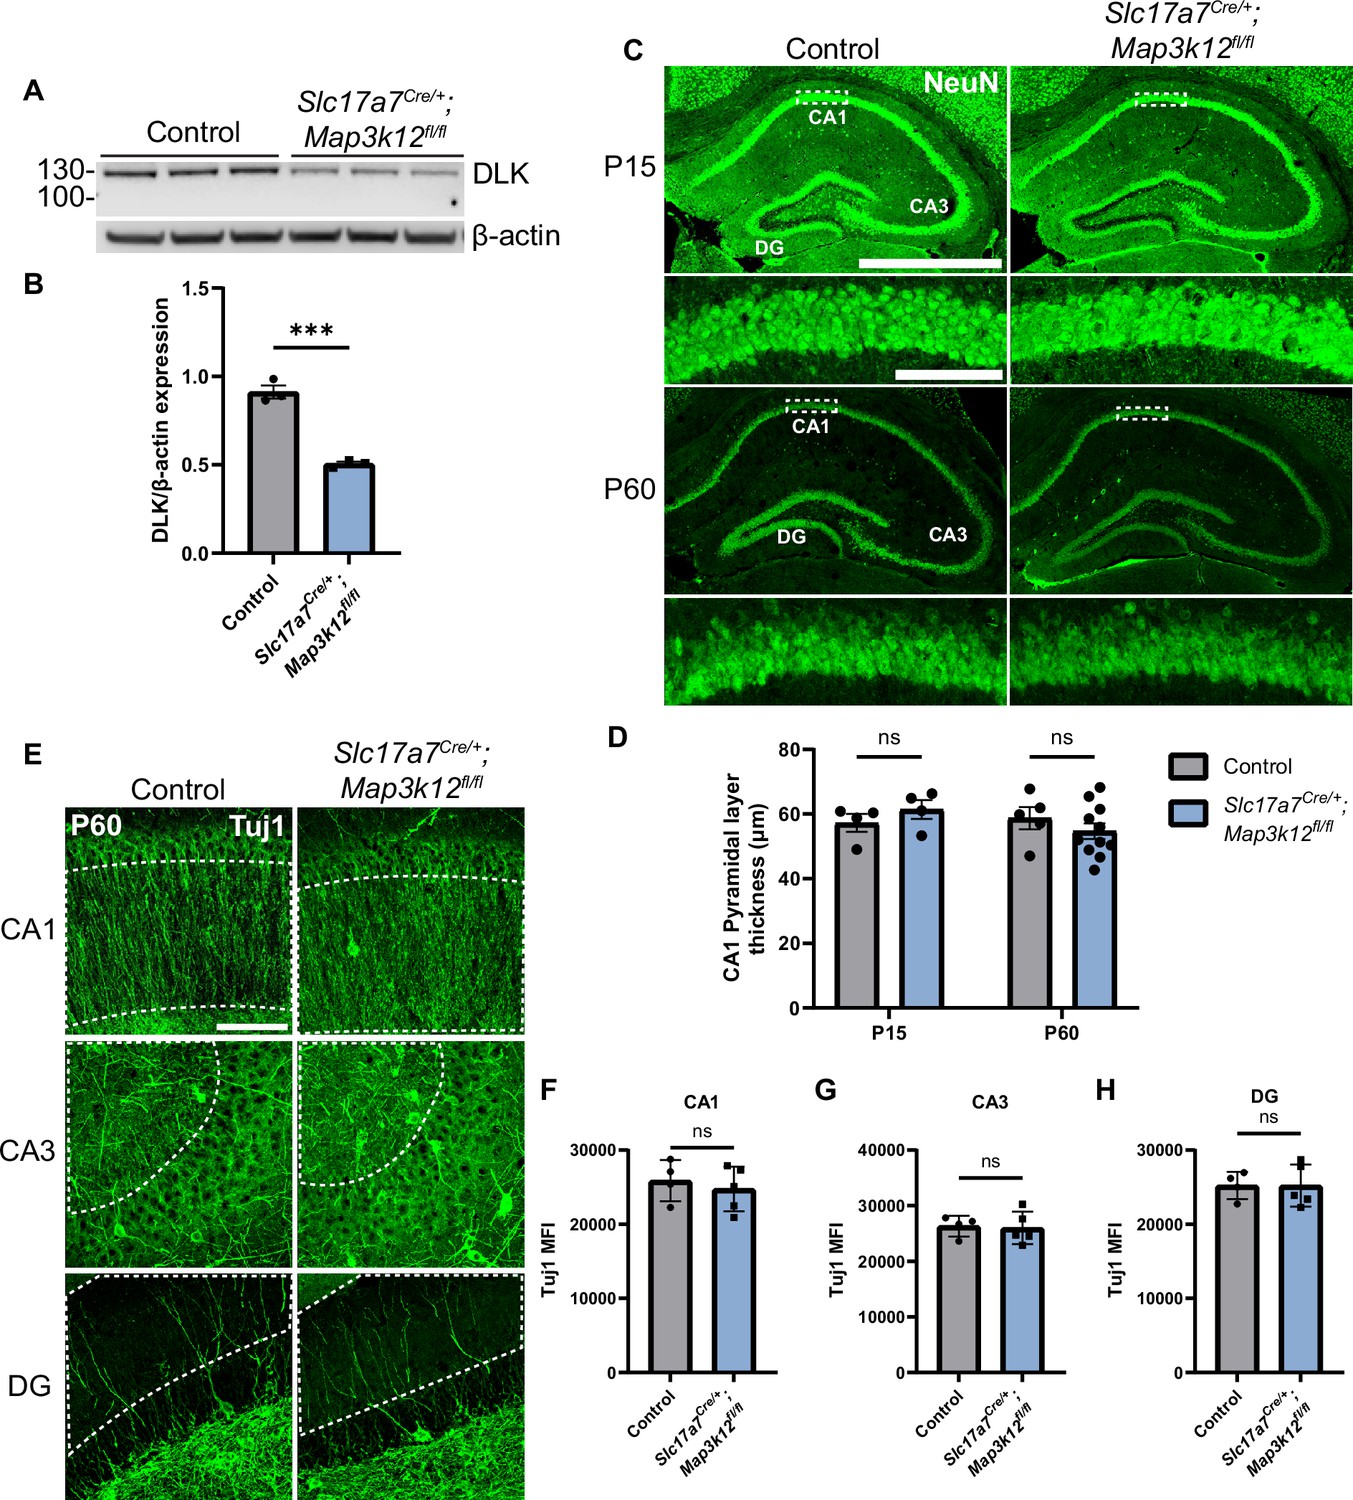
Deletion of DLK in postmitotic glutamatergic neurons does not alter gross morphology of hippocampus.
(A) Western blot of DLK and β-actin in protein extracts of hippocampal tissue of Slc17a7Cre/+;Map3k12fl/fl and Map3k12fl/fl littermate controls (age P60, each lane representing individual mice, N=3 mice/genotype). (B) Quantification of DLK protein level normalized to β-actin. Statistics: Unpaired t-test, *** p<0.001. Error bars represent SEM. (C) Confocal z-stack (max projection) images of NeuN immunostaining of coronal sections of the dorsal hippocampus in P15 and P60 mice of genotype indicated, respectively. Dashed boxes in CA1 pyramidal layers are enlarged below. Scale bar, 1000 μm in hippocampi; 100 μm in CA1 layer. (D) Quantification of CA1 pyramidal layer thickness. Each dot represents averaged thickness from 3 sections per mouse; N≥4 mice/genotype per timepoint. Statistics: Two-way ANOVA with Holm-Sidak multiple comparison test; ns, not significant. Error bars represent SEM. (E) Confocal z-stack (max projection) images of Tuj1 immunostaining of hippocampus CA1, CA3, and DG regions in control and Slc17a7Cre/+;Map3k12fl/fl mice (age P60). Dashed outlines mark ROI (region of interest) for fluorescence intensity quantification. Scale bar, 100 μm. (F, G, H) Tuj1 mean fluorescence intensity (MFI) after thresholding signals in dendritic regions in each hippocampal area. Each dot represents averaged intensity from 3 sections per mouse; N=4 control, 5 Slc17a7Cre/+;Map3k12fl/fl. Statistics: Unpaired t-test. ns, not significant. Error bars represent SEM.
-
Figure 1—source data 1
Original western blots for images shown in Figure 1A.
- https://cdn.elifesciences.org/articles/101173/elife-101173-fig1-data1-v1.zip
-
Figure 1—source data 2
PDF showing original western blots for images shown in Figure 1A, along with relevant bands and genotypes.
Original membranes corresponding to Panel A. Molecular weights shown using PageRuler Plus Prestained Protein Ladder. See Figure 1—figure supplement 1—source data 2 for more details. Each lane represents a separate mouse. Lanes 1–3 show control samples, lanes 4–6 show DLK(cKO).
- https://cdn.elifesciences.org/articles/101173/elife-101173-fig1-data2-v1.zip
Figure 1—figure supplement 1
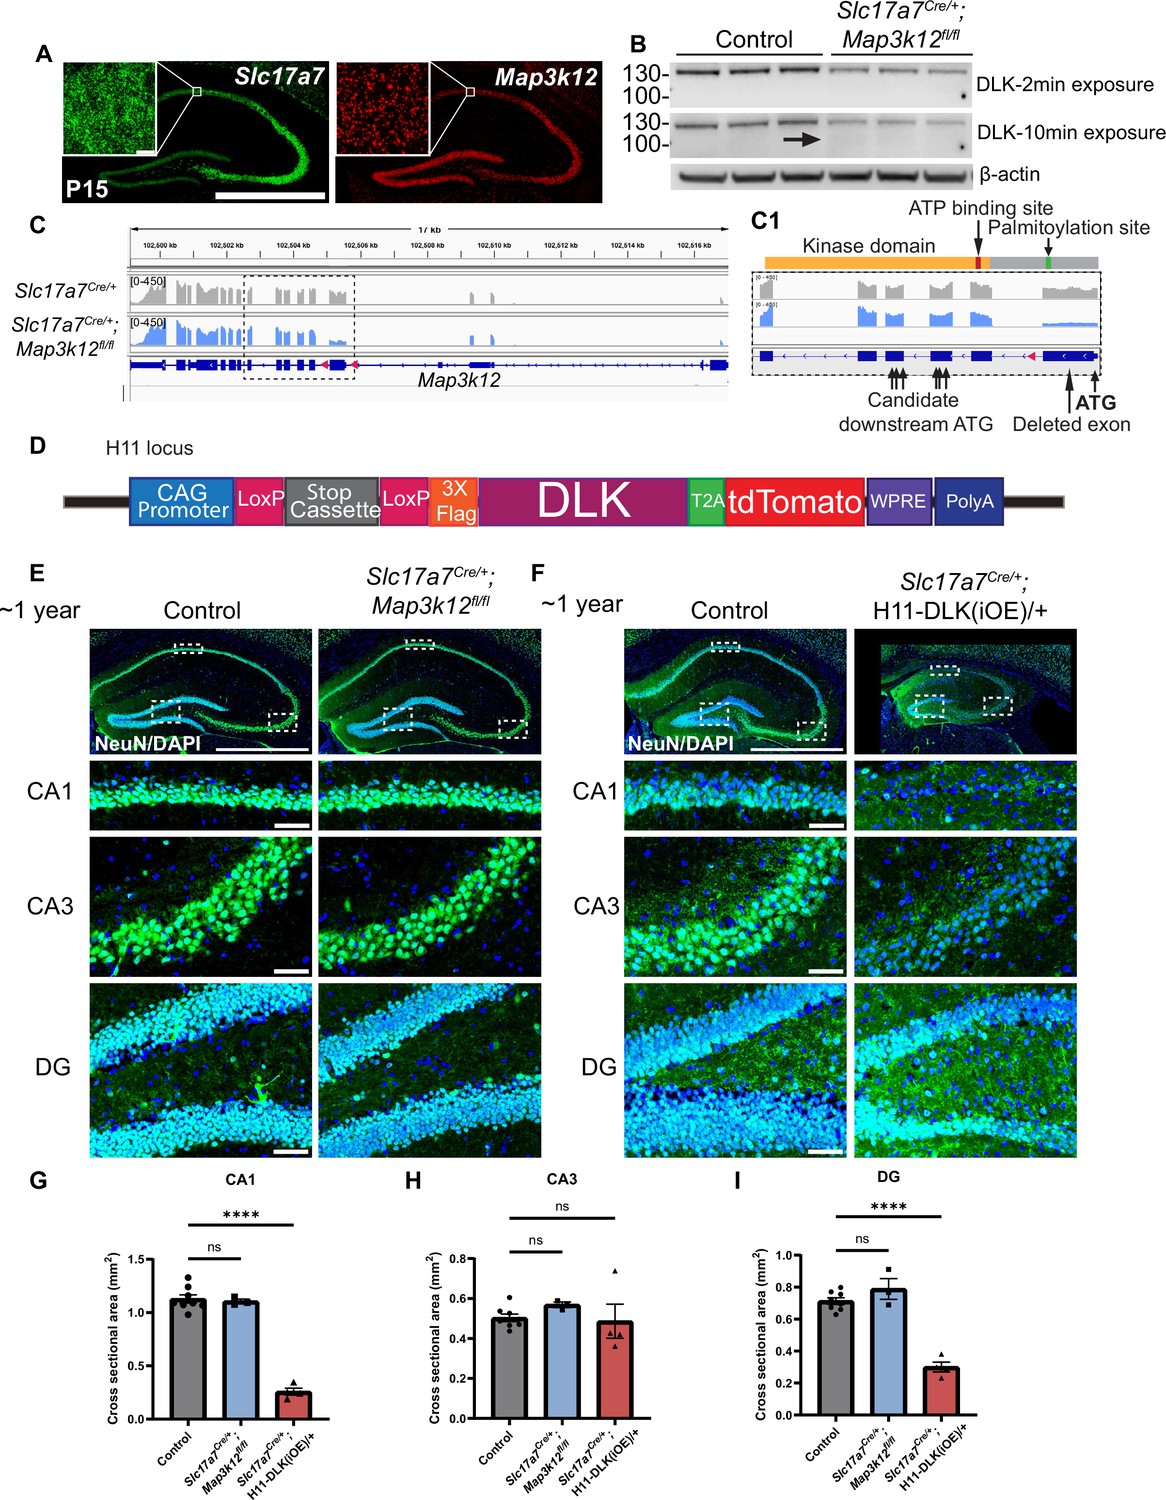
Additional evidence for expression levels of DLK and effects on hippocampal morphology at 1 year of age.
(A) Confocal images of Map3k12 (DLK) and Slc17a7 (VGLUT1) RNAscope analysis in hippocampal glutamatergic neurons at P15. Scale bar 1000 μm, 10 μm zoomed ROI. (B) Western blot of DLK and β-actin from protein extracts of hippocampal tissue of genotype indicated (age P60, each lane representing individual mice, N=3 mice/genotype). Arrow points to faint band of lower molecular weight in DLK(cKO) that is visible only under longer exposure, which may represent N-terminal truncated DLK produced using an alternative start codon (see C1). (C) IGV visual representation of RiboTag reads of Map3k12 (DLK) in Slc17a7Cre/+ and Slc17a7Cre/+;Map3k12fl/fl, showing that mRNA for the floxed exon is reduced to ~1/3 level of control, while mRNA for other exons remained at a similar level as control. Dark blue illustration shows Map3k12 exon-intron structure, with pink triangles denoting loxP sites. Height of reads (y-axis) in gray or blue represents number of reads for the respective sequence. (C1) Enlarged view of the dashed box in C, corresponding to the floxed exon and exons encoding the kinase domain shown in orange with red marking ATP binding site and green marking DLK palmitoylation site. Start ATG shown in bold, and candidate downstream alternative start ATGs labeled with arrows. (D) Illustration of DLK overexpression transgene. (E,F) Confocal z-stack images of NeuN immunostaining and DAPI of coronal sections of dorsal hippocampus in mice of genotype indicated, with enlarged view of CA1, CA3, and DG (dashed boxes, respectively). ~1-year-old control and Slc17a7Cre/+;Map3k12fl/fl mice for (E); 44–46 weeks old, control and Slc17a7Cre/+;H11-DLK(iOE)/+ mice for (F). Scale bar hippocampus 1000 μm, enlarged view 50 μm. (G, H, I) Quantification of cross-sectional area from CA1, CA3, or DG in dorsal hippocampus, respectively (as outlined in Figure 1—figure supplement 2A and C). Data points represent individual mice, averaged across 3 sections per mouse, N≥3 mice/genotype. Statistics: One way ANOVA with Dunnett’s multiple comparison test. ns, not significant; **** p<0.0001. Error bars represent SEM.
-
Figure 1—figure supplement 1—source data 1
Original western blots for images shown in Figure 1—figure supplement 1B.
- https://cdn.elifesciences.org/articles/101173/elife-101173-fig1-figsupp1-data1-v1.zip
-
Figure 1—figure supplement 1—source data 2
PDF showing original western blots for images shown in Figure 1—figure supplement 1B, along with relevant bands and genotypes.
Original membranes corresponding to Panel B. Molecular weights shown using PageRuler Plus Prestained Protein Ladder. 10 min exposure (uncut membrane) was taken prior to 2 min exposure. Following 10 min exposure, membrane was cut and reprobed for DLK for 2 min exposure. Each lane represents a separate mouse. Lanes 1–3 show control samples, lanes 4–6 show DLK(cKO).
- https://cdn.elifesciences.org/articles/101173/elife-101173-fig1-figsupp1-data2-v1.zip
Figure 1—figure supplement 2
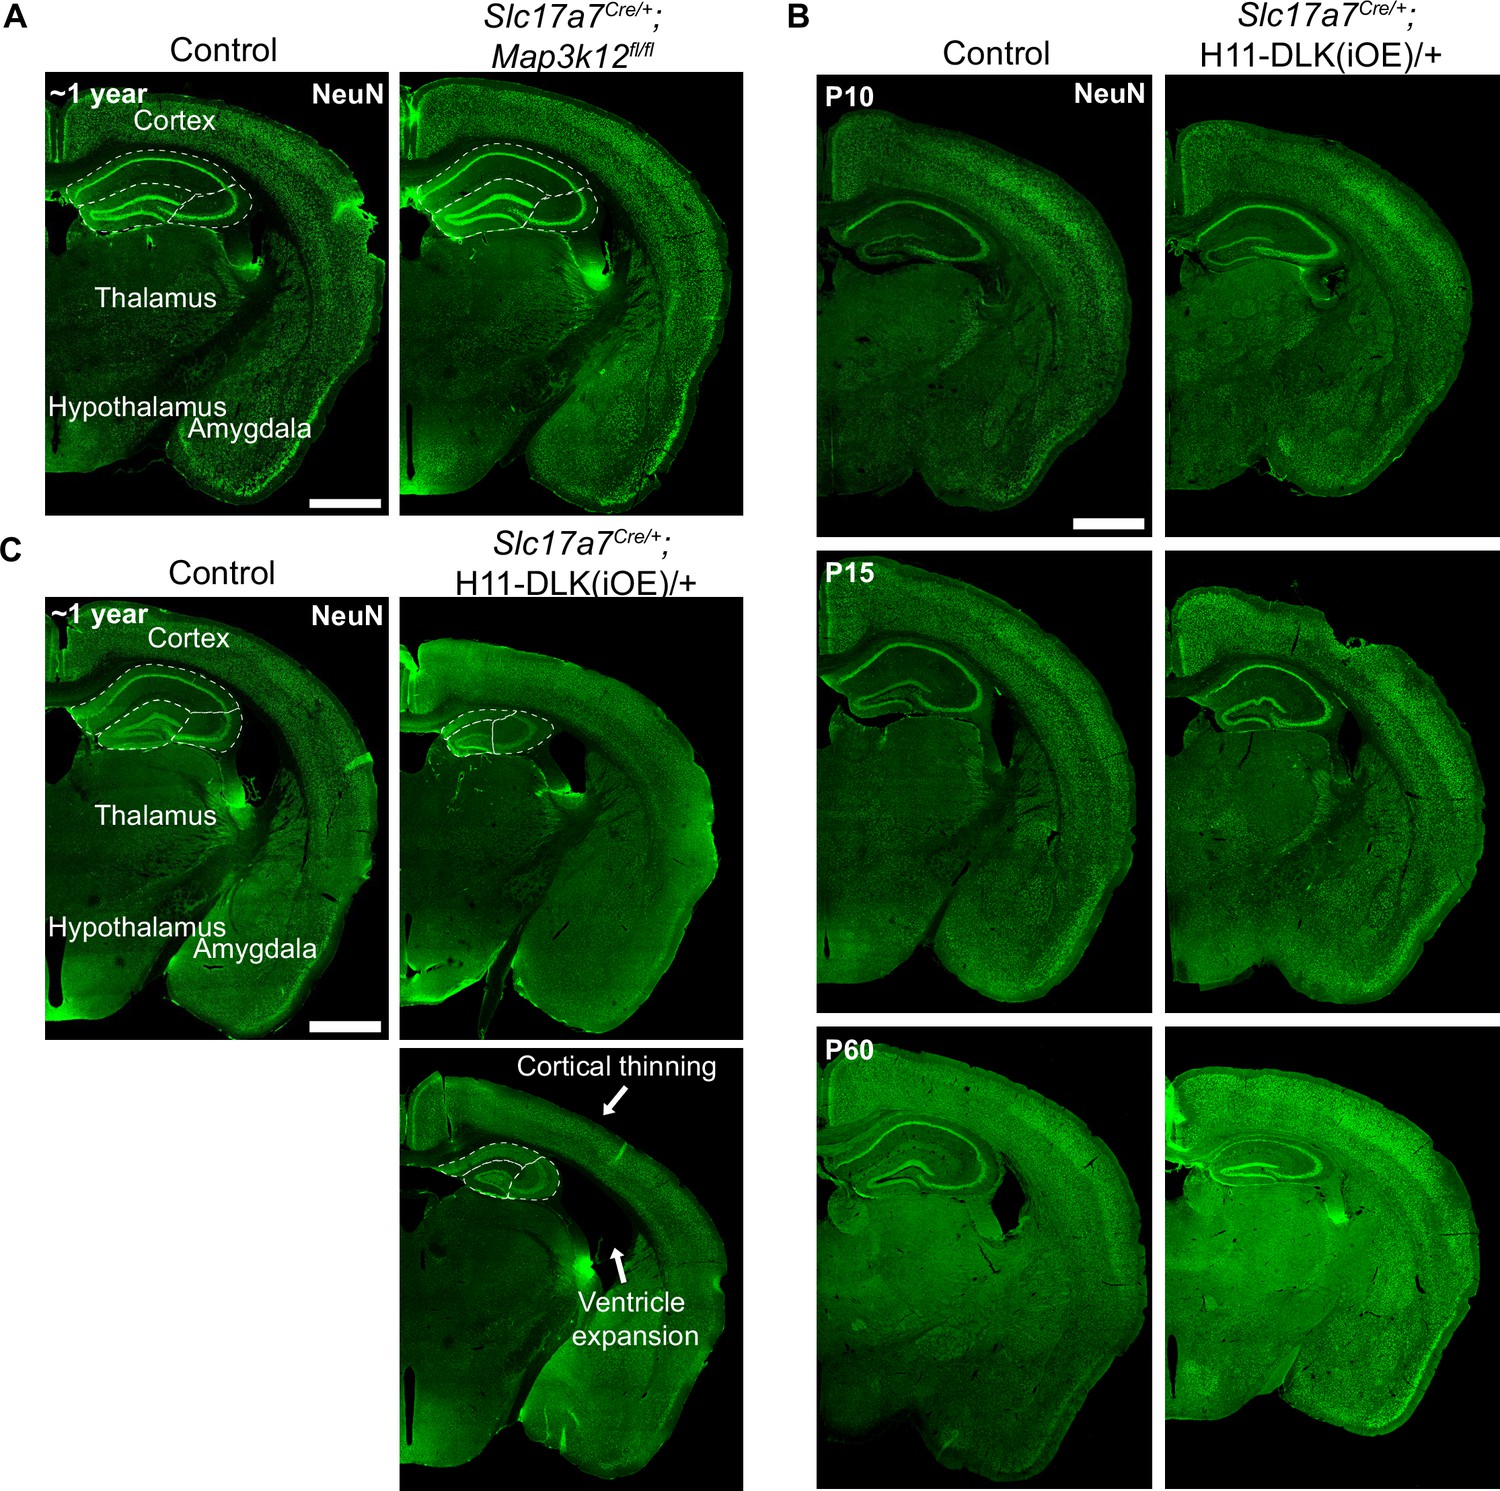
Hemibrain images across timepoints.
Shown are lower magnification confocal images of NeuN staining of coronal sections of mice of genotype and age indicated. (A) ~1-year-old control and Slc17a7Cre/+;Map3k12fl/fl animals. (B) P10, P15, and P60 control and Slc17a7Cre/+;H11-DLK(iOE)/+ nimals. P60 tissue sections were stained at different time from those at P10, P15. (C) ~44–46 week old control and Slc17a7Cre/+;H11-DLK(iOE)/+ animals. Arrows point to cortical thinning and ventricle expansion observed in some animals. Scale bar: 1000 μm.
Figure 2 with 3 supplements
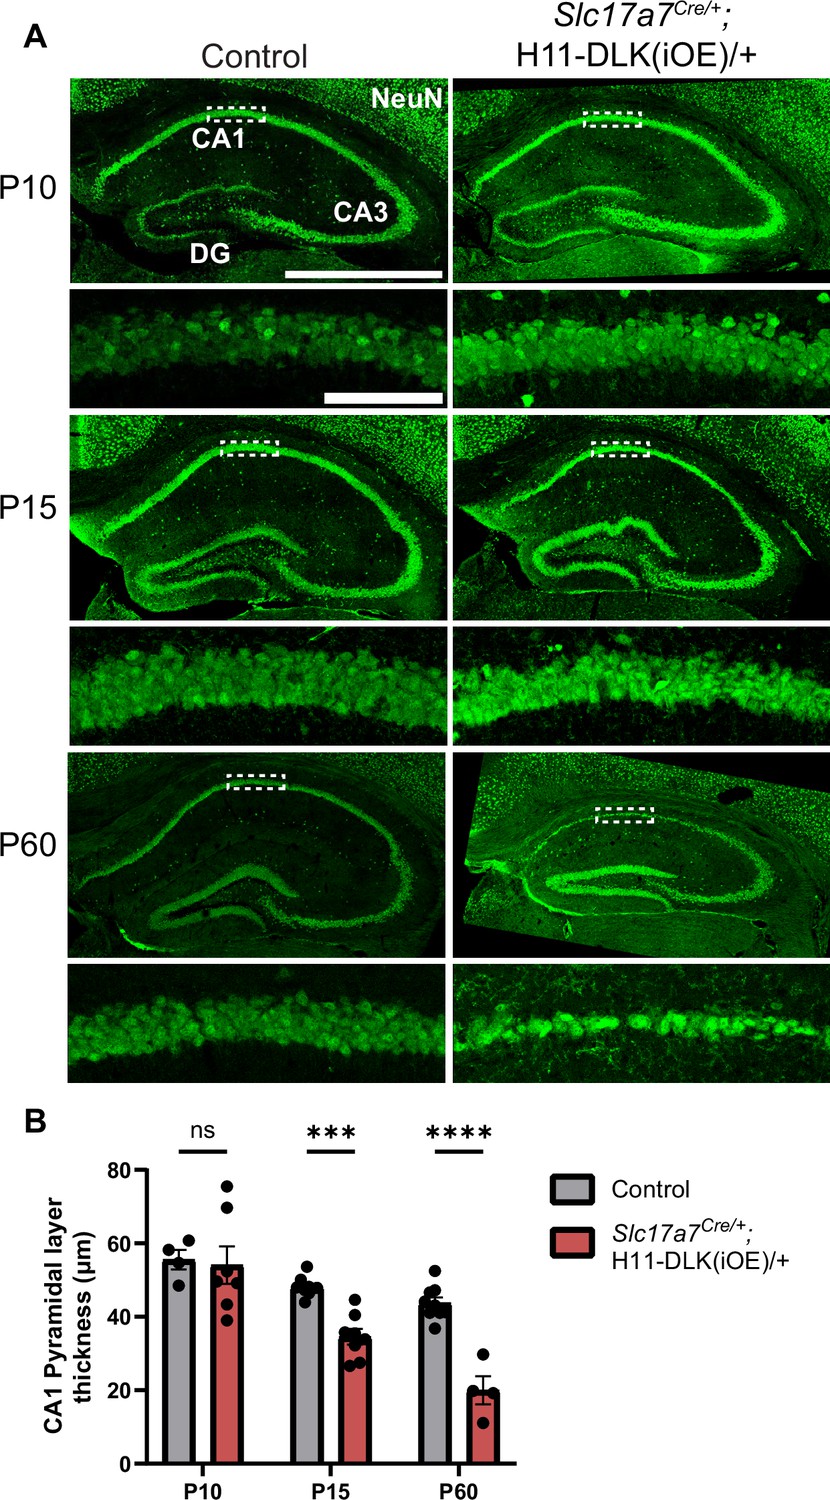
Induced DLK overexpression in hippocampal glutamatergic neurons causes degeneration of CA1 neurons.
(A) Confocal z-stack (max projection) images of NeuN immunostaining of coronal sections from dorsal hippocampus in P10, P15, and P60 mice of genotype indicated. Dashed boxes mark CA1 pyramidal layers enlarged below. P60 images shown under different settings compared to P10 and P15 due to older staining. Scale bar, 1,000 μm in hippocampi; 100 μm in CA1 layer. (B) Quantification of CA1 pyramidal layer thickness. Data points represent averaged measurement from 3 sections per mouse, N≥4 mice/genotype at each timepoint. Statistics: Two-way ANOVA with Holm-Sidak multiple comparison test. ns, not significant; *** p<0.001; **** p<0.0001. Error bars represent SEM.
Figure 2—figure supplement 1
Evidence for induced DLK expression visualized at RNA and protein levels.
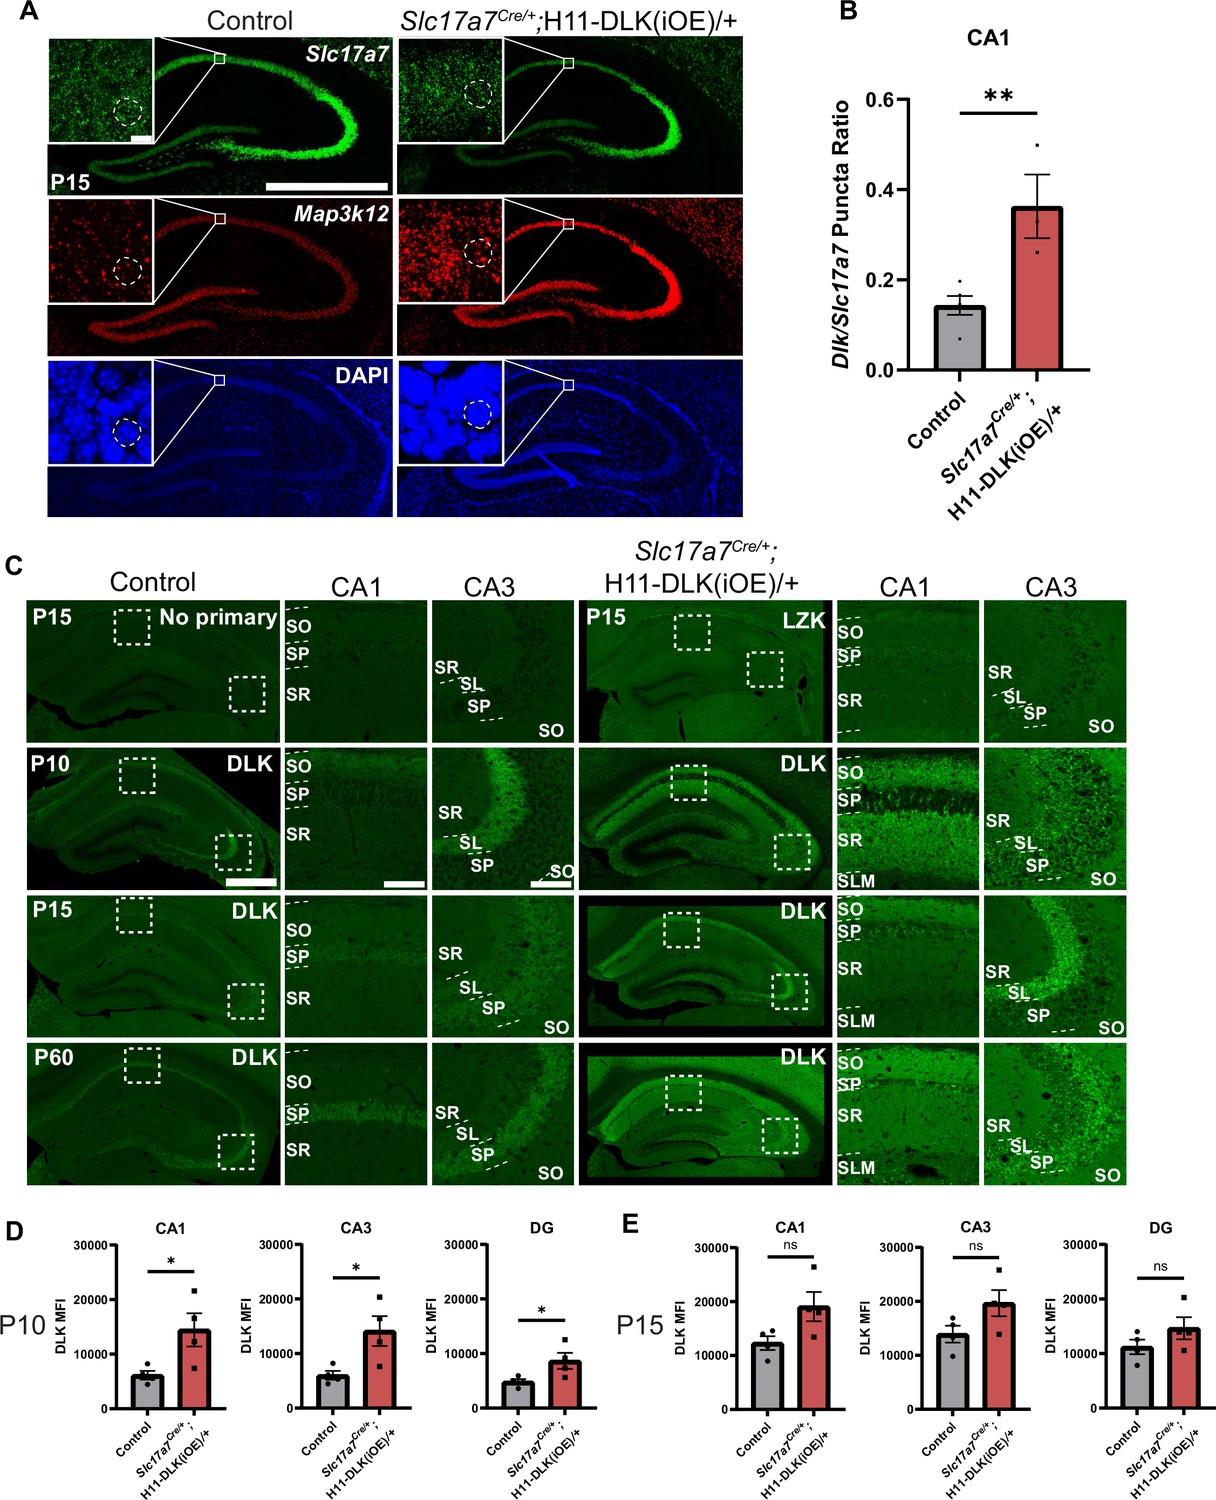
(A) Confocal z-stack images of Slc17a7 and Map3k12 mRNAs at P15 in control and Slc17a7Cre/;H11-DLK(iOE)/+ mice. Scale bar: 1000 μm. Inset shows single slice image of CA1 neurons, with dashed line showing individual nuclei as used for quantification. Scale bar: 10 μm. (B) Quantification of RNAscope puncta shown as ratio of Map3k12 to Slc17a7 within individual CA1 neuron nuclei. Data points represent individual mice, averaged across 3 sections per mouse, ≥50 cells per genotype, N=5, 3 mice. Statistics: Mann-Whitney U test. ** p<0.01. Error bars represent SEM. (C) Confocal z-stack images of control and Slc17a7Cre/+;H11-DLK(iOE)/+ mice immunostained for DLK protein (P15, P60,~1 year) or no primary or LZK antibody control (P15) Dashed boxes are enlarged to the right. Individual strata are labeled in CA1, CA3; stratum pyramidale (SP), stratum radiatum (SR), stratum oriens (SO), stratum lacunosum-moleculare (SLM), stratum lucidum (SL). Scale bar 500 μm in hippocampi, 100 μm in CA1 and CA3. (D, E) Quantification of DLK mean fluorescence intensity from all layers in CA1, CA3, and DG at P10 (D) and P15 (E). N=4 mice/genotype for each timepoint. Statistics: Unpaired t-test. ns, not significant; * p<0.05. Error bars represent SEM.
Figure 2—figure supplement 2
Regional vulnerability observed with increased DLK expression.
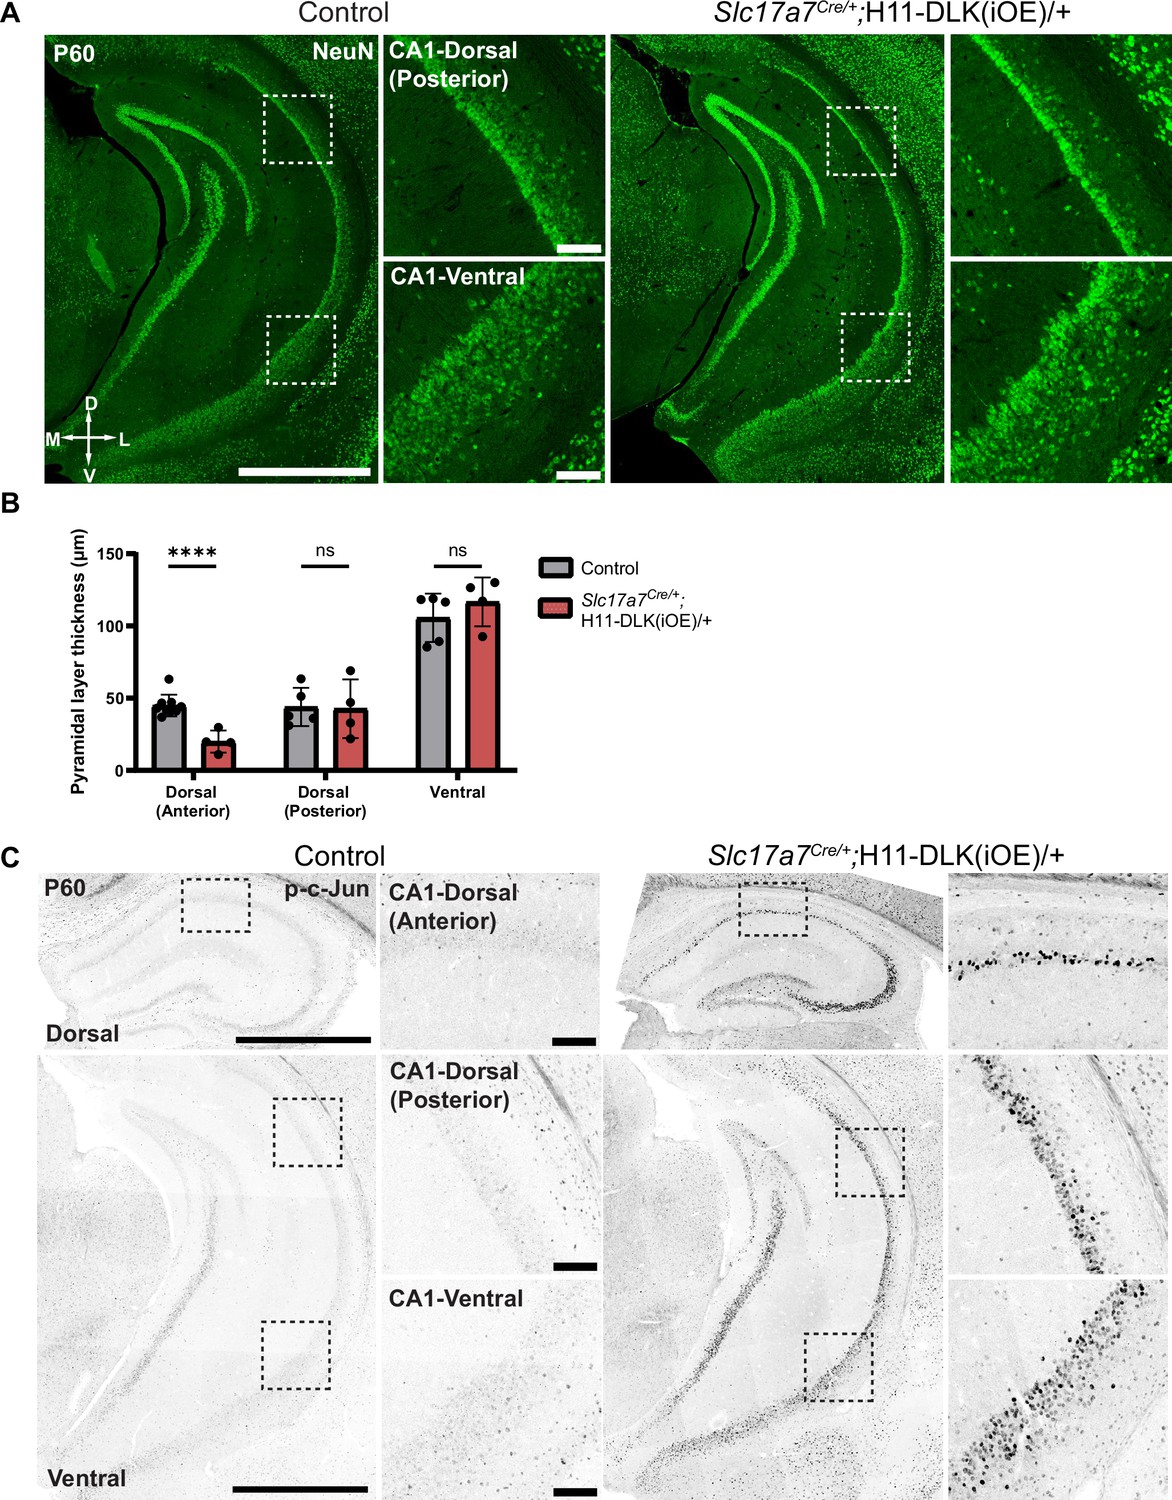
(A) Confocal z-stack images of NeuN immunostaining in ventral hippocampus in control and Slc17a7Cre/+;H11-DLK(iOE)/+ mice (P60). Dashed line regions are enlarged to the right, showing dorsal (posterior) CA1 neurons (top) with some thinning of pyramidal layer in mice with increased DLK, and ventral CA1 neurons (bottom) appearing similar between genotypes. Scale bar: 1000 μm in hippocampi; 100 μm in CA1 layer. (B) Quantification of pyramidal layer thickness across CA1, with CA1 dorsal (anterior) data from Figure 1B. Data points represent individual mice, averaged across 2–3 sections per mouse. Statistics: Unpaired t-test. ns, not significant; **** p<0.0001. Error bars represent SEM. (C) Confocal z-stack images of p-c-Jun immunostaining in dorsal and ventral hippocampus of mice of indicated genotype at P60. Dashed line regions are enlarged to the right. Scale bar: 1000 μm in hippocampi; 100 μm in CA1 layer.
Figure 2—figure supplement 3
Additional evidence for DLK(iOE) induced hippocampal neuron death.
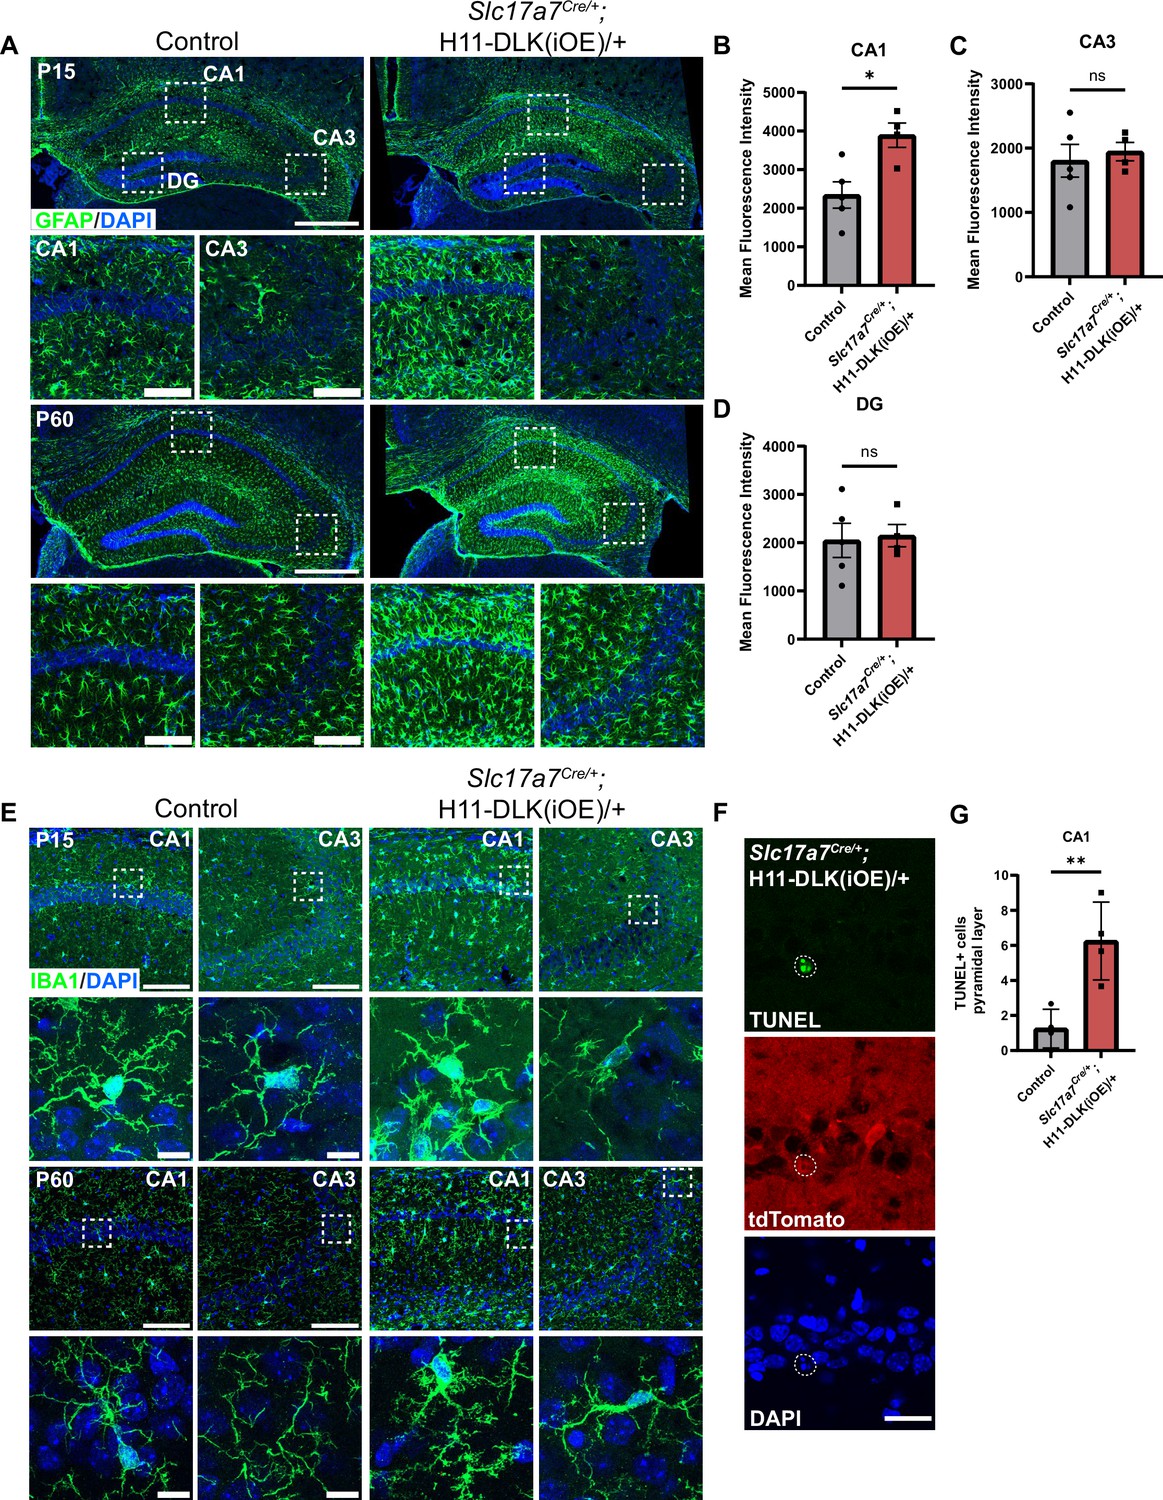
(A) Confocal z-stack imaging of GFAP immunostaining of hippocampus in mice of genotype indicated at P15 and P60, with enlarged view of the dashed boxes for CA1, CA3 shown below. Scale bar: 500 μm in hippocampi, 100 μm in CA1 and CA3. (B–D) Mean fluorescent intensity of GFAP in CA1, CA3, and DG regions (boxed area in A), respectively at P15. N=5, 4 mice, quantified from 3 sections per mouse. Statistics: Unpaired t-test. ns, not significant; * p<0.05. Error bars represent SEM. P15, P60 GFAP animals imaged under separate conditions due to staining at different times. (E) Confocal z-stack images of IBA1 immunostaining of hippocampus in mice of genotype indicated at P15 and P60. Boxed microglia for CA1 and CA3 are enlarged below. Scale bar 100 μm in CA1 and CA3 top, 10 μm in individual microglia bottom. (F) Confocal single-slice images showing TUNEL positive CA1 pyramidal neuron in P15 Slc17a7Cre/+;H11-DLK(iOE)/+ overlapping with tdTomato expressed from DLK(iOE) transgene and pyknotic nuclei (DAPI). Scale bar, 25 μm. (G) Quantification of TUNEL positive neurons in CA1 pyramidal layer in genotype indicated. Data points represent individual mice, averaged across 3 sections per mouse, N=4 mice. Statistics: Unpaired t-test. ** p<0.01. Error bars represent SEM.
Figure 3 with 2 supplements
Differentially expressed genes revealed by RiboTag analysis of hippocampal glutamatergic neurons in DLK(cKO) and DLK(iOE) mice.
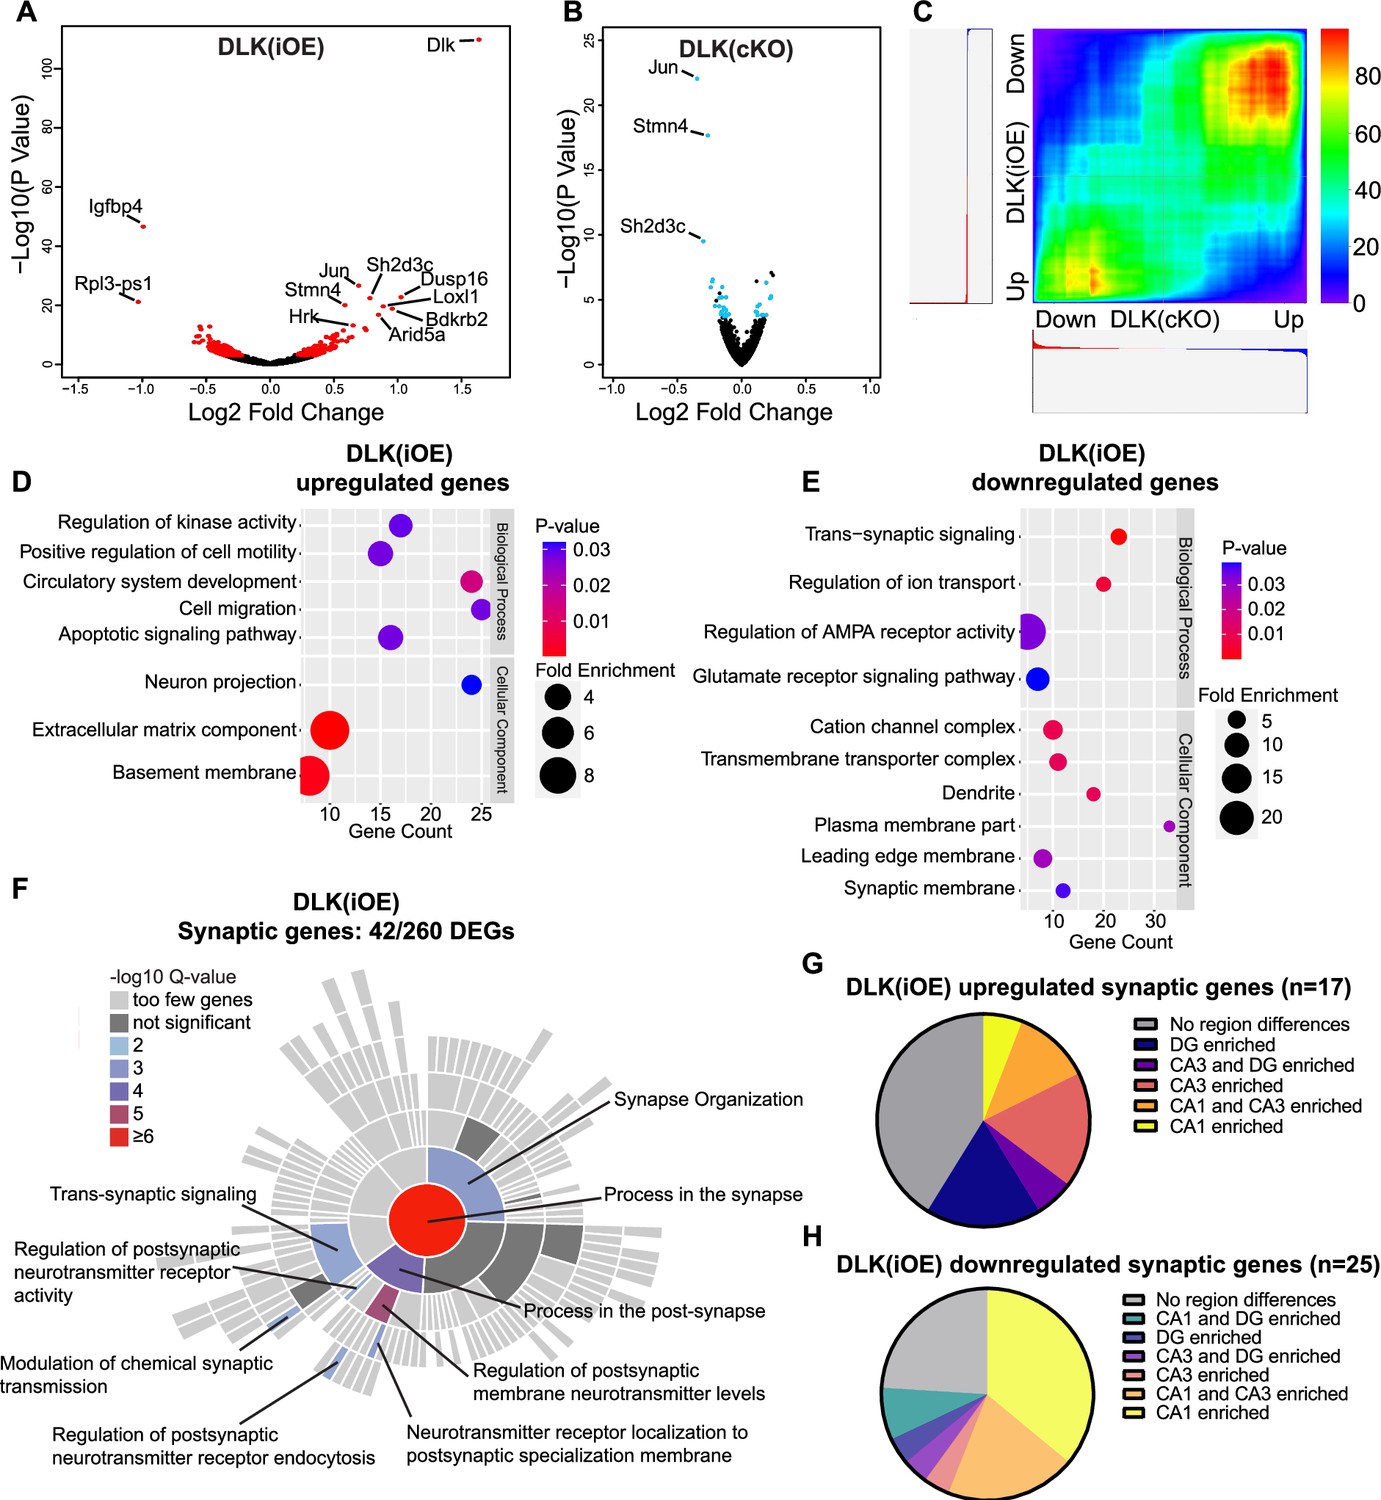
(A) Volcano plot showing RiboTag analysis in Slc17a7Cre/+;H11-DLK(iOE)/+;Rpl22HA/+vs Slc17a7Cre/+;Rpl22HA/+ (age P15). 260 genes (red) show differential expression with adjusted p-values <0.05 in Slc17a7Cre/+;H11-DLK(iOE)/+, compared to control; names of genes with p<1E-10 are labeled. (B) Volcano plot showing RiboTag analysis in Slc17a7Cre/+;Map3k12fl/fl;Rpl22HA/+ vs Slc17a7Cre/+;Rpl22HA/+ (age P15). 36 genes (blue) show differential expression with adjusted p-values <0.05; names of genes with p<1E-10 are labeled. (C) Rank-rank hypergeometric overlap (RRHO) comparison of gene expression in DLK(cKO) and DLK(iOE) RiboTag datasets shows enrichment of similar genes when DLK is low or high, respectively. Color represents the -log transformed hypergeometric p-values (blue for weaker p-value, red for stronger p-value). (D, E) Gene ontology (GO) analysis of significantly up- or down-regulated genes in hippocampal glutamatergic neurons of DLK(iOE) mice compared to the control. Colors correspond to p-values; circle size represents fold enrichment for the GO term; X position shows # of genes significantly enriched in the GO term. (F) SynGO sunburst plot shows enrichment of 42 differentially expressed genes from hippocampal glutamatergic neurons of DLK(iOE) mice, with color corresponding to significance. (G, H) Pie charts show distribution of the 42 synaptic genes up- or down- regulated in DLK(iOE), respectively, in CA1, CA3, and DG in dorsal hippocampus, based on in situ data (P56) in the Allen Mouse Brain Atlas.
Figure 3—figure supplement 1
Evidence for RiboTag immunoprecipitated samples and additional analysis of genes showing differential dependence on DLK expression levels.
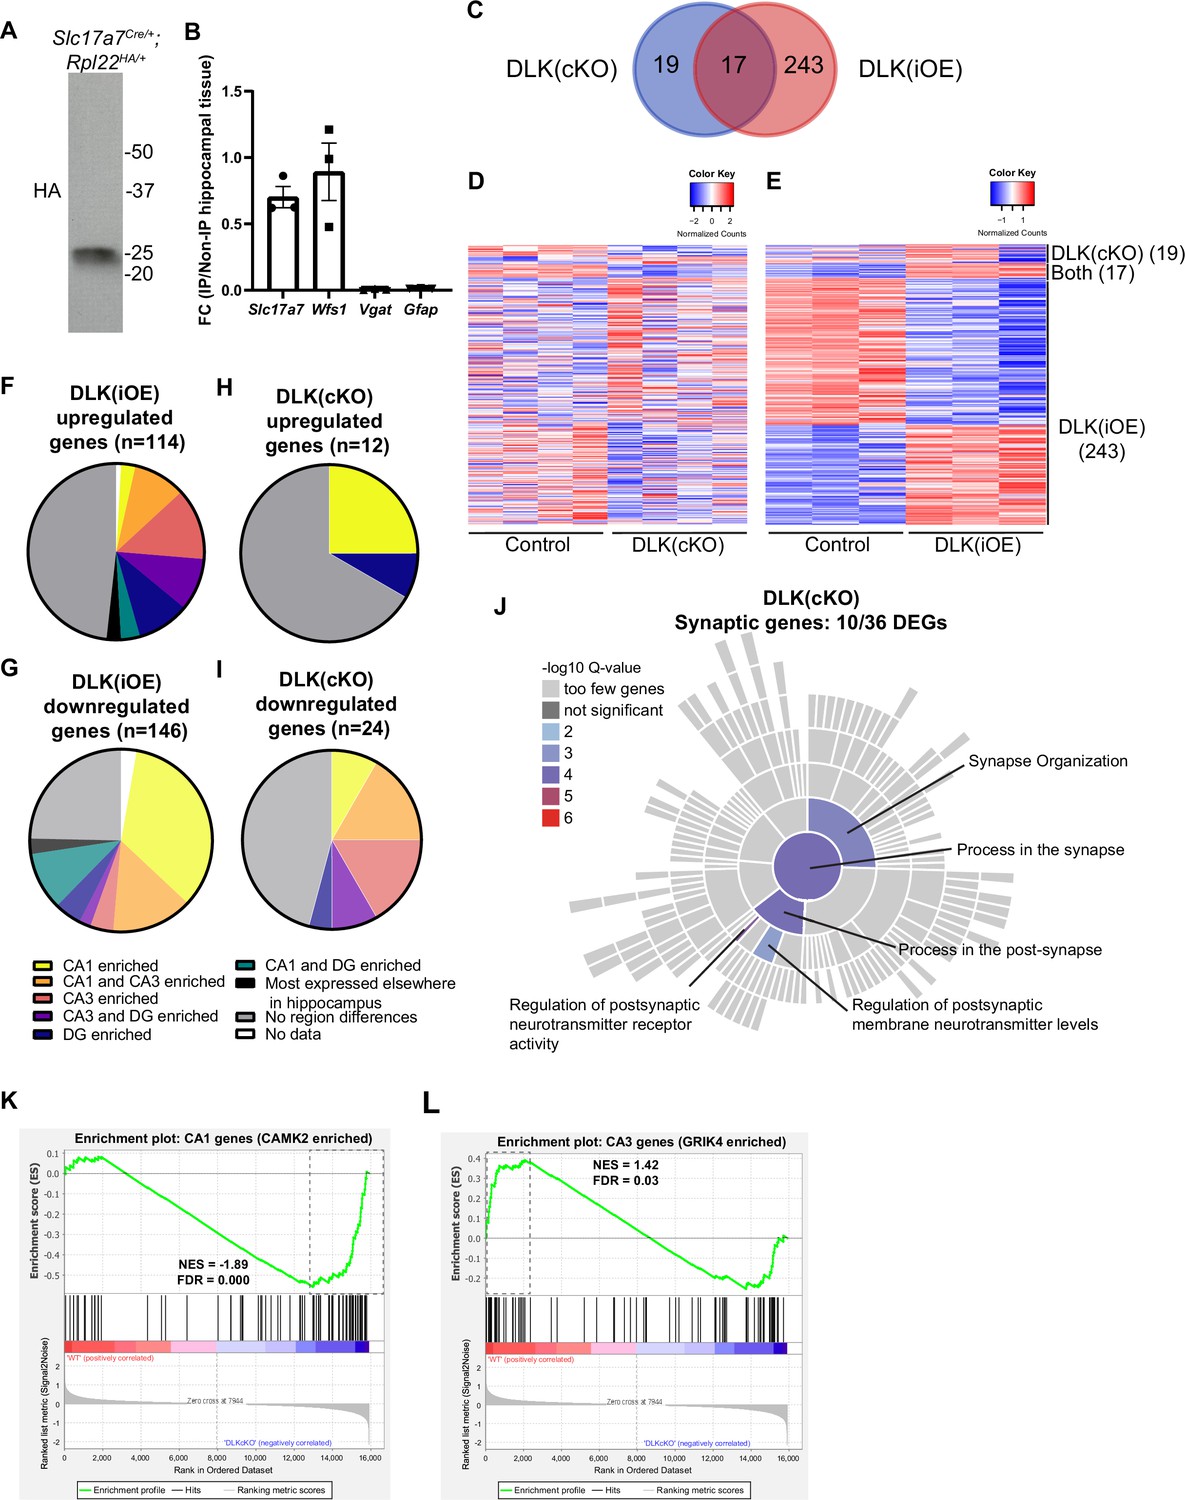
(A) Western blot of HA-tagged Rpl22 immunoprecipitates. (B) qRT-PCR analysis of Slc17a7 (glutamatergic neurons), Wfs1 (CA1), Vgat (inhibitory neurons), Gfap (astrocytes) shows expression of transcripts for glutamatergic neurons and depletion of non-glutamatergic neuron transcripts. N=3 biological replicates, data shown as expression fold change for marker genes in immunoprecipitated glutamatergic neuron RNAs relative to whole hippocampal RNAs, normalized to Gapdh. (C) Venn diagram showing overlap of statistically significant differentially expressed genes by RiboTag analysis of glutamatergic neurons in DLK(cKO) and DLK(iOE). (D, E) Heatmaps of the differentially expressed genes in glutamatergic neurons in DLK(cKO) and DLK(iOE). Columns represent expression levels in individual mice; rows represent individual genes, and the right-hand labels the RiboTag dataset where a given gene shows statistical significance. Data were normalized by row, with color keys shown above the heatmap. (F, G, H, I) Pie charts show distribution of differentially expressed genes detected in DLK(iOE) or DLK(cKO) in hippocampal neurons, based on in situ data in the Allen Mouse Brain Atlas (P56 mice). (J) SynGO sunburst plot shows enrichment of 10 differentially expressed genes from hippocampal glutamatergic neurons of DLK(cKO) mice, with color corresponding to significance. (K, L) GSEA enrichment plots show distribution of CA1 or CA3 genes from higher expression in WT to higher expression in DLK(cKO). Entire list of translated genes is represented by red to blue spectrum, genes expressed higher in WT in red, genes expressed higher in DLK(cKO) in blue (Supplementary file 1. WT vs DLK(cKO) DEGs). Vertical black lines (middle) represent genes in the respective gene set and where each lies along the spectrum from genes higher in WT to genes higher in DLK(cKO). Gene set for (K) CA1 genes (enriched in CAMK2 vs GRIK4 neurons); (L) CA3 genes (enriched in GRIK4 vs CAMK2 neurons) (Supplementary file 3 CamK2 Grik4 enriched genes). Green line reflects running enrichment score (negative value representing CA1 genes tending to be more expressed in DLK(cKO)). Dashed box highlights region contributing to enrichment score. (K) Normalized enrichment score –1.89. False discovery rate q-value: 0.000; (L) Normalized enrichment score 1.42. False discovery rate q-value: 0.030.
-
Figure 3—figure supplement 1—source data 1
Original western blots for images shown in Figure 3—figure supplement 1A.
- https://cdn.elifesciences.org/articles/101173/elife-101173-fig3-figsupp1-data1-v1.zip
-
Figure 3—figure supplement 1—source data 2
PDF showing original western blot for image shown in Figure 3—figure supplement 1A, along with relevant band and genotype.
Original membranes corresponding to Panel A. Molecular weights shown using Precision Plus Protein Dual Color Ladder. Rpl22-HA is 23 kDa protein.
- https://cdn.elifesciences.org/articles/101173/elife-101173-fig3-figsupp1-data2-v1.zip
Figure 3—figure supplement 2
Levels of c-Jun and p-c-Jun show dependency on expression levels of DLK.
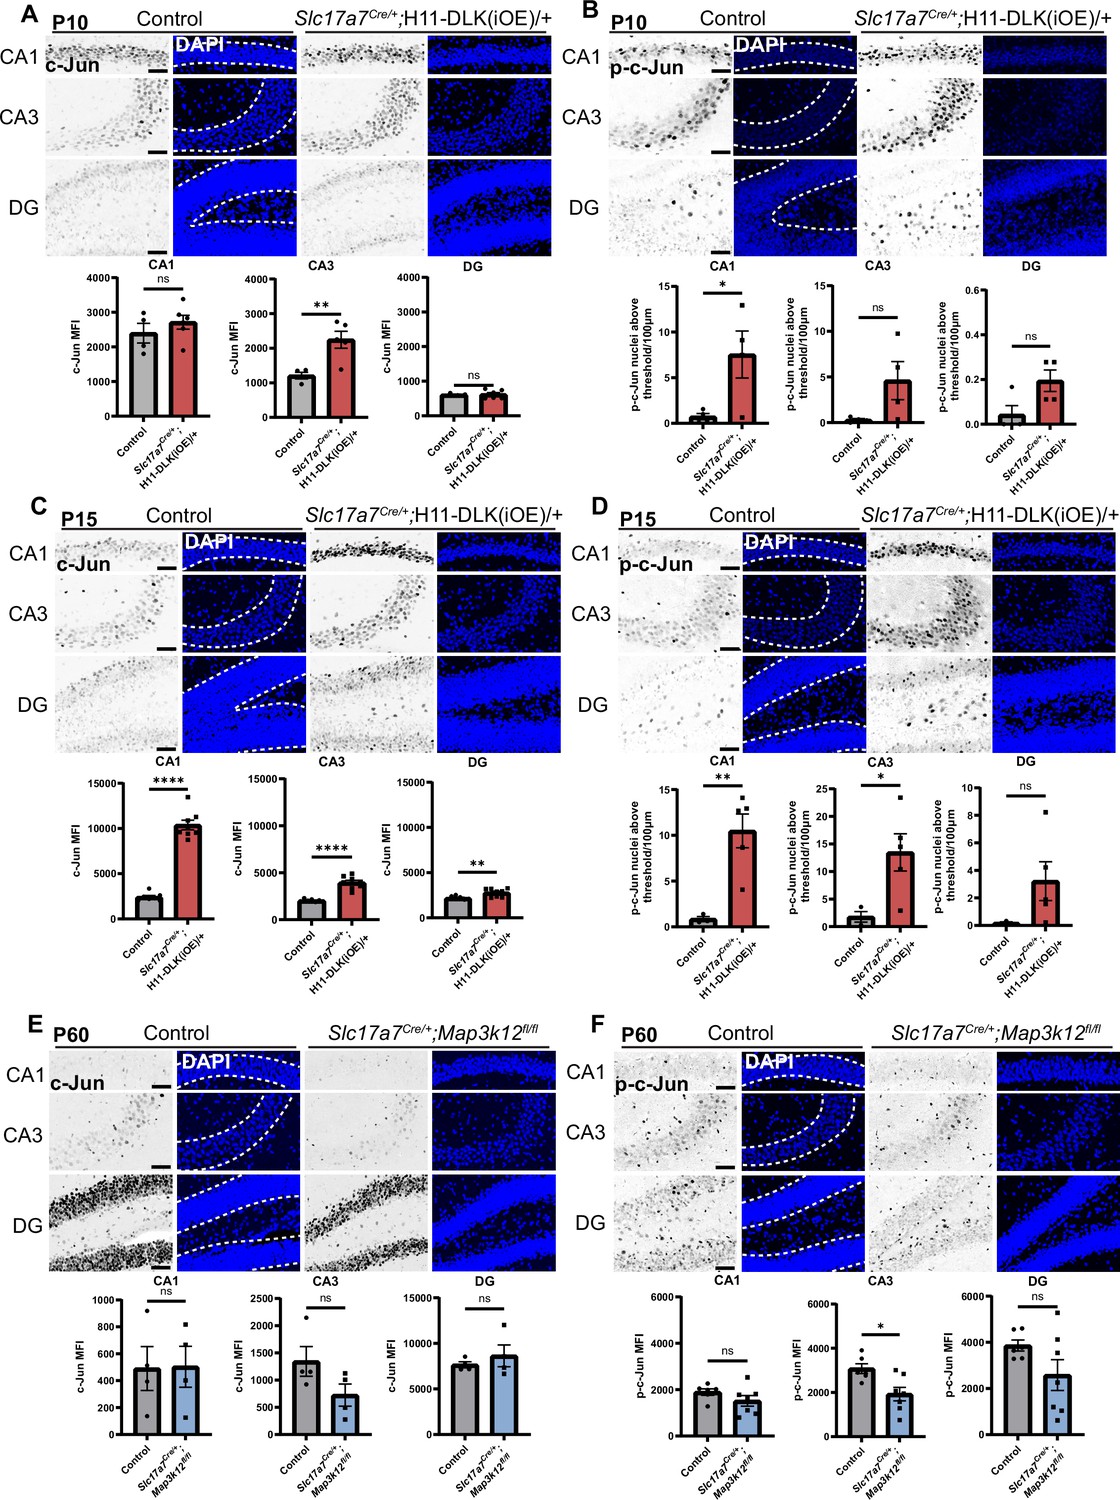
(A,B) Confocal z-stack images of c-Jun (A) and p-c-Jun (B) immunostaining in CA1, CA3, and DG in control and Slc17a7Cre/+;H11-DLK(iOE)/+ mice (P10). Dashed lines in corresponding DAPI staining outline region used for quantification. Scale bar 50 μm. Graphs below image panels show quantification of MFI of c-Jun (A) or p-c-Jun nuclei above intensity threshold per 100 μm of pyramidal or granule cell layer (B). Data points represent individual mice. 3 sections per mouse, N=4,5 mice for (A); N=4,4 mice for (B). Statistics: Unpaired t-test. ns, not significant, * p<0.05, ** p<0.01. (C, D) Confocal z-stack images of c-Jun (C) and p-c-Jun (D) immunostaining in CA1, CA3, and DG in control and Slc17a7Cre/+;H11-DLK(iOE)/+ mice (P15). Dashed lines in corresponding DAPI staining outline region used for quantification. Scale bar 50 μm. Graphs below image panels show quantification of MFI of c-Jun (C) or p-c-Jun nuclei above intensity threshold per 100 μm of pyramidal or granule cell layer (D). Data points represent individual mice. 3 sections per mouse, N=7,8 mice for (C); N=3,5 mice for (D). Statistics: Unpaired t-test. ns, not significant; * p<0.05; ** p<0.01; **** p<0.0001. (E) Confocal z-stack images of c-Jun (E) and p-c-Jun (F) immunostaining in CA1, CA3, and DG in control and Slc17a7Cre/+;Map3k12fl/fl mice (P60). Dashed lines in corresponding DAPI staining outline region used for quantification. Scale bar 50 μm. Graphs below image panels show quantification of mean fluorescence intensity (MFI) of c-Jun and p-c-Jun in pyramidal or granule cell layer of each region. Data points represent MFI of individual mice. 3 sections per mouse, N=4,4 mice for (E); N=6, 7 mice for (F). Statistics: Unpaired t-test. ns, not significant; * p<0.05. All error bars represent SEM.
Figure 4 with 2 supplements
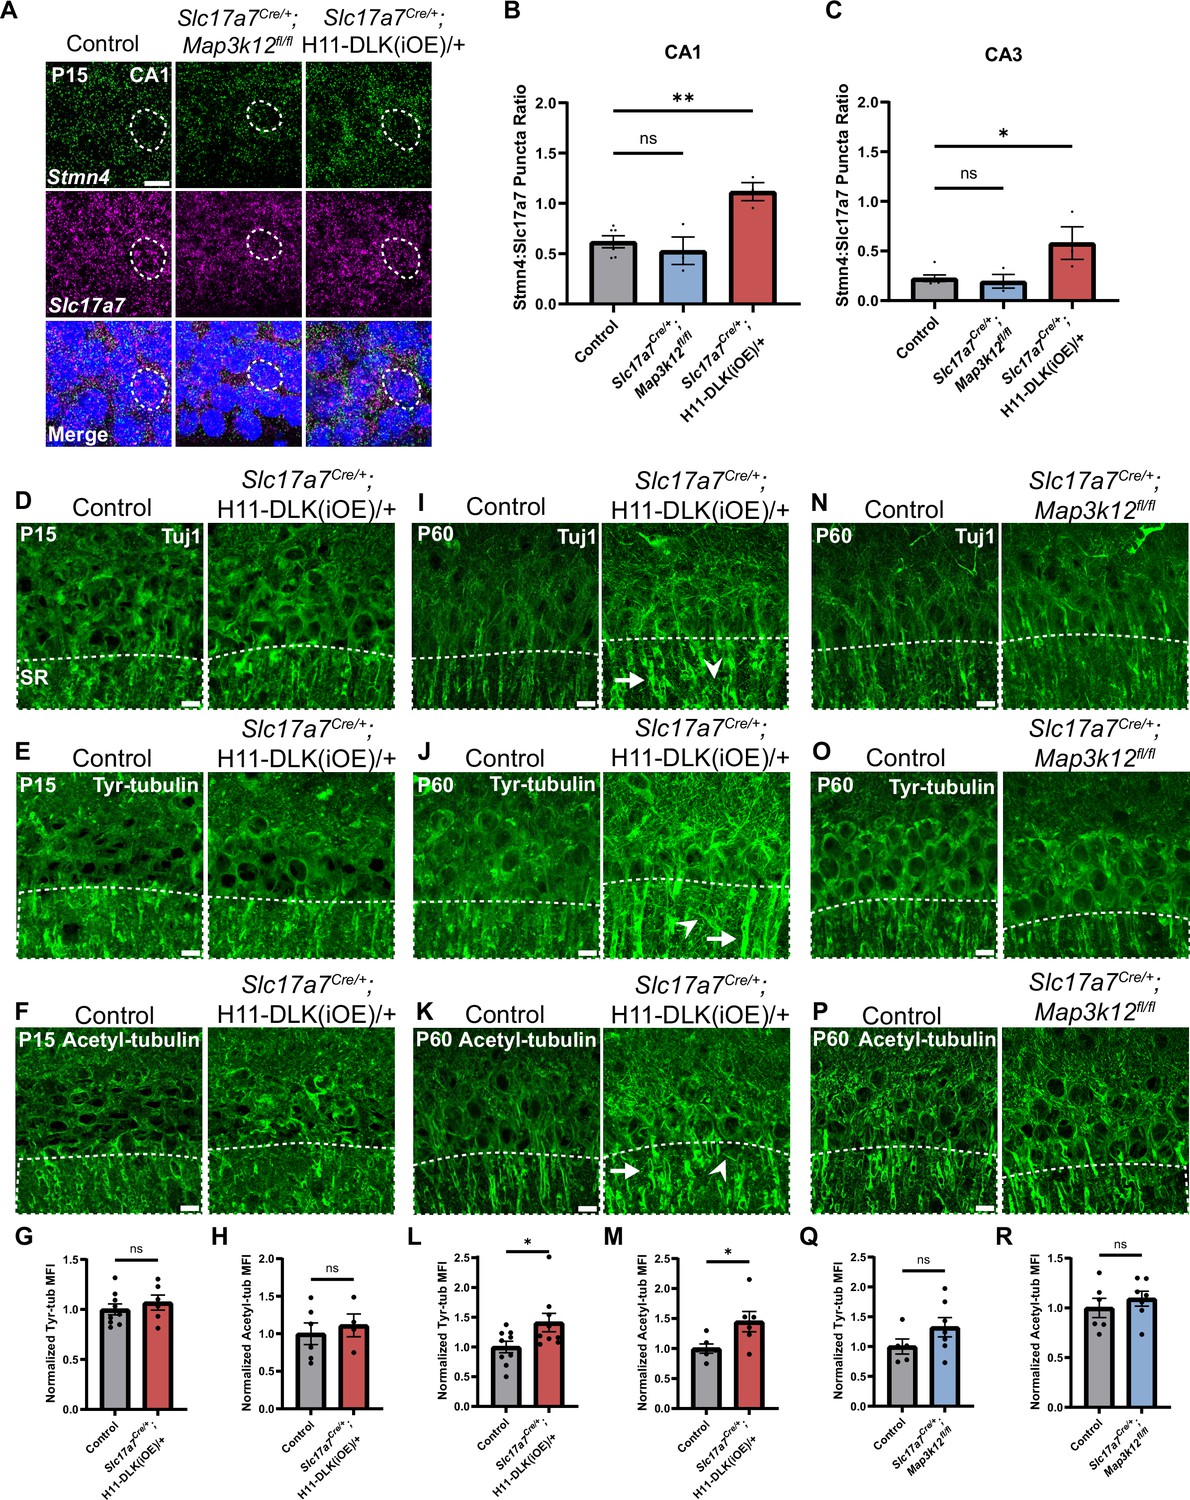
Stmn4 and microtubule homeostasis show dependency on the expression levels of DLK.
(A) Confocal single-slice image of RNAscope analysis of Stmn4 and Slc17a7 mRNAs in hippocampal neurons. Dashed circle outlines single nuclei. Scale bar, 10 μm. (B, C) Quantification of the ratio of Stmn4 to Slc17a7 RNAscope puncta in same nuclei of CA1 and CA3 neurons, respectively. N=6,3,3 mice of respective genotypes, quantified from >50 cells per genotype from 4 sections per mouse. Statistics: One way ANOVA with Dunnett’s multiple comparison test, ns, not significant; * p<0.05; ** p<0.01. (D–F) Confocal z-stack (max projection) images of CA1 immunostained for Tuj1, tyrosinated tubulin, and acetylated tubulin, respectively, in control and Slc17a7Cre/+;H11-DLK(iOE)/+ mice of P15. SR: stratum radiatum. (G, H) Normalized mean fluorescence intensity (MFI) of tyrosinated and acetylated tubulin, respectively, after thresholding signals in SR in CA1 (dashed outlines on images in E-F). N=9, 6 mice, 3 sections averaged per mouse in (G); N=6, 4 mice, 3 sections averaged per mouse in (H). (I–K) Confocal z-stack (max projection) images of immunostained CA1 sections for Tuj1, tyrosinated tubulin, and acetylated tubulin, respectively, in control and Slc17a7Cre/+;H11-DLK(iOE)/+ mice of P60. (L, M) Normalized MFI of tyrosinated and acetylated tubulin, respectively, after thresholding signal in SR in CA1 (dashed outlines on images in J-K). N=9, 9 mice, 3 sections averaged per mouse in L; N=6, 6 mice, 3 sections averaged per mouse in M. (N–P) Confocal z-stack (max projection) images of immunostained CA1 sections for Tuj1, tyrosinated tubulin, and acetylated tubulin, respectively, in control and Slc17a7Cre/+;Map3k12fl/fl mice of P60. (Q, R) Normalized MFI for tyrosinated and acetylated tubulin, respectively, after thresholding signal in SR in CA1 (dashed outlines on images in O-P). N=5, 7 mice, 3 sections averaged per mouse in Q; N=6, 7 mice, 3 sections averaged per mouse in R. All tubulin images shown as maximum projection of z-stack. Scale bar, 10 μm. In I-J, arrows point to apical dendrites with elevated immunostaining signal; arrowheads point to thin neurites with elevated signal. Statistics in (G, H, L, M, Q, R): Unpaired t-test. ns, not significant; * p<0.05. All error bars represent SEM.
Figure 4—figure supplement 1
Stathmin transcript abundance and western blot analysis of DLK, STMN4 in mice aged P10 to 1 yr.
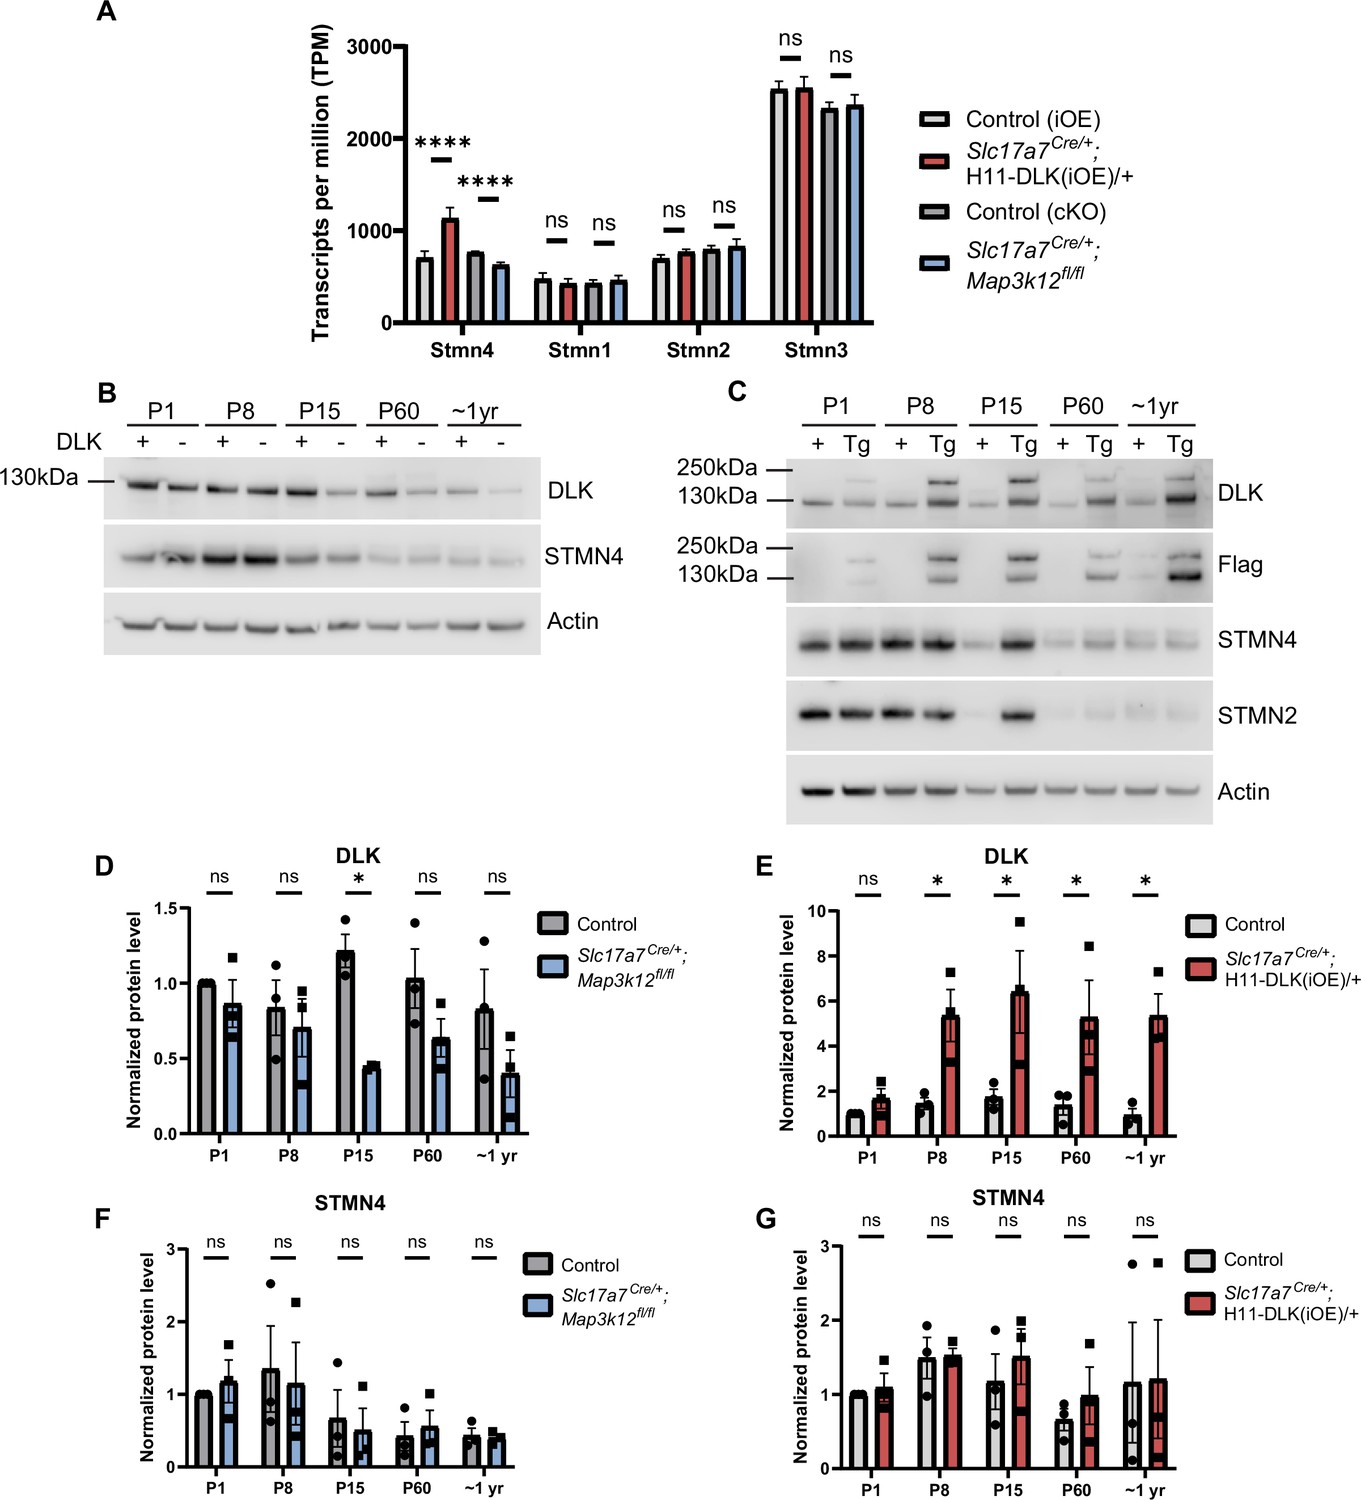
(A) RiboTag analysis of Stathmin family members, shown as transcripts per million (TPM). Differential expression analysis significance shown (padj). ns, not significant; **** p<0.0001. Stmn2 and Stmn4 appear to have comparable reads, however, this includes reads in a retained intron in Stmn2, which increases the reference gene length used for the TPM calculation for Stmn2. The significance of this intron retention may need further study. (B, C) Western blots of protein extracts from hippocampal tissue from P1, P8, P15, P60, and ~1-year-old mice, blotted for DLK, Flag, STMN4, STMN2, and actin in Slc17a7Cre/+;Map3k12fl/fl (B) and Slc17a7Cre/+;H11-DLK(iOE)/+ (C), respectively. Larger molecular weight band of DLK in Slc17a7Cre/+;H11-DLK(iOE)/+ would match the predicted molecular weight of DLK-T2A-tdTomato if T2A-peptide induced ‘self-cleavage’ due to ribosomal skipping is ineffective (Figure 1—figure supplement 1D). (D, E) Relative DLK protein level normalized to actin and P1 control. N=3 mice/genotype. (F, G) Relative STMN4 protein level normalized to actin and P1 control. N=3 mice/genotype. Statistics: Two-way ANOVA with Sidak multiple comparisons test. ns, not significant; * p<0.05. All error bars represent SEM.
-
Figure 4—figure supplement 1—source data 1
Original western blots for images shown in Figure 4—figure supplement 1B and C.
- https://cdn.elifesciences.org/articles/101173/elife-101173-fig4-figsupp1-data1-v1.zip
-
Figure 4—figure supplement 1—source data 2
PDF showing original western blots for images shown in Figure 4—figure supplement 1B and C, along with relevant bands and genotypes.
Pg.1 Original membranes corresponding to Panel B. Molecular weights shown using PageRuler Plus Prestained Protein Ladder. Each lane represents a separate mouse. Lanes 1,3,5,7,9 show control samples, lanes 2,4,6,8,10 show DLK(cKO) at P1, P8, P15, P60, and 1 year timepoints. Dotted lines indicate locations where membrane was cut and labeled with separate antibodies. Pg.2 Original membranes corresponding to Panel C. Molecular weights shown using Precision Plus Protein Dual Color Ladder. Each lane represents a separate mouse. Lanes 1,3,5,7,9 show control samples, lanes 2,4,6,8,10 show DLK(iOE) at P1, P8, P15, P60, and ~1 year timepoints. Dotted lines indicate locations where membrane was cut and labeled with separate antibodies. Samples were split, with half of each prepped sample loaded onto two membranes (membrane 1&2). Smaller molecular weight band matches expected size of DLK protein (and flag tagged DLK). Larger molecular weight band of DLK in Vglut1Cre/+;H11-DLKiOE/+ would match the predicted molecular weight of DLK-T2A-tdTomato if T2A-peptide induced ‘self- cleavage’ due to ribosomal skipping is ineffective. Pg.3 Original membranes corresponding to Panel C. Molecular weights shown using Precision Plus Protein Dual Color Ladder. Each lane represents a separate mouse. Lanes 1,3,5,7,9 show control samples, lanes 2,4,6,8,10 show DLK(iOE) at P1, P8, P15, P60, and ~1 year timepoints.
- https://cdn.elifesciences.org/articles/101173/elife-101173-fig4-figsupp1-data2-v1.zip
Figure 4—figure supplement 2
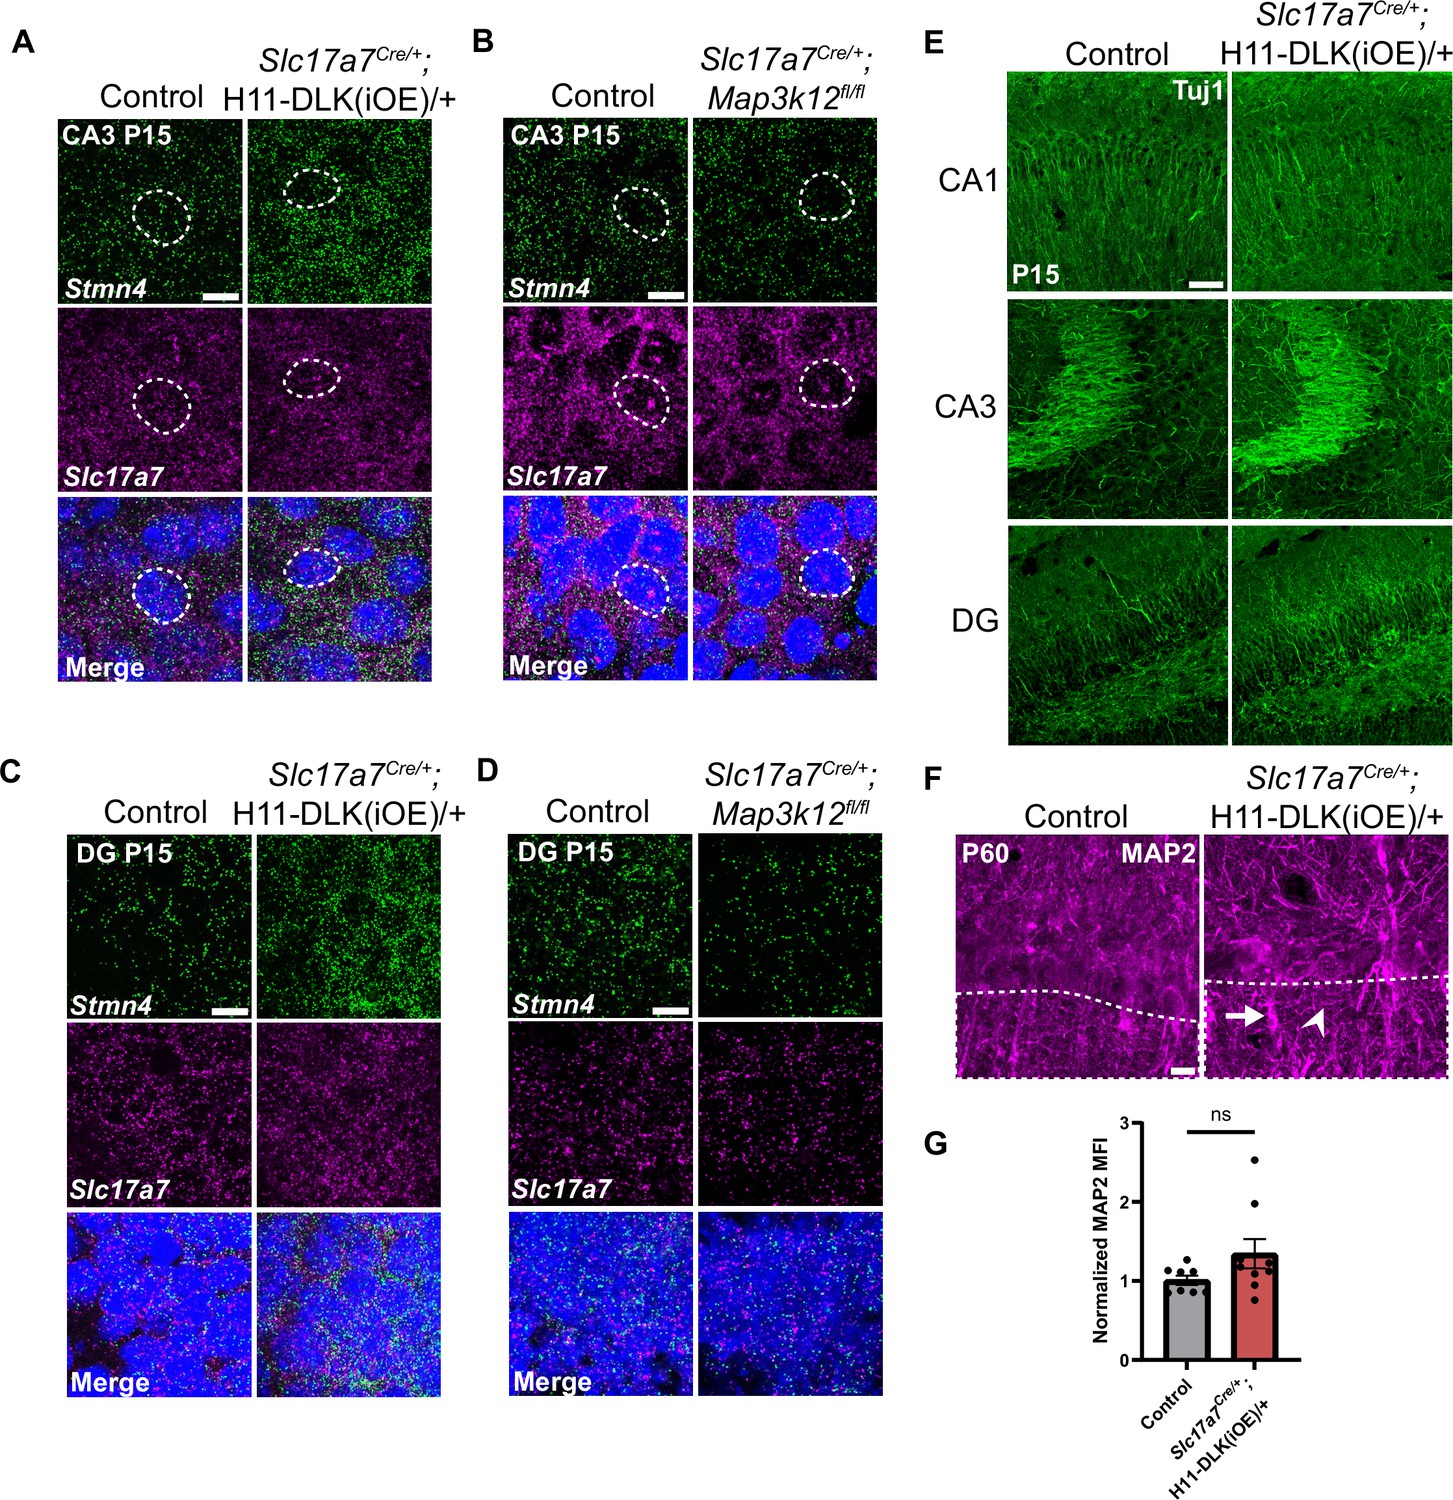
Additional evidence for Stmn4 and microtubule expression in DLK(cKO) and DLK(iOE) in hippocampus.
(A–D) Confocal single-slice images of Stmn4 and Slc17a7 RNAscope stained sections from (A, B) CA3 and (C, D) DG in DLK(iOE) (A, C) and DLK(cKO) (B, D) mice at P15. Scale bar 10 μm. (E) Confocal z-stack images of Tuj1 immunostaining in CA1, CA3, and DG of mice genotype indicated at P15. Scale bar 50 μm. (F) Confocal z-stack images of MAP2 immunostaining of CA1 pyramidal layer from control and Slc17a7Cre/+;H11-DLK(iOE)/+ mice at P60. Arrows point to apical dendrites with elevated signal. Arrowheads point to thin neurites with elevated signal. Scale bar 10 μm. (G) Normalized MAP2 MFI after thresholding signal in SR (dashed outlines on images in F). N=9, 9 mice, 3 sections averaged per mouse. Statistics: Unpaired t-test. ns, not significant. Error bars represent SEM.
Figure 5 with 3 supplements
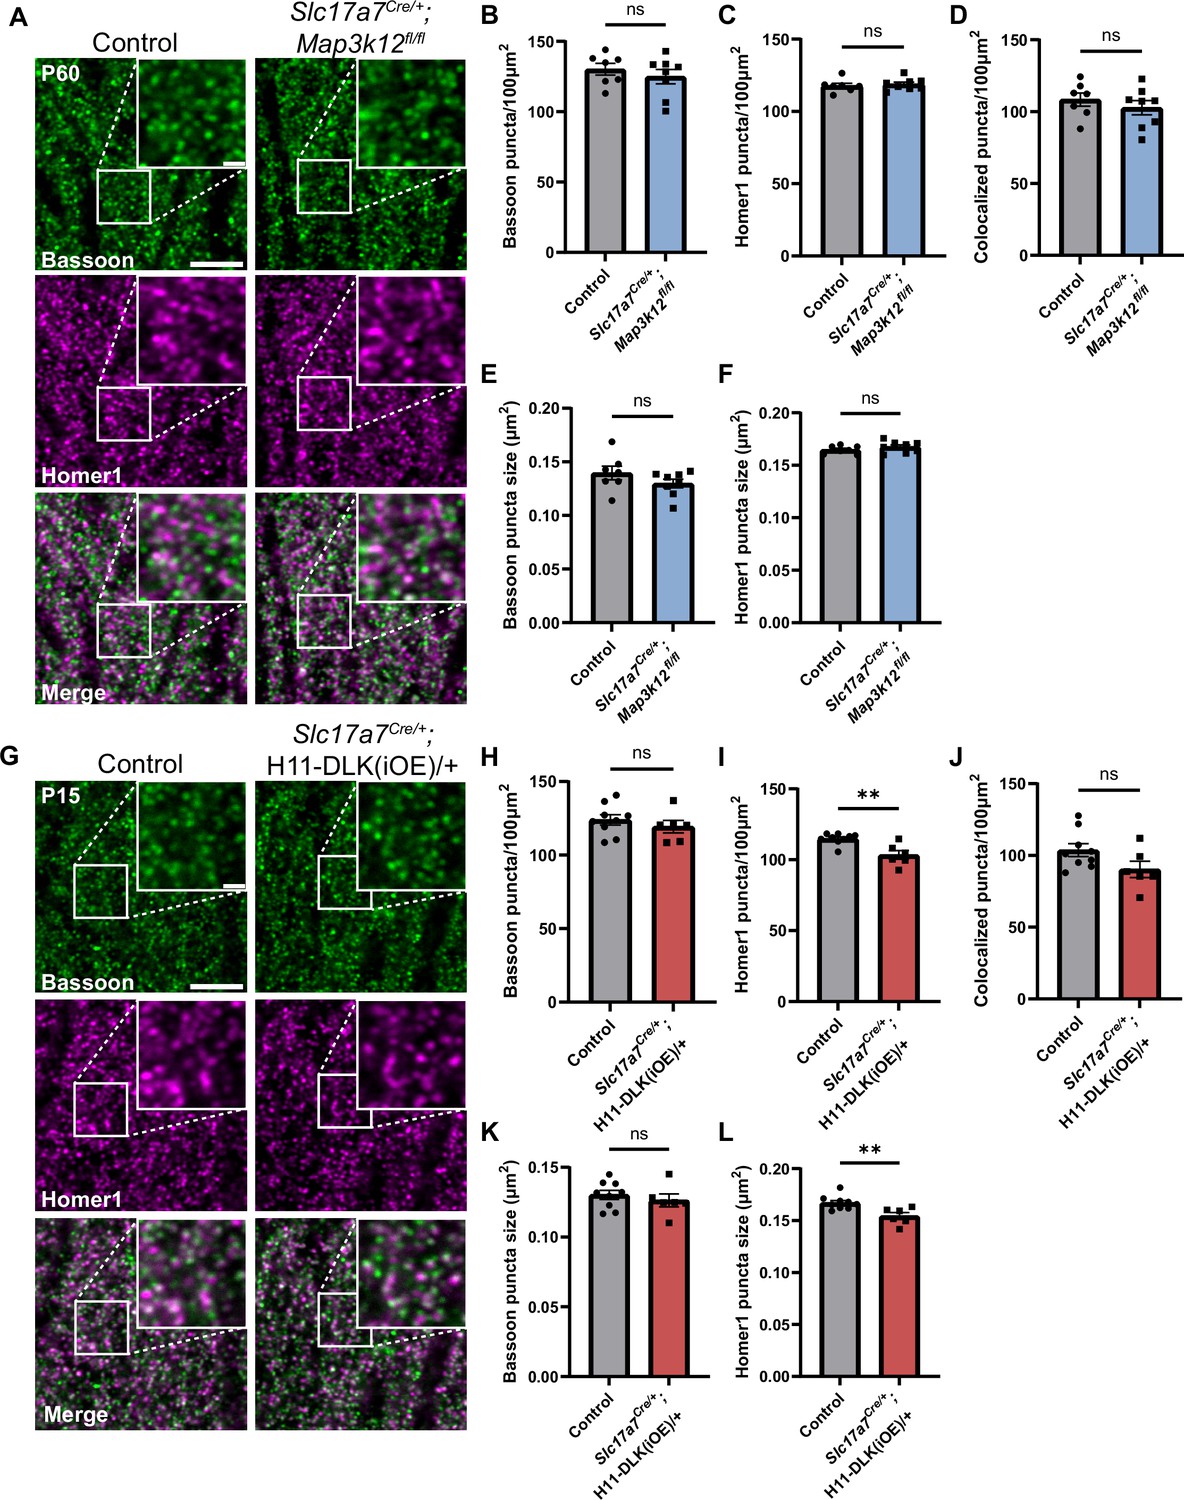
Hippocampal dorsal CA1 glutamatergic neurons show altered synapses following increased DLK expression.
(A) Confocal single-slice images of Bassoon and Homer1 immunostaining in CA1 stratum radiatum (SR) of control and Slc17a7Cre/+;Map3k12fl/fl mice of P60. (B, C) Quantification of Bassoon and Homer1 puncta density, respectively. (D) Quantification of co-localization of Bassoon and Homer1. (E, F) Quantification of Bassoon and Homer1 puncta size. Data points represent average values per mouse from 3 sections. N=7 control, and 8 Slc17a7Cre/+;Map3k12fl/fl mice. Statistics: unpaired t-test or Mann-Whitney U test if not passing normality. ns, not significant. (G) Confocal single-slice images of Bassoon and Homer1 immunostaining in CA1 SR of control and Slc17a7Cre/+;H11-DLK(iOE)/+ mice of P15. (H–I) Quantification of Bassoon and Homer1 puncta density, respectively. (J) Quantification of co-localization of Bassoon and Homer1. (K, L) Quantification of Bassoon and Homer1 puncta size. Data points represent average values per mouse from 3 sections, N=9 control, and 6 Slc17a7Cre/+;H11-DLK(iOE)/+ mice. Statistics: unpaired t-test or Mann-Whitney U test if not passing normality. ns, not significant; ** p<0.01. Scale bars, 5 μm in panel images, and 1 μm in enlarged images. All error bars represent SEM.
Figure 5—figure supplement 1
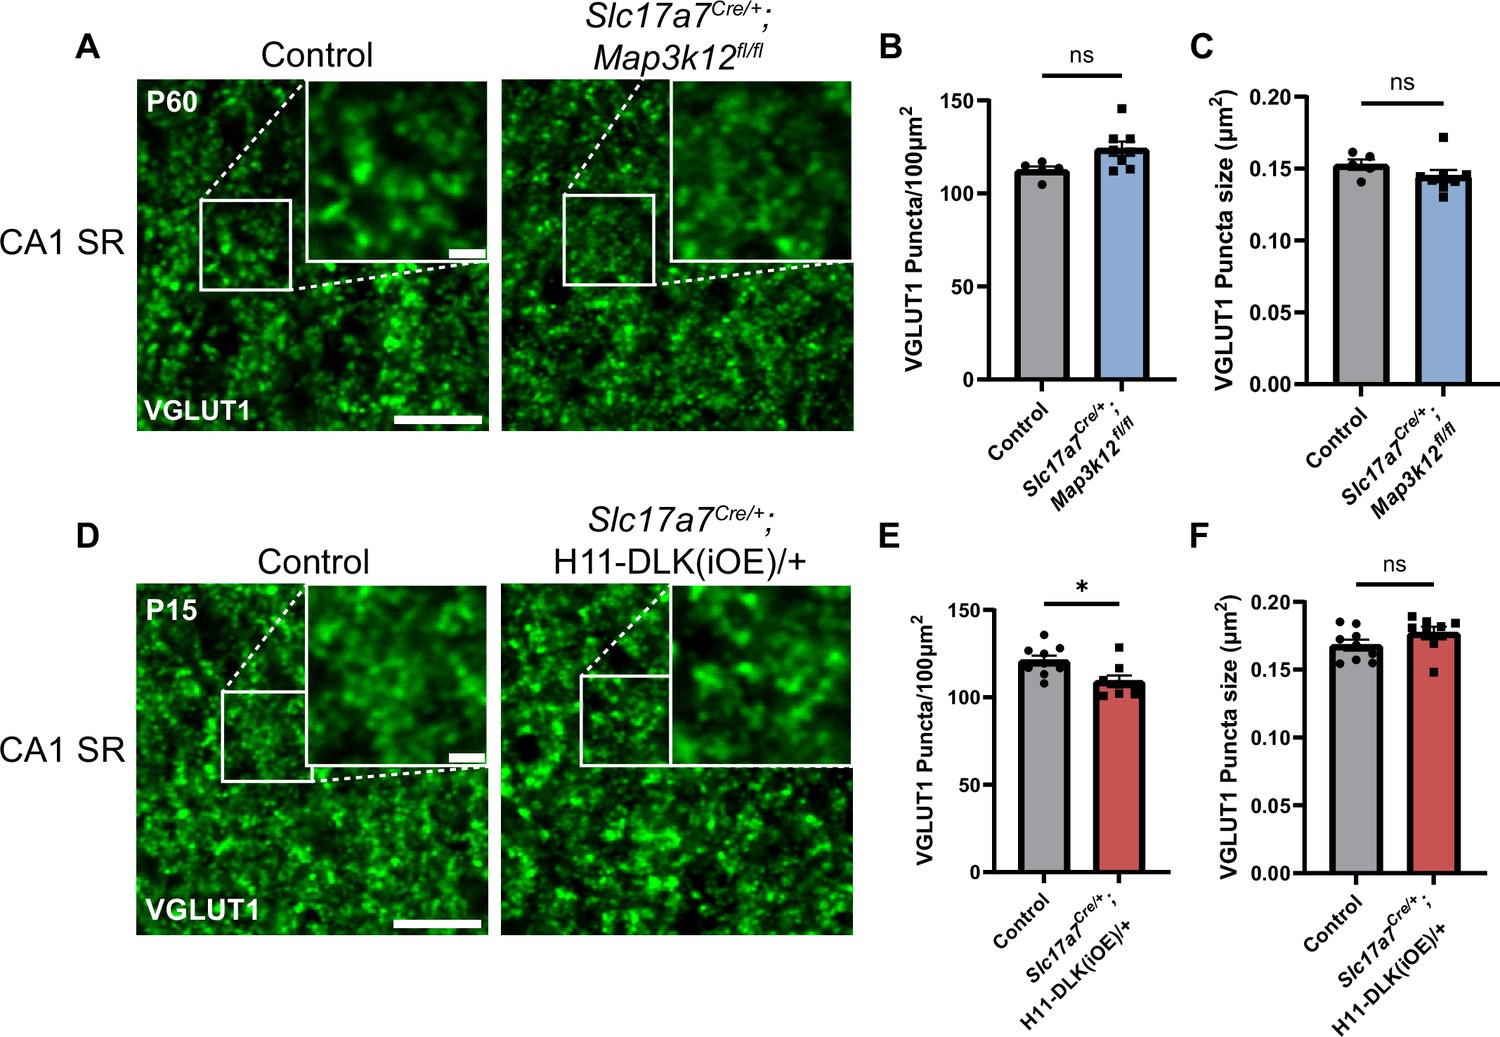
VGLUT1 pattern in dorsal CA1 in DLK(cKO) and DLK(iOE).
(A) Confocal single-slice image of VGLUT1 immunostaining of CA1 SR in control and Slc17a7Cre/+;Map3k12fl/fl mice at P60. Scale bar 5 μm, inset scale bar 1 μm. (B, C) Quantification of VGLUT1 puncta density and size. Data points represent averages from individual mice across 3 sections per mouse. N=5 control, and 8 Slc17a7Cre/+;Map3k12fl/fl mice. (D) Confocal single-slice image of VGLUT1 immunostaining of CA1 SR in control and Slc17a7Cre/+;H11-DLK(iOE)/+ mice at P15. Scale bar 5 μm, inset scale bar 1 μm. (E, F) Quantification of VGLUT1 puncta density (E) and size (F). Data points represent averages from individual mice across 3 sections per mouse, N=9 control, and 8 Slc17a7Cre/+;H11-DLK(iOE)/+ mice. Statistics: unpaired t-test. ns, not significant; * p<0.05. All error bars represent SEM.
Figure 5—figure supplement 2
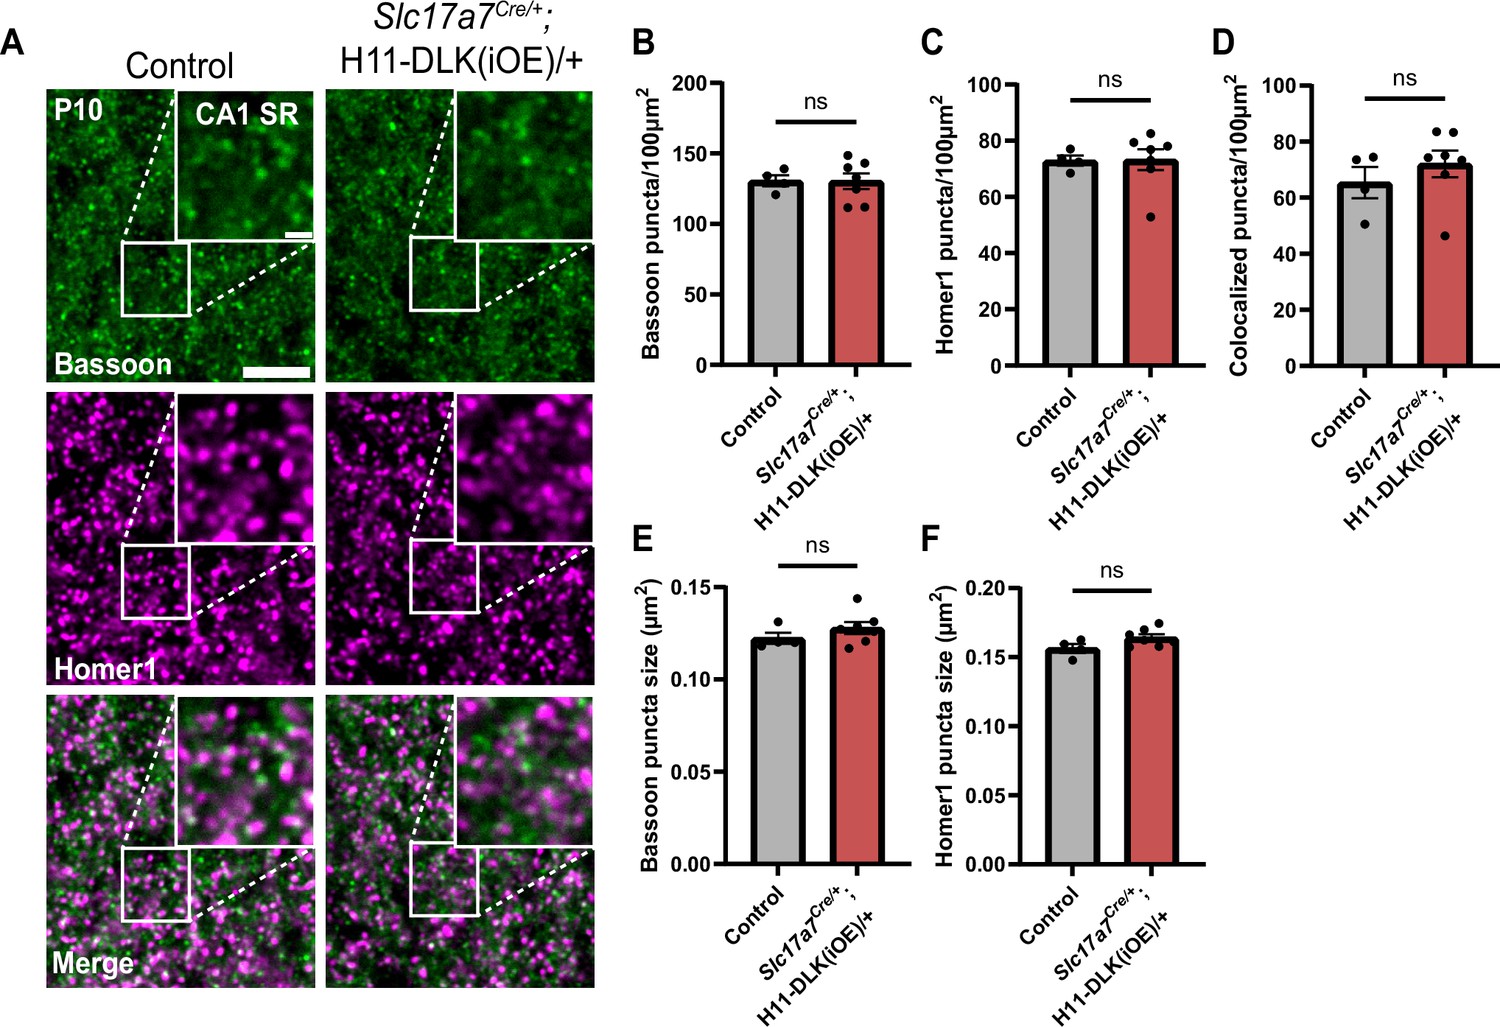
Analysis of Bassoon and Homer1 immunostaining in dorsal CA1 in P10 of DLK(iOE).
(A) Confocal single-slice images of Bassoon and Homer1 immunostaining in CA1 SR of control and Slc17a7Cre/+;H11-DLK(iOE)/+ mice at P10. Scale bars, 5 μm in panel images, and 1 μm in enlarged images. (B, C) Quantification of Bassoon and Homer1 puncta density, respectively. (D) Quantification of synapses displaying co-localization of Bassoon and Homer1. (E, F) Quantification from control and Slc17a7Cre/+;H11-DLK(iOE)/+ mice for (E) Bassoon puncta size, (F) Homer1 puncta size. Data points represent average values per mouse from 3 sections. N=4 control, and 7 Slc17a7Cre/+;H11-DLK(iOE)/+ mice. Statistics: unpaired t-test. ns, not significant. All error bars represent SEM.
Figure 5—figure supplement 3
Analysis of Bassoon and Homer1 immunostaining in CA3 synapses of DLK(iOE) at P10 and P15.
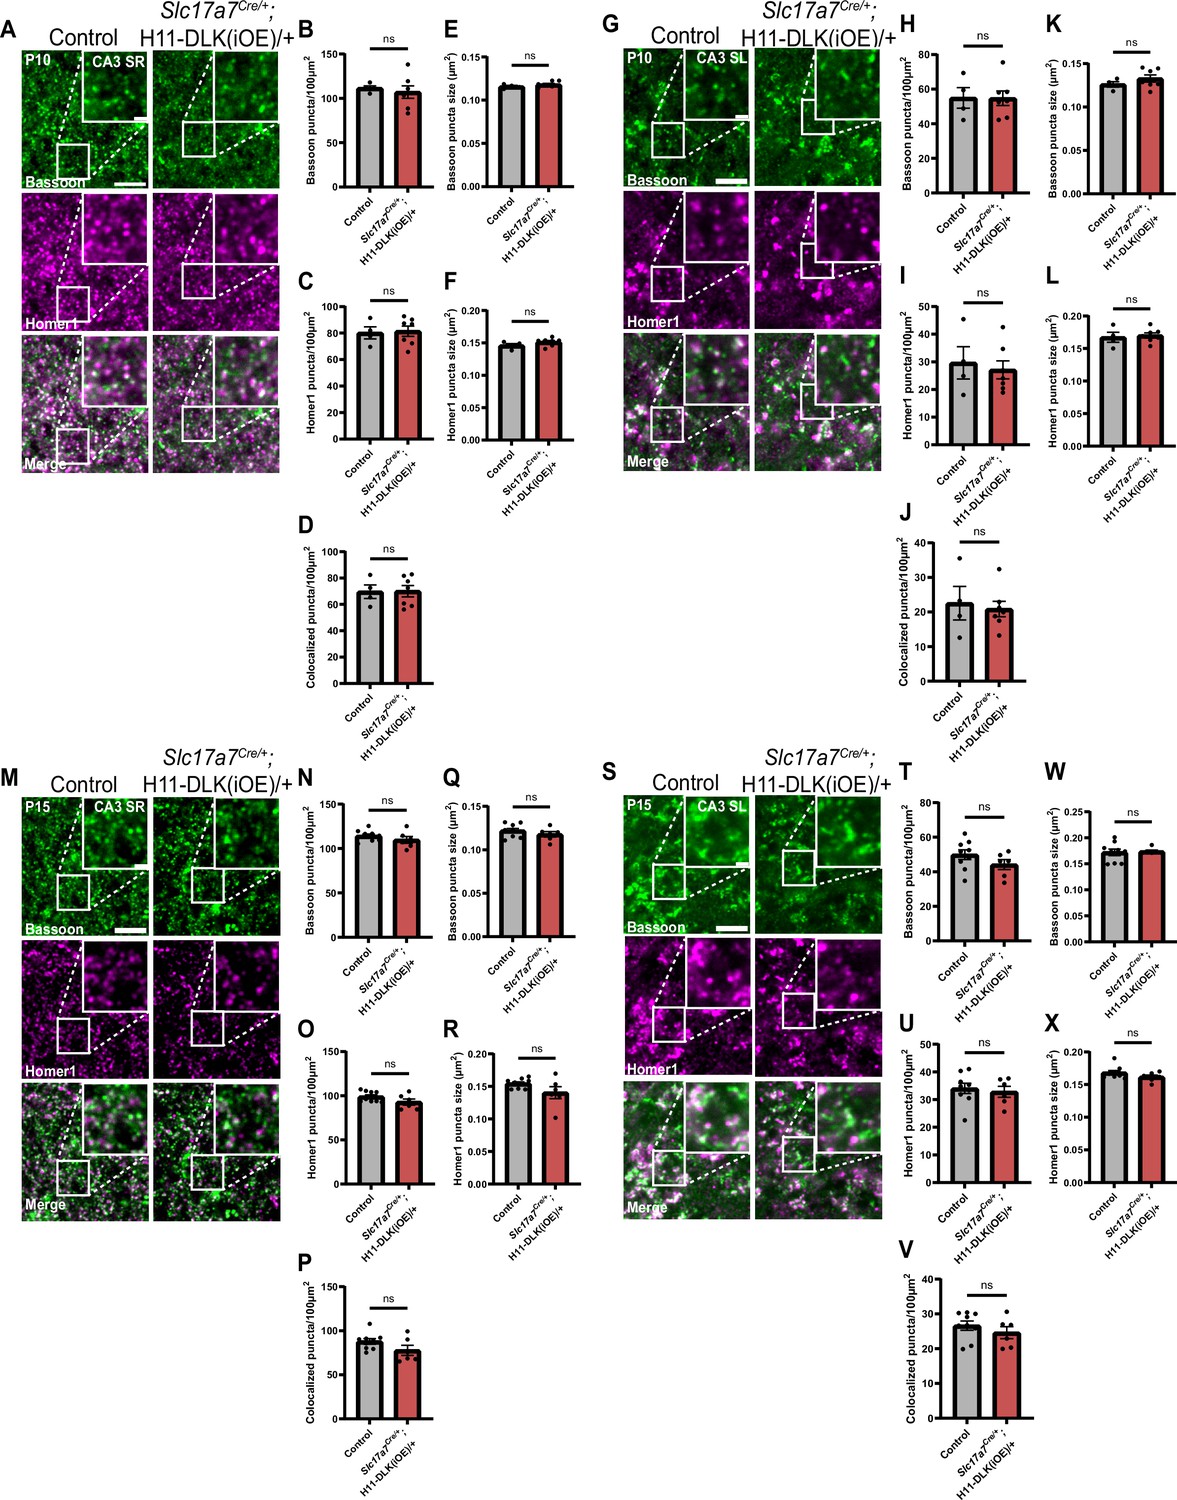
(A) Confocal single-slice images of Bassoon and Homer1 immunostaining in CA3 SR of control and Slc17a7Cre/+;H11-DLK(iOE)/+ mice at P10. Scale bars, 5 μm in panel images, and 1 μm in enlarged images. (B, C) Quantification of Bassoon and Homer1 puncta density, respectively. (D) Quantification of synapses displaying co-localization of Bassoon and Homer1. (E, F) Quantification from control and Slc17a7Cre/+;H11-DLK(iOE)/+ mice for (E) Bassoon puncta size, (F) Homer1 puncta size. Data points represent average values per mouse from 3 sections. N=4 control, and 7 Slc17a7Cre/+;H11-DLK(iOE)/+ mice. Statistics: unpaired t-test. ns, not significant. (G) Confocal single-slice images of Bassoon and Homer1 immunostaining in CA3 SL of control and Slc17a7Cre/+;H11-DLK(iOE)/+ mice at P10. Scale bars, 5 μm in panel images, and 1 μm in enlarged images. (H, I) Quantification of Bassoon and Homer1 puncta density, respectively. (J) Quantification of synapses displaying co-localization of Bassoon and Homer1. (K, L) Quantification from control and Slc17a7Cre/+;H11-DLK(iOE)/+ mice for (K) Bassoon puncta size, (L) Homer1 puncta size. Data points represent average values per mouse from 3 sections. N=4 control, and 7 Slc17a7Cre/+;H11-DLK(iOE)/+ mice. Statistics: unpaired t-test. ns, not significant. (M) Confocal single-slice images of Bassoon and Homer1 immunostaining in CA3 SR of control and Slc17a7Cre/+;H11-DLK(iOE)/+ mice at P15. Scale bars, 5 μm in panel images, and 1 μm in enlarged images. (N, O) Quantification of Bassoon and Homer1 puncta density, respectively. (P) Quantification of synapses displaying co-localization of Bassoon and Homer1. (Q, R) Quantification from control and Slc17a7Cre/+;H11-DLK(iOE)/+ mice for (Q) Bassoon puncta size, (R) Homer1 puncta size. Data points represent average values per mouse from 3 sections. N=9 control, and 6 Slc17a7Cre/+;H11-DLK(iOE)/+ mice. Statistics: unpaired t-test. ns, not significant. (S) Confocal single-slice images of Bassoon and Homer1 immunostaining in CA3 SL of control and Slc17a7Cre/+;H11-DLK(iOE)/+ mice at P15. Scale bars, 5 μm in panel images, and 1 μm in enlarged images. (T, U) Quantification of Bassoon and Homer1 puncta density, respectively. (V) Quantification of synapses displaying co-localization of Bassoon and Homer1. (W, X) Quantification from control and Slc17a7Cre/+;H11-DLK(iOE)/+ mice for (W) Bassoon puncta size, (X) Homer1 puncta size. Data points represent average values per mouse from 3 sections. N=9 control, and 6 Slc17a7Cre/+;H11-DLK(iOE)/+ mice. Statistics: unpaired t-test. ns, not significant. All error bars represent SEM.
Figure 6 with 2 supplements
DLK promotes short neurite formation in primary cultured hippocampal neurons.
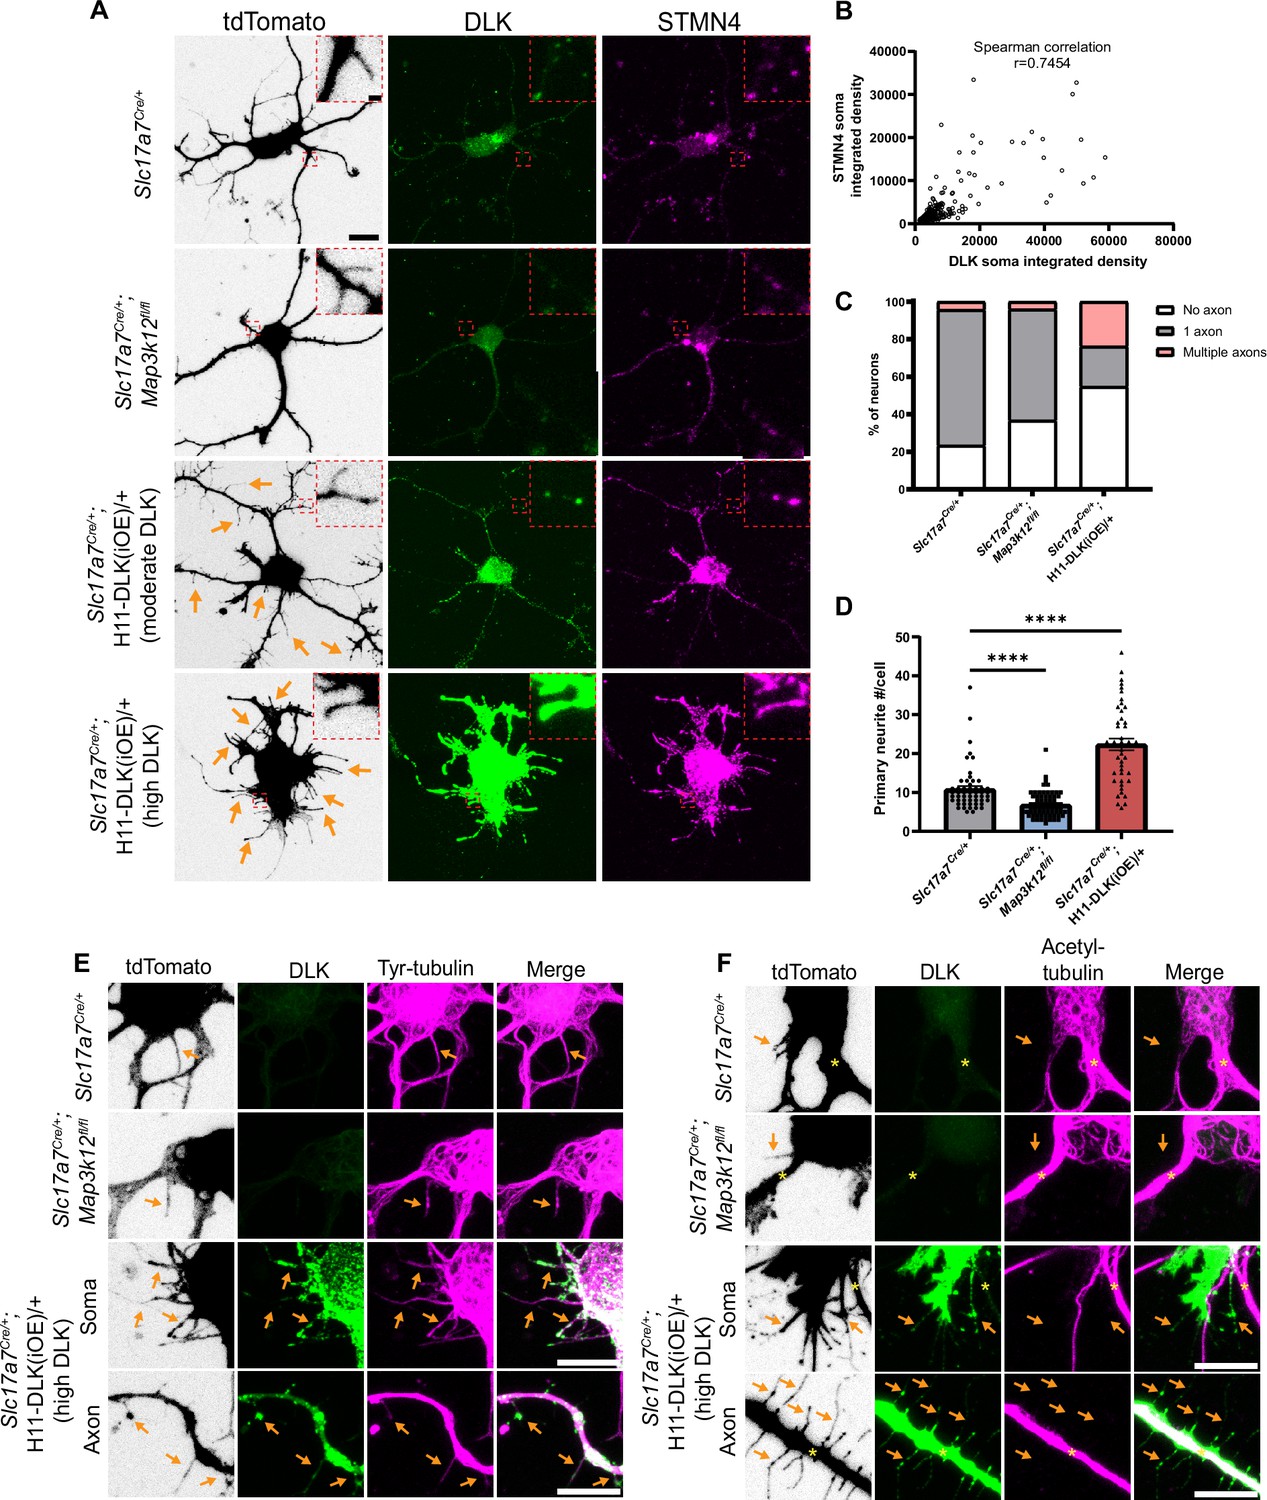
(A) Confocal images of DIV2 primary hippocampal glutamatergic neurons immunostained with DLK and STMN4. Neurons with indicated genotypes are labeled by tdTomato from Cre-dependent Rosa26-tdTomato, generated from hippocampi in P1 pups from the following crosses: for control: Slc17a7Cre/+ X Rosa26tdT/+; for DLK(cKO): Slc17a7Cre/+;Map3k12fl/fl X Map3k12fl/fl;Rosa26tdT/+; for DLK(iOE): H11-DLK(iOE)/H11-DLK(iOE) X Slc17a7 Cre/+;Rosa26tdT/+. Orange arrows point to some of the thin neurites from neurons overexpressing DLK. Red dashes outline enlarged view of neurites. Scale bar, 10 μm neuron, 1 μm enlarged view. (B) Graph shows positive correlation between STMN4 immunostaining, measured as integrated density (Area X MFI) in neuronal soma, to integrated density of DLK immunostaining. N≥3 cultures/genotype,≥60 cells/genotype. Spearman correlation r=0.7454. (C) Quantification of percentage of neurons with no, one, or more than one axon (defined by neurites longer than 90 μm) in each genotype. Number of neurons: 47 from 3 Slc17a7Cre (control) cultures, 49 from 3 DLK(cKO) cultures, 42 from 4 DLK(iOE) cultures. Statistics: Fisher’s exact test shows significance (p<0.0001) between genotype and number of axons. Pairwise comparisons with Fisher’s exact test: Axon formation in control vs DLK(cKO): p=0.1857. Formation of multiple axons in control vs DLK(cKO): p>0.9999. Axon formation in control vs DLK(iOE): p=0.0042. Formation of multiple axons in control vs DLK(iOE): p=0.0001. (D) Quantification of number of primary neurites, which include both branches and filopodia, per neuron. Number of neurons: 55 from 4 Slc17a7Cre (control) cultures, 70 from 4 DLK(cKO) cultures, 45 from 5 DLK(iOE) cultures. Statistics, Kruskal-Wallis test with Dunn’s multiple comparison test. **** p<0.0001. Error bars represent SEM. (E) Confocal z-stack images of tyrosinated tubulin immunostaining from DIV2 cultures of genotypes indicated, showing that filopodia structures (arrows) around the soma and axons of neurons with high expression of DLK have tyrosinated tubulin. (F) Confocal z-stack images of acetylated tubulin immunostaining from DIV2 cultures of genotypes indicated, showing that filopodia structures (arrows) around the soma and axons of neurons with high expression of DLK do not have acetylated tubulin. Asterisks indicate stable branches containing acetylated tubulin. Scale bar in E, F, 10 μm. Tyrosinated tubulin and acetylated tubulin staining shows saturated appearance to visualize staining in thin neurites.
Figure 6—figure supplement 1
Analysis of Stathmins in primary cultured hippocampal neurons from DLK(cKO) and DLK(iOE).
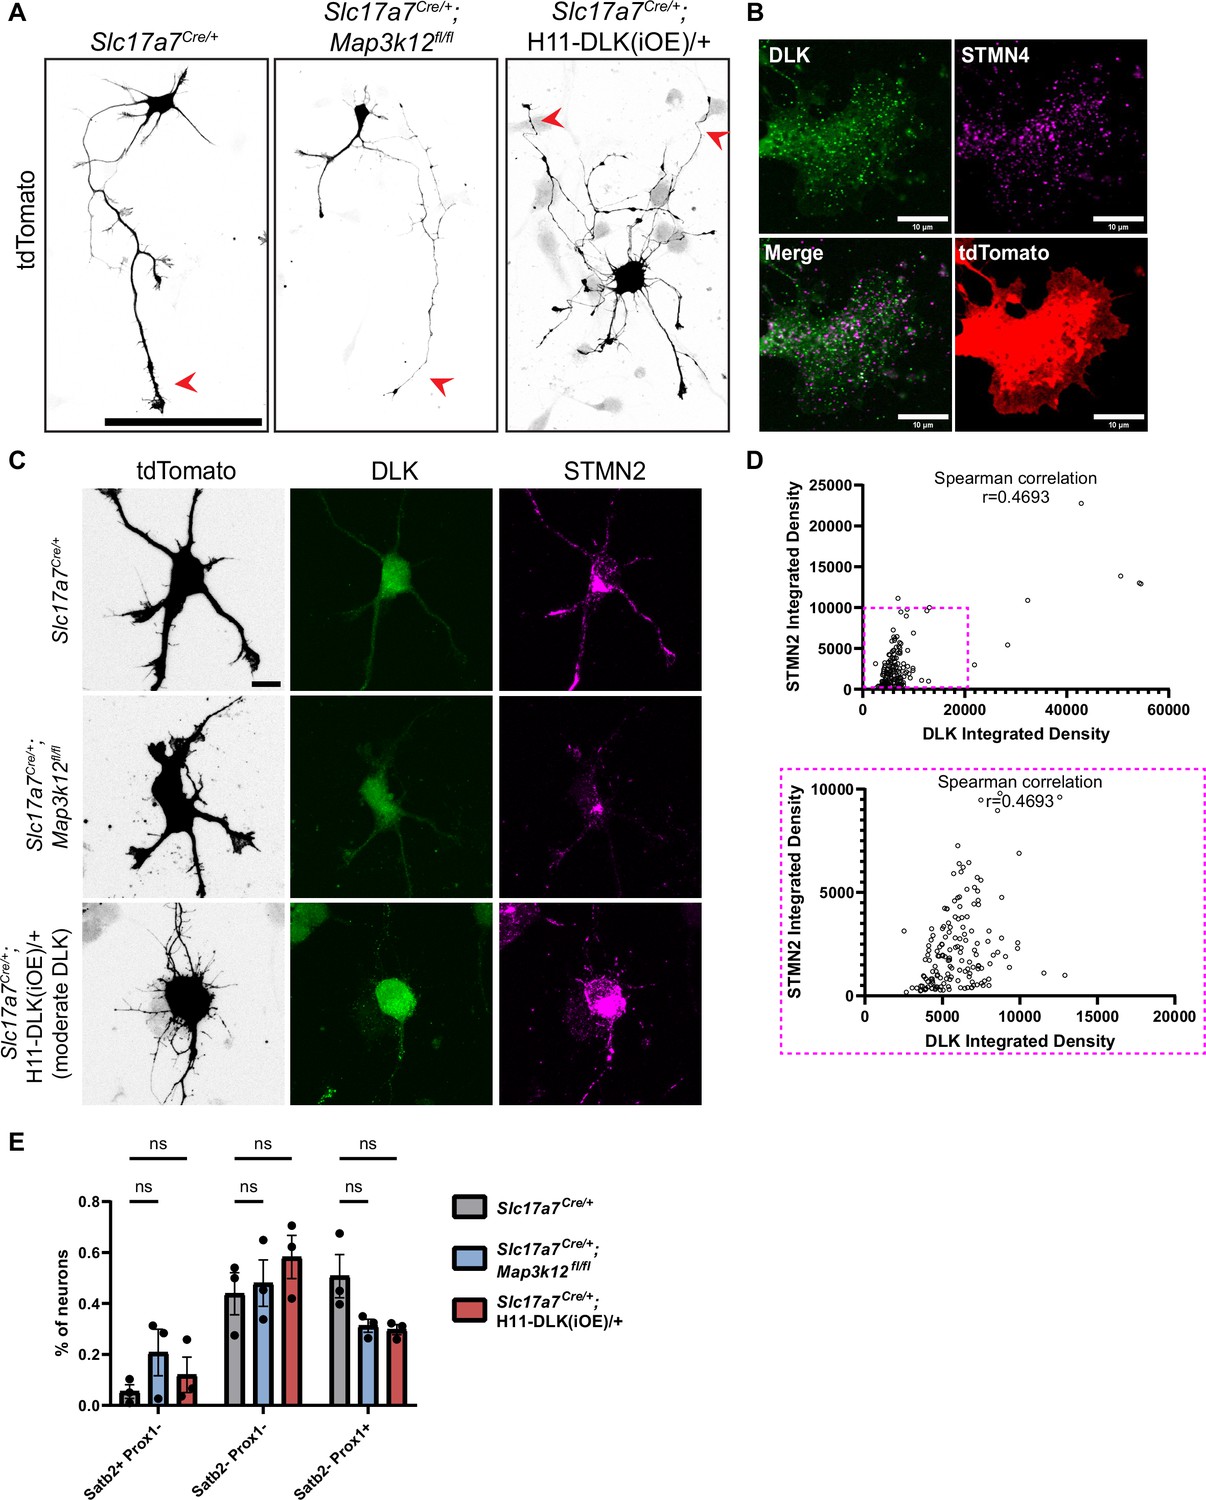
(A) Confocal z-stack images of neuron morphology at DIV2 from mice of genotype indicated, visualized by tdTomato from Rosa26-tdTomato. Neurons with indicated genotypes are labeled by tdTomato from Cre-dependent Rosa26-tdTomato generated from the following crosses: for control: Slc17a7Cre/+ X Rosa26tdT/+; for DLK(cKO): Slc17a7Cre/+;Map3k12fl/fl X Map3k12fl/fl;Rosa26tdT/+; for DLK(iOE): H11-DLK(iOE)/H11-DLK(iOE) X Slc17a7 Cre/+;Rosa26tdT/+. Red arrowheads point to long processes considered as axons. Scale bar 100 μm. (B) Co-immunostaining of DLK and STMN4 in DIV2 control cultured neuron growth cone shows non-overlapping puncta. (C) Confocal z-stack images of DLK and STMN2 co-immunostaining of DIV2 primary hippocampal neurons from genotypes indicated; neurons are labeled with tdTomato from Rosa26-tdTomato. Scale bar 10 μm. (D) Quantification of association between DLK level and STMN2 in cell soma. N=3 cultures/genotype, ≥45 cells/genotype. Spearman correlation r=0.4693. (E) Analysis of cell types in culture at DIV14 using Prox1 and Satb2 markers. Quantification from N=3 cultures/genotype, ≥200 cells/genotype. Statistics: Two-way ANOVA with Dunnett’s multiple comparison test. ns, not significant. Error bars represent SEM.
Figure 6—figure supplement 2
Comparison of STMN2 and STMN4 antibodies.
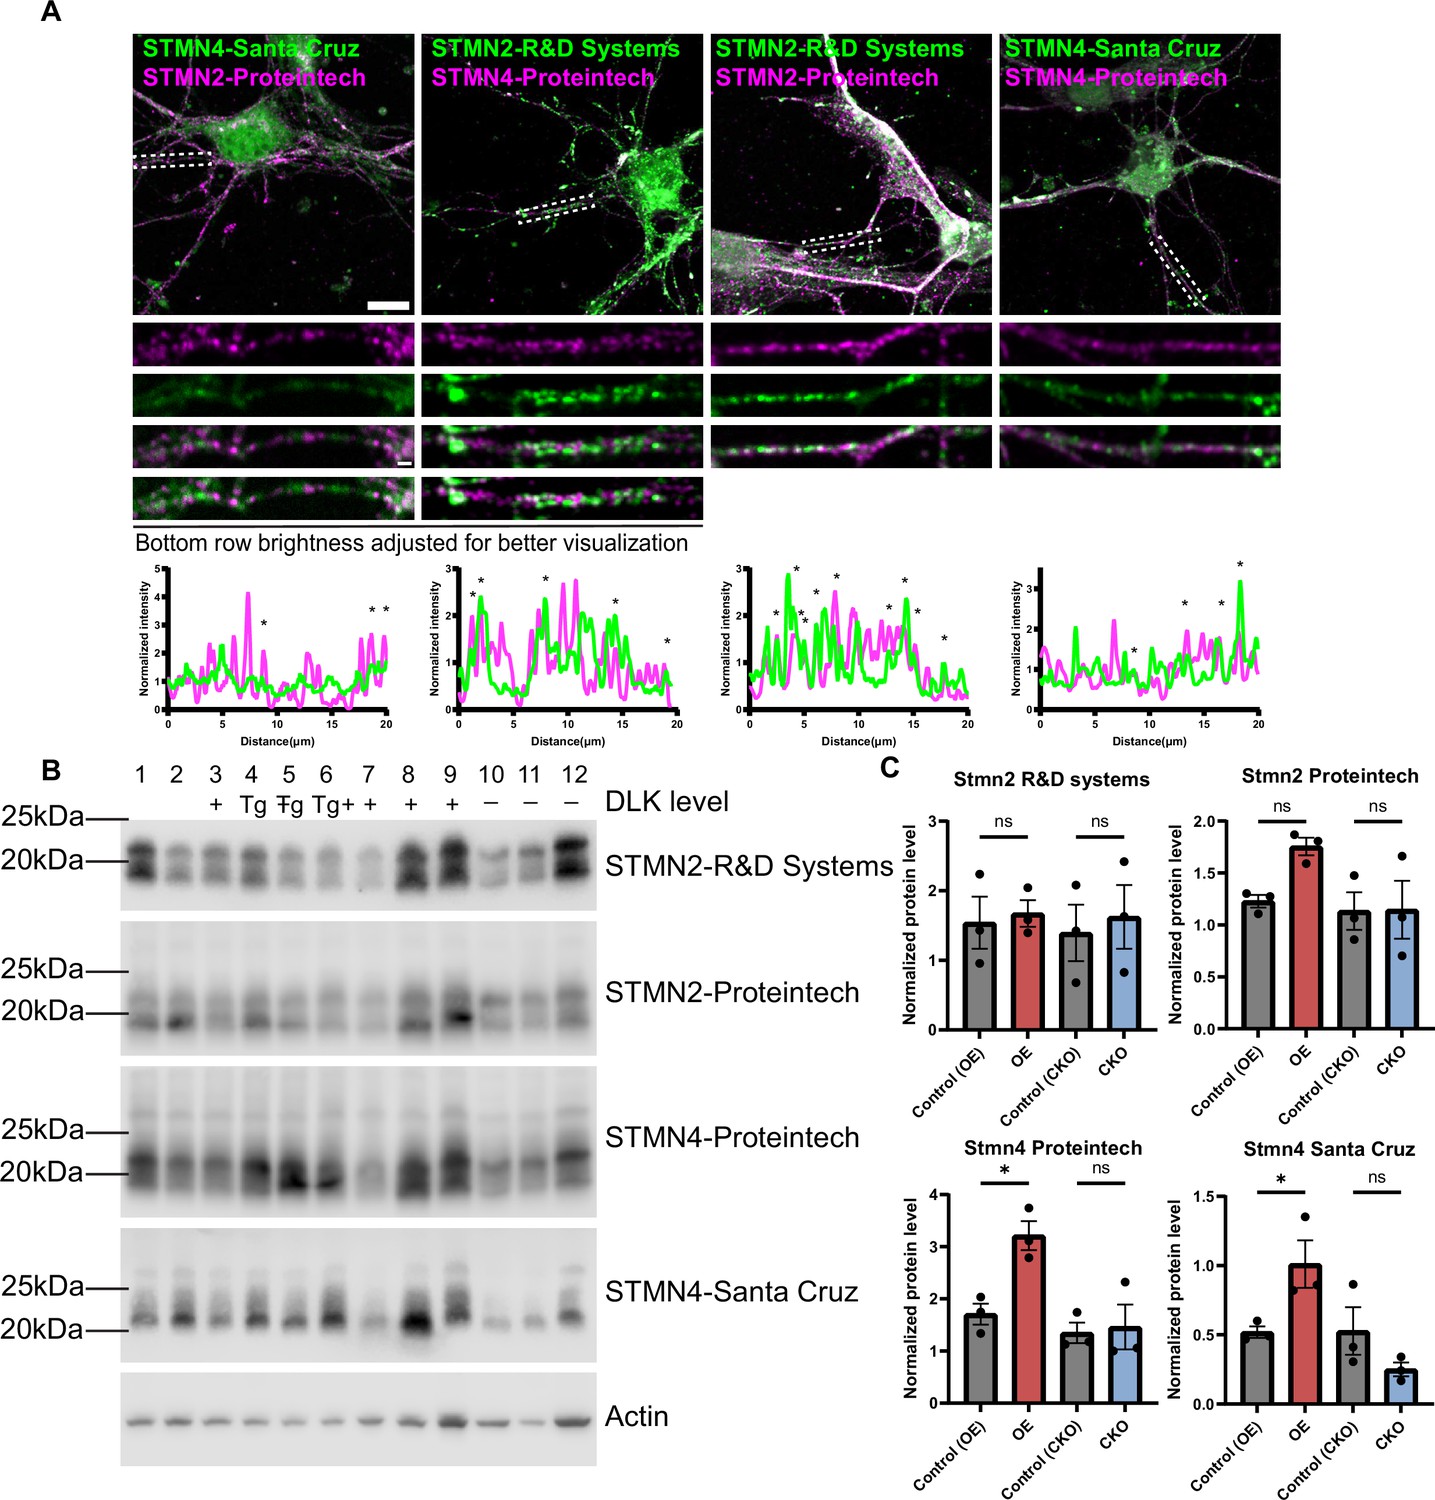
(A) Confocal single-slice images of STMN2 and STMN4 immunostaining using two independent antibodies on control primary hippocampal neurons DIV3. Dashed boxes are enlarged below. Scale bar,10μm full cell, 1 μm enlarged region. Line scan below reflects normalized intensity, with asterisks reflecting overlapping peaks. (B) Western blots of protein extracts from P15 hippocampal tissue of genotype indicated for STMN2 and STMN4 antibodies. Lanes 1–3 are littermate controls (+) for lanes 4–6 Slc17a7Cre/+;H11-DLK(iOE)/+, referred to as ‘Tg’; and lanes 7–9 are littermate controls (+) for lanes 10–12 Slc17a7Cre/+;Map3k12fl/fl, referred to as ‘-’. (C) Quantification of STMN2 or STMN4 protein level normalized to actin. N=3 mice/genotype. Statistics: One way ANOVA with Sidak’s multiple comparison test. ns, not significant; * p<0.05. Error bars represent SEM.
-
Figure 6—figure supplement 2—source data 1
Original western blots for images shown in Figure 6—figure supplement 2B.
- https://cdn.elifesciences.org/articles/101173/elife-101173-fig6-figsupp2-data1-v1.zip
-
Figure 6—figure supplement 2—source data 2
PDF showing original western blots for images shown in Figure 6—figure supplement 2B, along with relevant bands and genotypes.
Pg. 1 Original membranes corresponding to Panel B. Molecular weights shown using Precision Plus Protein Dual Color Ladder. Each lane represents a separate mouse. Lanes 1–3 show control samples (from DLK(iOE) sibs), lanes 4–6 show DLK(iOE), lanes 7–9 show control samples (from DLK(cKO) sibs), lanes 10–12 show DLK(cKO). All from P15 timepoint. Dotted lines indicate locations where membrane was cut for labeling with separate antibodies. Samples were split, with half of each prepped sample loaded onto two membranes (membrane 1&2). Pg. 2 Original membranes corresponding to Panel B. Molecular weights shown using Precision Plus Protein Dual Color Ladder. Each lane represents a separate mouse. Lanes 1–3 show control samples (from DLK(iOE) sibs), lanes 4–6 show DLK(iOE), lanes 7–9 show control samples (from DLK(cKO) sibs), lanes 10–12 show DLK(cKO). All from P15 timepoint. Dotted lines indicate locations where membrane was cut for labeling with separate antibodies. Samples were split, with half of each prepped sample loaded onto two membranes (membrane 1&2).
- https://cdn.elifesciences.org/articles/101173/elife-101173-fig6-figsupp2-data2-v1.zip
Figure 7
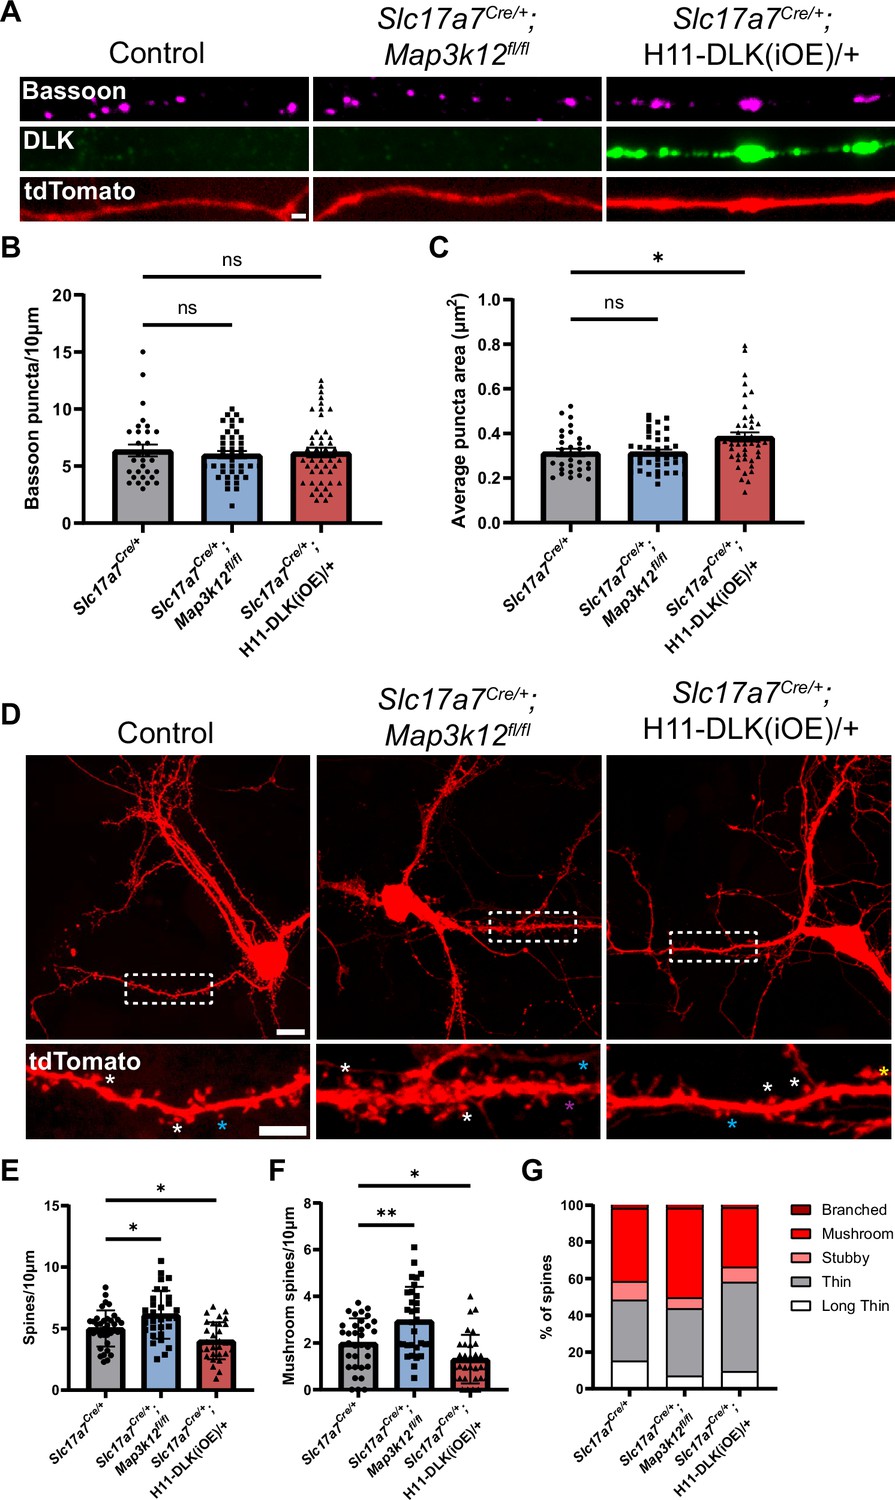
Increasing DLK expression alters synapse formation in primary cultured hippocampal neurons.
(A) Confocal images of axons of DIV14 neurons of indicated genotype, co-stained with Bassoon and DLK. Neurons with indicated genotypes are labeled by tdTomato from Cre-dependent Rosa26-tdTomato generated from the following crosses: for control: Slc17a7Cre/+ X Rosa26tdT/+; for DLK(cKO): Slc17a7Cre/+;Map3k12fl/fl X Map3k12fl/fl;Rosa26tdT/+; for DLK(iOE): H11-DLK(iOE)/H11-DLK(iOE) X Slc17a7 Cre/+;Rosa26tdT/+. Scale bar, 1 μm. (B) Quantification of bassoon puncta density. (C) Quantification of average bassoon puncta size from individual neurons. Number of neurons: 30 from 3 Slc17a7-cre (control) cultures, 41 from 3 DLK(cKO) cultures, 46 from 4 DLK(iOE) cultures. Statistics: One way ANOVA with Dunnett’s multiple comparison test. ns, not significant; * p<0.05. (D) Confocal z-stack images of DIV14 neurons of indicated genotype, labeled by Rosa26-tdTomato. Dashed boxes outline dendrites enlarged below for dendritic spines. Asterisks provide some examples of spine types; long thin with purple; thin with blue; mushroom with white; stubby with yellow. Scale bar, 10 μm top, 5 μm bottom. (E) Quantification of dendritic spine density. (F) Quantification of mushroom spine density. (G) Distribution of spine types. (E–G) Number of neurons: 35 from 3 Slc17a7-cre (control) cultures, 31 from 3 DLK(cKO) cultures, 31 from 3 DLK(iOE) cultures. Statistics: One way ANOVA with Dunnett’s multiple comparison test. * p<0.05; ** p<0.01. All error bars represent SEM.
Tables
Key resources table
| Reagent type (species) or resource | Designation | Source or reference | Identifiers | Additional information |
|---|---|---|---|---|
| Genetic reagent (Mus musculus) | Conditional DLK knockout: Map3k12fl/fl | PMID:33475086; 27511108; 35361703 | housed in UCSD vivarium | |
| Genetic reagent (M. musculus) | Inducible DLK overexpression: H11-DLK(iOE) | PMID:33475086 | housed in UCSD vivarium | |
| Genetic reagent (M. musculus) | Slc17a7Cre | The Jackson Laboratory | Strain #023527; RRID:IMSR_JAX:023527 | B6;129S-Slc17a7tm1.1(cre)Hze/J |
| Genetic reagent (M. musculus) | Rpl22HA | The Jackson Laboratory | Strain #029977; RRID:IMSR_JAX:029977 | B6J.129(Cg)-Rpl22tm1.1Psam/SjJ |
| Genetic reagent (M. musculus) | Rosa26tdT | The Jackson Laboratory | Strain #007914; RRID:IMSR_JAX:007914 | B6.Cg-Gt(ROSA)26Sortm 14(CAG-tdTomato)Hze/J |
| Antibody | Rabbit polyclonal anti-Map3k12 antibody | Genetex | GTX124127; RRID:AB_11170703 | IF (1:250) tissue, (1:1000) cells, WB (1:1000); Lot #40653 |
| Antibody | Rabbit monoclonal anti-p-c-Jun (Ser73) (D47G9) antibody | Cell signaling | 3270; RRID:AB_2129575 | IF (1:200) tissue, Lot #5 |
| Antibody | Rabbit polyclonal anti-GFAP antibody | Dako | Z0334; RRID:AB_10013382 | IF: (1:500); Lot #20049469 |
| Antibody | Rabbit polyclonal anti-IBA1 | Wako | 019–19741; RRID:AB_839504 | IF: (1:1000) |
| Antibody | Rat monoclonal anti-HA High Affinity | Roche | 11867423001; RRID:AB_390918 | IP (5 ug); Lot #47877600 |
| Antibody | Rabbit monoclonal anti-HA (C29F4) | Cell Signaling | 3724; RRID:AB_1549585 | WB (1:1000); Lot #8 |
| Antibody | Mouse monoclonal anti-NeuN | Millipore | MAB377; RRID:AB_2298772 | IF (1:200); Lot #3104227/3808682 |
| Antibody | Mouse monoclonal anti-Tubb3 (Tuj1) | Biolegend | 801202; RRID:AB_2313773 | IF (1:1000) tissue, (1:5000) cells; Lot #B249869 |
| Antibody | Rabbit polyclonal anti-Tubb3 | Sigma-Aldrich | T2200; RRID:AB_262133 | IF (1:500) cells; Lot #21190649 |
| Antibody | Mouse monoclonal anti-Acetyl-Tubulin (6-11b-1) | Sigma-Aldrich | T7451; RRID:AB_609894 | IF (1:500) tissue, (1:3000) cells; WB (1:1000) |
| Antibody | Mouse monoclonal anti-Stmn4 | Santa Cruz Biotechnology | Sc-376936 | IF (1:250) cells; WB (1:50); Lot # E3012 |
| Antibody | Rabbit polyclonal anti-Stmn4 | Proteintech | 12027–1-AP; RRID:AB_2197401 | IF (1:400) cells; WB (1:1000); Lot#00005750 |
| Antibody | Mouse monoclonal anti-Stmn2 | R&D Systems | MAB6930; RRID:AB_10972937 | IF (1:1000) cells; WB (0.4 ng/mL); Lot#CFIL052310A |
| Antibody | Rabbit polyclonal anti-Stmn2 | Proteintech | 10586–1-AP; RRID:AB_2197283 | IF (1:400) cells; WB (1:2000); Lot#00124321 |
| Antibody | Mouse monoclonal anti-Tyrosinated Tubulin (TUB1A2) | Sigma-Aldrich | T9028; RRID:AB_261811 | IF (1:1000) tissue, (1:5000) cells; WB (1:1000); Lot #22181017 |
| Antibody | Rabbit polyclonal anti-Vglut1 | Synaptic Systems | 135 302; RRID:AB_887877 | IF (1:1000) tissue; Lot #1–53 |
| Antibody | Rabbit monoclonal anti-c-Jun (60 A8) | Cell Signaling | 9165; RRID:AB_2130165 | IF (1:200) tissue, (1:1000) cells; Lot #11 |
| Antibody | Mouse monoclonal anti-Bassoon (SAP7F407) | Novus | NB120-13249; RRID:AB_788125 | IF (1:500) tissue, cells; Lot #06082117 |
| Antibody | Chicken polyclonal anti-MAP2 | Abcam | Ab5392; RRID:AB_2138153 | IF (1:5,000) cells; Lot #1012833–1 |
| Antibody | Monoclonal mouse anti-beta actin | ABclonal | AC004; RRID:AB_2737399 | WB (1:5000); Lot #3500100012 |
| Antibody | Mouse monoclonal anti-Flag M2 | Sigma-Aldrich | F1804; RRID:AB_262044 | WB (1:500) |
| Antibody | Rabbit polyclonal anti-Homer1 | Synaptic systems | 160–003; RRID:AB_887730 | IF (1:500) tissue |
| Antibody | Mouse monoclonal anti-Satb2 | Abcam | Ab51502; RRID:AB_882455 | IF (1:500) cells |
| Antibody | Goat polyclonal anti-Prox1 | R&D Systems | AF2727; RRID:AB_2170716 | IF (4 µg/mL) |
| Antibody | Rabbit polyclonal anti-Map3k13 | Sigma-Aldrich | HPA016497; RRID:AB_10670027 | IF (1:200) tissue |
| Antibody | Alexafluor488 goat anti mouse IGG (H+L) | Invitrogen | A11001; RRID:AB_2534069 | IF (1:500) tissue, (1:2000) cells; Lot #745480 |
| Antibody | Alexafluor488 donkey anti mouse IGG (H+L) | Invitrogen | A21202; RRID:AB_141607 | IF (1:500) tissue, (1:2000) cells; Lot #2266877 |
| Antibody | Alexafluor647 goat anti rabbit IGG (H+L) | Invitrogen | A21245; RRID:AB_2535813 | IF (1:500) tissue, (1:2000) cells; Lot #2299231 |
| Antibody | Alexafluor488 donkey anti rabbit IGG (H+L) | Invitrogen | A21206; RRID:AB_2535792 | IF (1:500) tissue, (1:2000) cells; Lot #2376850 |
| Antibody | Alexafluor647 goat anti mouse IGG (H+L) | Invitrogen | A21236; RRID:AB_2535805 | IF (1:500) tissue, (1:2000) cells; Lot #2300995 |
| Antibody | Alexa Fluor 647 goat anti chicken IgG (H+L) | Invitrogen | A21449; RRID:AB_2535866 | IF (1:2000) cells; Lot #2079903 |
| Antibody | Anti-rabbit: ECL Anti-Rabbit lgG, HRP | Cytiva | NA934V; RRID:AB_772206 | WB (1:5000); Lot #17624274 |
| Antibody | Anti-mouse: ECL Anti-mouse lgG, HRP | Cytiva | NXA931V; RRID:AB_772209 | WB (1:5000); Lot #17675041 |
| Antibody | Stabilized goat anti-rabbit HRP conjugated | Pierce | 1858415 | WB (1:5000); Lot # HE104909 |
| Sequence-based reagent | RNAscope probe MAP3K12-C2 | ACD | ACD:458151 C2 | |
| Sequence-based reagent | RNAscope probe Slc17a7-C3 | ACD | ACD:416631 C3 | |
| Sequence-based reagent | RNAscope probe Gfap-C2 | ACD | ACD:313211 C2 | |
| Sequence-based reagent | RNAscope probe Stmn4 | ACD | ACD:537541 | |
| Commercial assay or kit | DeadEnd Fluorometric TUNEL System | Promega | G3250 | |
| Commercial assay or kit | RNAeasy Minikit | Qiagen | 74104 | |
| Commercial assay or kit | Superscript III First Strand Synthesis System | Invitrogen | 18080051 | |
| Commercial assay or kit | iQ Sybr Green Supermix | Bio-Rad | 1708880 | |
| Commercial assay or kit | Pierce BCA Protein Assay Kits | Thermo Scientific | 23227 | |
| Commercial assay or kit | RNAscope Fluorescent Multiplex Reagent kit | ACD | 320850 | Amp 4 Alt A-FL |
| Chemical compound, drug | Cycloheximide | Sigma-Aldrich | C4859 | |
| Software, algorithm | Galaxy | PMID:29790989 | RRID:SCR_006281 | https://usegalaxy.org/ |
| Software, algorithm | FastQC | Babraham Bioinformatics | RRID:SCR_014583 | https://github.com/s-andrews/FastQC |
| Software, algorithm | STAR aligner | PMID:23104886 | RRID:SCR_004463 | https://github.com/alexdobin/STAR |
| Software, algorithm | FeatureCounts | PMID:24227677 | RRID:SCR_012919 | https://subread.sourceforge.net/ |
| Software, algorithm | RStudio | Posit | RRID:SCR_000432 | https://posit.co/download/rstudio-desktop/ |
| Software, algorithm | ggplot2 | Wickham, 2016 | RRID:SCR_014601 | https://ggplot2.tidyverse.org/ |
| Software, algorithm | DAVID | PMID:19131956 | RRID:SCR_001881 | https://david.ncifcrf.gov/home.jsp |
| Software, algorithm | Rank Rank Hypergeometric Overlap | PMID:20660011 | RRID:SCR_014024 | https://systems.crump.ucla.edu/rankrank/rankranksimple.php |
| Software, algorithm | SynGO | PMID:31171447 | RRID:SCR_017330 | https://www.syngoportal.org/ |
| Software, algorithm | GSEA | PMID:16199517 | RRID:SCR_003199 | https://www.gsea-msigdb.org/gsea/index.jsp |
| Software, algorithm | Fiji | PMID:22743772 | RRID:SCR_002285 | https://imagej.net/software/fiji/ |
| Software, algorithm | GraphPad Prism | GraphPad Software | RRID:SCR_002798 | http://www.graphpad.com |
| Other | Protein G Dynabeads | Invitrogen | 10003D | |
| Other | DAPI | Invitrogen | D1306 | |
| Other | B27 | Gibco | 17504–044 | |
| Other | RNAse inhibitor, murine | New England Biolabs | M0314 |
Additional files
-
Supplementary file 1
Excel file containing DLK(cKO) differentially expressed genes.
File containing differential expression results from DLK(cKO) compared to control and their regional enrichment. Highlighted columns show gene symbols of differentially expressed genes (padj <0.05), Log2 fold change, and adjusted p-values. Sheets show genes sorted by all differentially expressed genes, upregulated genes, downregulated genes, and synaptic genes.
- https://cdn.elifesciences.org/articles/101173/elife-101173-supp1-v1.xlsx
-
Supplementary file 2
Excel file containing DLK(iOE) differentially expressed genes.
File containing differential expression results from DLK(iOE) compared to control and their regional enrichment. Highlighted columns show gene symbols of differentially expressed genes (padj <0.05), Log2 fold change, and adjusted p-values. Sheets show genes sorted by all differentially expressed genes, regional expression, upregulated genes, downregulated genes, and synaptic genes.
- https://cdn.elifesciences.org/articles/101173/elife-101173-supp2-v1.xlsx
-
Supplementary file 3
Excel file containing CamK2 and Grik4 RiboTag enriched genes.
File containing top 100 genes enriched in CamK2-RiboTag compared to Grik4-RiboTag and vice versa (Traunmüller et al., 2023; GSE209870) as described in methods.
- https://cdn.elifesciences.org/articles/101173/elife-101173-supp3-v1.xlsx
-
Supplementary file 4
Primers used for genotyping and qRT-PCR.
File containing primer sequences used for genotyping and qRT-PCR.
- https://cdn.elifesciences.org/articles/101173/elife-101173-supp4-v1.docx
-
MDAR checklist
- https://cdn.elifesciences.org/articles/101173/elife-101173-mdarchecklist1-v1.docx
Download links
A two-part list of links to download the article, or parts of the article, in various formats.
Downloads (link to download the article as PDF)
Open citations (links to open the citations from this article in various online reference manager services)
Cite this article (links to download the citations from this article in formats compatible with various reference manager tools)
Translatome analysis reveals cellular network in DLK-dependent hippocampal glutamatergic neuron degeneration
eLife 13:RP101173.
https://doi.org/10.7554/eLife.101173.3


