Xist RNA binds select autosomal genes and depends on Repeat B to regulate their expression
- Department of Molecular Biology, Massachusetts General Hospital, United States
- Department of Genetics, The Blavatnik Institute, Harvard Medical School, United States
Figures
Figure 1 with 4 supplements
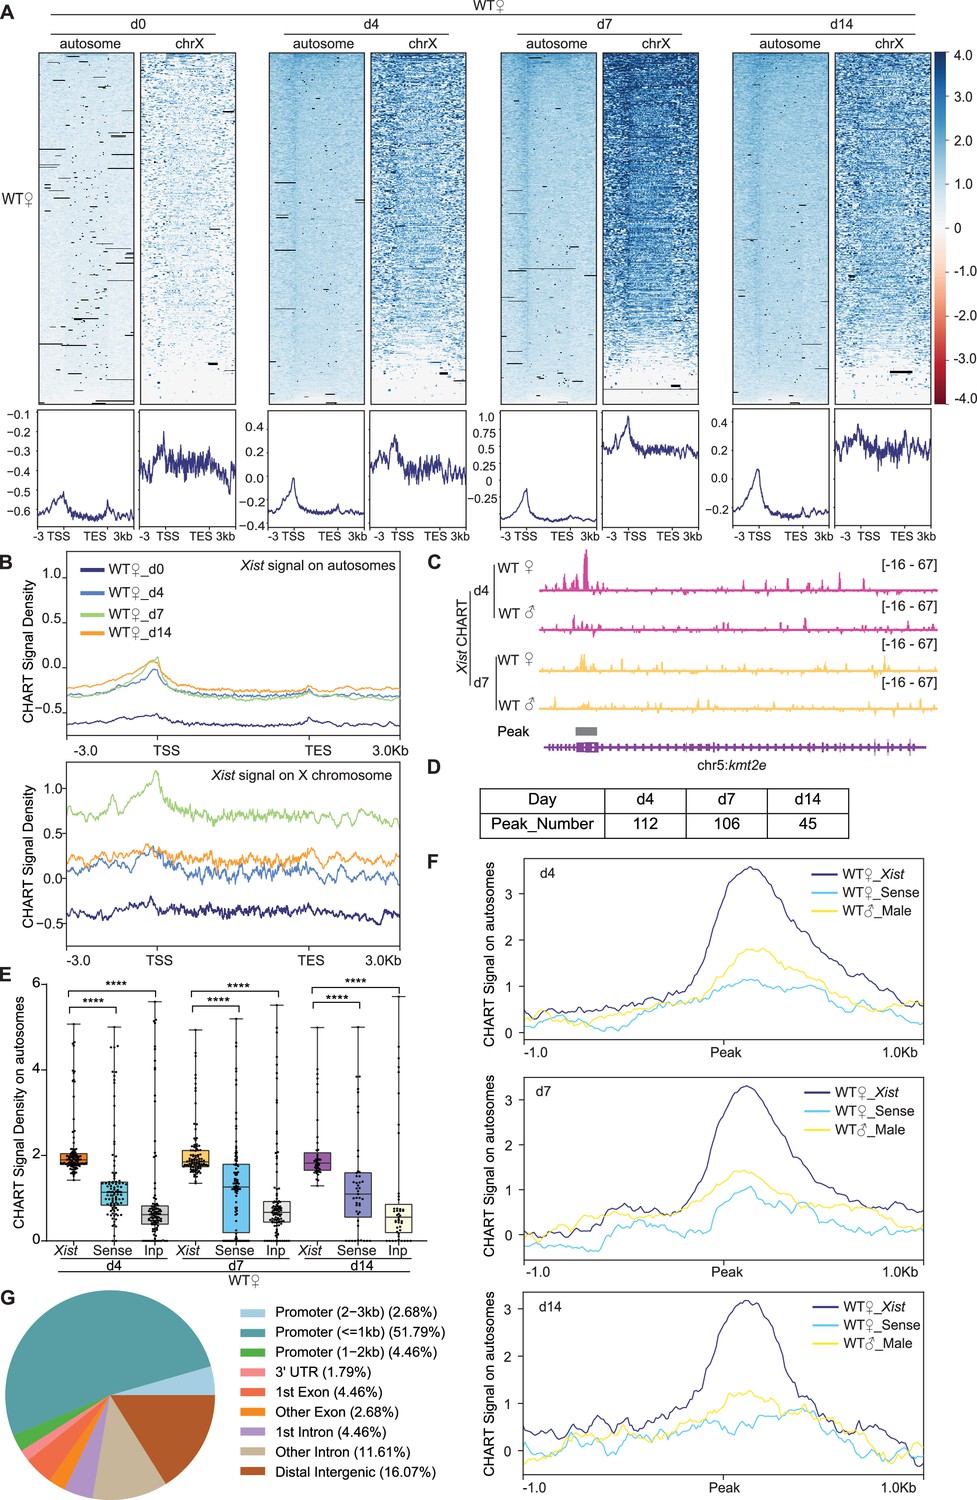
Capture hybridization analysis of RNA targets (CHART)-seq reveals ~100 discrete binding sites in autosomal genes.
(A) Top: Heatmaps of Xist coverage on autosomes and chromosome X genes in wild-type (WT) female embryonic stem (ES) cells at day 0, day 4, day 7, and day 14. Bottom: Average profiles shown as metagene maps of the data in the top panel. TSS, transcription start site. TES, transcription end site. (B) Average profile of Xist coverage on autosomes and X chromosome genes in WT female ES cells at day 0, day 4, day 7, and day 14. (C) Representative site-specific binding of Xist on autosome locus (Kmt2e) in WT female ES cells at day 4 and day 7, WT male ES cells are used as control. (D) Number of Xist peaks determined by MACS2 peak calling on autosomes in WT female ES cells at day 4, day 7, and day 14. (E) Xist CHART signal coverage on Xist-autosomal peak region (top 100 peaks) in WT female ES cells at day 4, day 7, and day 14. Sense and input are used as control. P-values are determined using the Wilcoxon rank sum test. (F) Average profile of CHART (subtracted input) signal on Xist-autosomal peak region (top 100 peaks) in WT female and male ES cells at day 4, day 7, and day 14. Sense and WT male ES are used as control. (G) Feature annotation of Xist binding loci on autosomes by ChIPseeker in WT female ES cells at day 4.
Figure 1—figure supplement 1
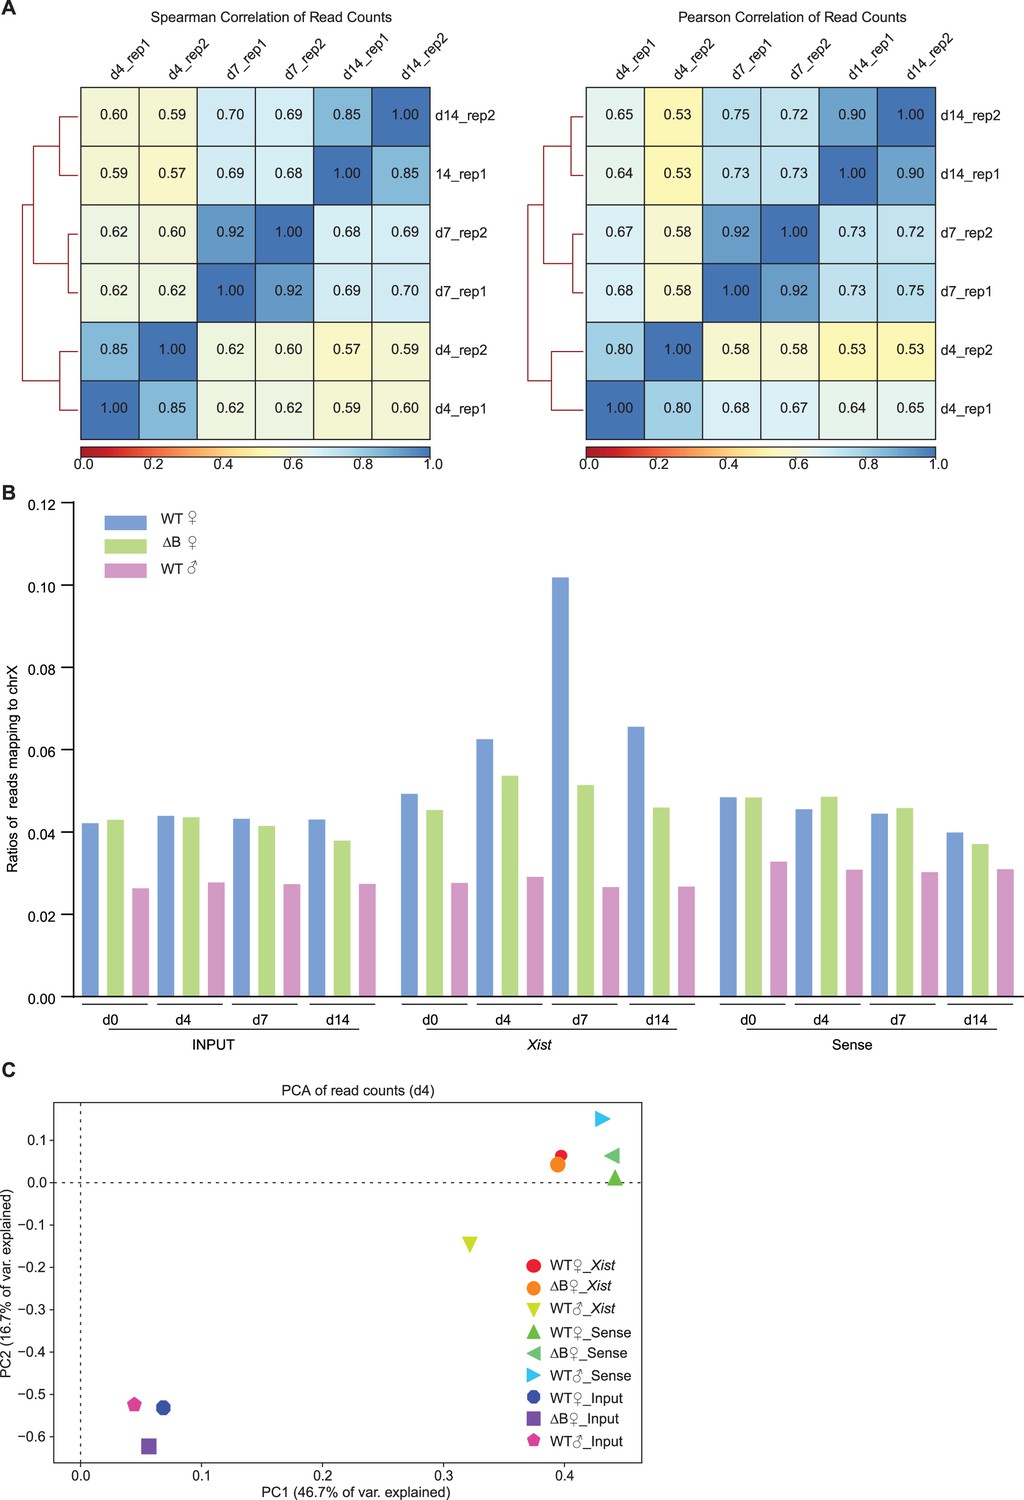
Xist binds autosomal genes in trans.
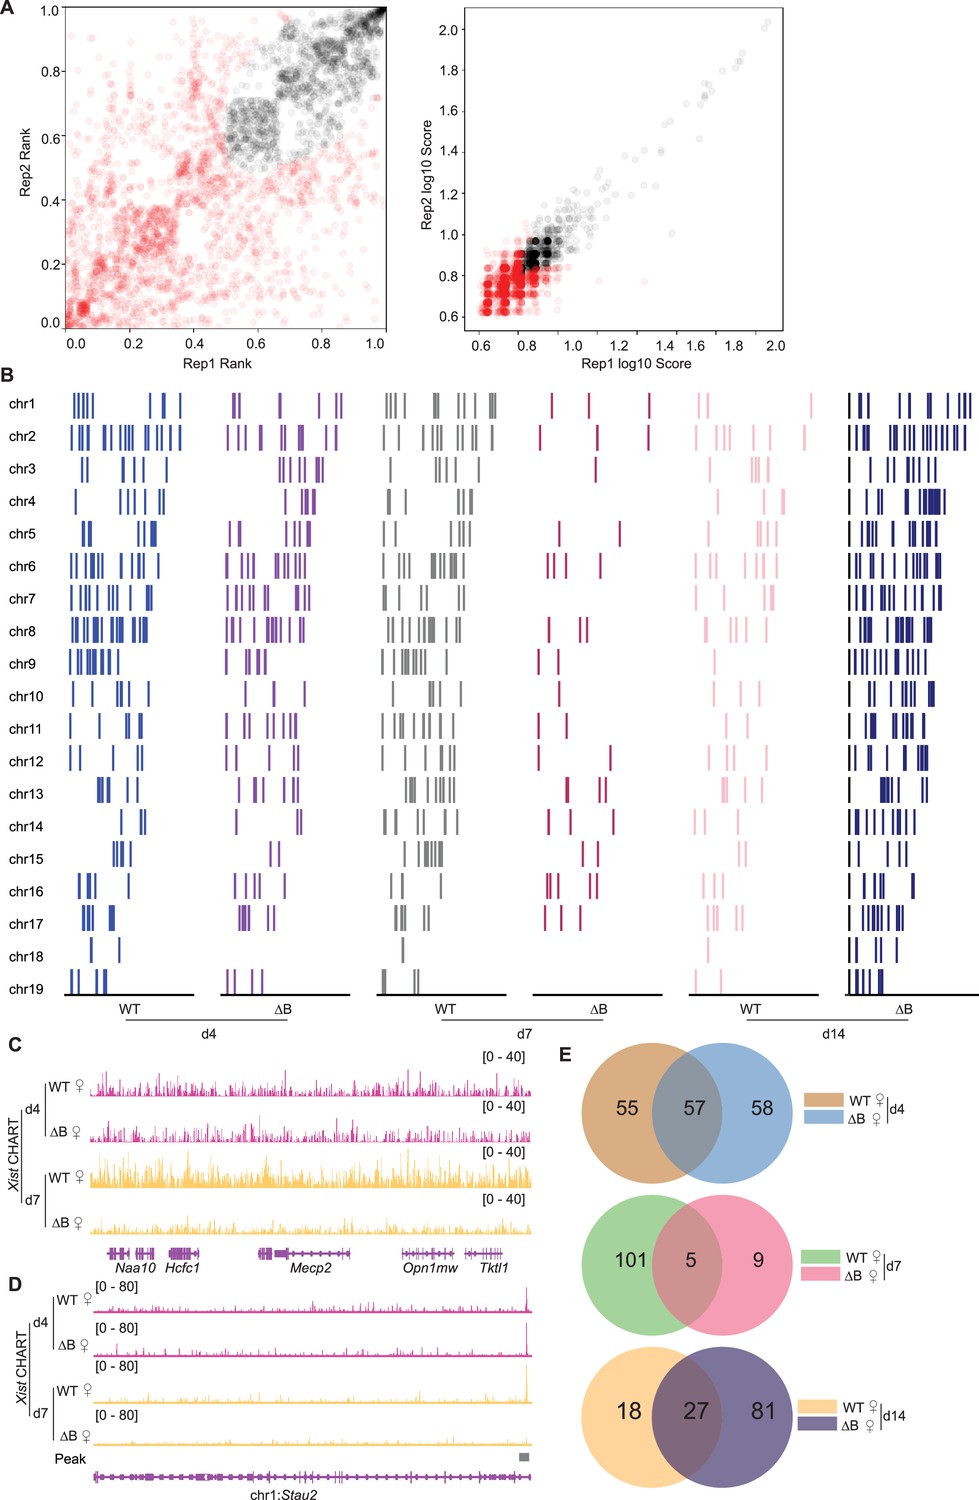
(A) Spearman (rank-based relationship) and Pearson (linear relationship) correlation analysis show a strong positive correlation between the two biological capture hybridization analysis of RNA targets (CHART) sequencing. (B) Xist CHART-seq reads the percent of autosomes and Chromosome X in wild-type (WT) and ΔRepB female embryonic stem (ES) cells at day 0, day 4, day 7, and day 14. ES day 7 exhibits the highest Xist coverage. Sense probe and male ES cells are used as a control. (C) Principal component analysis (PCA) of CHART-seq reads includes Xist, sense, and input in WT and ΔRepB female, and male ES cells at day 4. Samples clustering closer together share similar genome-wide coverage patterns.
Figure 1—figure supplement 2
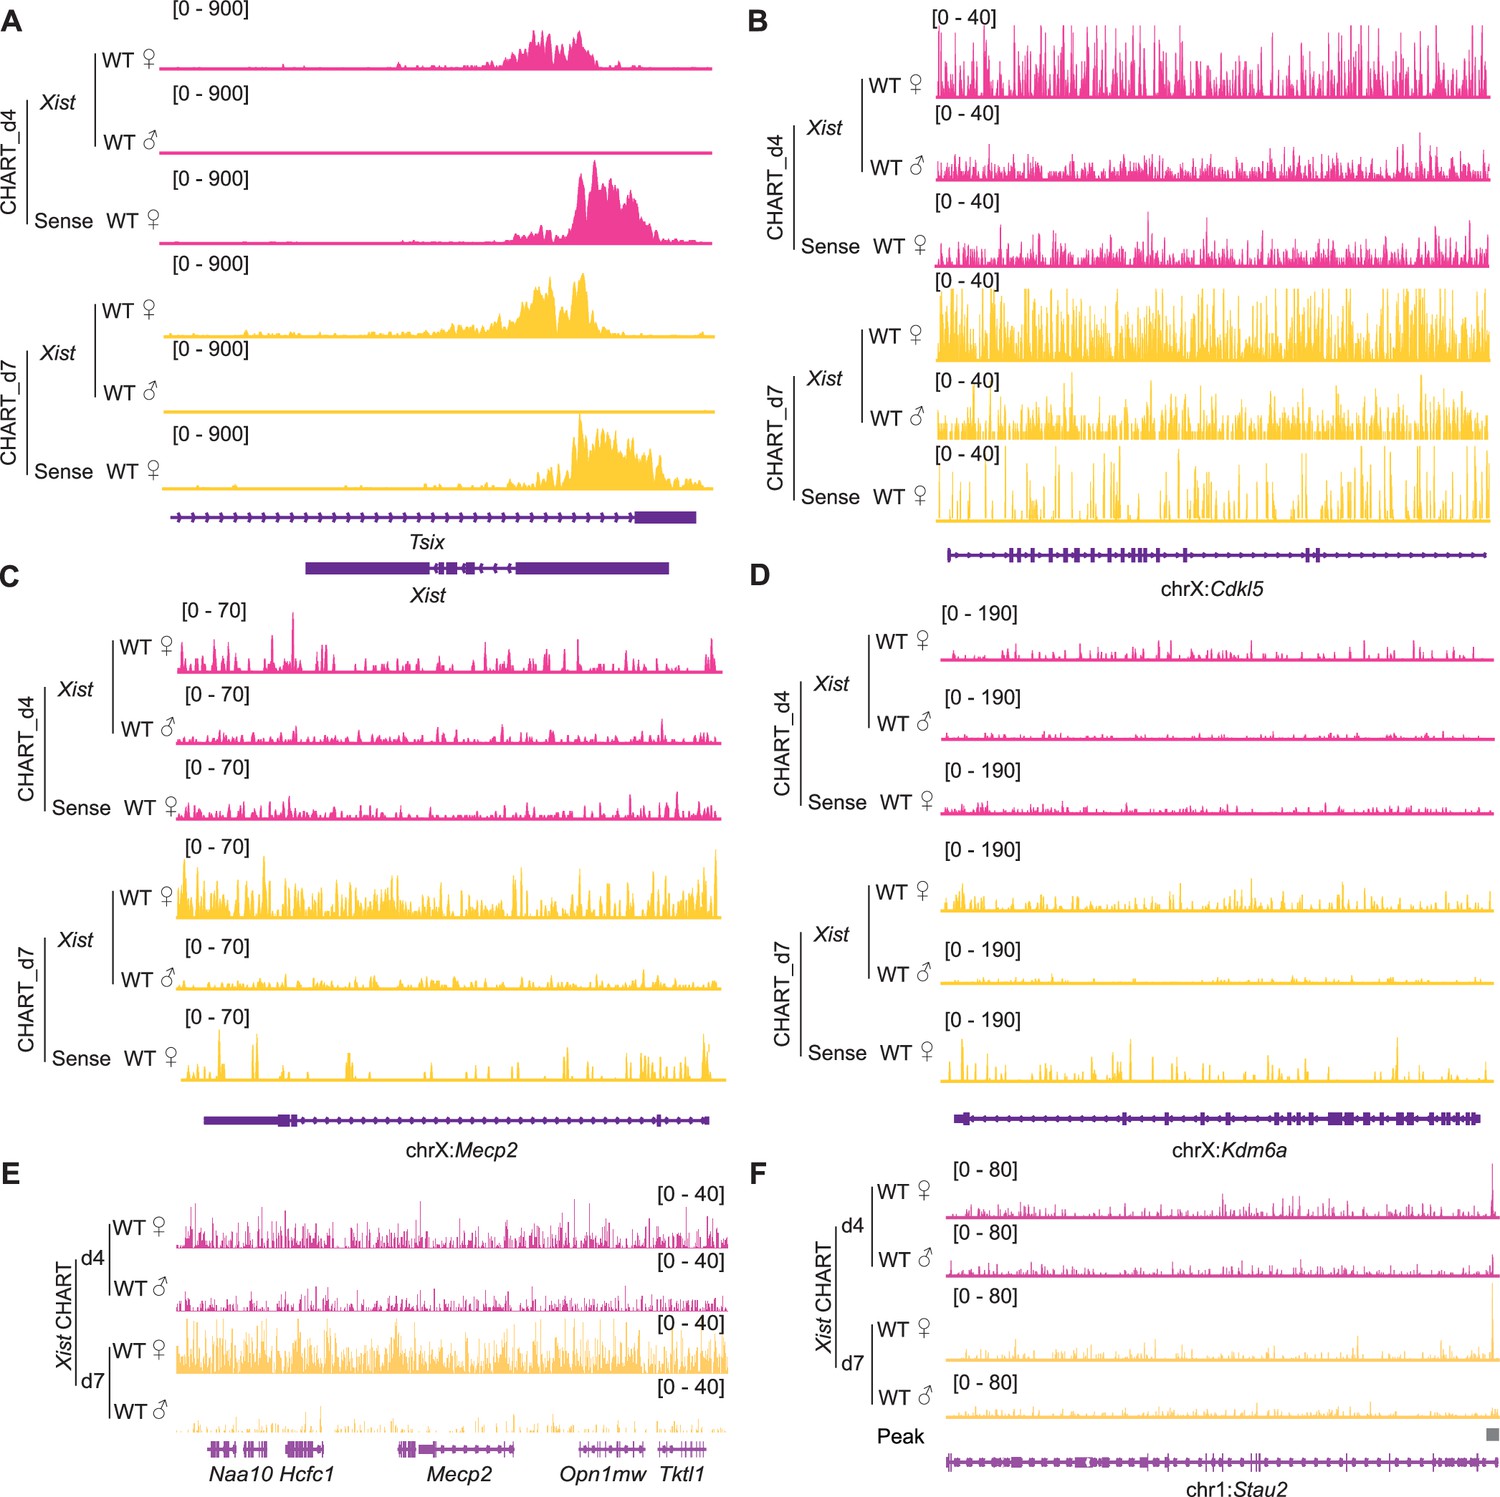
Xist binds to the X chromosome during female embryonic stem (ES) cell differentiation.
(A–D) Representative binding signals of Xist RNA on the Xist locus (A), genes subjective to X chromosome inactivation (XCI) such as Cdkl5 (B), Mecp2 (C), and escapee genes (Kdm6a) (D) in wild-type (WT) female ES cells at day 4 and day 7. WT male ES cells and sense probe are used as control. (E) Representative consecutive binding signals of Xist on chromosome X (~320 kb) in WT female ES cells at day 4 and day 7. WT male ES cells are used as control. (F) Representative site-specific binding of Xist on autosome locus (Stau2) in WT female ES cells at day 4 and day 7, WT male ES cells are used as control.
Figure 1—figure supplement 3
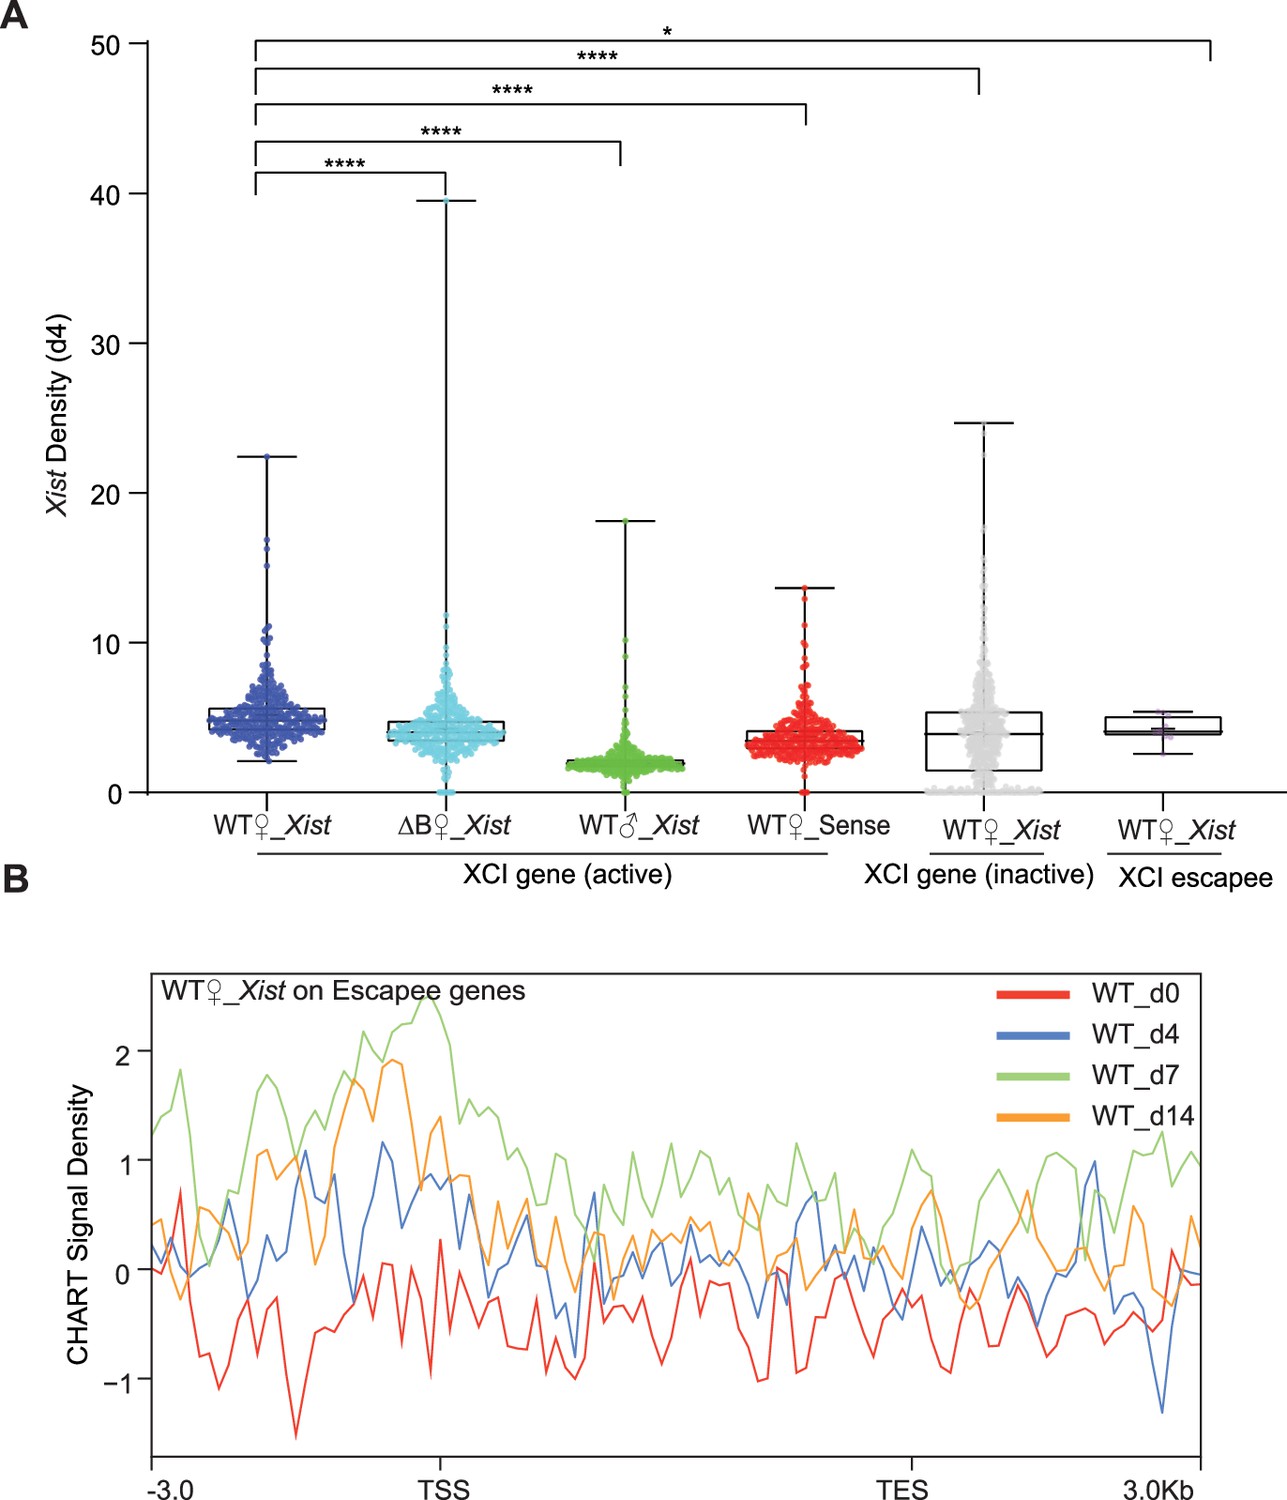
Xist binds X chromosome inactivation (XCI) genes during differentiation.
(A) Xist capture hybridization analysis of RNA targets (CHART) signal coverage on X chromosome genes (XCI-active/inactive, and escapee) in wild-type (WT) female embryonic stem (ES) cells at day 4. Sense and male ES cells are used as control. p-values are determined using the Wilcoxon rank sum test. (B) Average profile of Xist CHART signal on XCI escapee genes (day 0, 4, 7, and 14) shows that Xist accumulated in the upstream of the promoter but depleted in the escapee gene body.
Figure 1—figure supplement 4
Xist binds select autosomal genes in trans.
(A) IDR (Irreproducible discovery rate) analysis to assess the reproducibility of the peaks detected across biological replicates (day 4). The results showed a strong correlation between the replicates, with an IDR threshold of 0.05 (red point >0.05). (B) Xist peak pattern (MACS2 peak calling) on autosomes in wild-type (WT) and ΔRepB female ES cells at day 4, day 7, and day 14. (C) Representative consecutive binding signals of Xist on chromosome X (~320 kb) in WT and ΔRepB female embryonic stem (ES) cells at day 4 and day 7. (D) Representative site-specific binding of Xist on autosome locus (Stau2) in WT and ΔRepB female ES cells at day 4 and day 7. (E) The Venn diagram illustrates the overlap of peak sites identified in WT and ΔRepB female ES cells at day 4, day 7, and day 14.
Figure 2 with 1 supplement
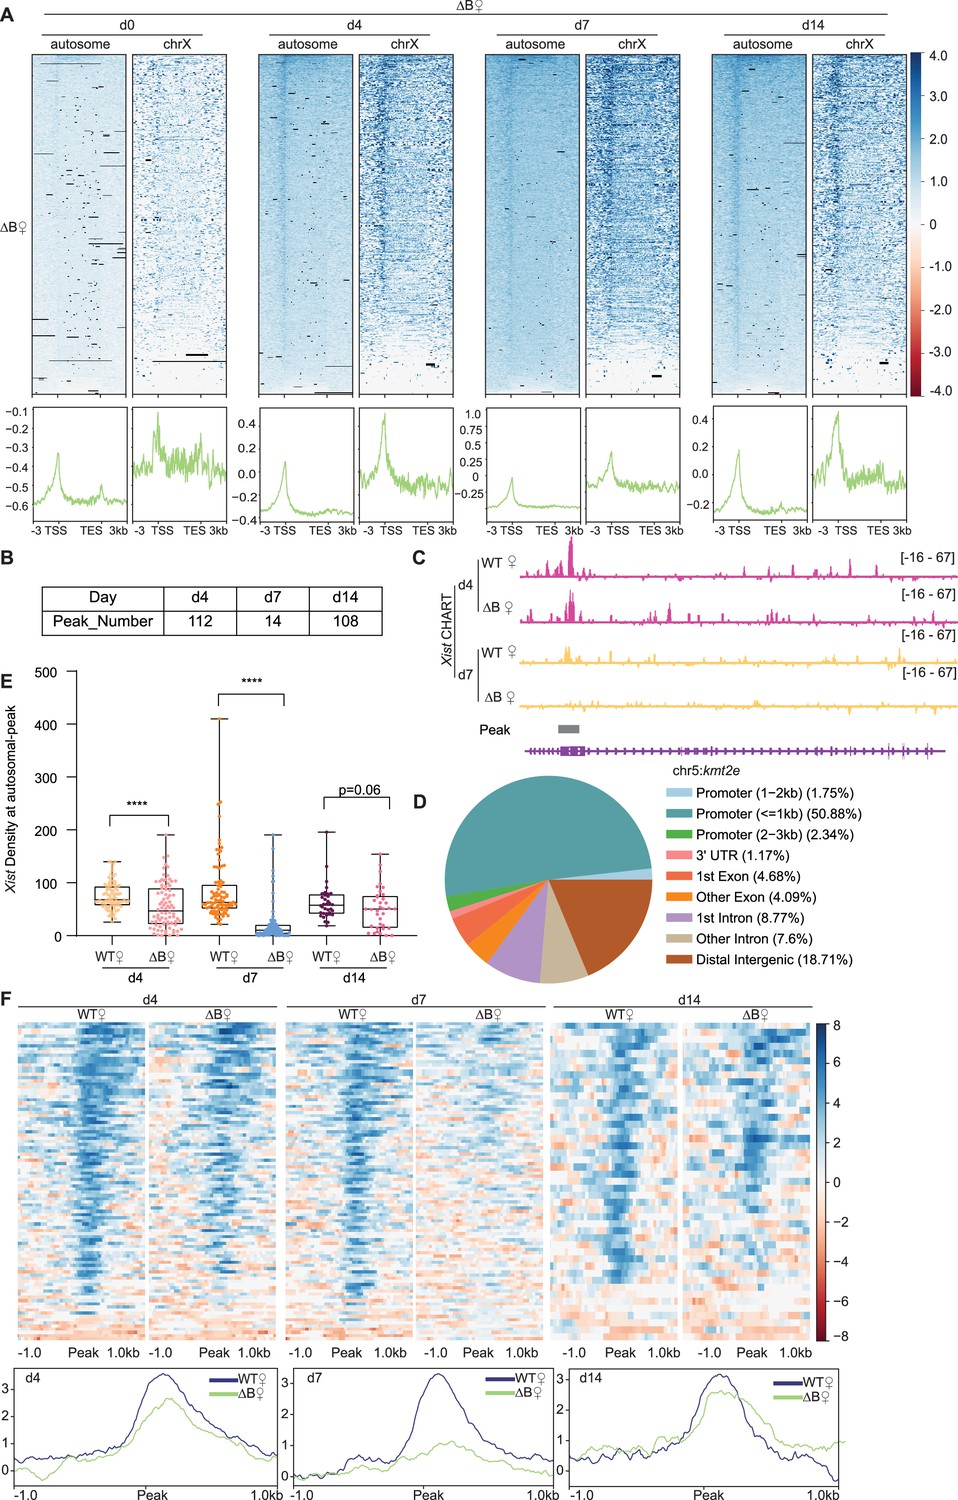
Xist’s Repeat B is required for proper binding of Xist to autosomal genes.
(A) Top: Heatmaps of Xist coverage on autosomes and chromosome X genes in wild-type (WT) female embryonic stem (ES) cells at day 0, day 4, day 7, and day 14. Bottom: Average profiles shown as metagene maps of the data in the top panel. (B) Number of Xist peaks determined by MACS2 peak calling on autosomes in ΔRepB female ES cells at day 4, day 7, and day 14. (C) Representative site-specific binding of Xist on autosome locus (Kmt2e) in WT and ΔRepB female ES cells at day 4 and day 7. (D) Feature annotation of Xist binding loci on autosomes by ChIPseeker in ΔRepB female ES cells at day 4. (E) Xist capture hybridization analysis of RNA targets (CHART) signal coverage on Xist-autosomal peak region in WT and ΔRepB female ES cells at day 4, day 7, and day 14. P-values are determined using the Wilcoxon rank sum test. (F) Top: Heatmaps of Xist coverage on Xist-autosomal peak region (top 100 peaks) in WT and ΔRepB female ES cells at day 4, day 7, and day 14. Bottom: Average profiles shown as metagene maps of the data in the top panel.
Figure 2—figure supplement 1
Xist binds X-linked genes is Xist’s RepB dependent.
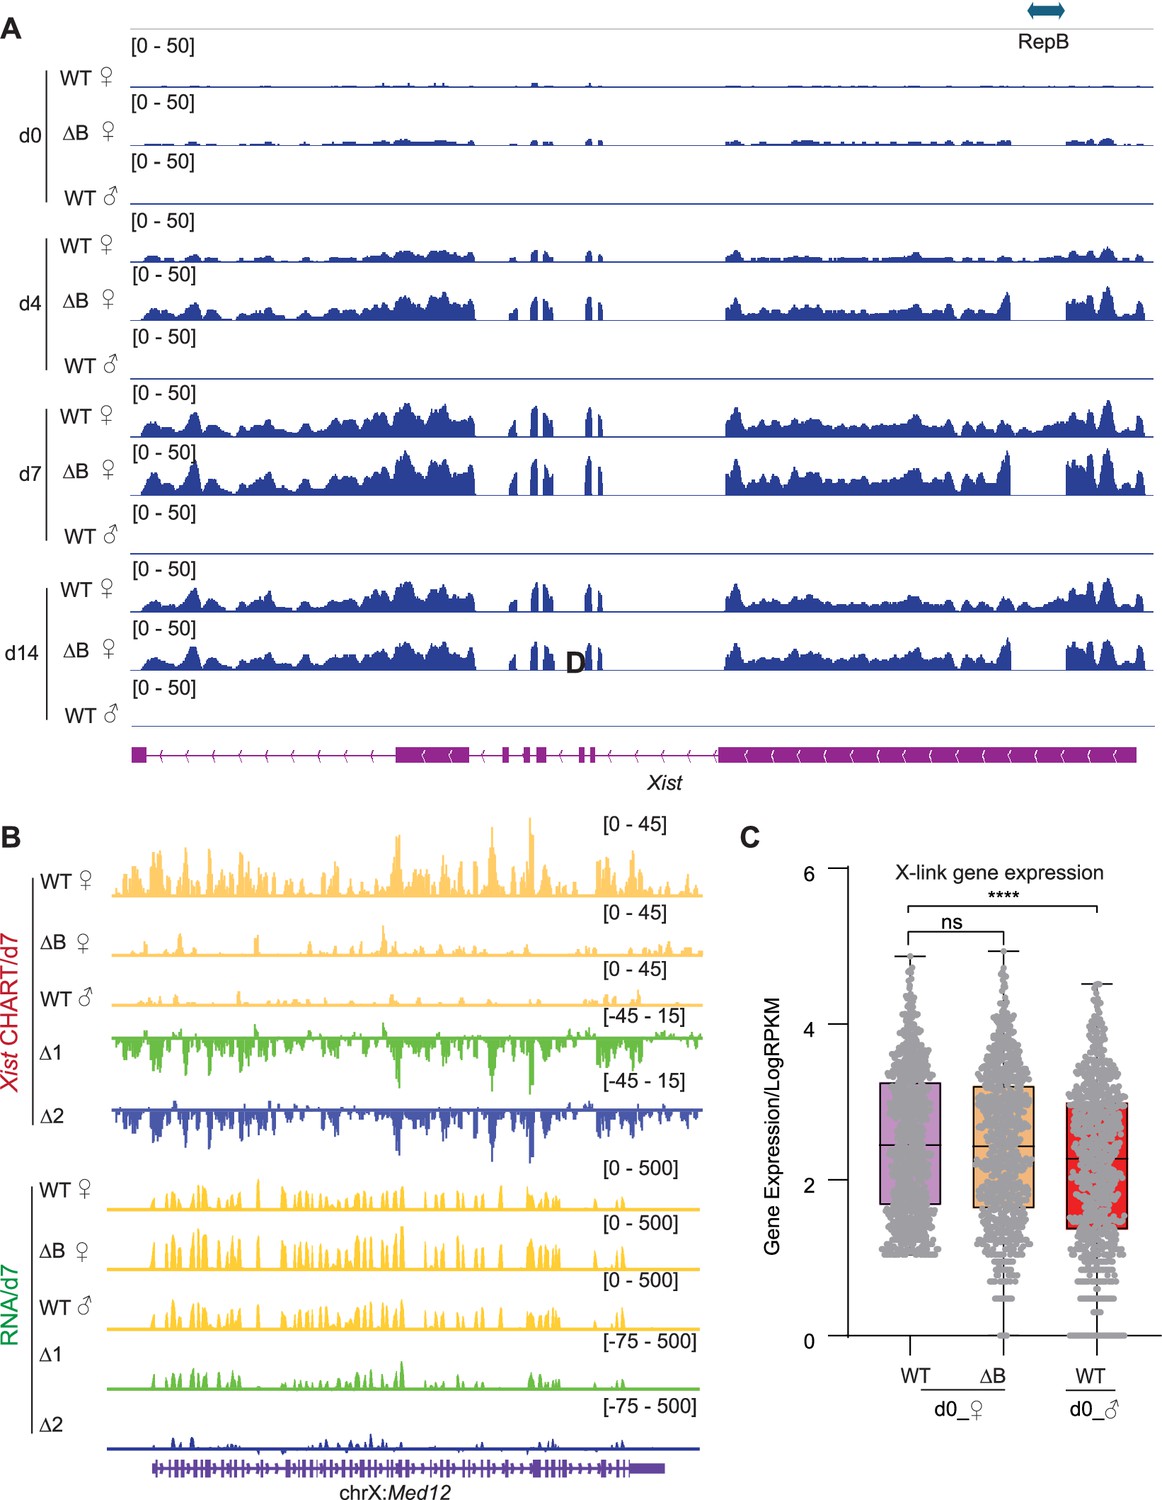
(A) RNA-seq track patterns of Xist in wild-type (WT), ΔRepB female, and male embryonic stem (ES) cells at day 0, day 4, day 7, and day 14. (B) Exemplifying CHART-seq and RNA-seq patterns of an X-linked gene (Med12) at day 7. Change in coverage (Δ1 and Δ2) is shown below (Δ1 for ΔRepB♀ -WT♀, and Δ2 for WT♂ -WT♀). (C) Evaluation of gene expression levels for X-linked genes in WT and ΔRepB female, and male ES cells at day 0. p-values are determined using the Wilcoxon rank sum test.
Figure 3 with 3 supplements
Autosomal target genes are actively transcribed.
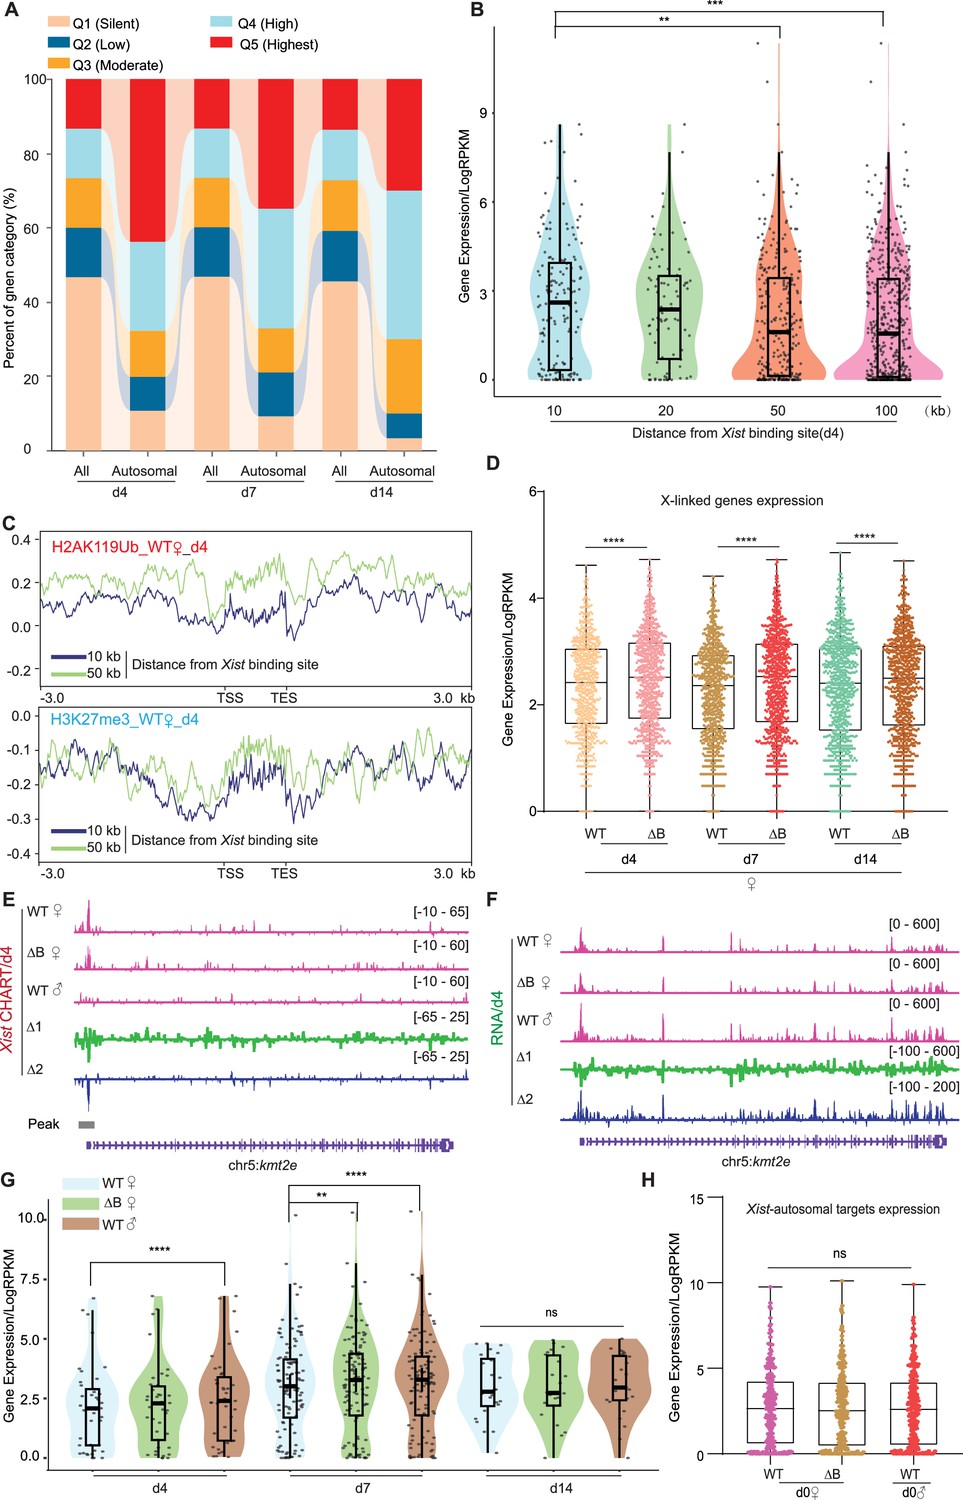
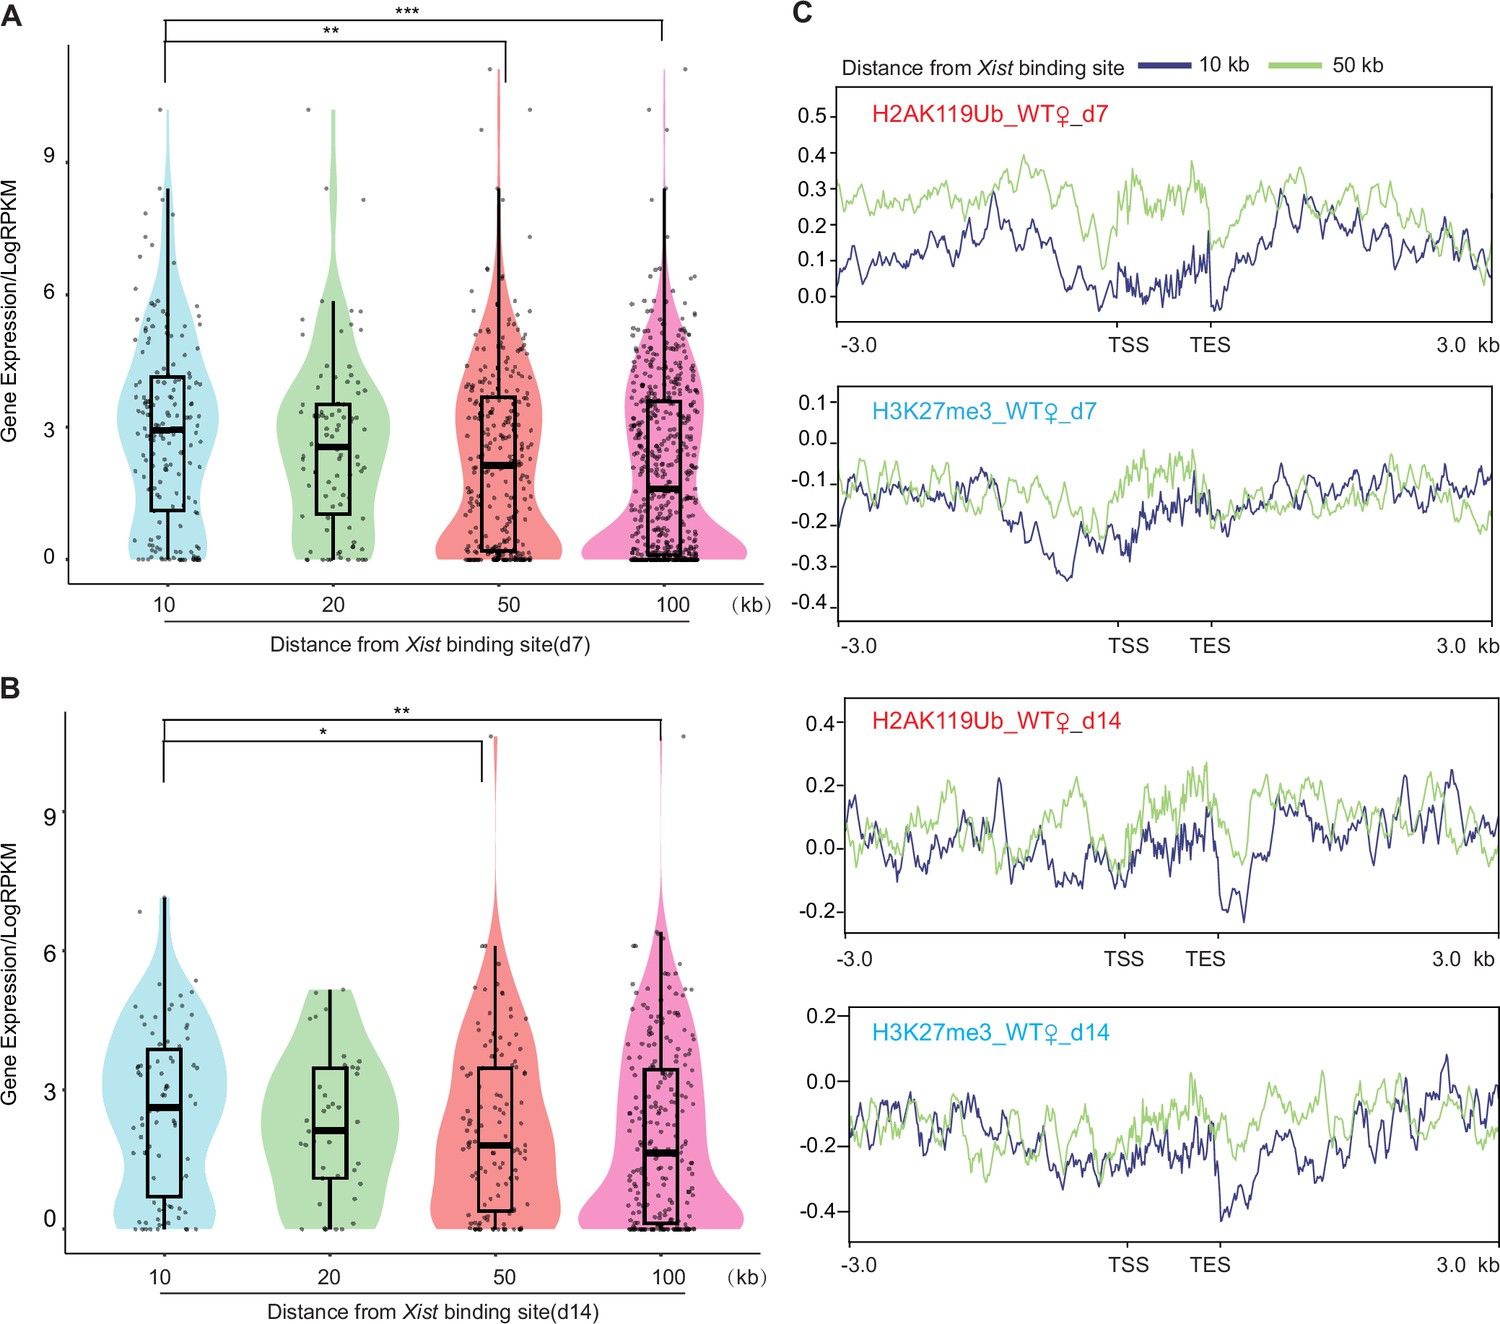
(A) Xist preferentially targets actively expressed genes. The proportion of overall genes (labeled as ‘All’) and Xist targets on autosomes expression levels (labeled as ‘Autosomal’) in different expression categories. Genes are classified into distinct categories (Q1–Q5) based on Reads Per Kilobase Million (RPKM) values, representing various levels of expression. Category Q1 includes non-expressed genes (RPKM = 0), while categories Q2, Q3, Q4, and Q5 represent 25%, 50%, 75%, and 100% expression, respectively. (B) Genes bound by Xist exhibit elevated expression levels compared to surrounding regions. The analysis of gene expression within the 10, 20, 50, and 100-kilobase binding regions of Xist is conducted in wild-type (WT) female embryonic stem (ES) cells at day 4. p-values are determined using the Wilcoxon rank sum test. (C) The H2AK119ub and H3K27me3 (ChIP-Seq) average profile of genes within the 10 and 50-kilobase binding regions of Xist in WT female cells at day 4. (D) Evaluation of gene expression levels for X chromosome inactivation (XCI) genes in WT and ΔRepB female ES cells at day 4, day 7, and day 14. P-values are determined using the Wilcoxon rank sum test. (E–F) Representative capture hybridization analysis of RNA targets (CHART)-seq (F) and RNA-Seq (G) patterns of an autosomal gene bound by Xist (Kmt2e) at day 4. Change in coverage (Δ1 and Δ2) is shown below (Δ1 for ΔRepB♀ -WT♀, and Δ2 for WT♂ -WT♀). (G) Assessing gene expression levels of Xist targets on autosomes (10 kb within the peak region) in WT, ΔRepB female ES cells, and male ES cells at different time points. p-values are determined using the Wilcoxon rank sum test. (H) Gene expression levels for Xist targets on autosomes (identified in day 4 and day 7) in undifferentiated WT, ΔRepB, female and male ES cells (day 0) show no obvious changes. Two biological replicates were used. p-values are determined using the Wilcoxon rank sum test.
Figure 3—figure supplement 1
Genes bound by Xist exhibit higher expression levels and lower H3K27me3 and H2AK119ub binding levels.
(A–B) The analysis of gene expression within the 10, 20, 50, and 100-kilobase binding regions of Xist is performed in wild-type (WT) female embryonic stem (ES) cells at day 7 (B), and day 14 (C), respectively. p-values are determined using the Wilcoxon rank sum test. (C) Average profile plots showing H3K27me3 and H2AK119ub coverage over genes within the 10 and 50-kilobase binding regions of Xist in WT female ES cells.
Figure 3—figure supplement 2
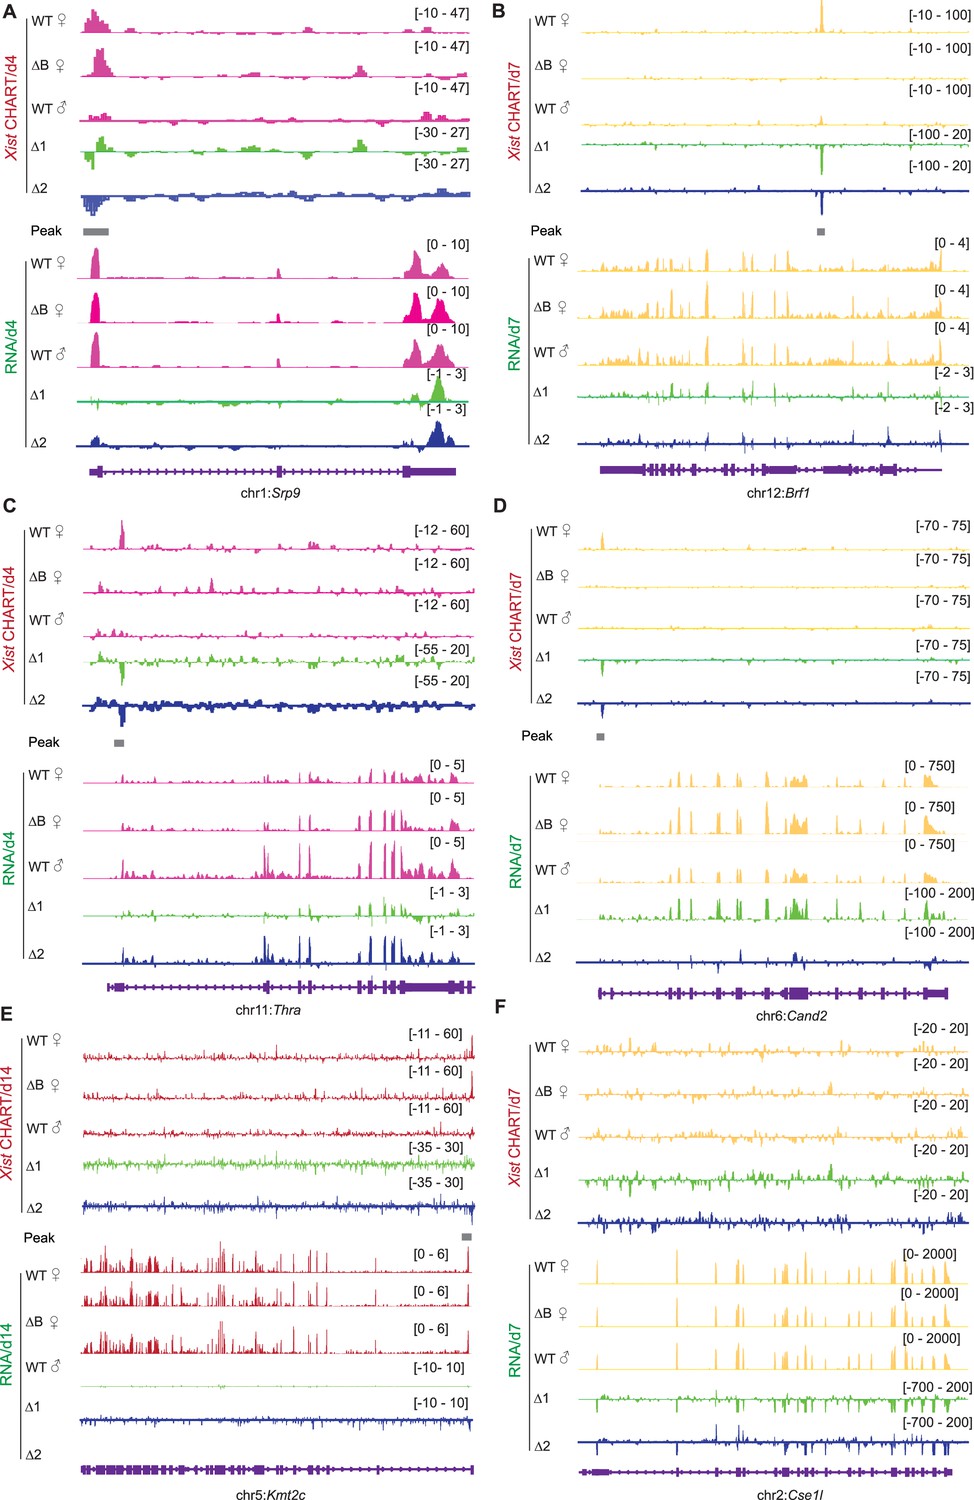
Example of Xist binding on autosomal genes and influence on gene expression.
This figure illustrates capture hybridization analysis of RNA targets (CHART)-seq and RNA-seq patterns of autosomal genes, including Srp9, Brf1, Thra, Cand2, and Kmt2c, which exhibit Xist binding on different days. Ces1l, which lacks Xist binding, is used as a control. Change in coverage (Δ1 and Δ2) is shown below (Δ1 for ΔRepB♀ -WT♀, and Δ2 for WT♂ -WT♀).
Figure 3—figure supplement 3
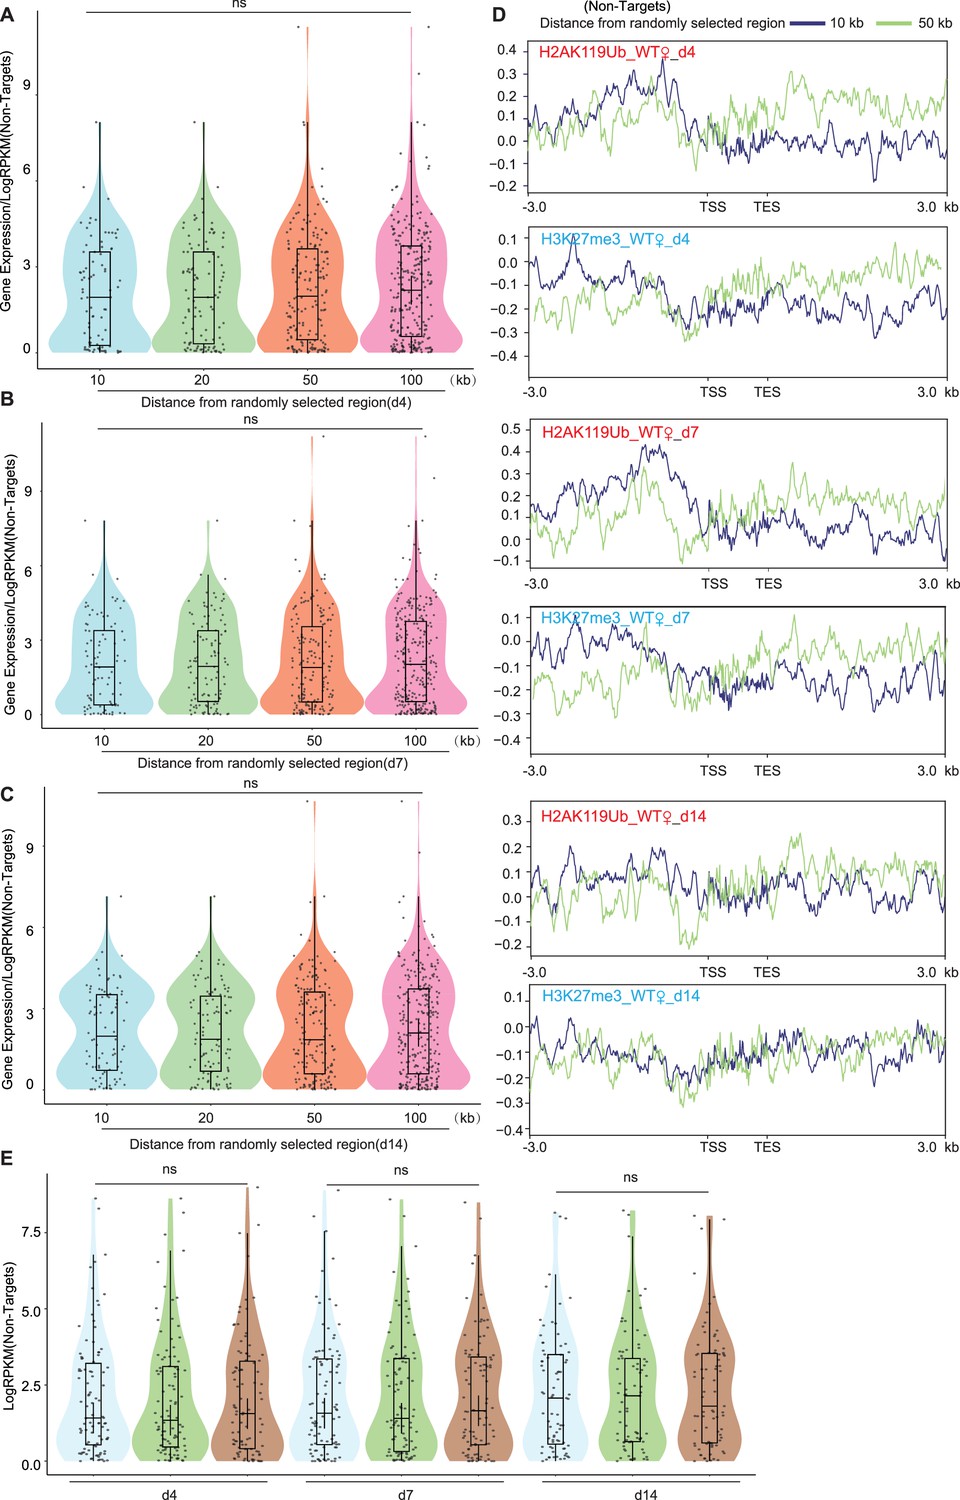
Genes not bound by Xist exhibit no changes in gene expression or differences in H3K27me3 and H2AK119ub signals.
(A–C) The analysis of gene expression within the 10, 20, 50, and 100-kilobase randomly selected regions is performed in wild-type (WT) female embryonic stem (ES) cells at day 4 (A), day 7 (B), and day 14 (C), respectively. p-values are determined using the Wilcoxon rank sum test. (D) Average profile plots showing H3K27me3 and H2AK119ub coverage over genes within the 10 and 50-kilobase randomly selected regions in WT female ES cells at different time points. (E) Assessing gene expression levels of Xist non-targets on autosomes in WT, ΔRepB female ES cells, and male ES cells at different time points. p-values are determined using the Wilcoxon rank sum test.
Figure 4 with 1 supplement
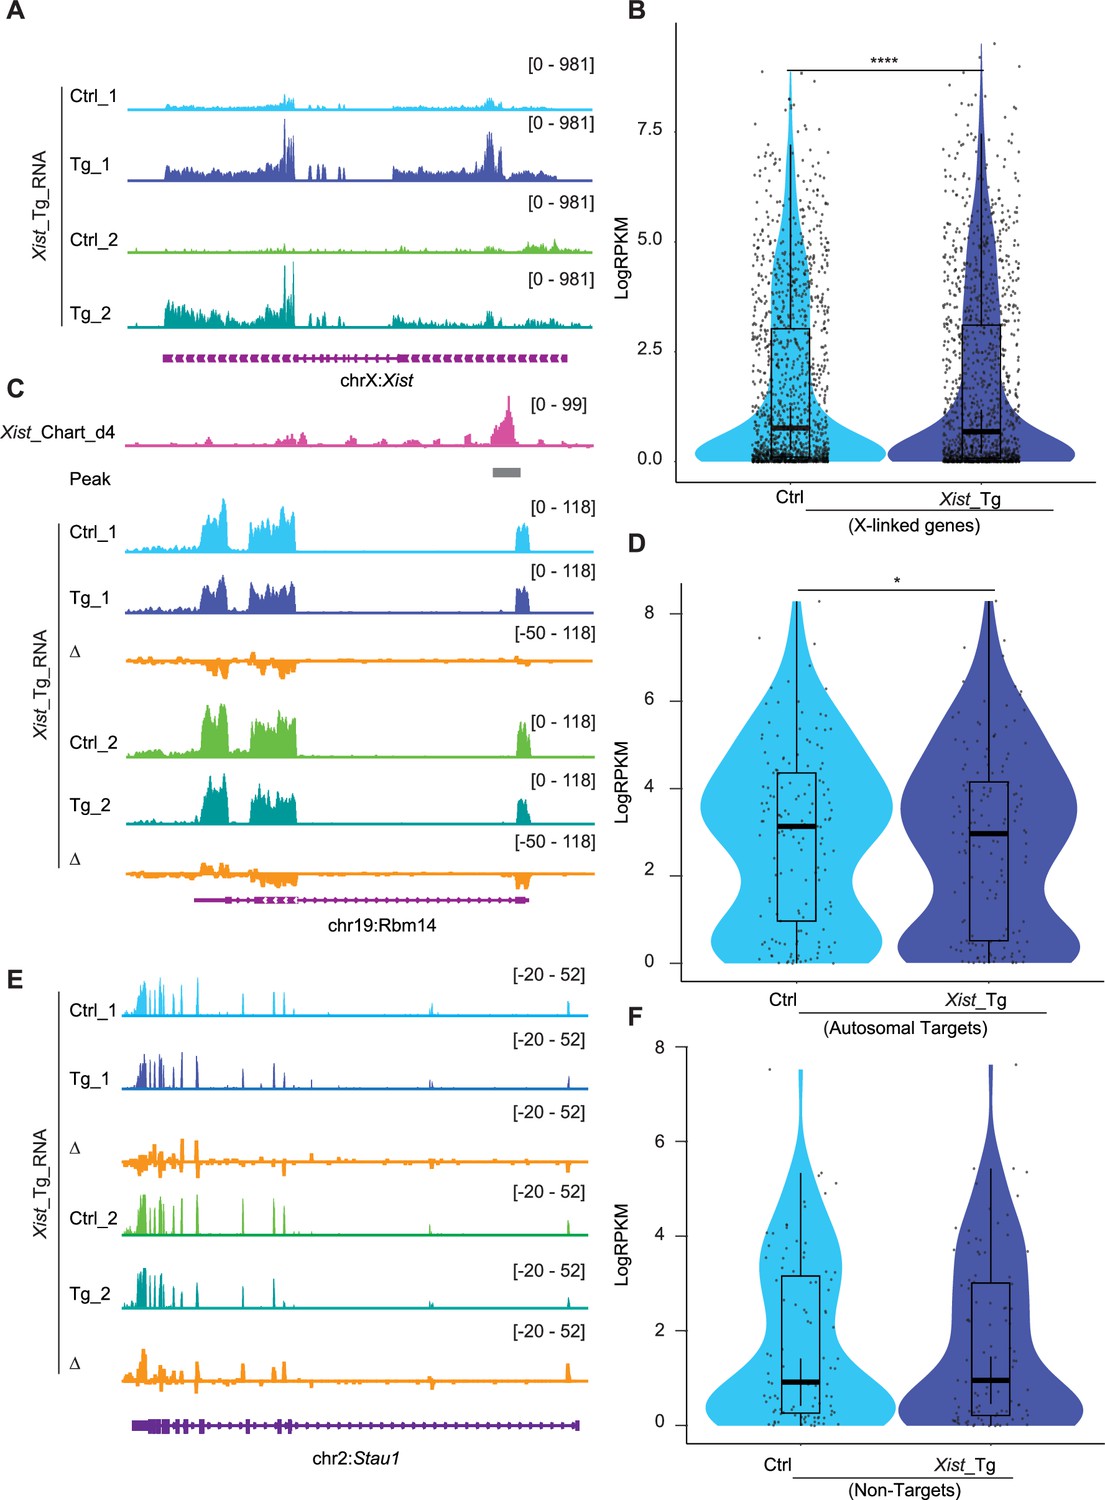
Xist binding suppresses, but does not silence, autosomal gene expression.
(A) RNA-seq track shows the Xist expression level in ectopic doxycycline-responsive Xist overexpressed embryonic stem (ES) cells (129/Sv-Cast/Ei) of neuronal differentiation (Tg-1 and Tg-2 have different insertion sites), the control (Ctrl) was doxycycline-treated wildtype cell. (B) Analysis of gene expression levels for X chromosome inactivation (XCI) genes in Xist Tg ES cells (129/Sv-Cast/Ei) at neuronal differentiation. p-values are determined using the Wilcoxon rank sum test. (C) RNA-seq track illustrating expression alongside representative autosome genes with Xist binding (Rbm14) in Xist Tg ES cells (129/Sv-Cast/Ei) of neuronal differentiation. Change in coverage (Δ) is shown below (Tg - Ctrl). (D) Analysis of gene expression levels for Xist autosomal targets in Xist Tg ES cells (129/Sv-Cast/Ei) of neuronal differentiation. p-values are determined using the Wilcoxon rank sum test. (E) RNA-seq track illustrating expression level of autosome genes without Xist binding (Stau1) in Xist Tg ES cells (129/Sv-Cast/Ei) of neuronal differentiation. Change in coverage (Δ) is shown below (Tg - Ctrl). (F) Analysis of gene expression levels for Xist non-targets on autosomes in Xist Tg ES cells (129/Sv-Cast/Ei) of neuronal differentiation. p-values are determined using the Wilcoxon rank sum test.
Figure 4—figure supplement 1
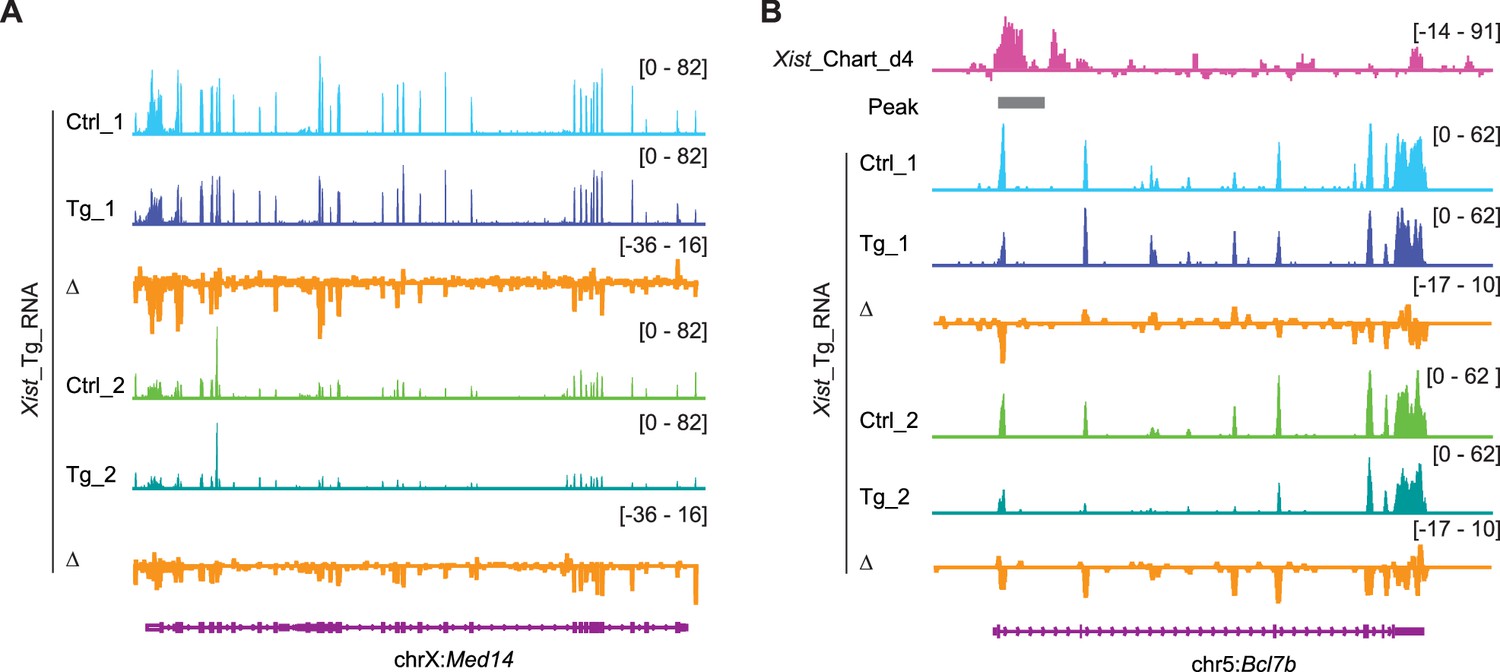
Xist overexpression inhibits select autosomal genes and X-linked genes.
RNA-seq track shows the Med14 (X-linked gene) (A) and Bcl7b (an Xist autosomal target gene) (B) expression levels in differentiated ectopic Xist overexpressed embryonic stem (ES) cell lines (Tg), the control (Ctrl) was doxycycline-treated wildtype cell. Change in coverage (Δ) is shown below (Tg - Ctrl).
Figure 5
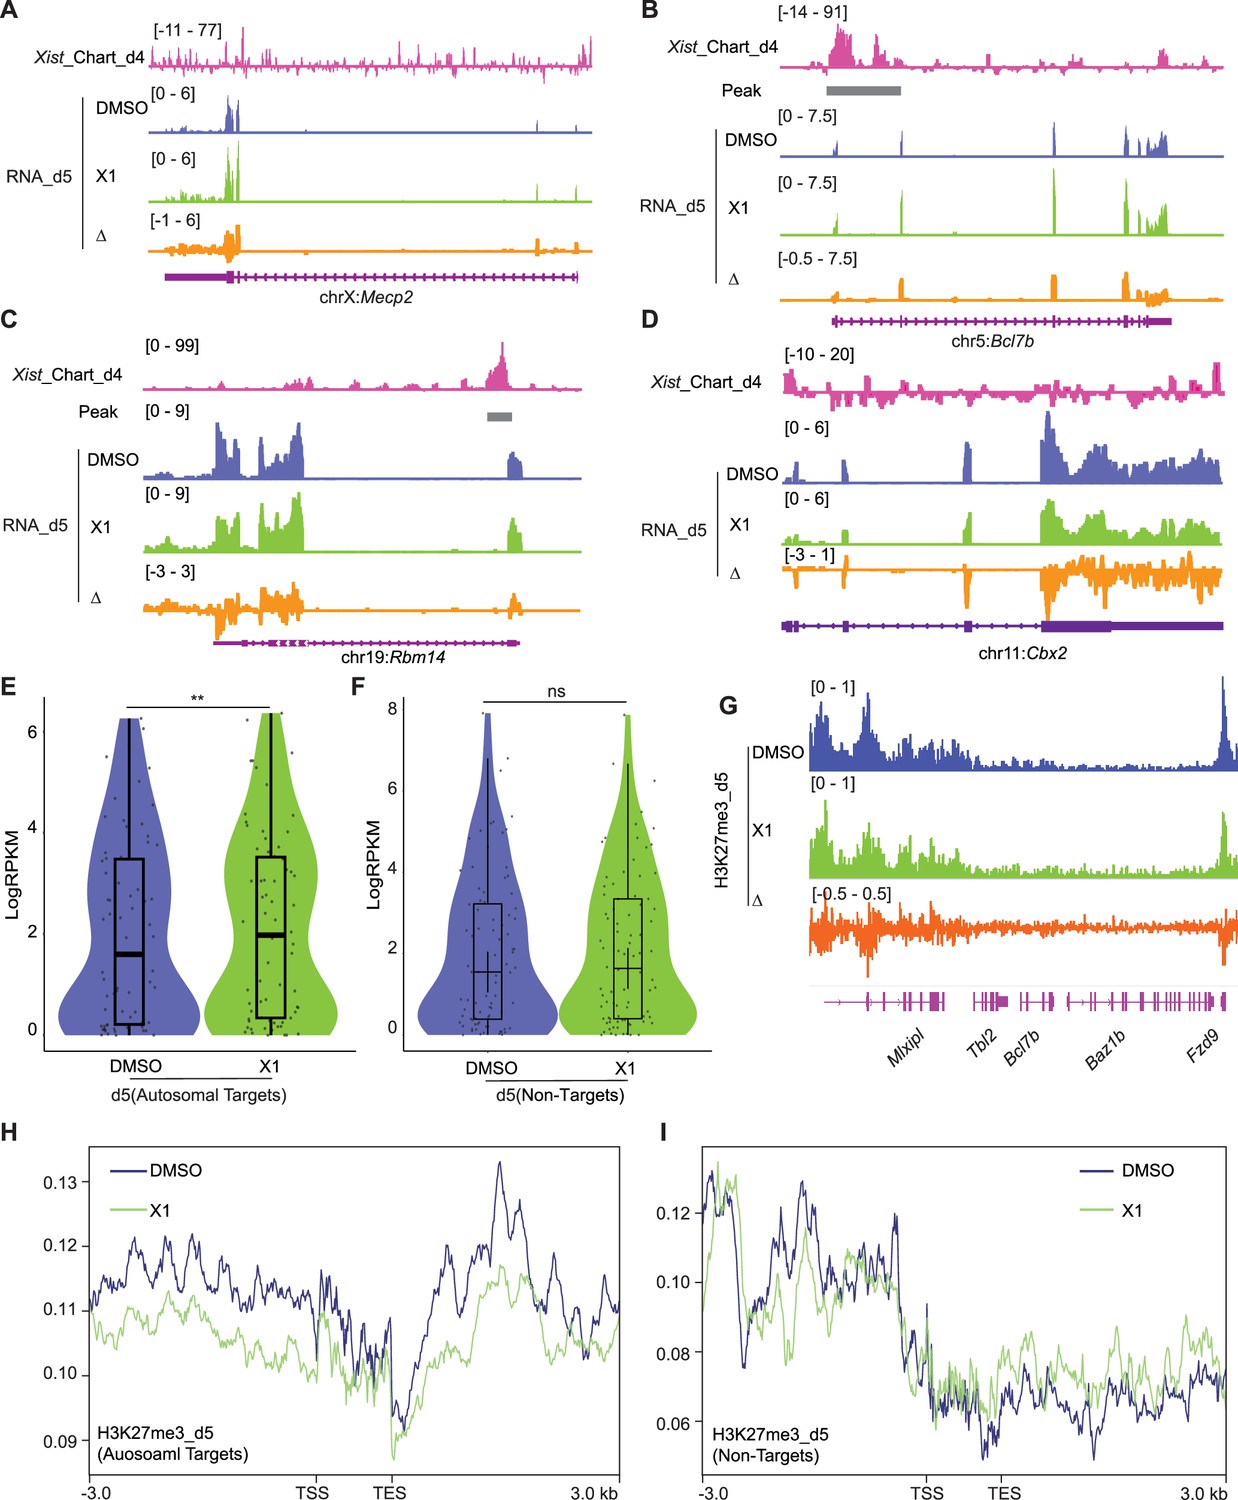
Treating cells with the X1 inhibitor of Xist RNA perturbs autosomal target genes.
(A–D) RNA-seq track depicting Mecp2 (A) (an X-linked gene), Bcl7b (B) and Rbm14 (C) (Xist-regulated autosome target), and Cbx2 (D) (autosomal gene without Xist binding) expression in DMSO (control) and Xist inhibitor (X1) treated differentiated wild-type (WT) female embryonic stem (ES) cells at day 5 of differentiation. Change in coverage (Δ) is shown below (X1 - DMSO). The Xist peak on autosomes is from capture hybridization analysis of RNA targets (CHART) at day 4. (E) Evaluation of gene expression levels for Xist autosomal targets in DMSO (control) and X1 treated WT female ES cells at day 5 of differentiation. The Xist peak on autosomes is from CHART at day 4. p-values are determined using the Wilcoxon rank sum test. (F) Evaluation of gene expression levels for Xist non-targets on autosomes in DMSO (control) and X1 treated WT female ES cells at day 5 of differentiation. p-values are determined using the Wilcoxon rank sum test. (G) ChIP-seq track for H3K27me3 on Bcl7b (an Xist autosomal target, within a 160 kb window) in DMSO (control) and X1 treated WT female ES cells at day 5 of differentiation. Change in coverage (Δ) is shown below (X1 - DMSO). (H–I) Profile plot displaying H3K27me3 levels for Xist-autosomal targets flanking genes (H) (within a 100 kb window) or Xist non-targets (I) in DMSO (control) and X1 treated WT female ES cells at day 5 of differentiation. The Xist autosomal target is from CHART at day 4.
Figure 6 with 1 supplement
Xist RNA also binds autosomal genes in post-X chromosome inactivation (XCI) mouse embryonic fibroblasts (MEF) cells.
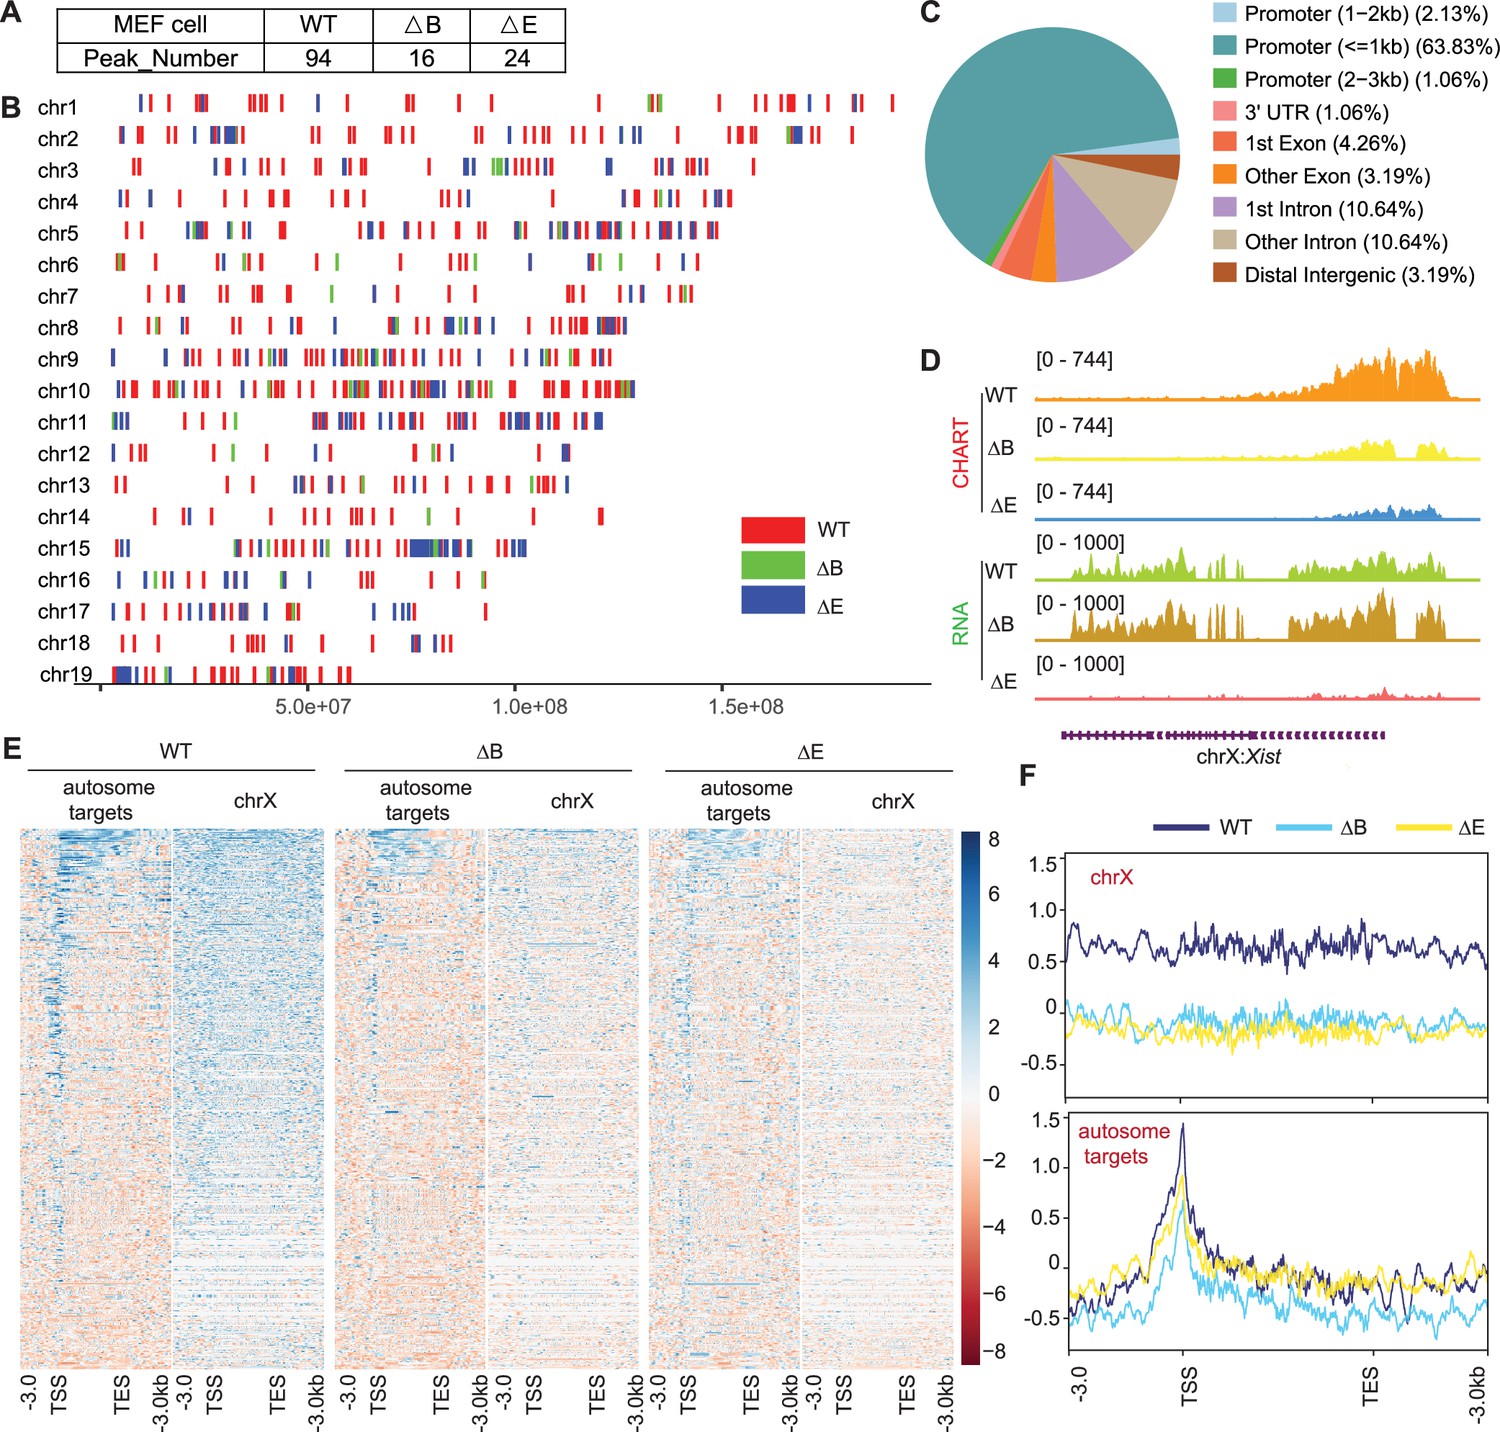
(A) Xist peak number (MACS2 peak calling) on autosomes in wild-type (WT), ΔRepB, and ΔRepE female MEF cells. (B) Xist peak patterns (MACS2 peak calling) on autosomes in WT, ΔRepB, and ΔRepE female MEF cells. (C) Feature annotation of Xist binding loci on autosomes in WT female ES cells. (D) Representative capture hybridization analysis of RNA targets (CHART)-seq and RNA-seq track patterns of Xist in WT, ΔRepB, and ΔRepE female MEF cells. (E–F) Heatmaps (E) and average profiles (F) depicting Xist coverage on autosome targets and chromosome X in WT, ΔRepB, and ΔRepE female MEF cells.
Figure 6—figure supplement 1
Xist has overlapped autosomal binding peaks in differentiated embryonic stem (ES) and mouse embryonic fibroblasts (MEF) cells.
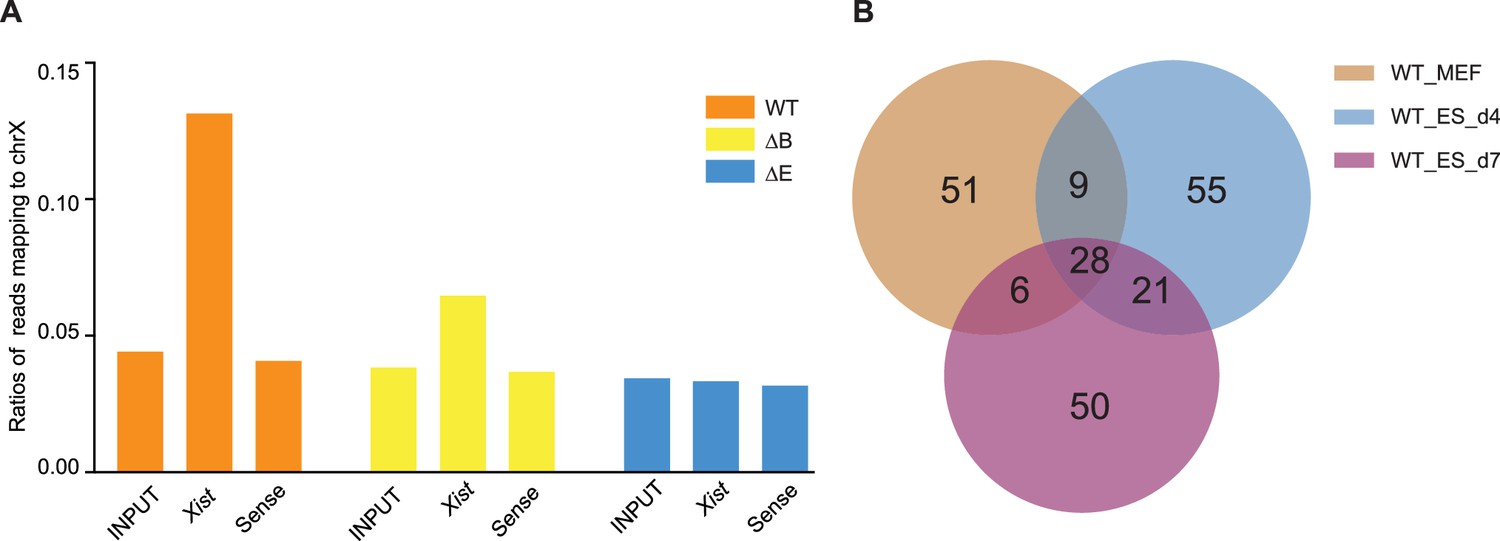
(A) Coverage of capture hybridization analysis of RNA targets (CHART)-seq reads (input, Xist, and sense control) on Chromosome X in wild-type (WT), ΔRepB, and ΔRepE female MEF cells. (B) The Venn diagram illustrates the overlap of peak sites identified in WT female ES cells at day 4, day 7, and MEF cells.
Figure 7
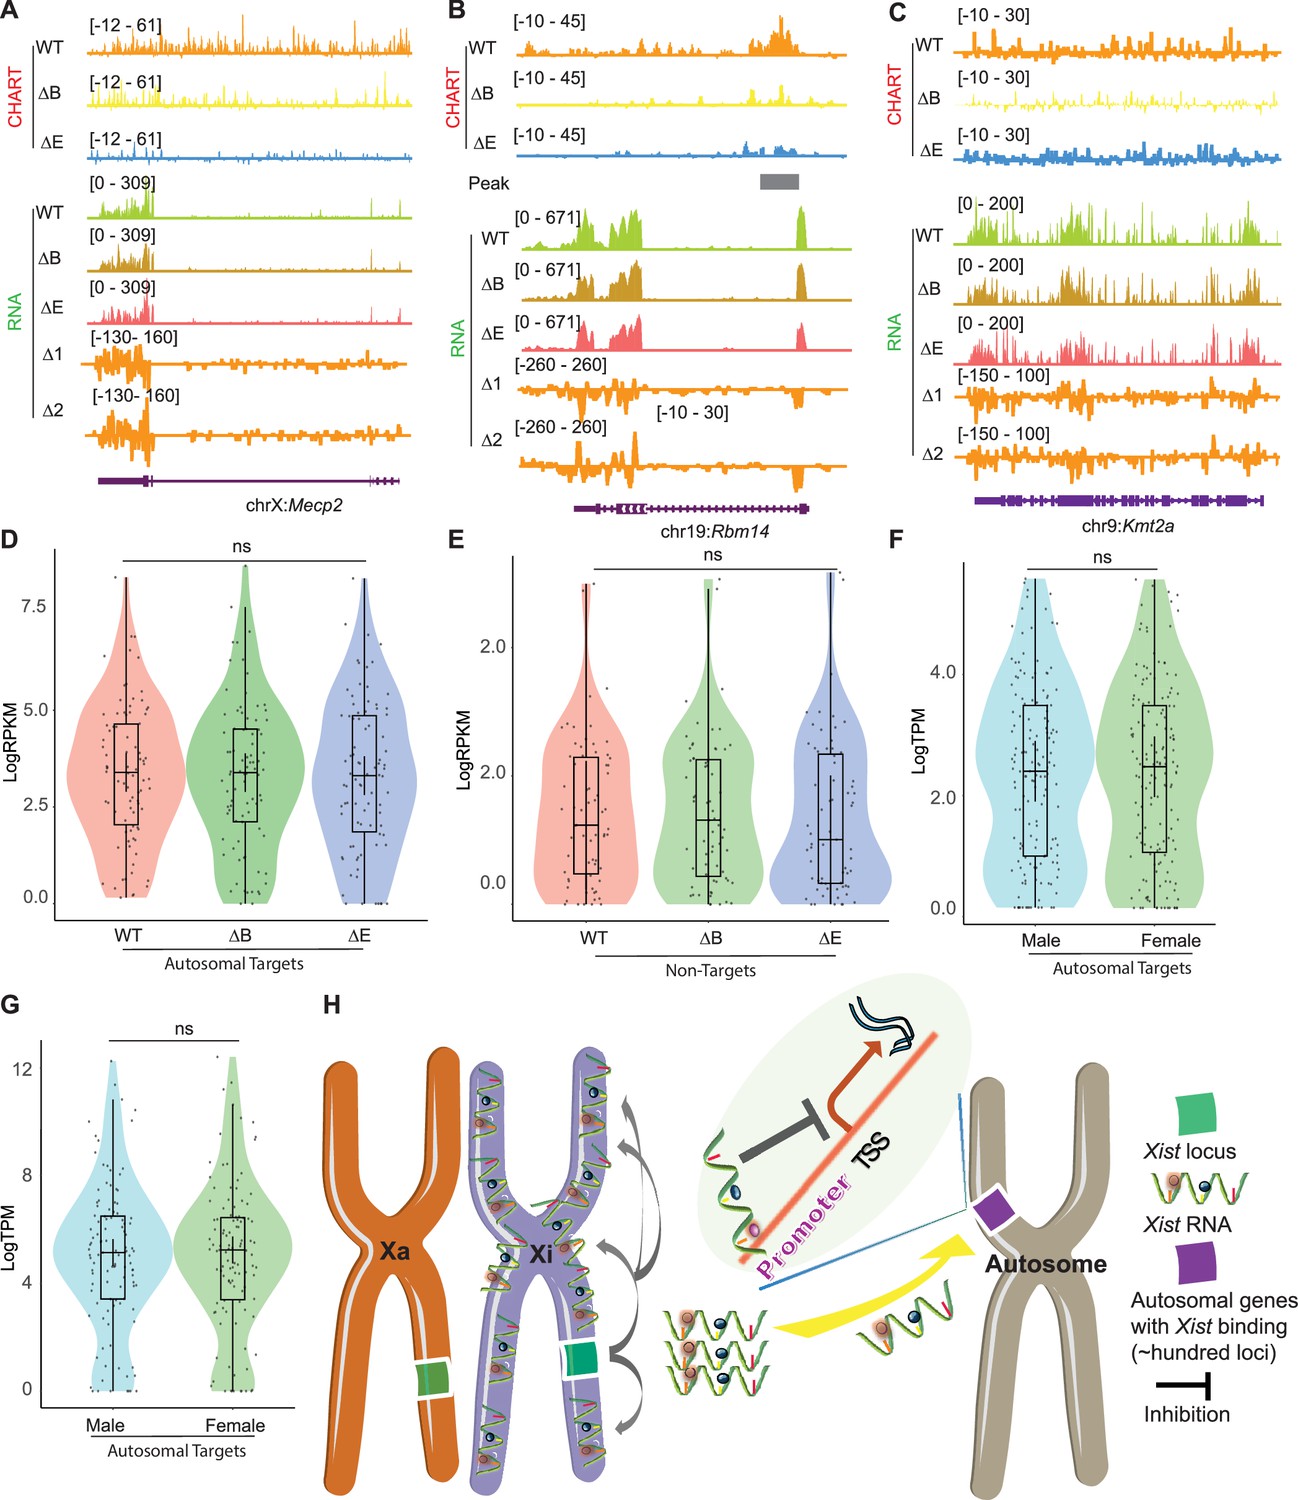
Xist autosomal binding does not alter gene expression in mouse embryonic fibroblasts (MEF) cells.
(A–C) Representative capture hybridization analysis of RNA targets (CHART)-seq and RNA-seq track patterns of Xist autosomal binding genes such as Mecp2 (A) and Rbm14 (B), and autosome genes without Xist binding such as kmt2a (C) in wild-type (WT), ΔRepB, and ΔRepE female MEF cells. Change in coverage (Δ1 and Δ2) is shown below (Δ1 for ΔRepB -WT, and Δ2 for ΔRepE -WT♀). (D–E) Gene expression levels for Xist targets (D) or non-targets (E) on autosomes in WT, ΔRepB, and ΔRepE female MEF cells show no obvious changes. p-values are determined using the Wilcoxon rank sum test. (F–G) Gene expression levels for Xist targets on autosomes in male and female MEF cells show no obvious changes. p-values are determined using the Wilcoxon rank sum test. (H) Schematic of the Xist autosome binding pattern influences the gene expression. During the differentiation process of female embryonic stem (ES) cells, the Xist is specifically expressed from the Xist loci of one X chromosome (Xi). It then binds to the Xist loci of the Xi in cis, spreading across this chromosome and effectively silencing the expression of most of its genes. Additionally, some Xist complexes will also bind to hundreds of loci on autosomes, thereby inhibiting the expression levels of target genes located there.
Tables
Key resources table
| Reagent type (species) or resource | Designation | Source or reference | Identifiers | Additional information |
|---|---|---|---|---|
| Cell line (Mus musculus) | female-wild-type MEF (M. musculus/M. castaneus F1 hybrid) | PMID:30827740 | EY.T4 | Maintained in Jeannie T Lee lab |
| Cell line (Mus musculus) | female-Xist Repeat B KO MEF (M. musculus/M. castaneus F1 hybrid) | PMID:30827740 | EY.T4-Xist RepB KO | Maintained in Jeannie T Lee lab |
| Cell line (Mus musculus) | female-Xist Repeat E KO MEF (M. musculus/M. castaneus F1 hybrid) | PMID:30827740 | EY.T4-Xist RepE KO | Maintained in Jeannie T Lee lab |
| Cell line (Mus musculus) | female-wild type ES (M. musculus/M. castaneus F2 hybrid) | PMID:18535243 | TST | Maintained in Jeannie T Lee lab |
| Cell line (Mus musculus) | female-Xist Repeat B ES (M. musculus/M. castaneus F2 hybrid) | PMID:30827740 | TST-Xist RepB KO | Maintained in Jeannie T Lee lab |
| Cell line (Mus musculus) | male-wild type ES (M. musculus/M. castaneus F2 hybrid) | PMID:30827740 | J1 | Maintained in Jeannie T Lee lab |
| Commercial assay or kit | NEBNext Ultra II DNA Library Prep Kit for Illumina | NEB | E7645S | NA |
| Commercial assay or kit | NEBNext Ultra II Directional RNA Library Prep Kit for Illumina | NEB | E7760S | NA |
| Commercial assay or kit | NEBNext rRNA Depletion Kit | NEB | E7400L | NA |
| Software, algorithm | trim_galore/cutadapt | https://www.bioinformatics.babraham.ac.uk/projects/trim_galore/ | 0.4.3/1.7.1; RRID:SCR_011847 | NA |
| Software, algorithm | Subread | https://subread.sourceforge.net/ | 2.0.2; RRID:SCR_009803 | RNA-seq counting |
| Software, algorithm | NovoAlign | https://www.novocraft.com/products/novoalign/ | 4.03; RRID:SCR_014818 | CHART/ChIP-seq reads alignment |
| Software, algorithm | Deeptools | https://deeptools.readthedocs.io/en/latest/ | 3.1.2; RRID:SCR_016366 | NA |
| Software, algorithm | MACS2 | https://github.com/macs3-project/MACS | 2.1; RRID:SCR_013291 | NA |
| Software, algorithm | Bedtools | https://bedtools.readthedocs.io/en/latest/ | 2.3; RRID:SCR_006646 | NA |
| Software, algorithm | STAR | https://github.com/alexdobin/STAR | 2.7.10 a; RRID:SCR_004463 | RNA-seq reads alignment |
Additional files
-
Supplementary file 1
Xist binding peaks on autosomal regions (MACS2 peak calling) information at day 4 in WT female mouse ES cells.
- https://cdn.elifesciences.org/articles/101197/elife-101197-supp1-v1.xlsx
-
Supplementary file 2
Xist binding peaks on autosomal regions (MACS2 peak calling) information at day 7 in WT female mouse ES cells.
- https://cdn.elifesciences.org/articles/101197/elife-101197-supp2-v1.xlsx
-
Supplementary file 3
Xist binding peaks on autosomal regions (MACS2 peak calling) information at day 14 in wild-type (WT) female mouse embryonic stem (ES) cells.
- https://cdn.elifesciences.org/articles/101197/elife-101197-supp3-v1.xlsx
-
Supplementary file 4
Xist target genes on autosomal regions (10 kb among the binding peak) information at day 4 in wild-type (WT) female mouse embryonic stem (ES) cells.
- https://cdn.elifesciences.org/articles/101197/elife-101197-supp4-v1.xlsx
-
Supplementary file 5
Xist target genes on autosomal regions (10 kb among the binding peak) information at day 7 in wild-type (WT) female mouse embryonic stem (ES) cells.
- https://cdn.elifesciences.org/articles/101197/elife-101197-supp5-v1.xlsx
-
Supplementary file 6
Xist target genes on autosomal regions (10 kb among the binding peak) information at day 14 in WT female mouse ES cells.
- https://cdn.elifesciences.org/articles/101197/elife-101197-supp6-v1.xlsx
-
Supplementary file 7
Xist binding peaks on autosomal regions (MACS2 peak calling) information on wild-type (WT) female mouse embryonic fibroblasts (MEFs).
- https://cdn.elifesciences.org/articles/101197/elife-101197-supp7-v1.xlsx
-
Supplementary file 8
Xist binding peaks on autosomal regions (MACS2 peak calling) information on ΔRepB female mouse embryonic fibroblasts (MEFs).
- https://cdn.elifesciences.org/articles/101197/elife-101197-supp8-v1.xlsx
-
Supplementary file 9
Xist binding peaks on autosomal regions (MACS2 peak calling) information on ΔRepE female mouse embryonic fibroblasts (MEFs).
- https://cdn.elifesciences.org/articles/101197/elife-101197-supp9-v1.xlsx
-
Supplementary file 10
Xist target genes on autosomal regions (10 kb among the binding peak) information on wild-type (WT) female mouse embryonic fibroblasts (MEFs).
- https://cdn.elifesciences.org/articles/101197/elife-101197-supp10-v1.xlsx
-
Supplementary file 11
Statistical information in this manuscript.
- https://cdn.elifesciences.org/articles/101197/elife-101197-supp11-v1.xlsx
-
MDAR checklist
- https://cdn.elifesciences.org/articles/101197/elife-101197-mdarchecklist1-v1.pdf
Download links
A two-part list of links to download the article, or parts of the article, in various formats.
Downloads (link to download the article as PDF)
Open citations (links to open the citations from this article in various online reference manager services)
Cite this article (links to download the citations from this article in formats compatible with various reference manager tools)
Xist RNA binds select autosomal genes and depends on Repeat B to regulate their expression
eLife 13:RP101197.
https://doi.org/10.7554/eLife.101197.3


