Lacticaseibacillus rhamnosus P118 enhances host tolerance to Salmonella infection by promoting microbe-derived indole metabolites
- Key Laboratory of Systems Health Science of Zhejiang Province, School of Life Science, Hangzhou Institute for Advanced Study, University of Chinese Academy of Sciences, China
- Zhejiang Institute of Freshwater Fisheries, Ministry of Agriculture and Rural Affairs Key Laboratory of Healthy Freshwater Aquaculture, Key Laboratory of Fish Health and Nutrition of Zhejiang Province, Key Laboratory of Fishery Environment and Aquatic Product Quality and Safety of Huzhou City, China
- Department of Veterinary Medicine, Zhejiang University College of Animal Sciences, China
- Ningbo Academy of Agricultural Sciences, China
- Institute of Animal Nutrition and Feed Sciences, Zhejiang University College of Animal Sciences, China
- Hainan Institute of Zhejiang University, China
Figures
Figure 1 with 2 supplements
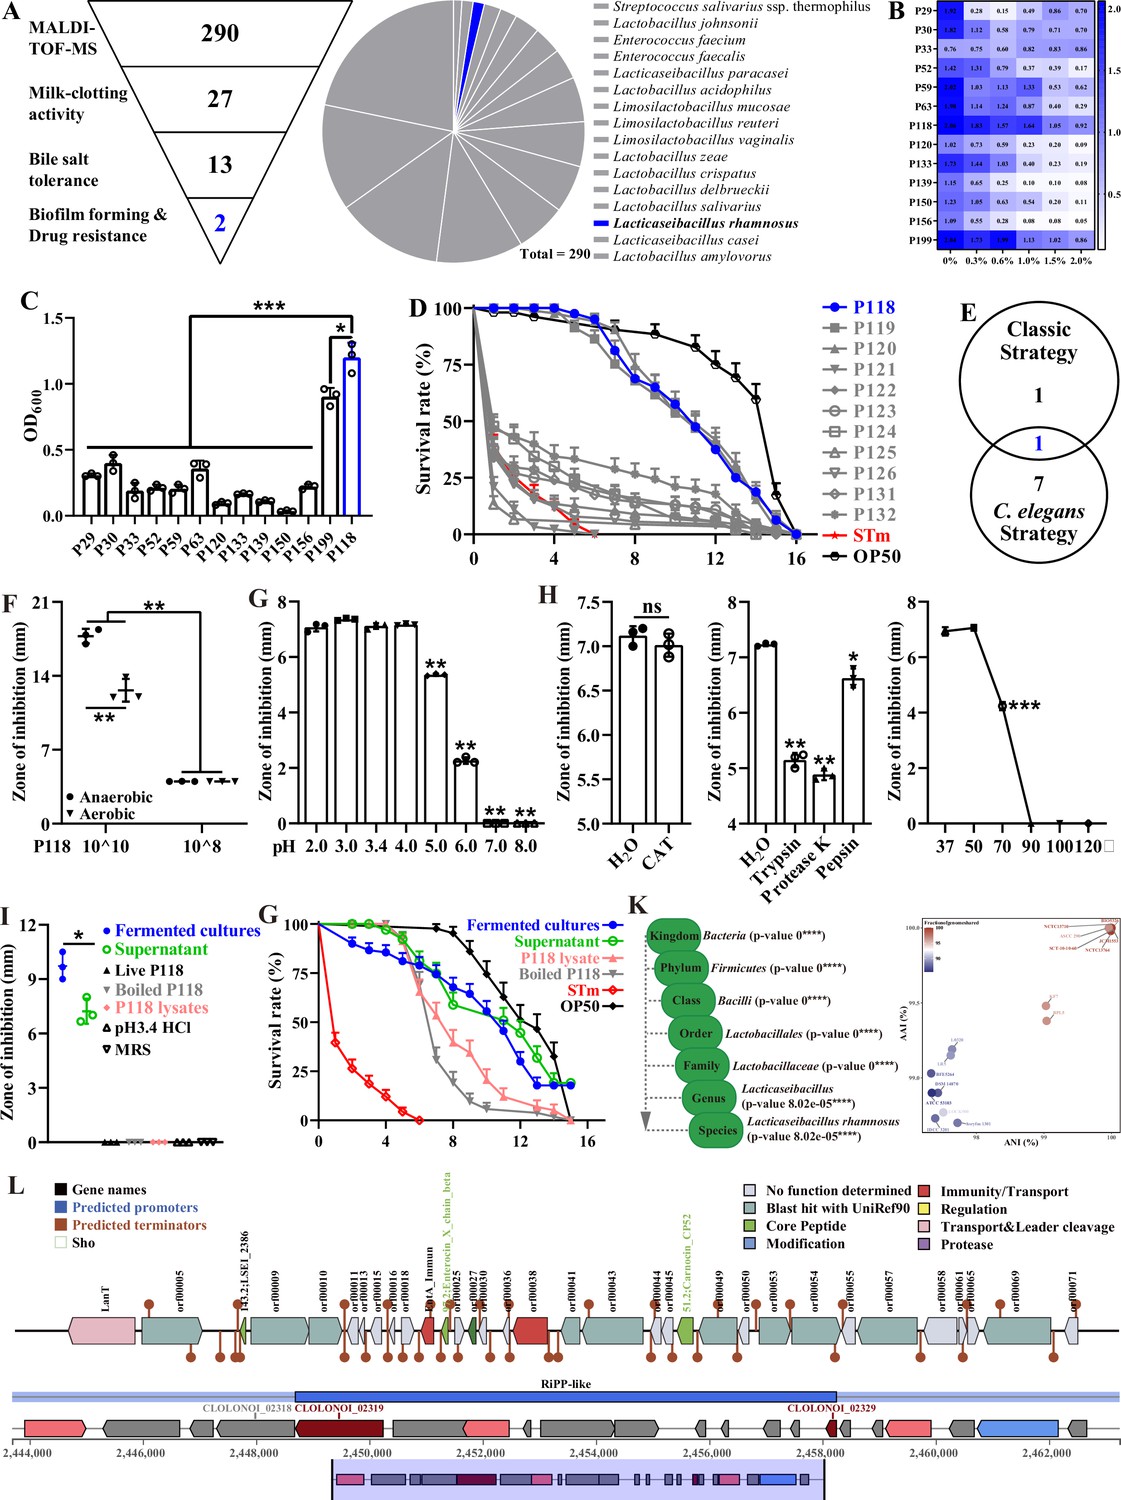
Isolation and antibacterial characterization of L. rhamnosus P118.
(A) Screening flowchart of P118 in vitro and candidate probiotic isolates identified by MALDI-TOF MS. (B) Bile salt tolerance ability of the isolates. (C) Biofilm-forming ability of isolates. (D) Screening using C. elegans infection model. (E) Interacted screening strategy. (F) Antibacterial ability of P118 under aerobic or anaerobic culture conditions. (G) Broad-spectrum pH tolerance of P118 supernatants (pH = 3.4) that adjusted to pH <3.4 by 1 M HCl or pH >3.4 by 1 M NaOH. (H) Antibacterial effects of P118 supernatant under 20 mg/mL catalase (CAT), 100 μg/mL proteinases (trypsin, proteinase K, pepsin), and different temperatures (37, 50, 70, 90, 100, 120°C) boiled for 30 min treatments. (I) Antibacterial effects of components of P118 (boiled at 120℃ for 30 min or was lysed by ultrasonication at 240 W for 2 h). (J) Active ingredients of P118 protect C. elegans against S. Typhimurium infection. (K) Taxonomic classification of P118 draft genome queried against the NCBI non-redundant prokaryotic genomes database with p-values representing confidence of phylogenetic assignment, and the nearest subspecies phylogenetic neighbor of P118 draft genome was determined by percentage shared genomic content graphed as ANI versus AAI. (L) Prediction of secondary metabolites and bacteriocin protein-encoding gene clusters of P118 using antiSMASH and BAGEL4 databases. (F–J) S. Typhimurium SL1344 was selected as an indicator pathogen. Significant differences *p<0.05, **p<0.01, ***p<0.001.
Figure 1—figure supplement 1
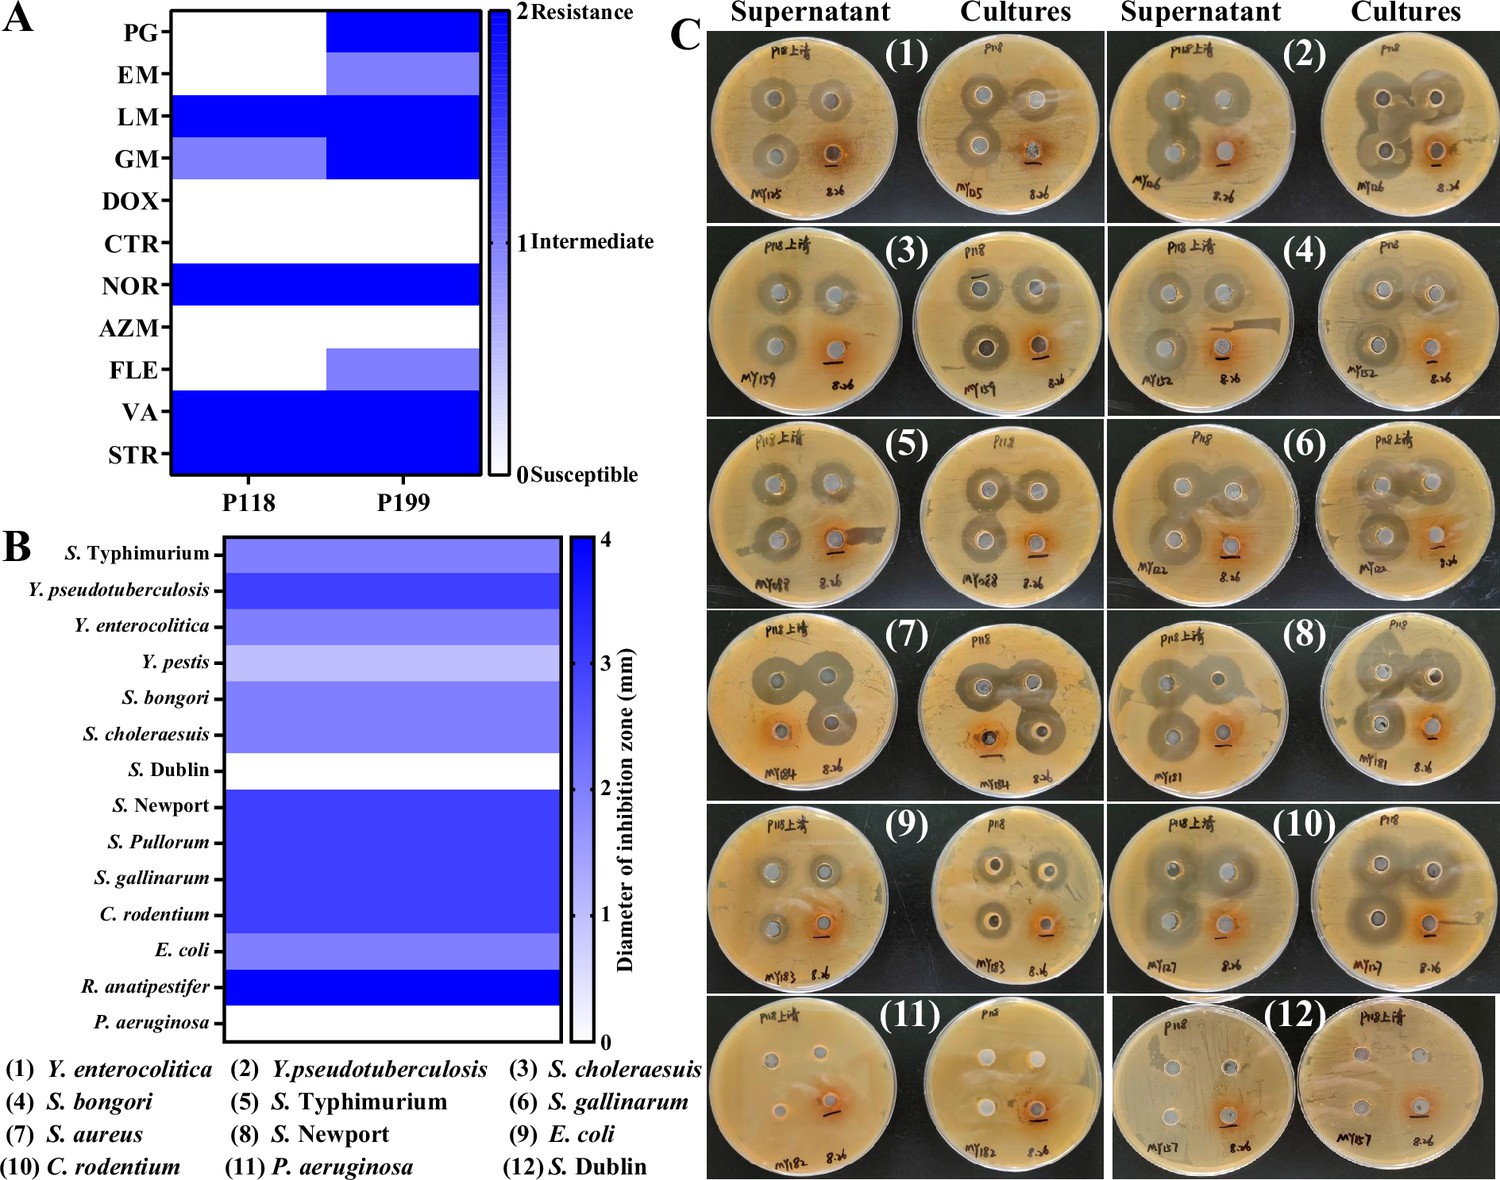
Drug resistance and antibacterial activities of Lactobacillus isolates.
(A) Drug resistance candidate probiotic isolates (P118 and P199). (B, C) Broad-spectrum antibacterial activities of P118 fermented supernatants and cultures.
Figure 1—figure supplement 2
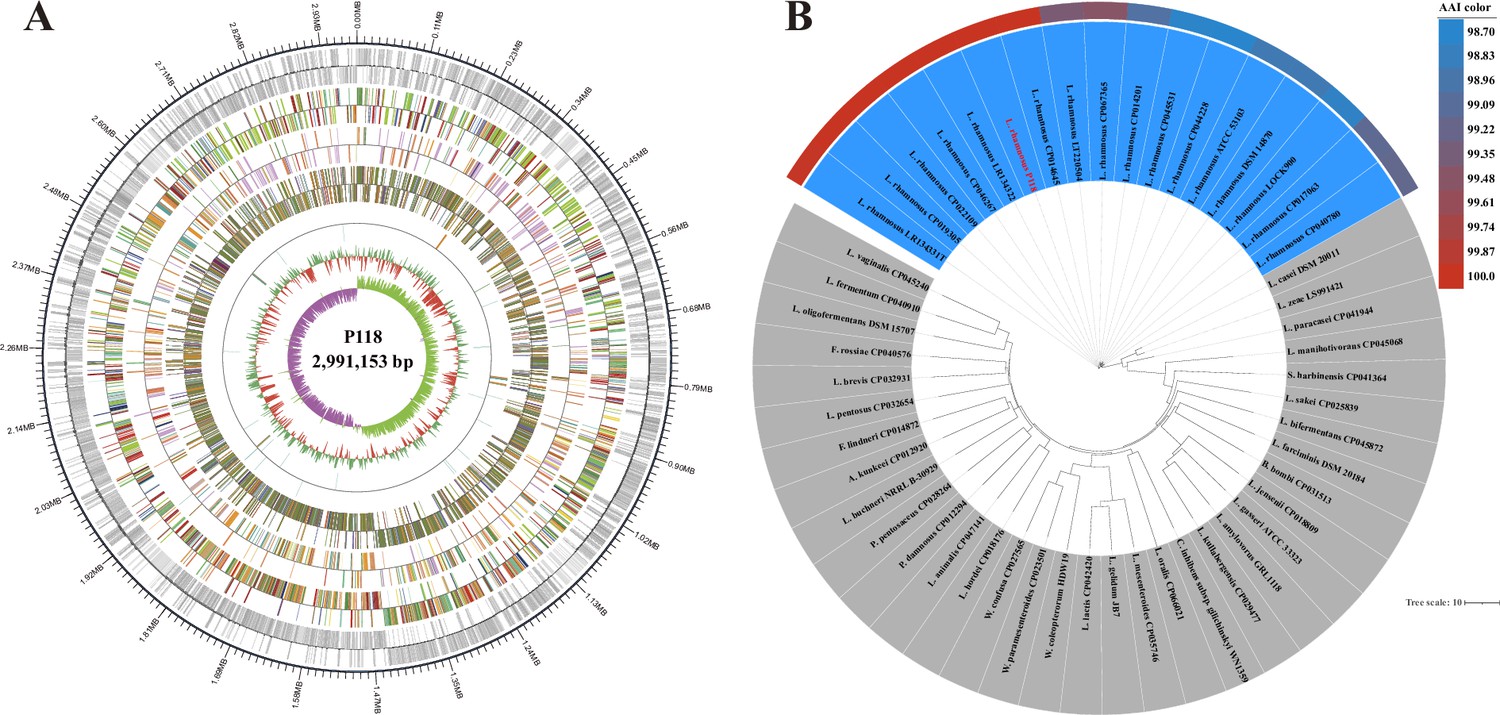
Genome map and taxonomic classification of L. rhamnosus P118.
(A) Circular genome map of L. rhamnosus P118. (B) Phylogenetic trees of L. rhamnosus P118 and nearest phylogenetic neighbors constructed by average amino acid identity (AAI). Color gradients indicate the percentage of conserved average nucleotide identity (ANI) between each isolate and respective nearest subspecies phylogenetic neighbors.
Figure 2 with 2 supplements
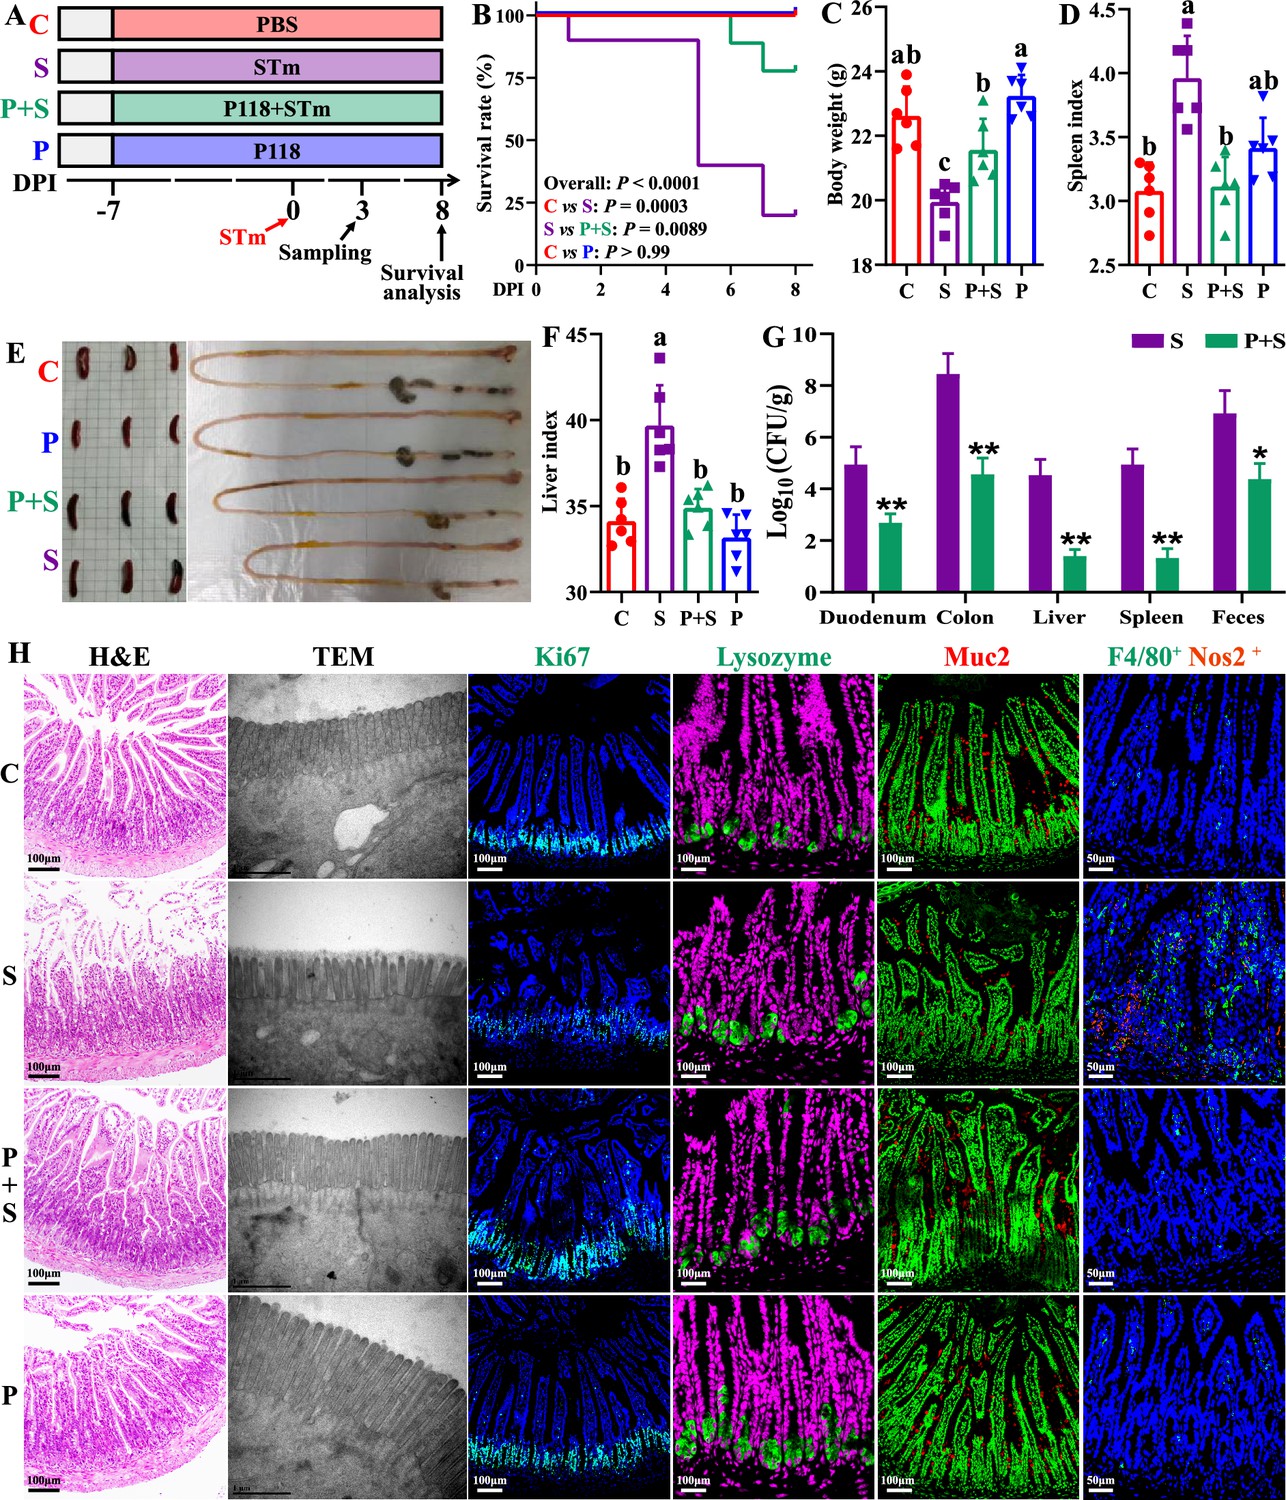
L. rhamnosus P118 enhances tolerance to S. Typhimurium infection in mice.
(A) Experimental design. (B) Survival curve of mice infected with S. Typhimurium. (C) Body weight. (D) Spleen index. (E) Representative images of spleen and intestine. (F) Liver index. (G) S. Typhimurium burden in tissues and shedding in feces. (H) Representative images of H&E staining, TEM, and immunostaining (DAPI, Ki67, lysozyme, Muc2, F4/80, Nos2) in the ileum. Different lowercase letters indicate a significant difference (p<0.05). Significant differences *p<0.05, **p<0.01. C: PBS group; P: P118 administered group; S: S. Typhimurium-infected group; P+S: P118 protective group.
Figure 2—figure supplement 1
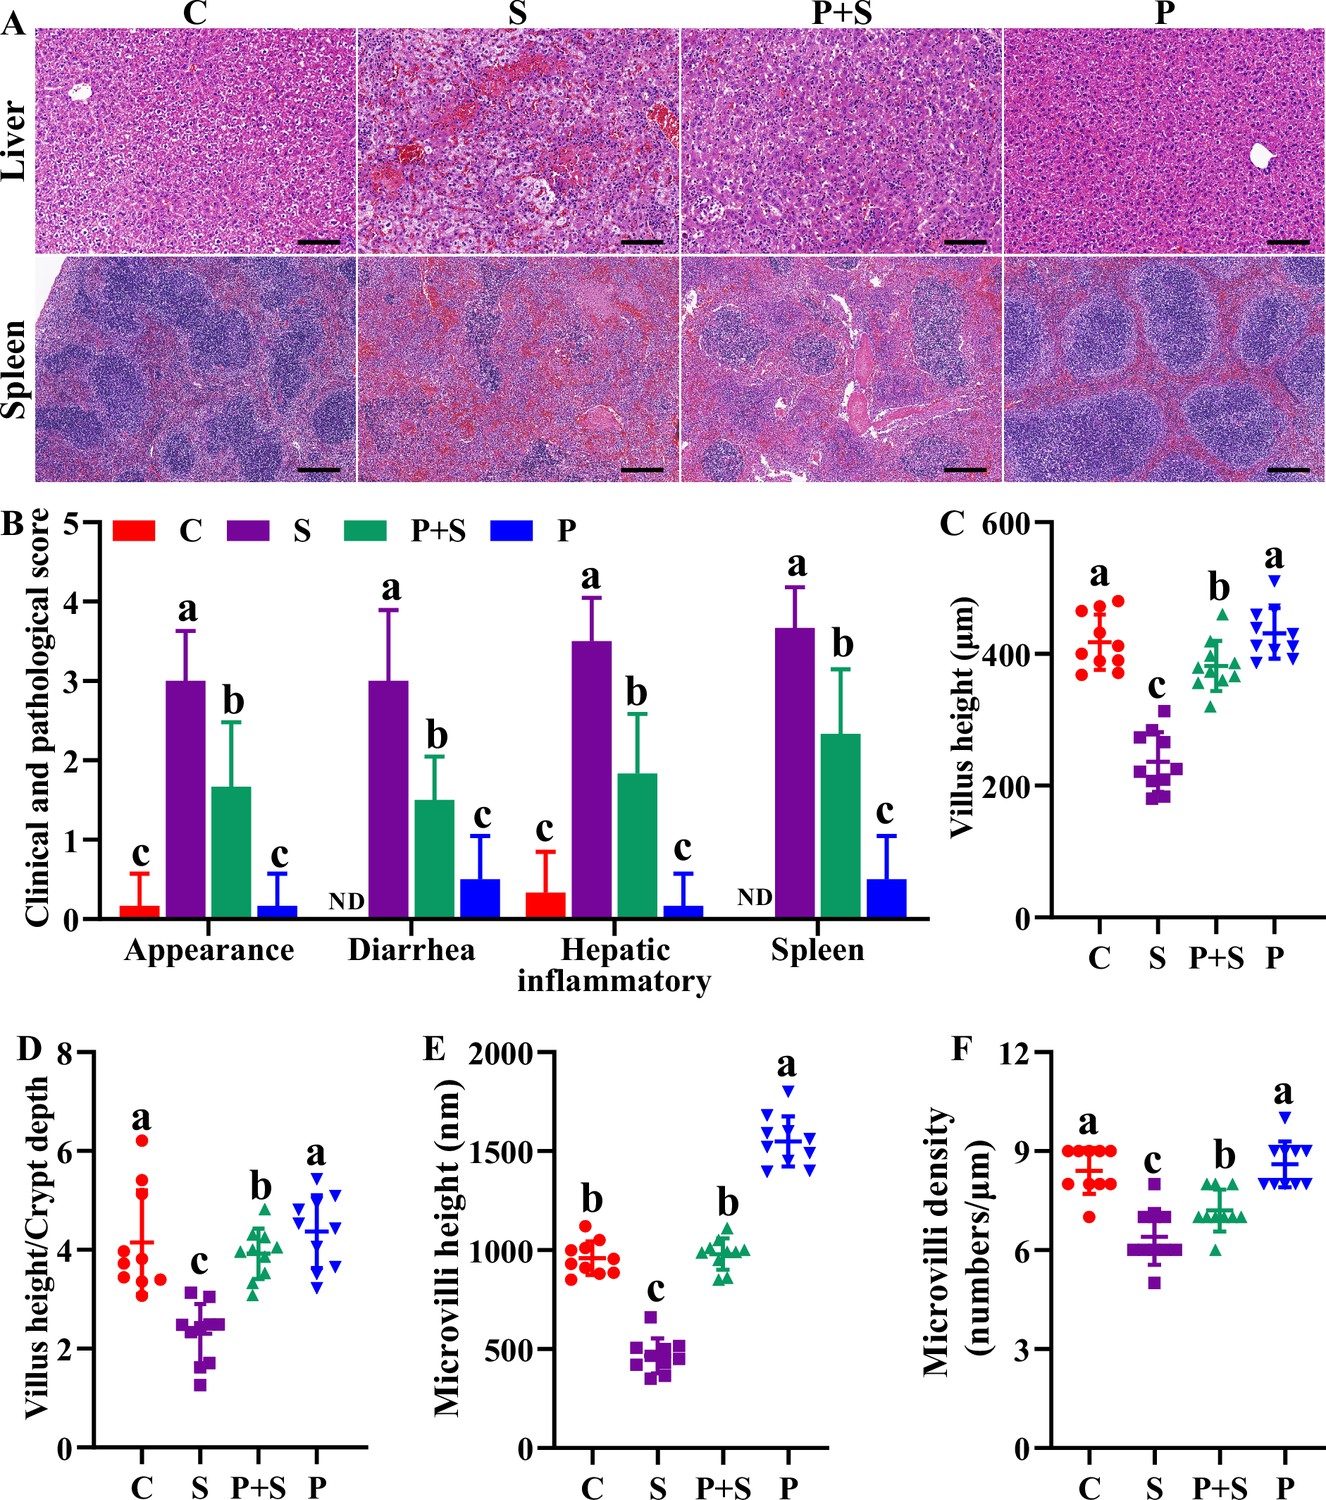
Clinical and histopathological observation.
(A) Representative images of H&E staining tissues (liver, spleen). Scale bar with 100 μm. (B) Clinical symptom score. Histopathological quantification of H&E staining (C, D) and TEM (E, F) images observed in the ileum. Different lowercase letters indicate a significant difference (p<0.05). C: PBS group; P: P118 administered group; S: S. Typhimurium-infected group; P+S: P118 protective group.
Figure 2—figure supplement 2
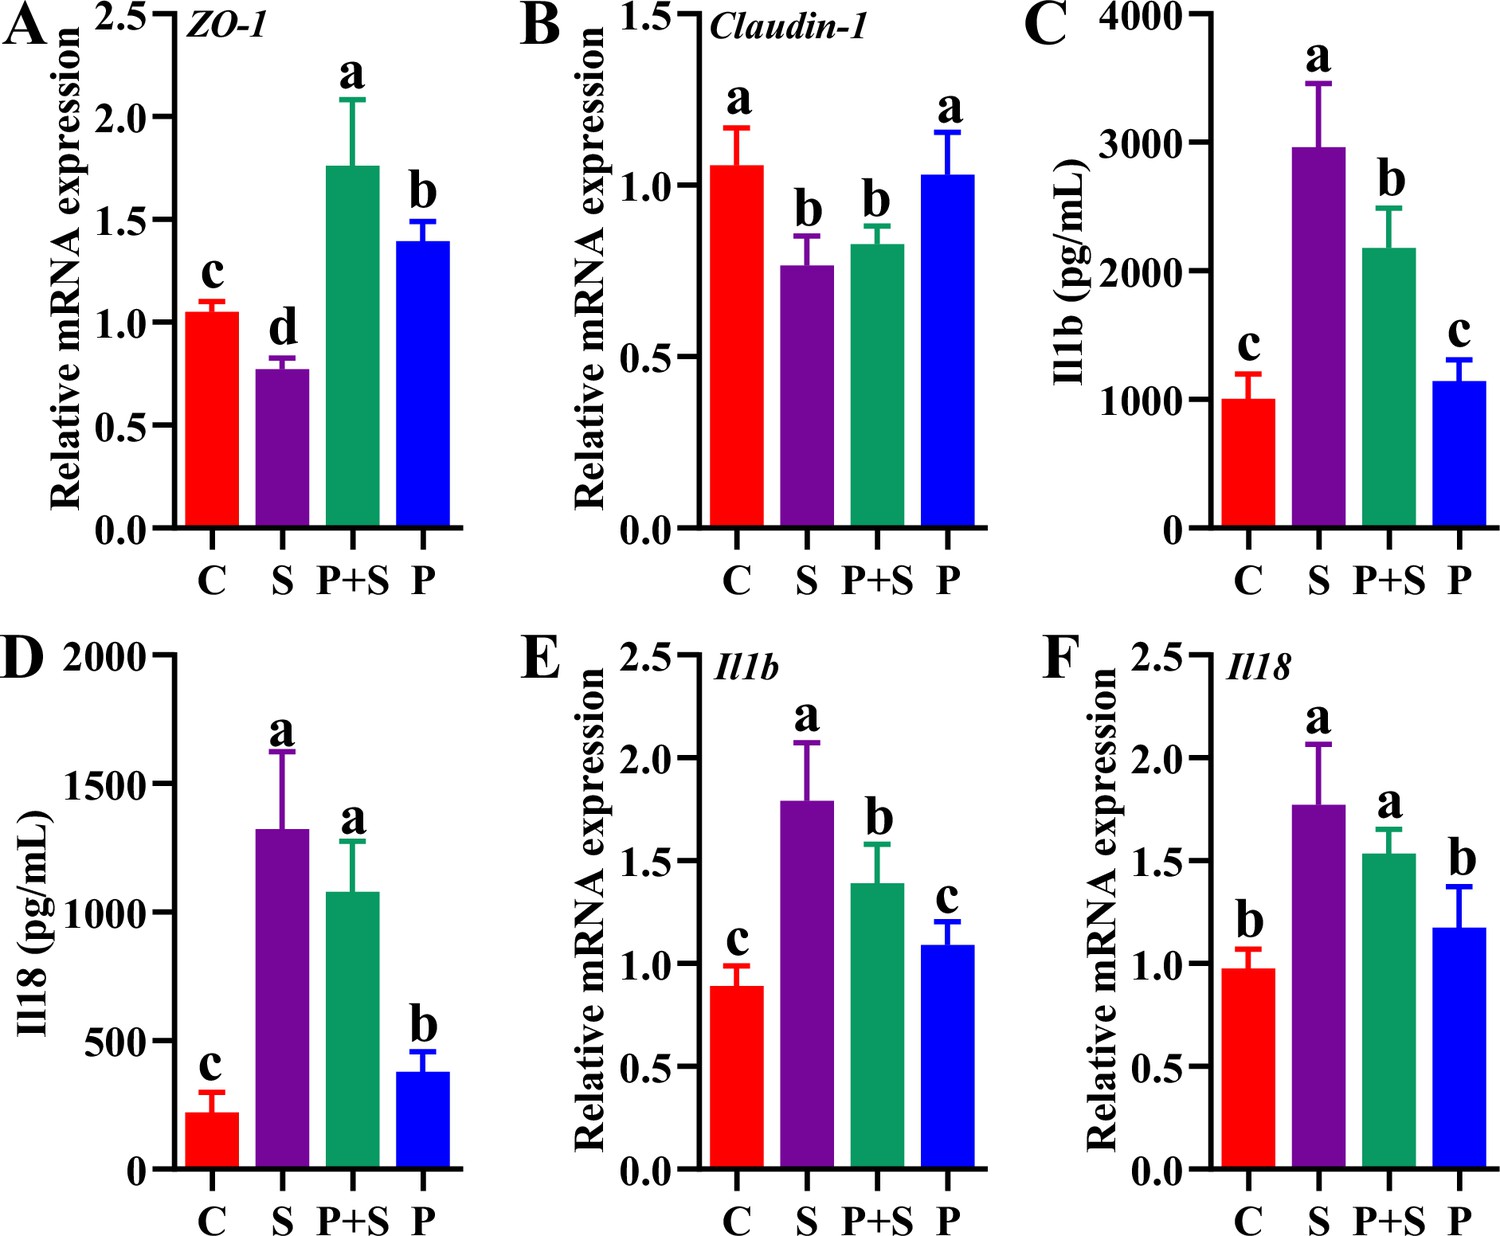
Gene (A, B, E, F) and protein (C, D) expression level of tight junction protein (Tjp1, Claudin-1) and inflammatory cytokines (Il1b, Il18) in ileum and serum of mice.
Different lowercase letters indicate a significant difference (p<0.05). C: PBS group; P: P118 administered group; S: S. Typhimurium-infected group; P+S: P118 protective group.
Figure 3 with 2 supplements
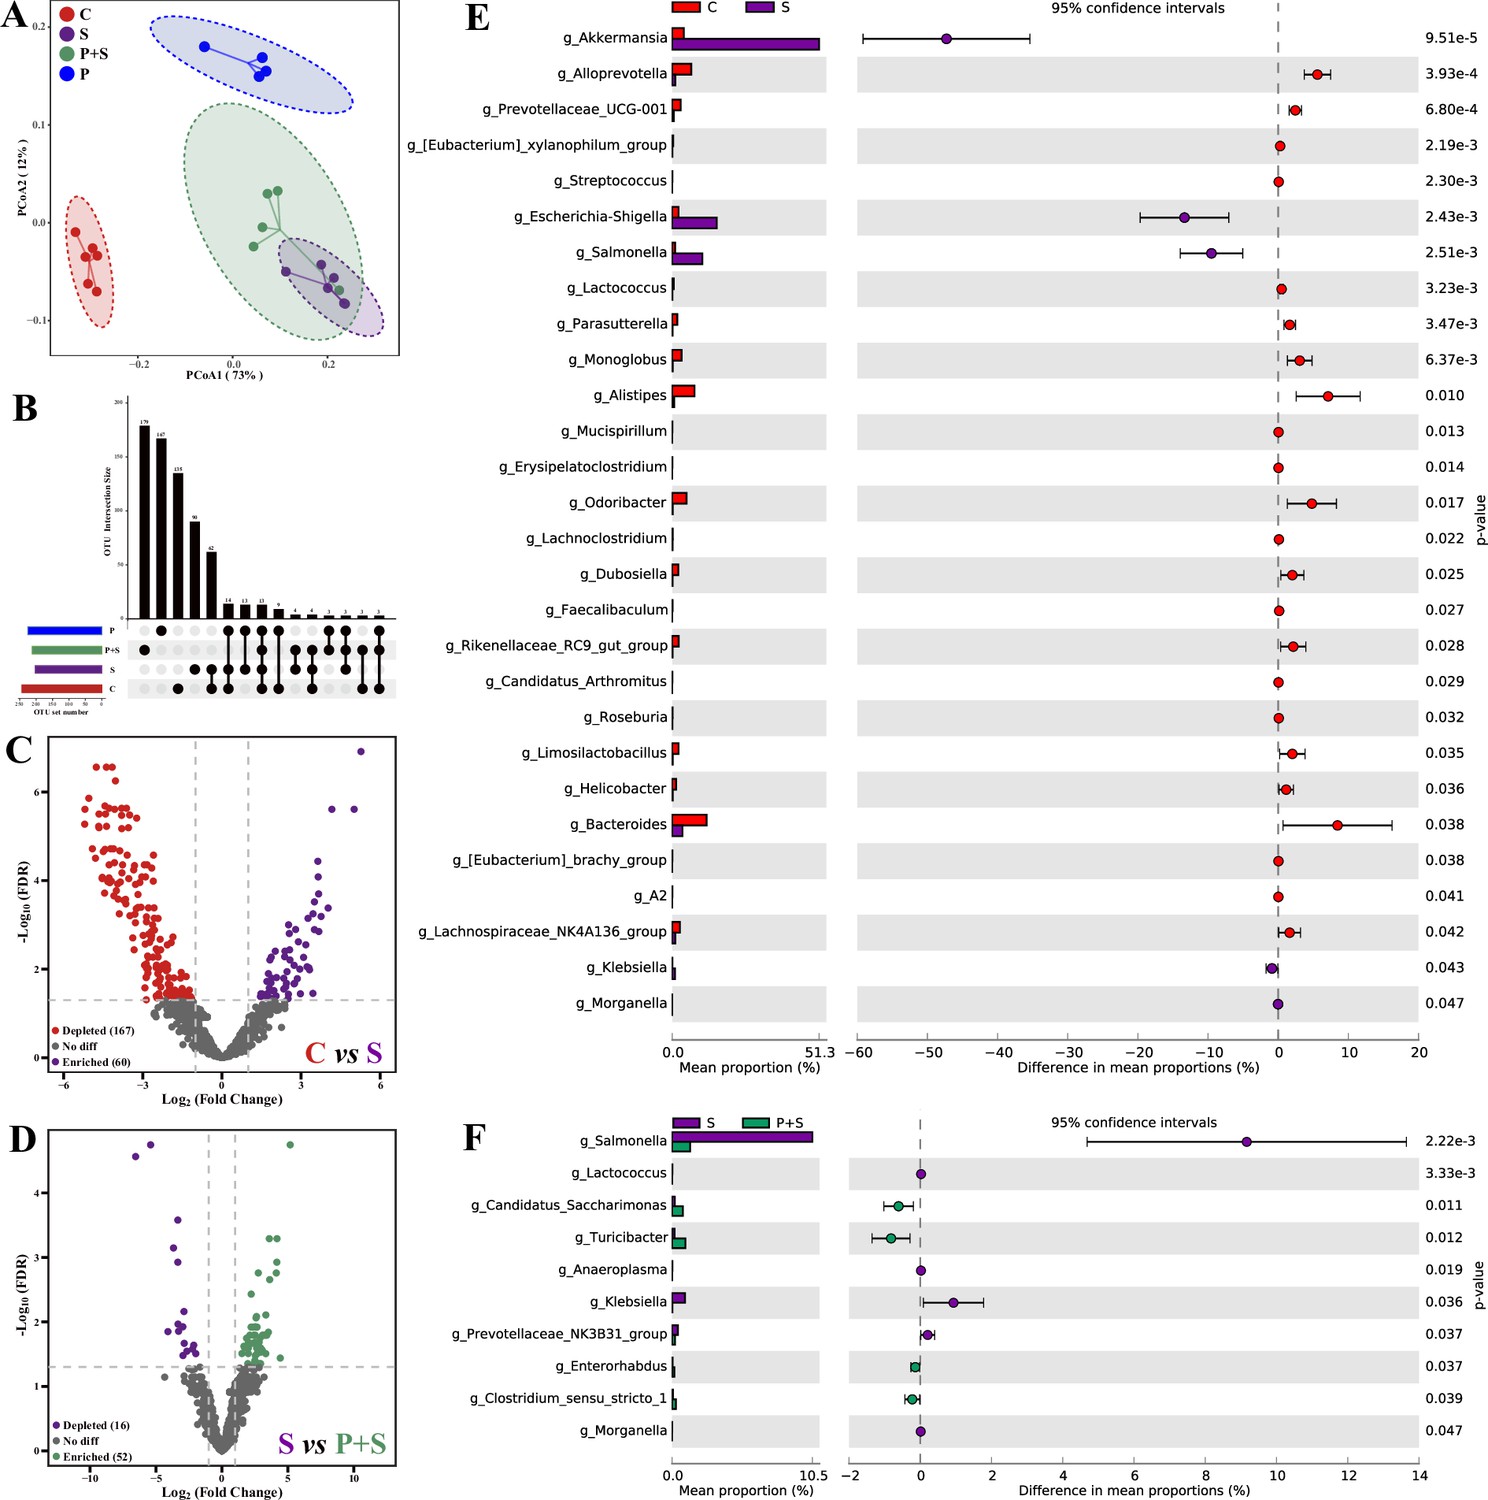
L. rhamnosus P118 improves S. Typhimurium infection-induced dysbacteriosis.
(A) Principal coordinates analysis (PCoA) based on Bray-Curtis distance. (B) UpSetR plot based on bacterial absolute operational taxonomic unit (OTU) abundances. (C, D) The fold changes of bacterial absolute OTU abundances between two groups. (E, F) Comparison of intestinal microbes by STAMP. The prefix ‘g_’ represents the annotated level of the genus. C: PBS group; P: P118 administered group; S: S. Typhimurium-infected group; P+S: P118 protective group.
Figure 3—figure supplement 1
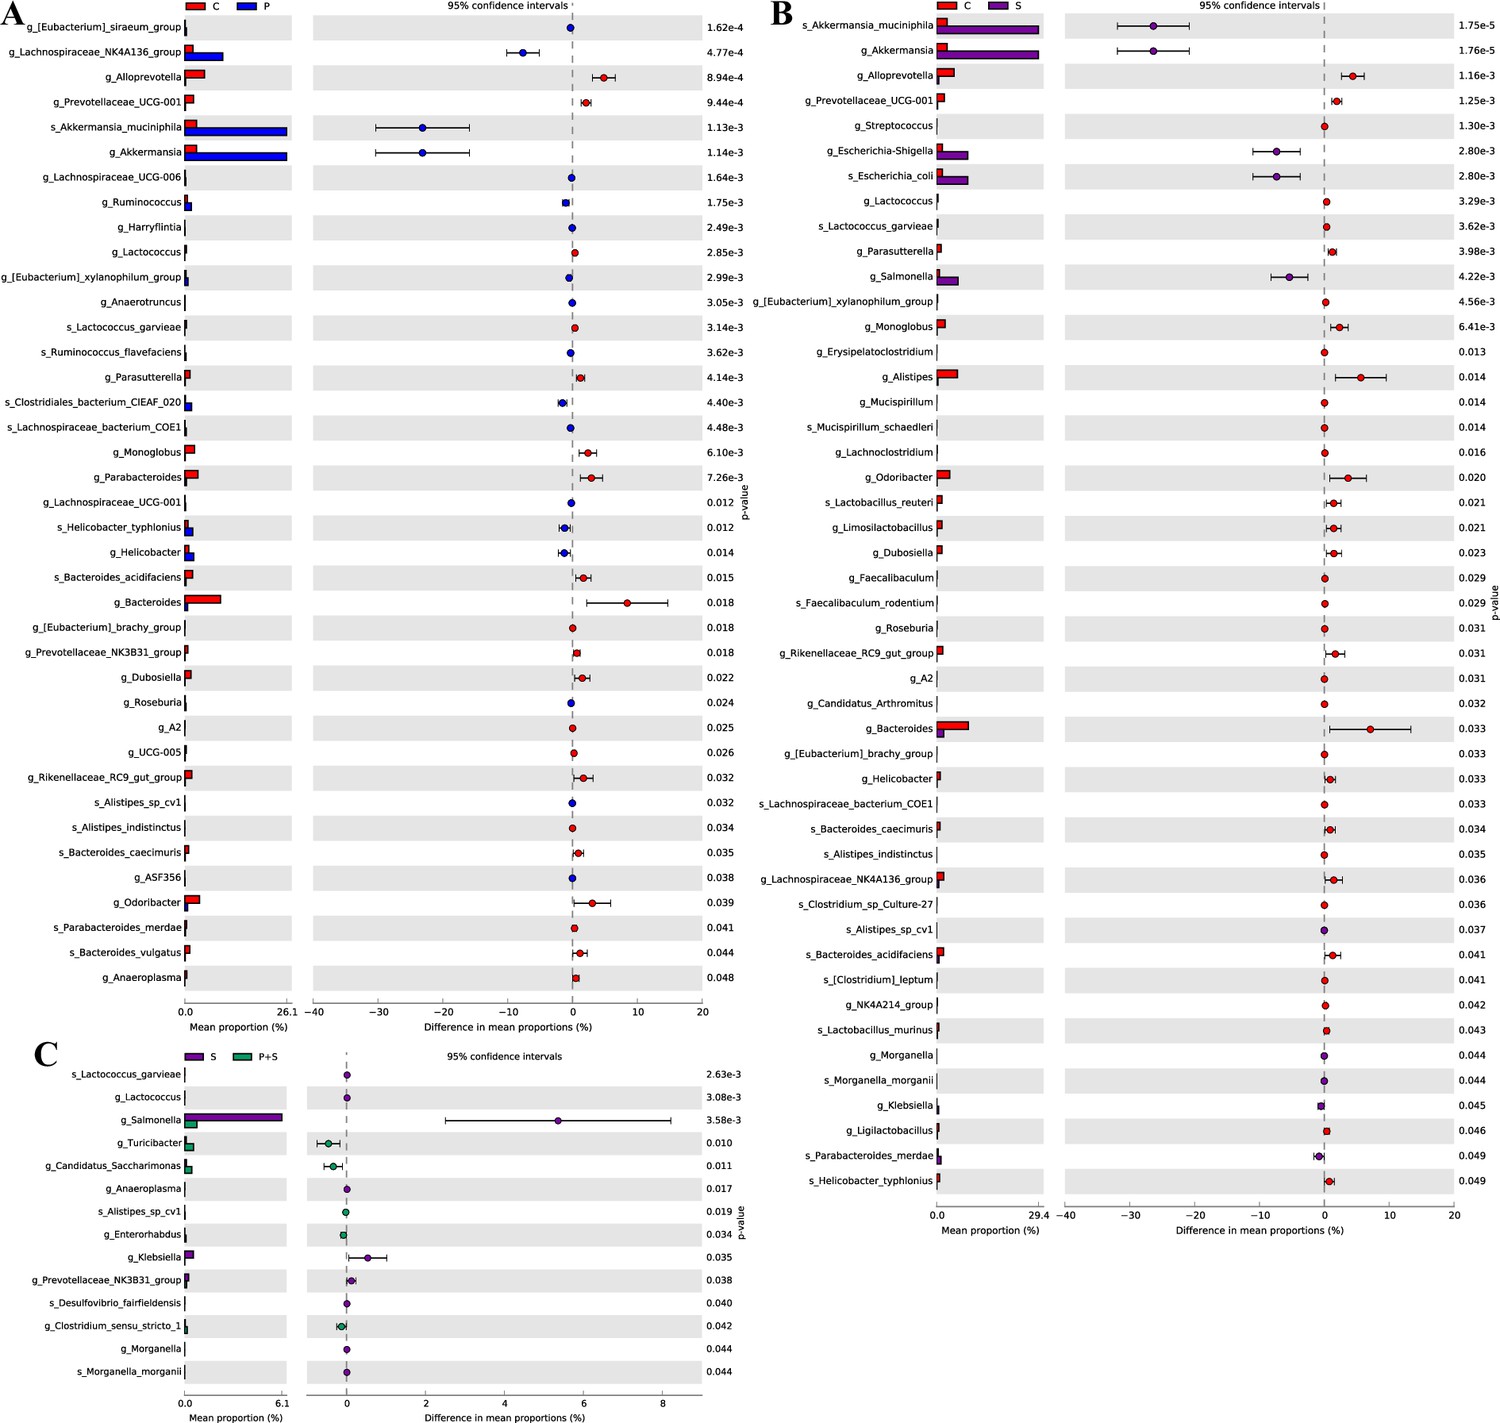
Comparison of intestinal microbes by the analysis of statistical analysis of taxonomic and functional profiles (STAMP) software with a two-sided Welch’s t-test.
(A) C vs. P, (B) C vs. S, (C) S vs. P+S. The prefixes ‘g_’ and ‘s_’ represent the annotated levels of genus and species. C: PBS group; P: P118 administered group; S: S. Typhimurium-infected group; P+S: P118 protective group.
Figure 3—figure supplement 2
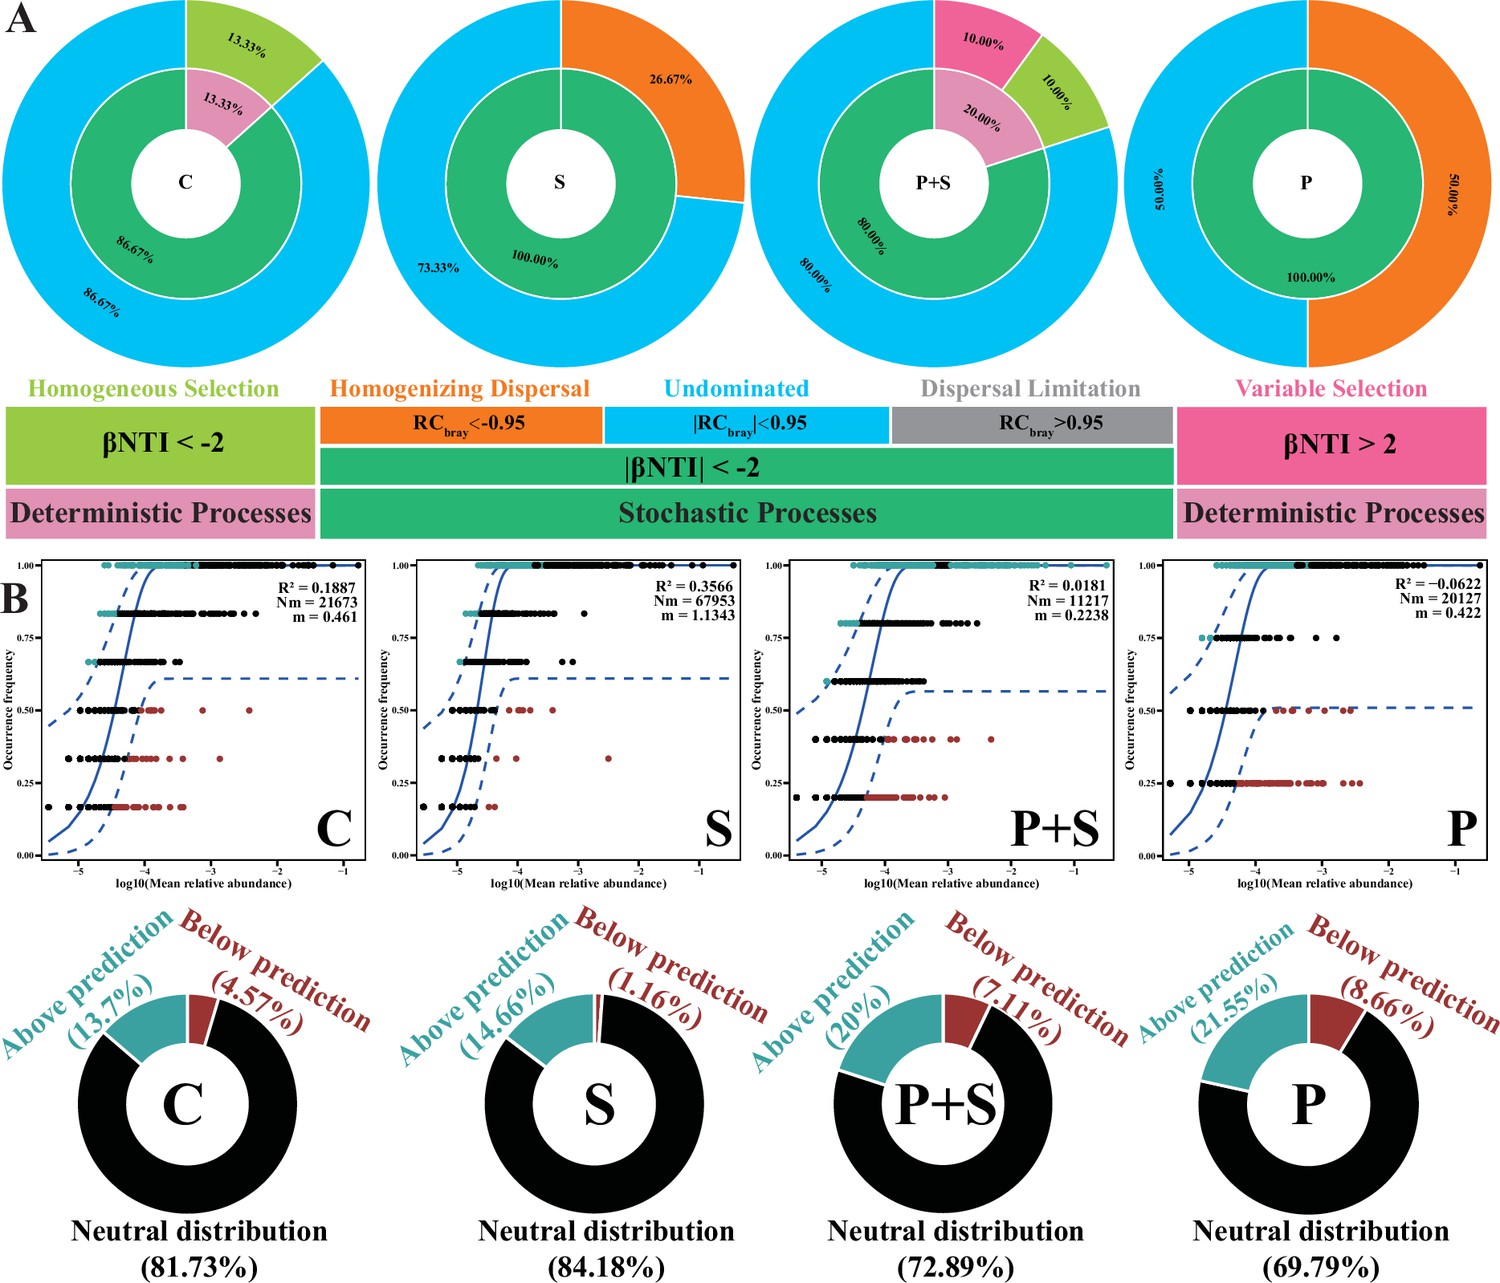
L. rhamnosus P118 alters gut microbial community assembly.
(A) Ecological processes of gut microbes. The inner circle indicates the percentage of deterministic and stochastic assembly processes. The outer circle indicates the contribution of detailed ecological processes. (B) The fit of neutral community model (NCM) of community assembly for gut microbes. The best fit to NCM and 95% CIs around the best fit to NCM are indicated by solid and dashed blue lines, respectively. Light blue and dark red dots indicate operational taxonomic units (OTUs) that occur more (above prediction) or less (below prediction) frequently than predicted by NCM, respectively, while black dots indicate the OTUs that occur within neutral prediction (neutral distribution). Donut charts show the distinct fitting proportions of OTUs predicted by NCM. C: PBS group; P: P118 administered group; S: S. Typhimurium-infected group; P+S: P118 protective group.
Figure 4 with 1 supplement
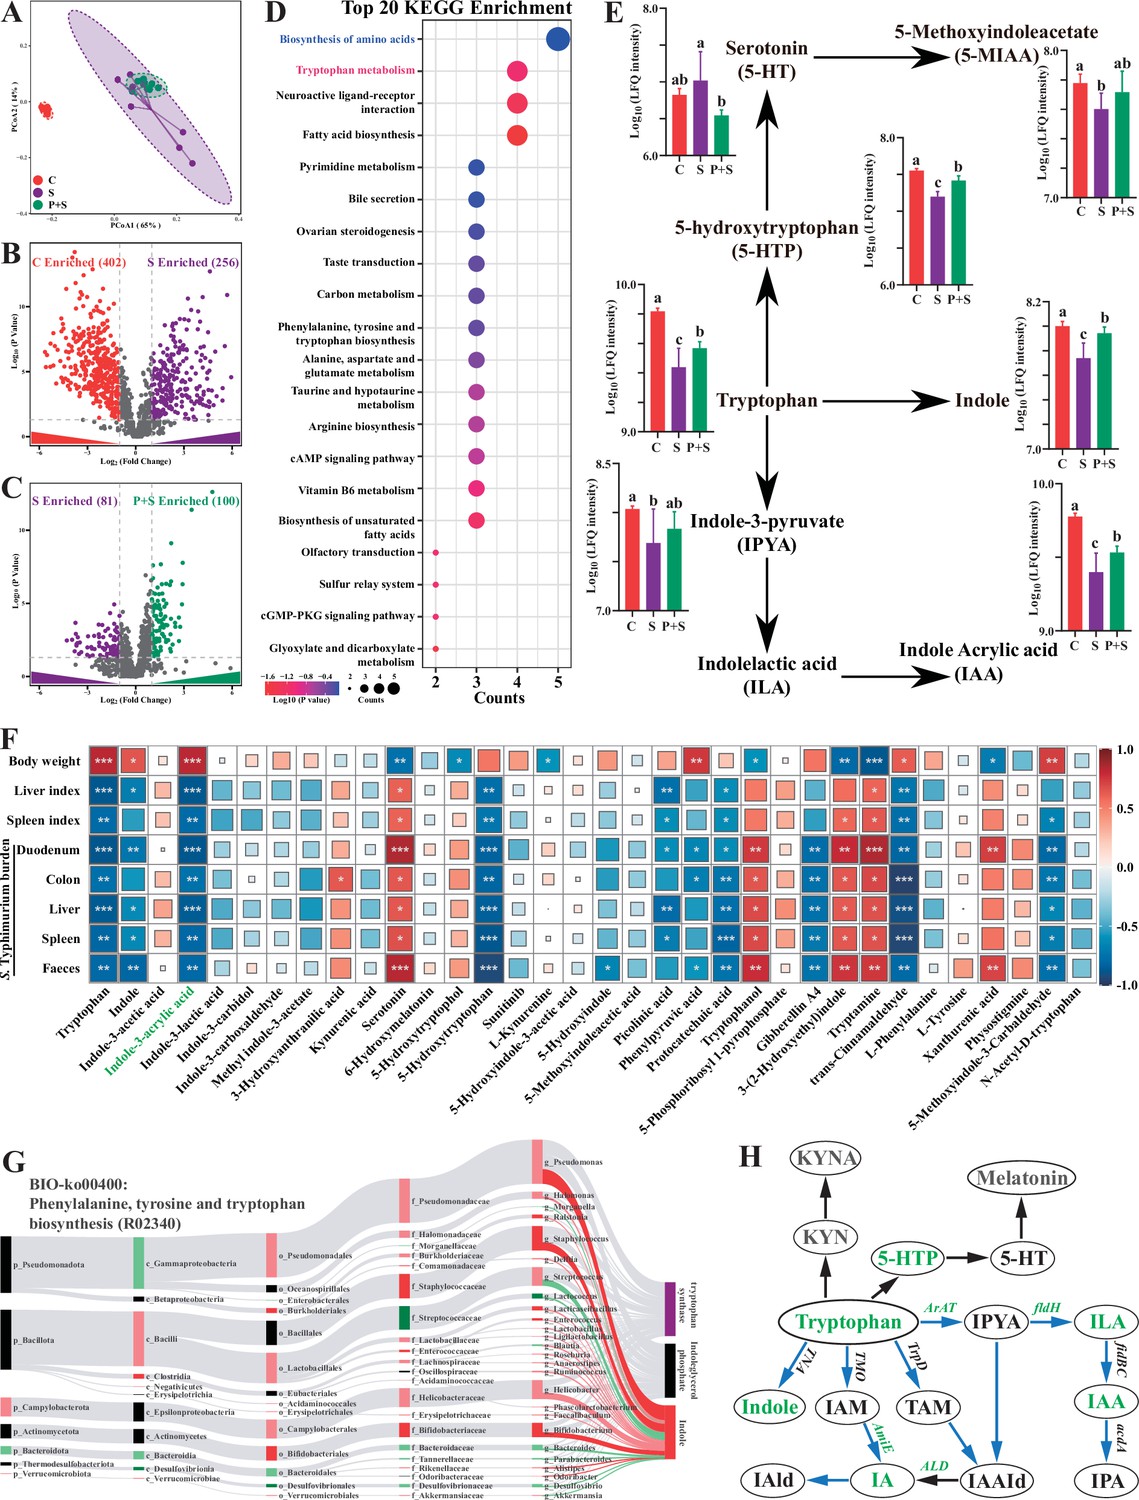
Microbe-derived tryptophan metabolites are involved in mice tolerance to S. Typhimurium.
(A) Principal coordinates analysis (PCoA) based on Bray–Curtis distance of fecal metabolites. (B, C) UpSetR plot based on fecal metabolites. (D) Metabolomics pathway enrichment in ‘P+S vs. S’. (E) Comparison of fecal microbial tryptophan metabolism-enriched pathway among groups. (F) Pearson correlation analysis among S. Typhimurium burden, organ indices, body weight, and fecal metabolites in mice. (G) Bio-Sankey network analysis between intestinal microbes and fecal metabolites. (H) Pathway schematic of abbreviated mammalian and microbial tryptophan metabolism. Different lowercase letters indicate a significant difference (p<0.05). Significant differences *p<0.05; **p<0.01; ***p<0.001. C: PBS group; P: P118 administered group; S: S. Typhimurium-infected group; P+S: P118 protective group.
Figure 4—figure supplement 1
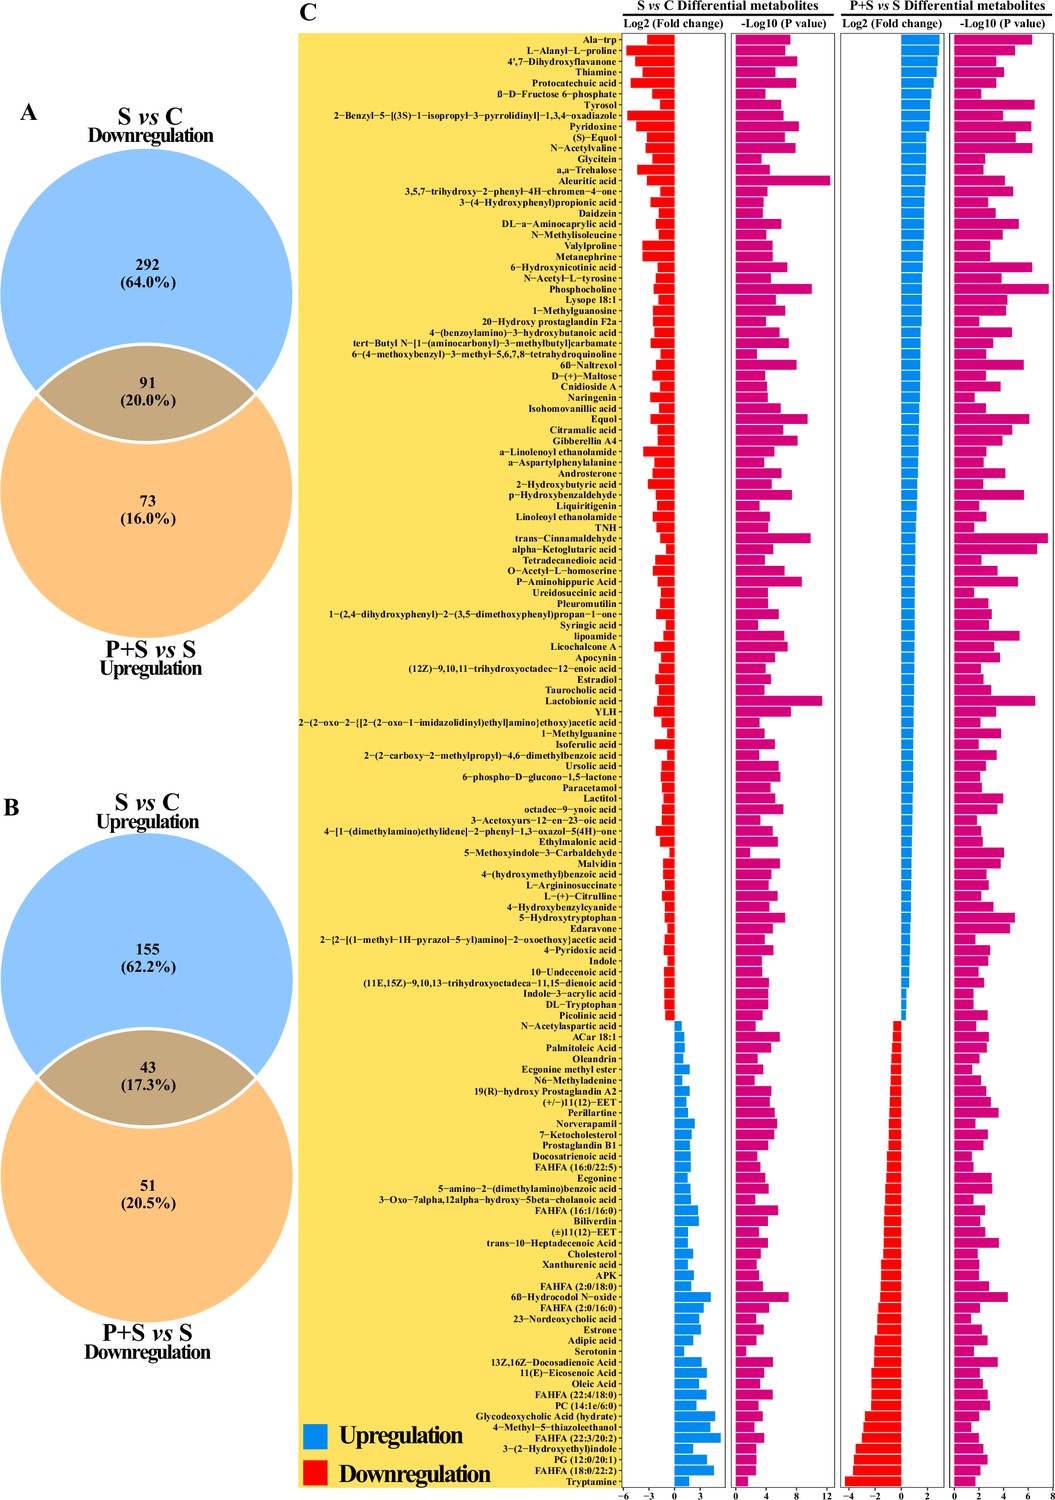
Analysis of differential fecal metabolites.
Venn diagram based on differential fecal metabolites (A) downregulated in ‘S vs. C’ and upregulated in ‘P+S vs. S’, (B) upregulated in ‘S vs. C’ and downregulated in ‘P+S vs. S’. (C) Significant differential fecal metabolites in ‘S vs. C’ and ‘P+S vs. S’. C: PBS group; P: P118 administered group; S: S. Typhimurium-infected group; P+S: P118 protective group.
Figure 5 with 2 supplements
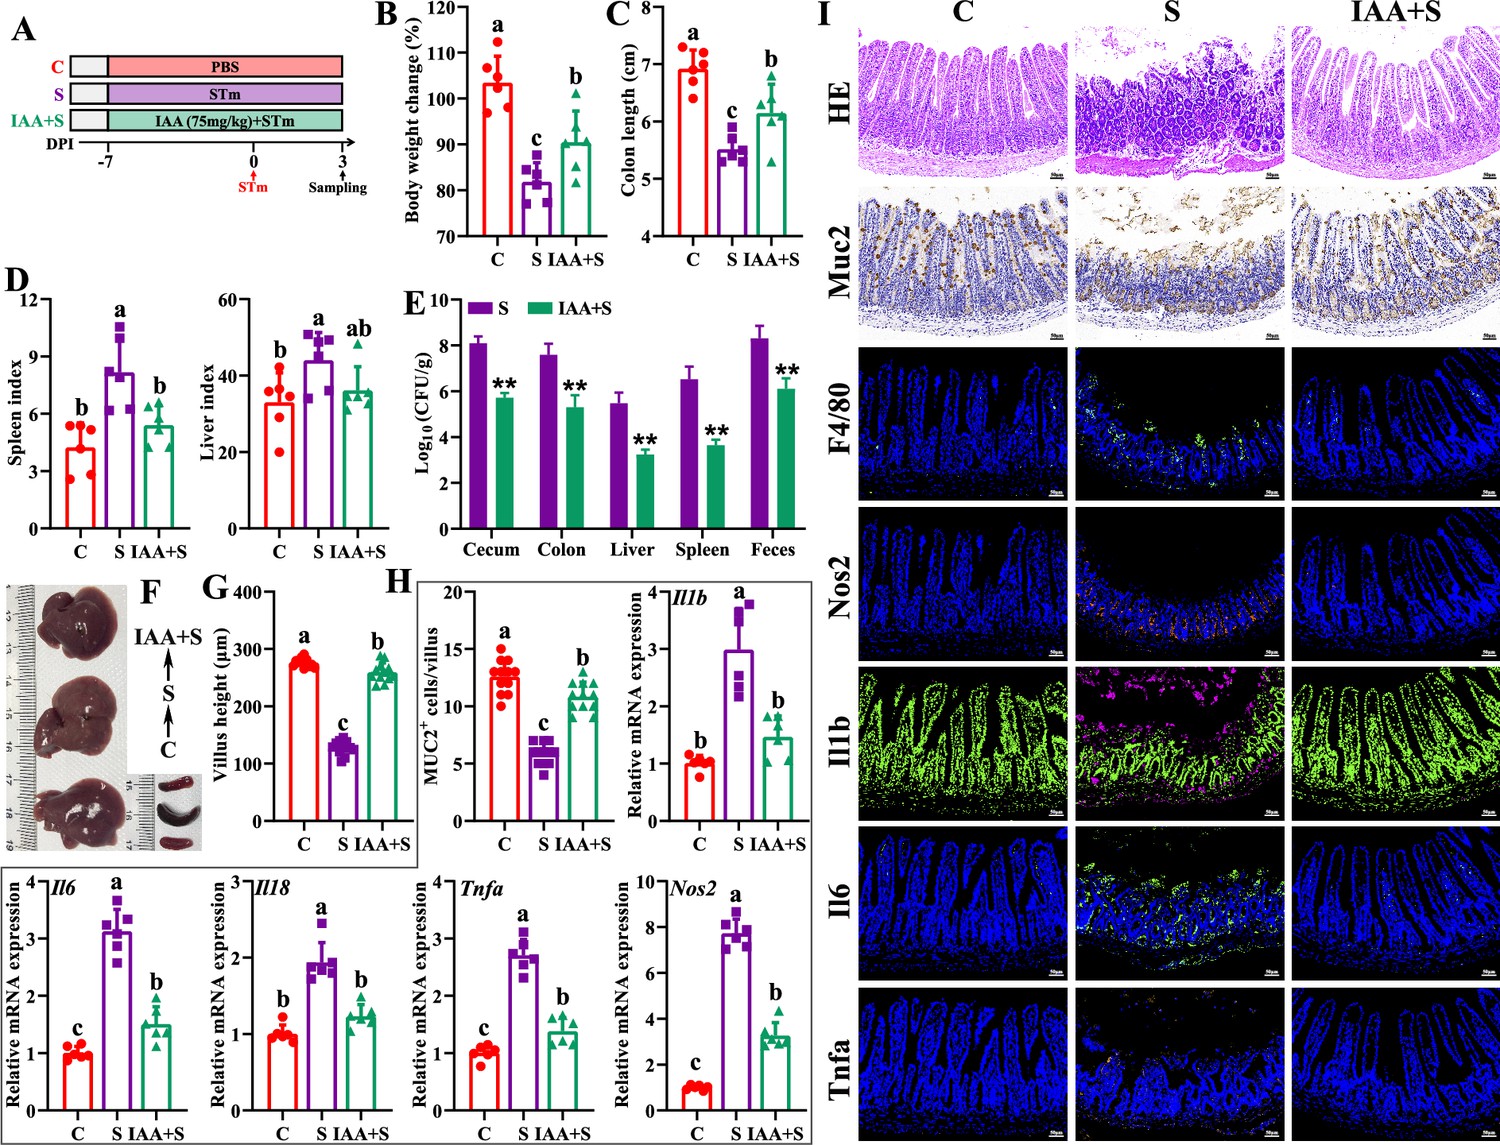
Indole-3-acrylic acid enhances mice tolerance to S. Typhimurium infection.
(A) Experimental design. (B) Body weight change. (C) Colon length. (D) Spleen and liver indexes. (E) S. Typhimurium burden in tissues and shedding in feces. (F) Representative images of spleen and liver. (G) Villus height of ileum. (H) Muc2-positive cells and mRNA expression levels in ileum. (I) Representative images of H&E staining and immunostaining in the ileum. Different lowercase letters indicate a significant difference (p<0.05). C: PBS group; S: S. Typhimurium-infected group; IAA + S: indole-3-acrylic acid protective group.
Figure 5—figure supplement 1

Antibacterial activities of indole-3-acrylic acid.
GM: 100 μg/mL gentamicin.
Figure 5—figure supplement 2
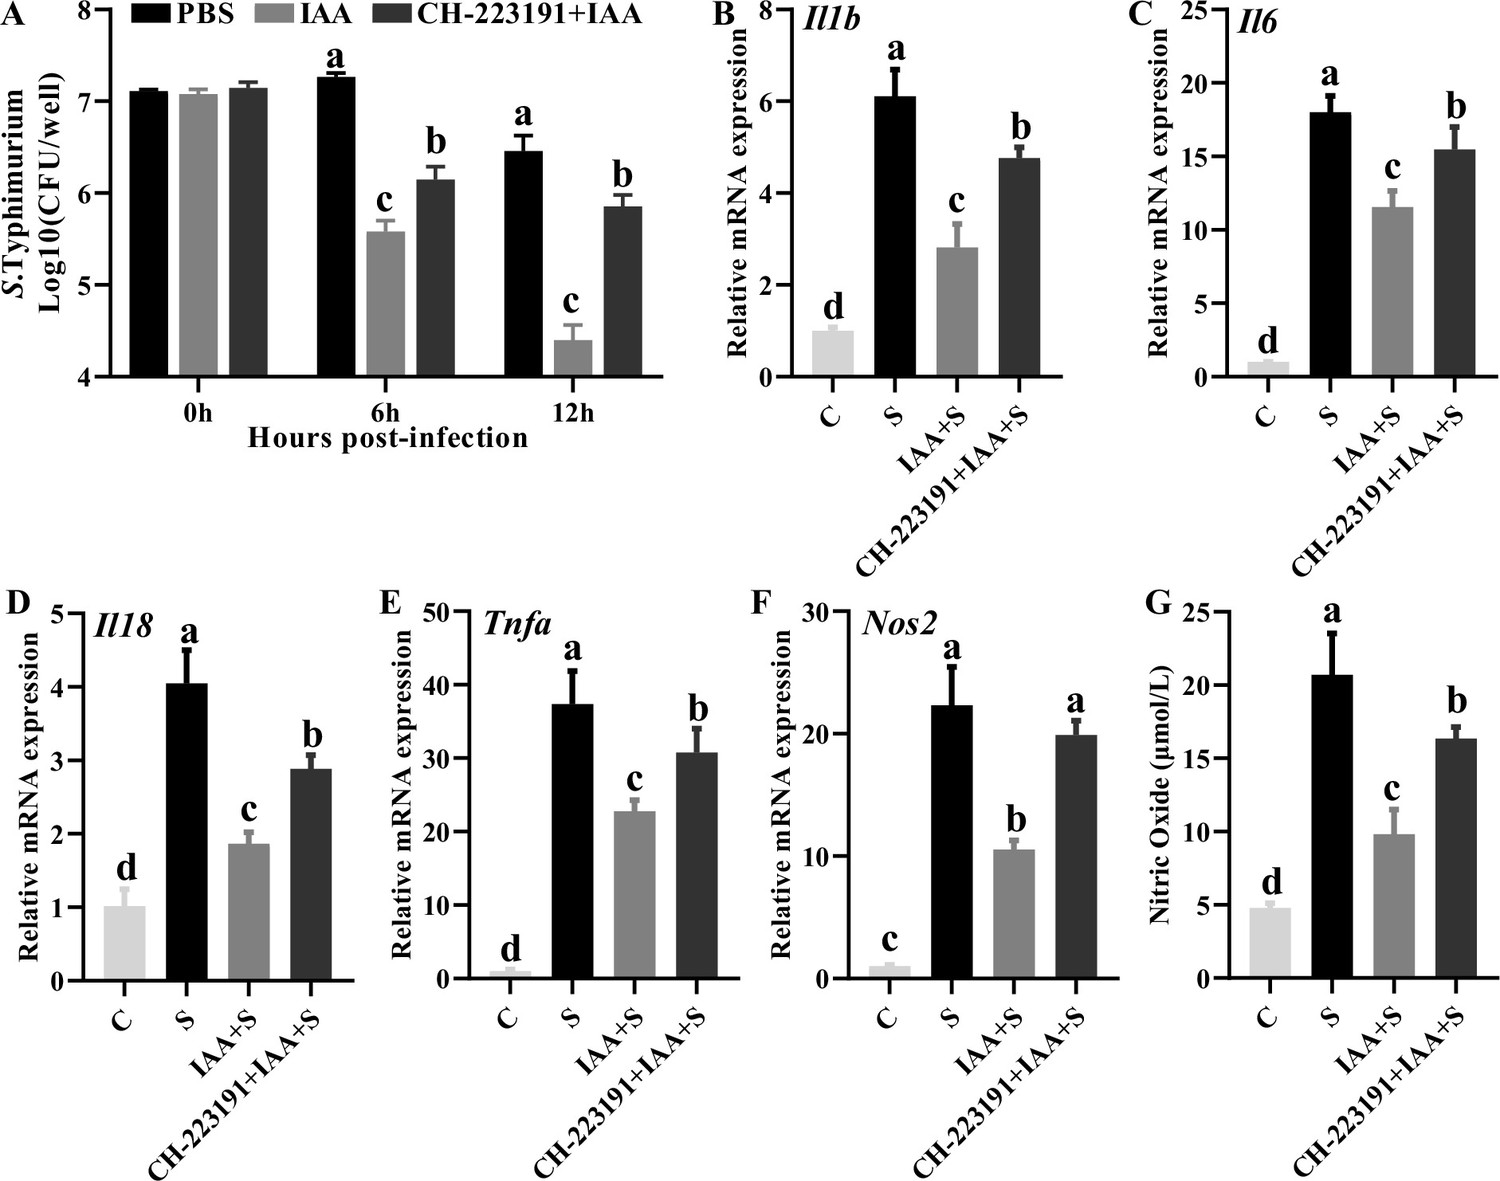
Indole-3-acrylic acid enhances bactericidal capacity and exerts anti-inflammatory activity in RAW 264.7 cells.
(A) Indole-3-acrylic acid enhances bactericidal activity of macrophages. (B-F) The mRNA expression expression level of macrophages. (G) Nitric oxide secretion level of macrophages. Different lowercase letters (a, b, c, d) indicate a significant difference (p<0.05). C: PBS group; IAA: indole-3-acrylic acid group; S: S. Typhimurium-infected group; CH-223191: AHR inhibitor-treated group.
Figure 6
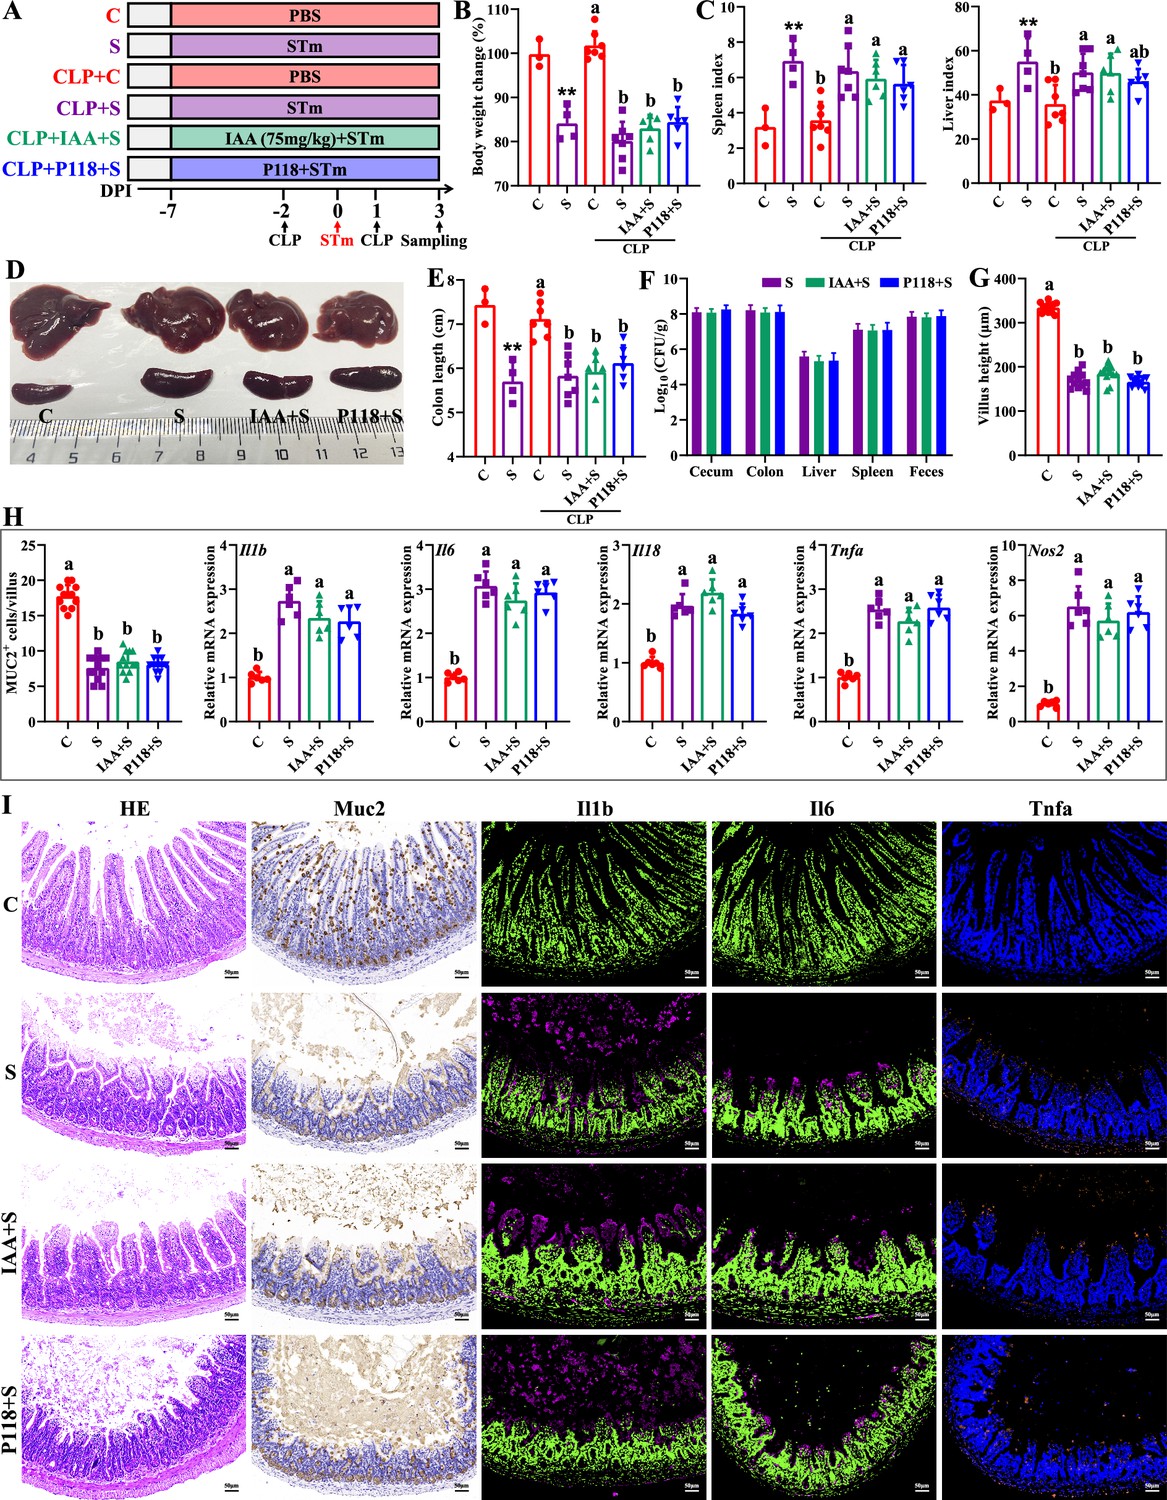
Macrophage depletion abrogates the protective effect of L. rhamnosus P118 and indole-3-acrylic acid against S. Typhimurium infection.
(A) Experimental design. (B) Body weight change. (C) Spleen and liver indexes. (D) Representative images of spleen and liver. (E) Colon length. (F) S. Typhimurium burden in tissues and shedding in feces. (G) Villus height of ileum. (H) Muc2-positive cells and mRNA expression levels in ileum. (I) Representative images of H&E staining and immunostaining in the ileum. Different lowercase letters indicate a significant difference (p<0.05). (B–E) Significant differences **p<0.01 indicates ‘S vs. C’. CLP: macrophage depletion reagent clodronate liposomes. C: PBS group; S: S. Typhimurium-infected group; IAA + S: indole-3-acrylic acid protective group; P+S: P118 protective group.
Figure 7
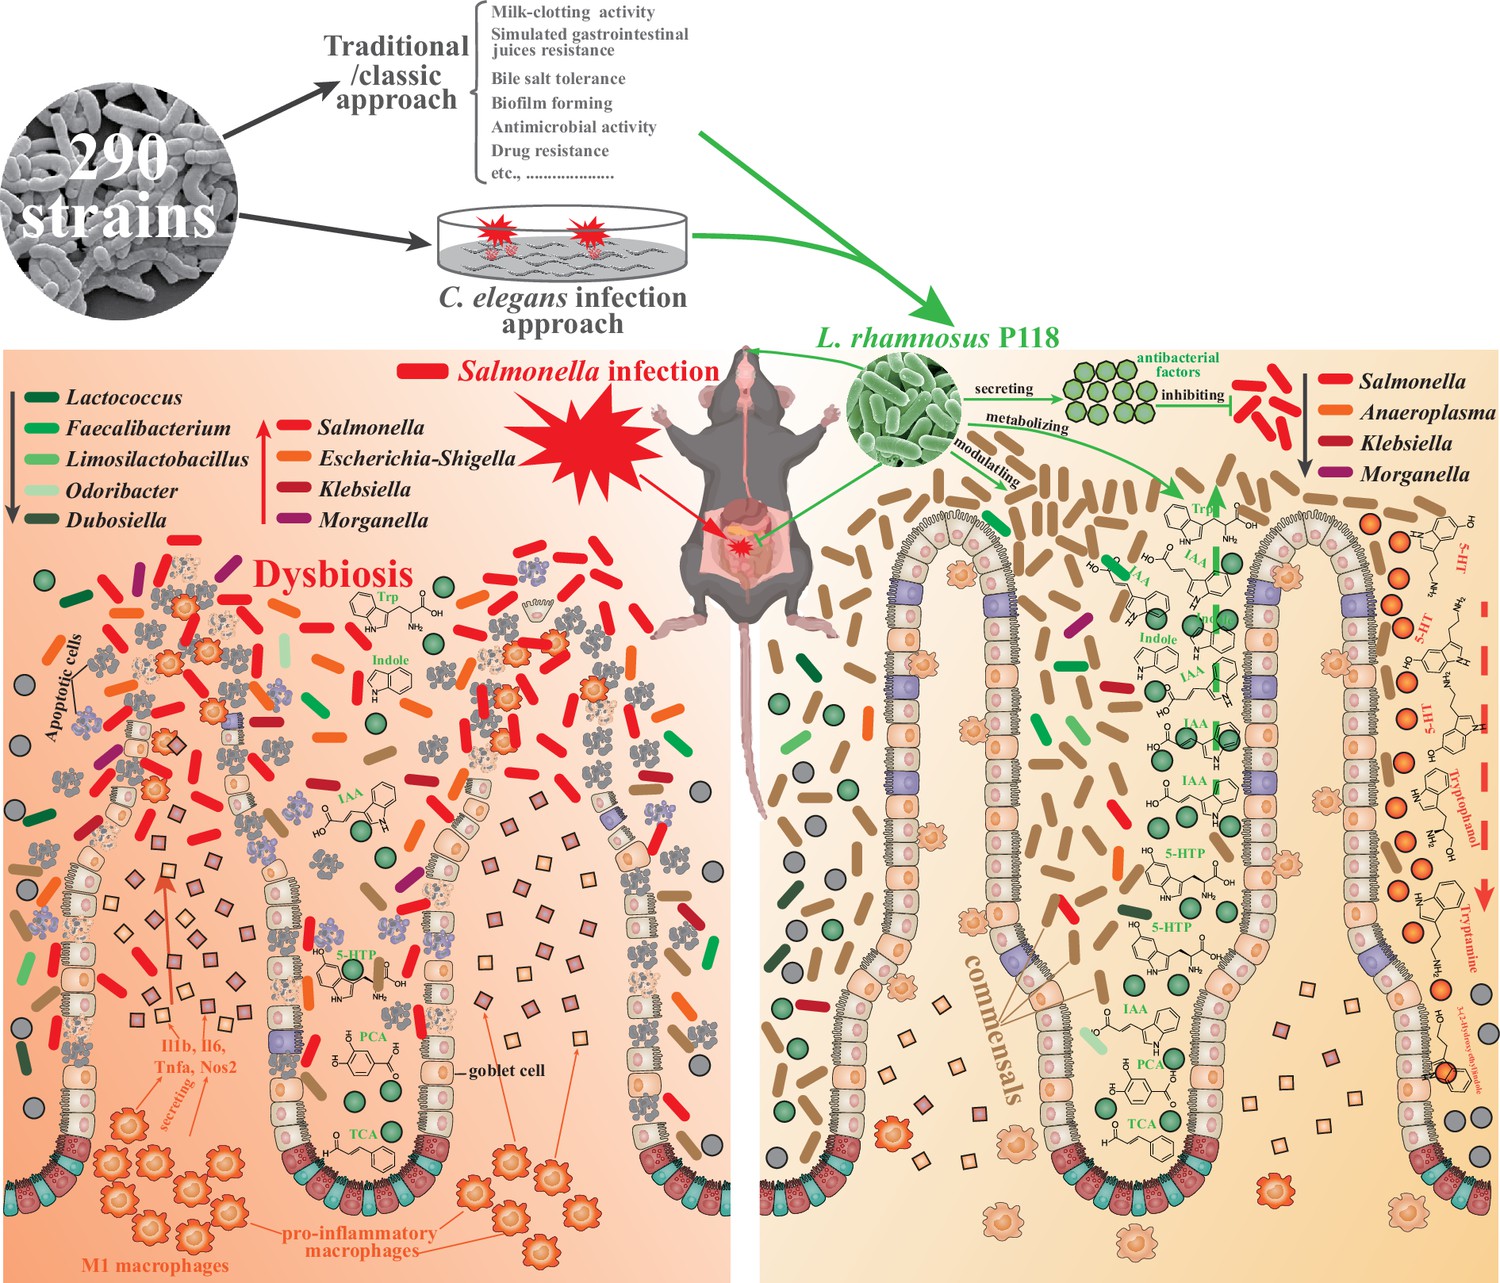
L. rhamnosus P118 strain with great probiotic properties was screened from 290 purified isolates through two distinctive screen approaches, and P118 strain was underscored for protective effects on a murine infection model.
Further, multi-omics analysis pinpointed the microbe-derived tryptophan/indole could be the importance of P118 probiotic properties. Nevertheless, the newly found P118 enhances host tolerance to Salmonella infections via various pathways, including direct antibacterial actions, inhibiting Salmonella colonization and invasion, attenuating pro-inflammatory responses of intestinal macrophages, and modulating gut microbiota mediated by microbe-derived indole metabolites.
Tables
Table 1
A list of probiotic isolates recovered from examined samples.
| Source | Name | Number of isolates |
|---|---|---|
| Yogurt | Streptococcus salivarius ssp. thermophilus | 63 |
| Lacticaseibacillus paracasei | 18 | |
| Lactobacillus acidophilus | 17 | |
| Lactobacillus zeae | 10 | |
| Lacticaseibacillus rhamnosus | 4 | |
| Lacticaseibacillus casei | 4 | |
| Lactobacillus delbrueckii | 6 | |
| Piglet intestine | Limosilactobacillus mucosae | 16 |
| Lactobacillus johnsonii | 38 | |
| Limosilactobacillus reuteri | 16 | |
| Limosilactobacillus vaginalis | 11 | |
| Lactobacillus crispatus | 9 | |
| Lactobacillus salivarius | 6 | |
| Lactobacillus amylovorus | 3 | |
| Enterococcus faecium | 38 | |
| Enterococcus faecalis | 31 | |
| Total | 290 |
Additional files
-
Supplementary file 1
Milk-clotting activity of lactic acid bacteria.
- https://cdn.elifesciences.org/articles/101198/elife-101198-supp1-v1.xlsx
-
Supplementary file 2
Significance between life span data was calculated using a Mantel–Cox log-rank test.
- https://cdn.elifesciences.org/articles/101198/elife-101198-supp2-v1.xlsx
-
Supplementary file 3
Significance between life span data was calculated using a Mantel–Cox log-rank test.
- https://cdn.elifesciences.org/articles/101198/elife-101198-supp3-v1.xlsx
-
Supplementary file 4
Species-level identity of L. rhamnosus P118.
The draft genome of P118 was queried using the NCBI non-redundant prokaryotic database available through MIGA (http://microbial-genomes.org/). p-Values reflect confidence in the assignment as each taxonomic rank.
- https://cdn.elifesciences.org/articles/101198/elife-101198-supp4-v1.xlsx
-
Supplementary file 5
L. rhamnosus P118 draft genome nearest subspecies phylogenetic neighbors.
Average nucleotide identity (ANI) and average amino acid identity (AAI) using both percent identity and a fraction of genome shared as determined through MIGA (http://microbial-genomes.org/) query of the NCBI non-redundant prokaryotic genomes database were considered for ranking likelihood of nearest subspecies phylogenetic neighbors for duplicate isolates of each Lacticaseibacillus species.
- https://cdn.elifesciences.org/articles/101198/elife-101198-supp5-v1.xlsx
-
Supplementary file 6
Primers used for the quantitative PCR.
- https://cdn.elifesciences.org/articles/101198/elife-101198-supp6-v1.xlsx
-
Supplementary file 7
The criteria of clinical symptom scores.
- https://cdn.elifesciences.org/articles/101198/elife-101198-supp7-v1.xlsx
-
Supplementary file 8
ANOSIM, PERMANOVA, and MRPP analysis of microbial diversity among treatments.
- https://cdn.elifesciences.org/articles/101198/elife-101198-supp8-v1.xlsx
-
Supplementary file 9
ANOSIM, PERMANOVA, and MRPP analysis of fecal metabolites among groups.
- https://cdn.elifesciences.org/articles/101198/elife-101198-supp9-v1.xlsx
-
Supplementary file 10
Significant differential fecal metabolites in ‘S vs. C’ and ‘P+S vs. S’.
- https://cdn.elifesciences.org/articles/101198/elife-101198-supp10-v1.xlsx
-
Supplementary file 11
Prediction of aminotransferase class and tryptophan binding affinity in L. rhamnosus P118.
- https://cdn.elifesciences.org/articles/101198/elife-101198-supp11-v1.xlsx
-
Supplementary file 12
Tryptophan metabolism and indole derivatives in L. rhamnosus P118 cultures.
- https://cdn.elifesciences.org/articles/101198/elife-101198-supp12-v1.xlsx
-
MDAR checklist
- https://cdn.elifesciences.org/articles/101198/elife-101198-mdarchecklist1-v1.docx
Download links
A two-part list of links to download the article, or parts of the article, in various formats.
Downloads (link to download the article as PDF)
Open citations (links to open the citations from this article in various online reference manager services)
Cite this article (links to download the citations from this article in formats compatible with various reference manager tools)
Lacticaseibacillus rhamnosus P118 enhances host tolerance to Salmonella infection by promoting microbe-derived indole metabolites
eLife 13:RP101198.
https://doi.org/10.7554/eLife.101198.4


