Avian-specific Salmonella transition to endemicity is accompanied by localized resistome and mobilome interaction
- Department of Veterinary Medicine, Zhejiang University College of Animal Sciences, China
- Hainan Institute of Zhejiang University, China
- Ningbo Academy of Agricultural Sciences, China
- ZJU-Xinchang Joint Innovation Centre (TianMu Laboratory), Gaochuang Hi-Tech Park, China
- School of Life Science, Hangzhou Institute for Advanced Study, University of Chinese Academy of Sciences, China
- State Key Laboratory for Diagnosis and Treatment of Infectious Diseases, National Clinical Research Center for Infectious Diseases, National Medical Center for Infectious Diseases, The First Affiliated Hospital, College of Medicine, Zhejiang University, China
Figures
Figure 1 with 2 supplements
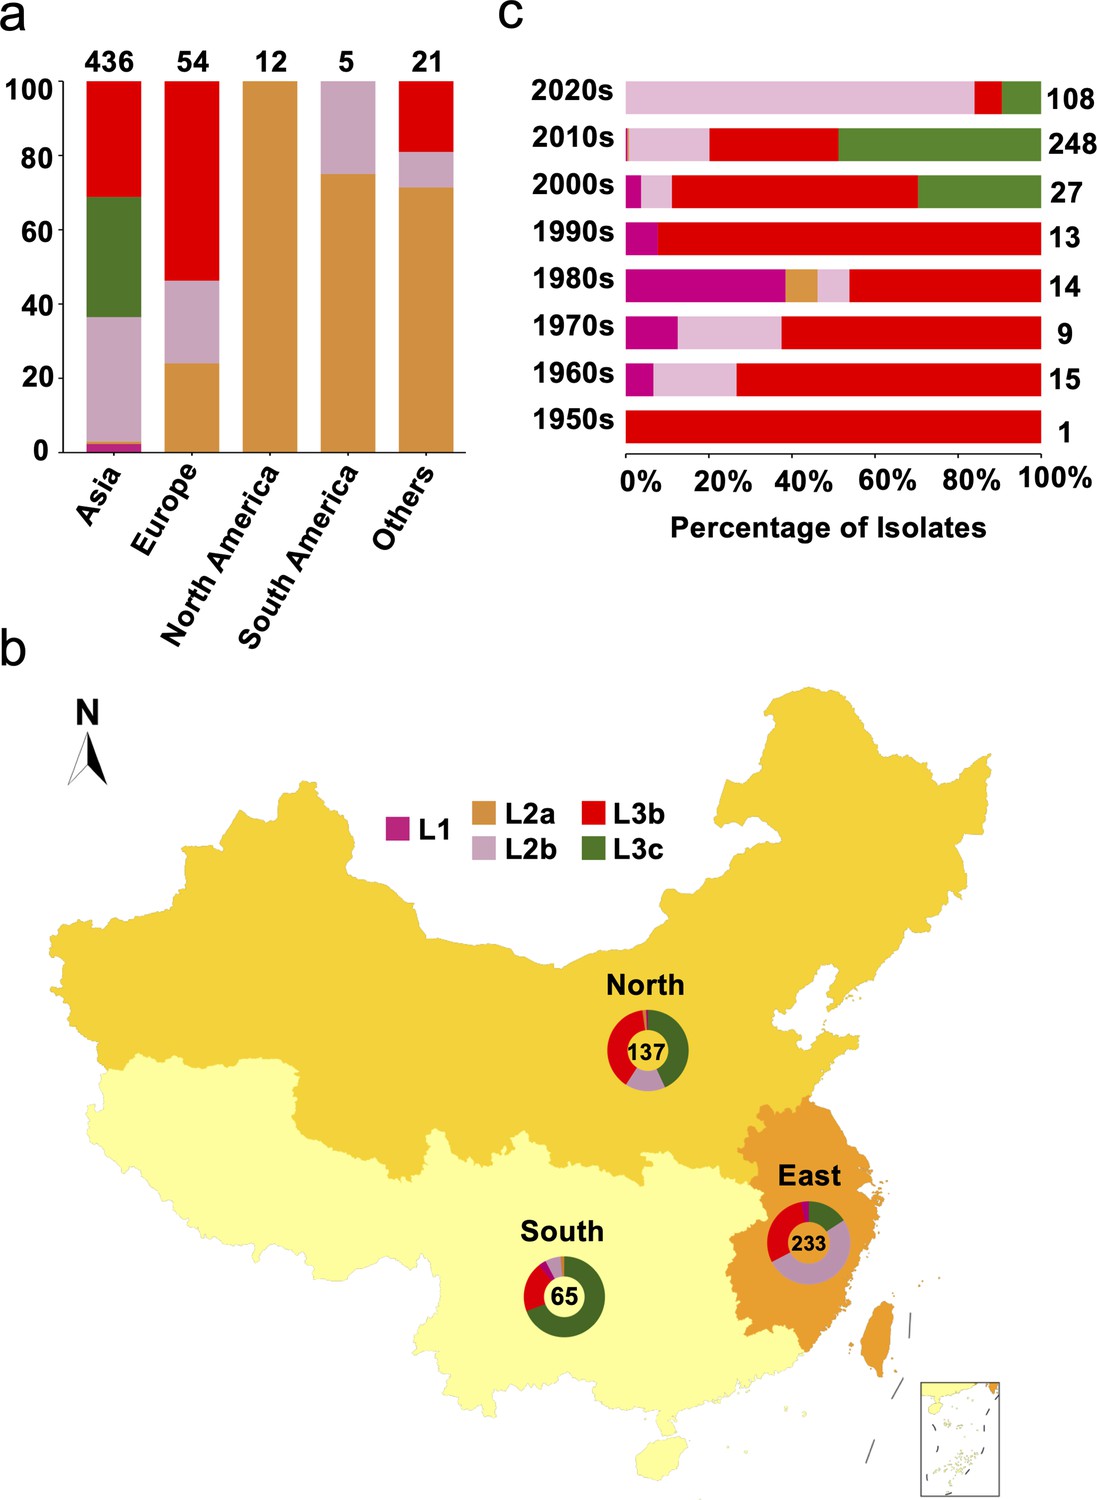
Genetic diversity of S. Gallinarum biovar Pullorum (bvSP) by geography and time.
Different colors were used to represent the various lineages of bvSP: fuchsia for L1, orange for L2a, pink for L2b, red for L3b, and green for L3c. (a) The bvSP in the dataset is classified into five continents based on their isolation regions. The bar graph illustrates the distribution of lineage-specific bvSP across continents, depicted as percentages. The total sample size for each bar is indicated at the top. (b) Geographical distribution of bvSP isolated from China. Doughnut charts in the map show the proportion of lineage types of bvSP collected in the corresponding region, with the total number of isolates in the center. (c) The bar graph shows the distribution of bvSP isolated in China by lineage per decade. The total sample size for each bar is also indicated on the right side.
Figure 1—figure supplement 1
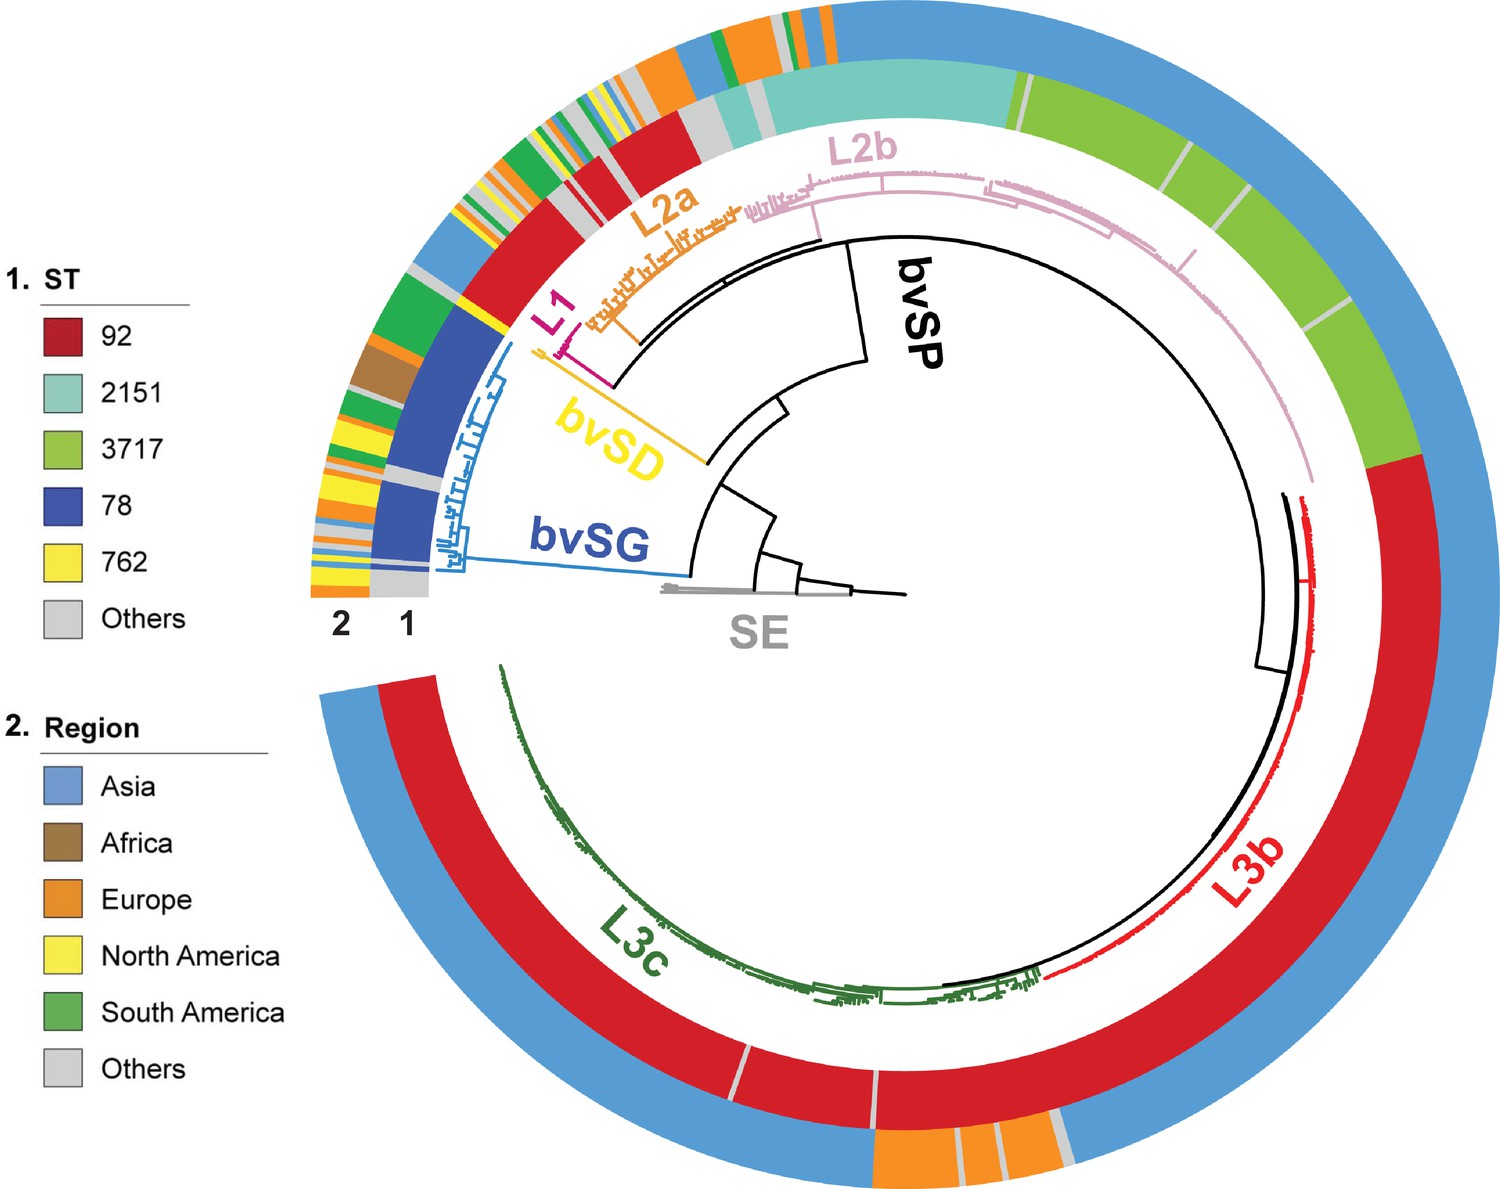
The evolutionary structure of global S. Gallinarum.
The phylogenetic tree was constructed using core-genome single nucleotide polymorphism sites (cgSNPs), revealing three S. Gallinarum biovars: S. Gallinarum biovar Pullorum (bvSP) (n=528/580, 91.03%), S. Gallinarum biovar Gallinarum (bvSG) (n=50/580, 8.6%), and S. Gallinarum biovar Duisburg (bvSD) (n=2/580, 0.34%). Additionally, Salmonella serovar Enteritidis (SE) is represented by a gray line. Employing hierarchical Bayesian analysis, bvSP was further subdivided into five lineages: fuchsia (L1), orange (L2a), pink (L2b), red (L3b), and green (L3c). The colorful circles indicate detailed information on Salmonella sequence type and isolation regions. The outermost circle denotes the locations of the 45 bvSP strains isolated from Yueqing and Taishun.
Figure 1—figure supplement 2
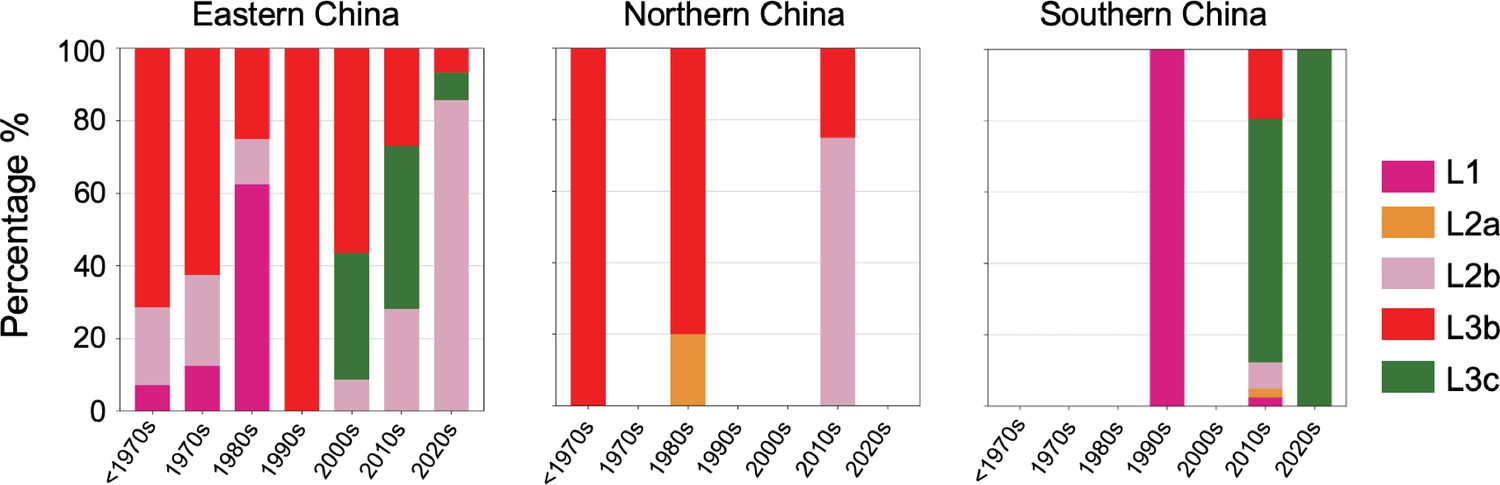
The primary prevalence of S. Gallinarum biovar Pullorum (bvSP) lineages varies across different regions of China over time, with consideration given to the eastern, northern, and southern regions.
The colors indicate the specific lineage type prevalence within each region: fuchsia (L1), orange (L2a), pink (L2b), red (L3b), and green (L3c).
Figure 2 with 6 supplements
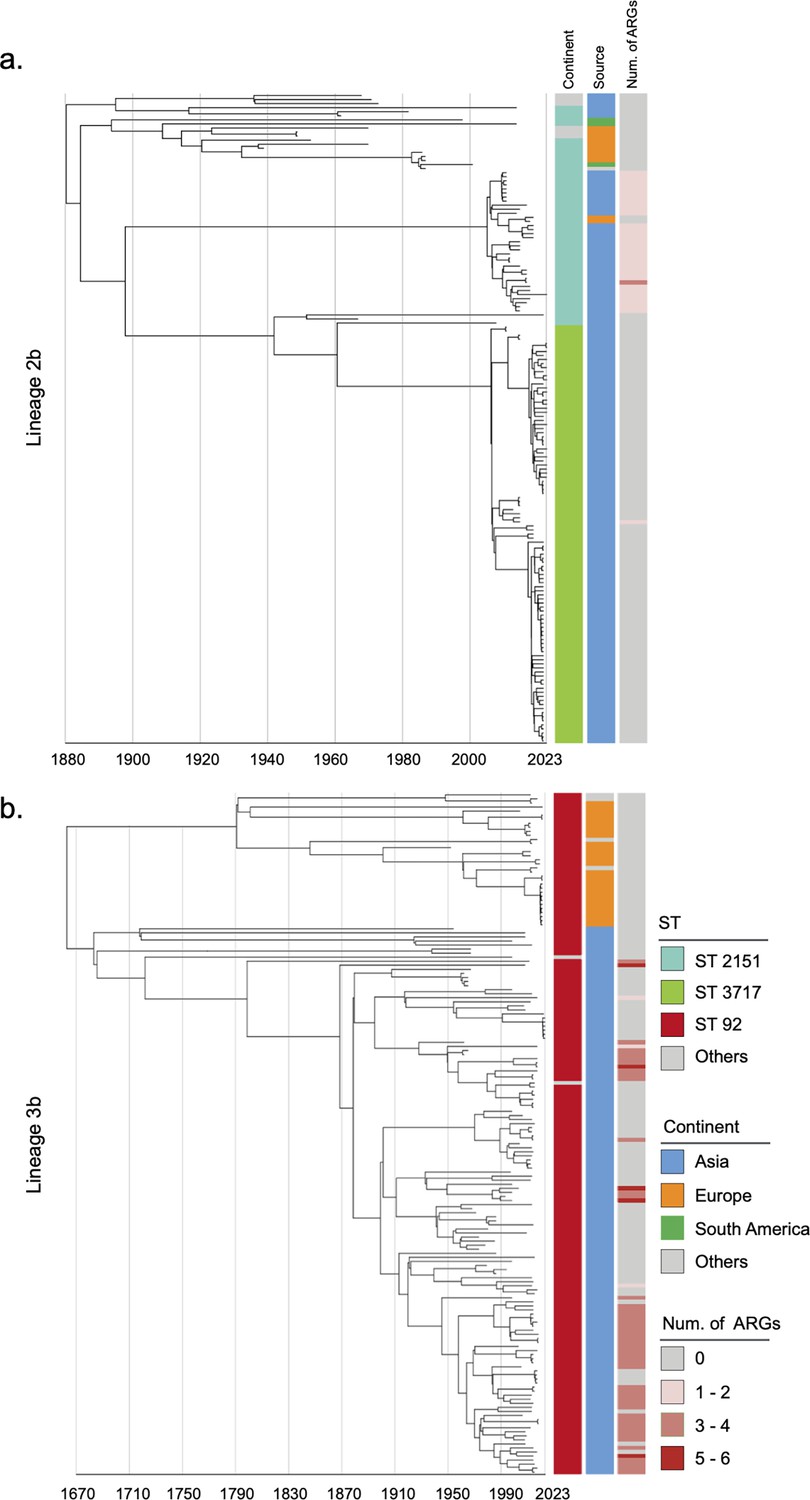
Phylogenetic tree of S. Gallinarum L2b and L3b based on a spatiotemporal Bayesian framework.
The phylogenetic tree on the left was constructed using a reference-mapped multiple core-genome SNPs sequence alignment, with recombination regions detected and removed by Gubbins. The spatiotemporal Bayesian framework was configured with the ‘GTR’ substitution model, 4 Gamma Category Count, ‘Relaxed Clock Log Normal’ model, ‘Coalescent Bayesian Skyline’ tree prior model, and a Markov Chain Monte Carlo (MCMC) chain length of 100,000,000, with sampling every 10,000 iterations. Convergence was assessed using Tracer, ensuring all parameter effective sampling sizes (ESS) exceeded 200. Evolutionary time is represented by the length of the branches. The heatmap on the right displays, respectively, the sequence type (ST), region of isolation, and the number (Num.) of antimicrobial resistance genes (ARGs) carried by the corresponding Salmonella Gallinarum. (a) indicates the phylogenetic tree for Lineage 2b, (b) indicates the phylogenetic tree for Lineage 3b.
Figure 2—figure supplement 1
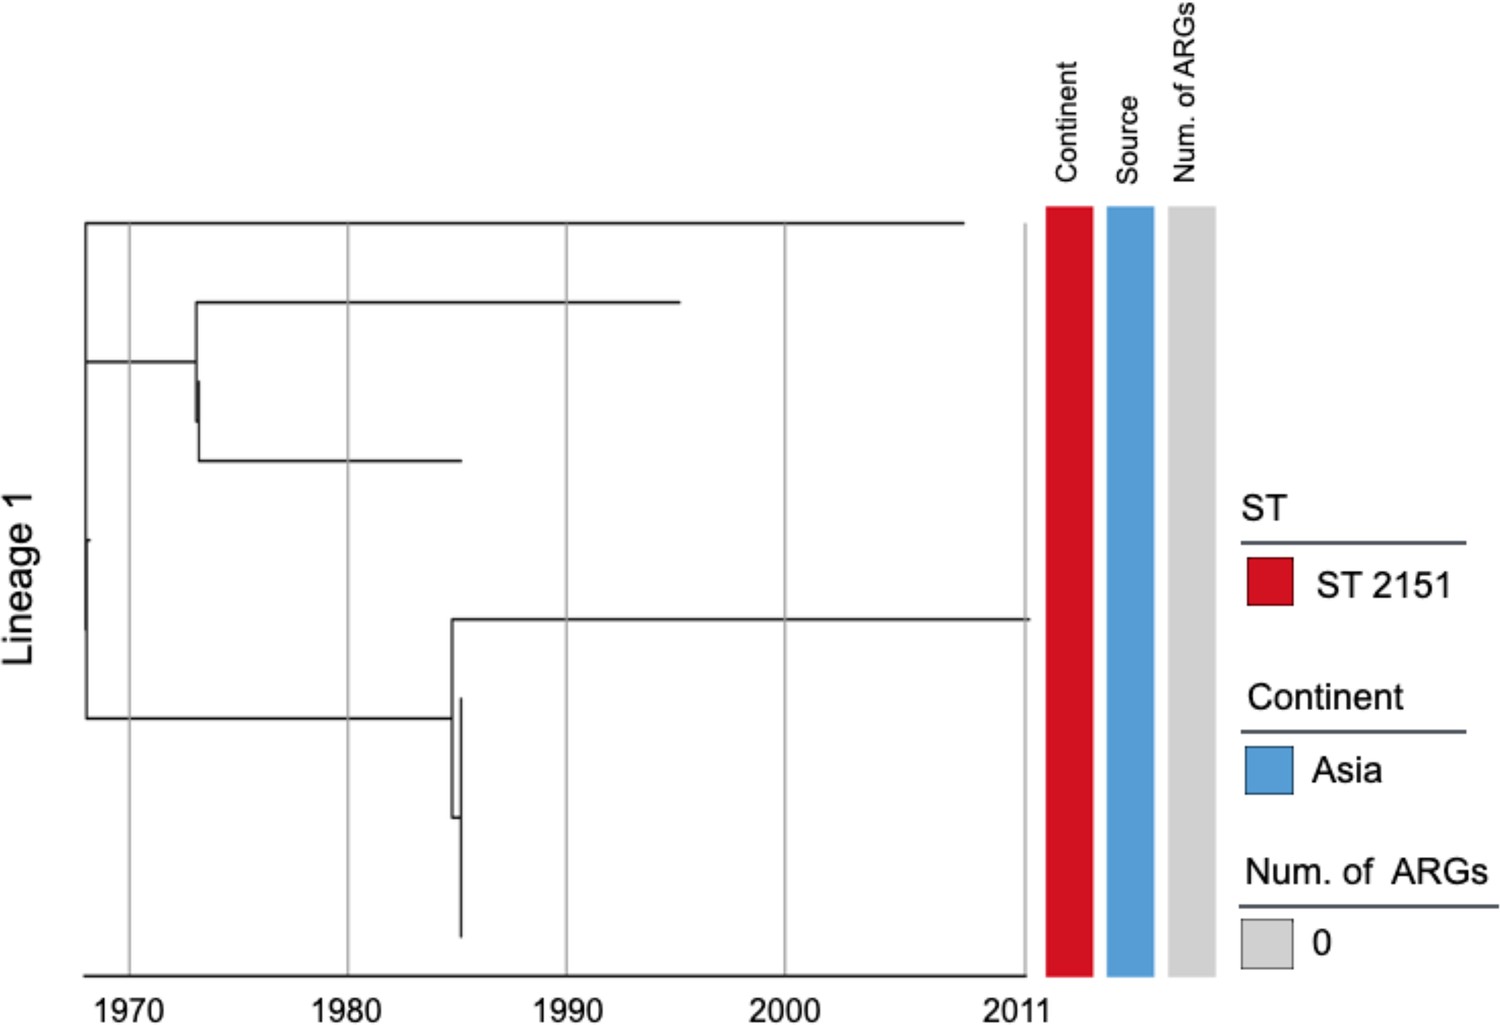
Phylogenetic tree of Salmonella Gallinarum L1 based on a spatiotemporal Bayesian framework.
The phylogenetic tree on the left was constructed using a reference-mapped multiple core-genome SNPs sequence alignment, with recombination regions detected and removed by Gubbins. The spatiotemporal Bayesian framework was configured with the ‘GTR’ substitution model, 4 Gamma Category Count, ‘Relaxed Clock Log Normal’ model, ‘Coalescent Bayesian Skyline’ tree prior model, and a Markov Chain Monte Carlo (MCMC) chain length of 100,000,000, with sampling every 10,000 iterations. Convergence was assessed using Tracer, ensuring all parameter effective sampling sizes (ESS) exceeded 200. Evolutionary time is represented by the length of the branches. The heatmap on the right displays, respectively, the sequence type (ST), region of isolation, and the number (Num.) of antimicrobial resistance genes (ARGs) carried by the corresponding Salmonella Gallinarum.
Figure 2—figure supplement 2
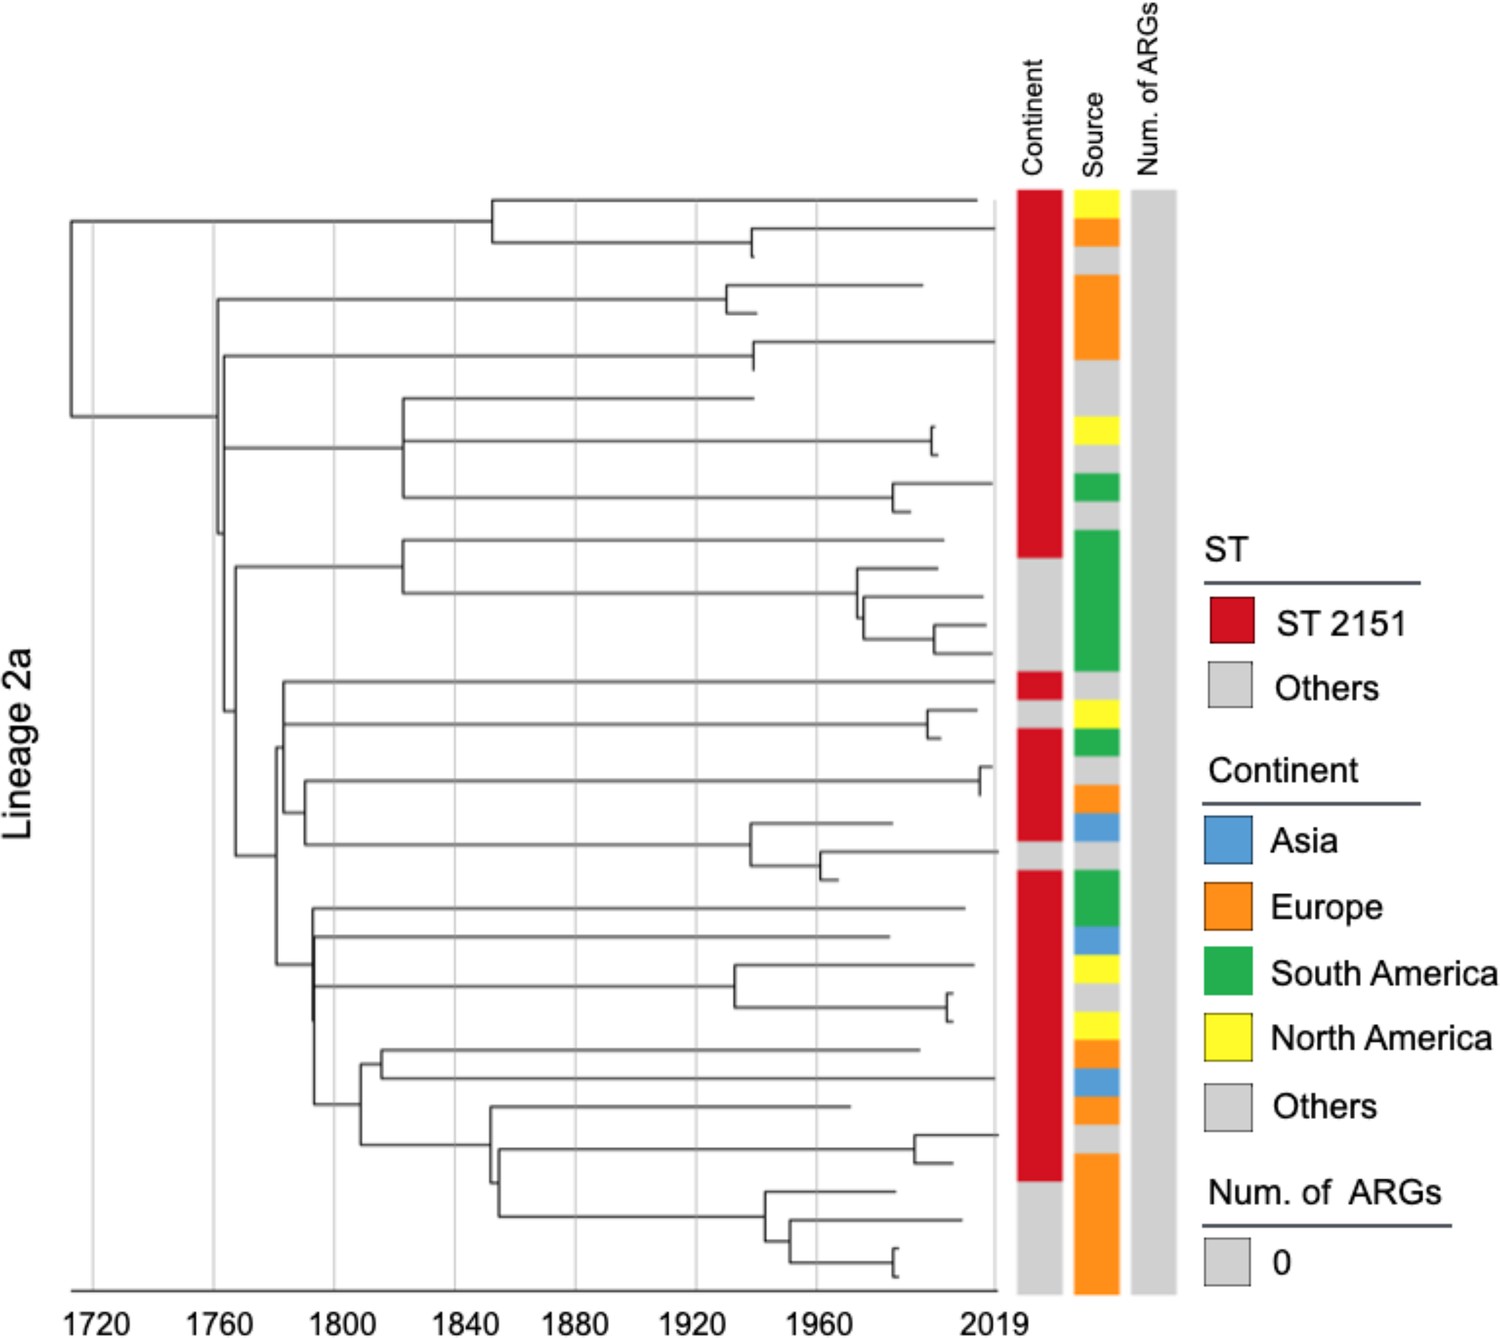
Phylogenetic tree of Salmonella Gallinarum L2a based on a spatiotemporal Bayesian framework.
The phylogenetic tree on the left was constructed using a reference-mapped multiple core-genome SNPs sequence alignment, with recombination regions detected and removed by Gubbins. The spatiotemporal Bayesian framework was configured with the ‘GTR’ substitution model, 4 Gamma Category Count, ‘Relaxed Clock Log Normal’ model, ‘Coalescent Bayesian Skyline’ tree prior model, and a Markov Chain Monte Carlo (MCMC) chain length of 100,000,000, with sampling every 10,000 iterations. Convergence was assessed using Tracer, ensuring all parameter effective sampling sizes (ESS) exceeded 200. Evolutionary time is represented by the length of the branches. The heatmap on the right displays, respectively, the sequence type (ST), region of isolation, and the number (Num.) of antimicrobial resistance genes (ARGs) carried by the corresponding Salmonella Gallinarum.
Figure 2—figure supplement 3
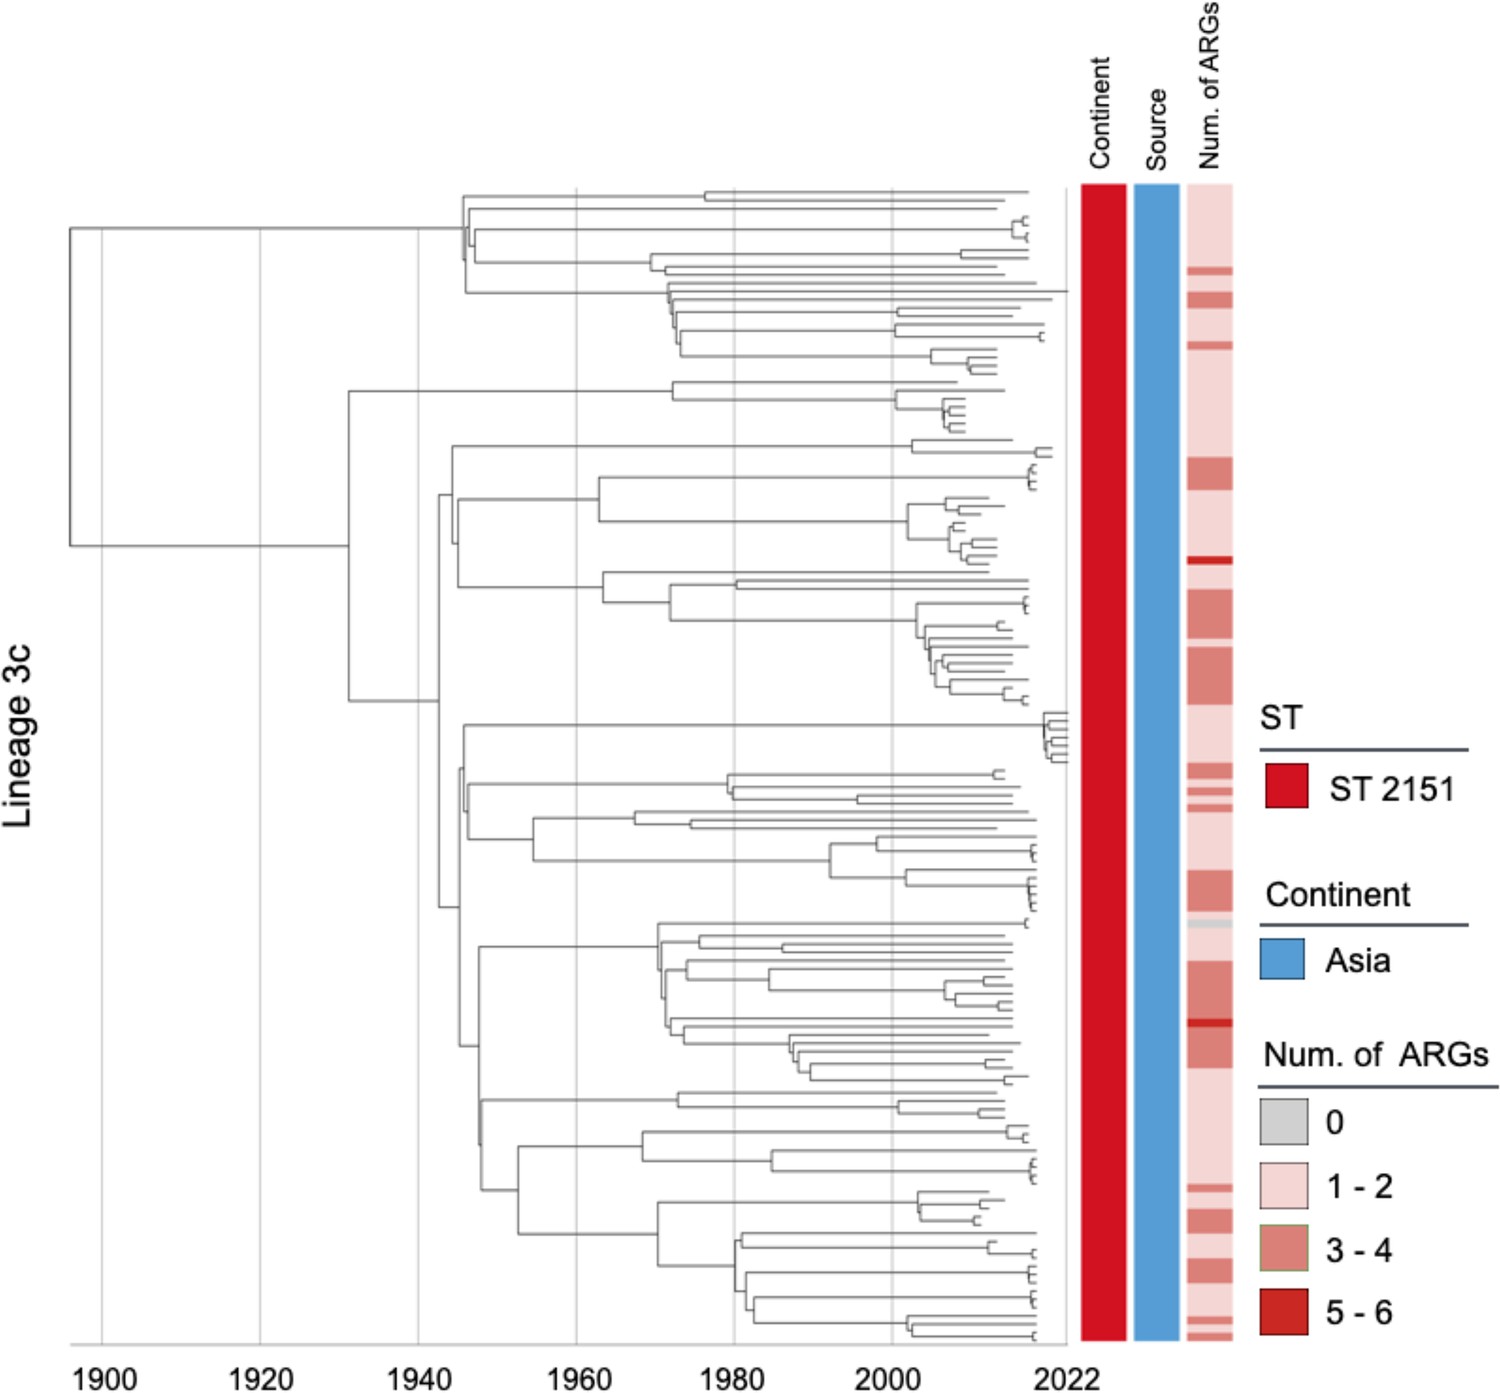
Phylogenetic tree of Salmonella Gallinarum L3c based on a spatiotemporal Bayesian framework.
The phylogenetic tree on the left was constructed using a reference-mapped multiple core-genome SNPs sequence alignment, with recombination regions detected and removed by Gubbins. The spatiotemporal Bayesian framework was configured with the ‘GTR’ substitution model, 4 Gamma Category Count, ‘Relaxed Clock Log Normal’ model, ‘Coalescent Bayesian Skyline’ tree prior model, and a Markov Chain Monte Carlo (MCMC) chain length of 100,000,000, with sampling every 10,000 iterations. Convergence was assessed using Tracer, ensuring all parameter effective sampling sizes (ESS) exceeded 200. Evolutionary time is represented by the length of the branches. The heatmap on the right displays, respectively, the sequence type (ST), region of isolation, and the number (Num.) of antimicrobial resistance genes (ARGs) carried by the corresponding Salmonella Gallinarum.
Figure 2—figure supplement 4
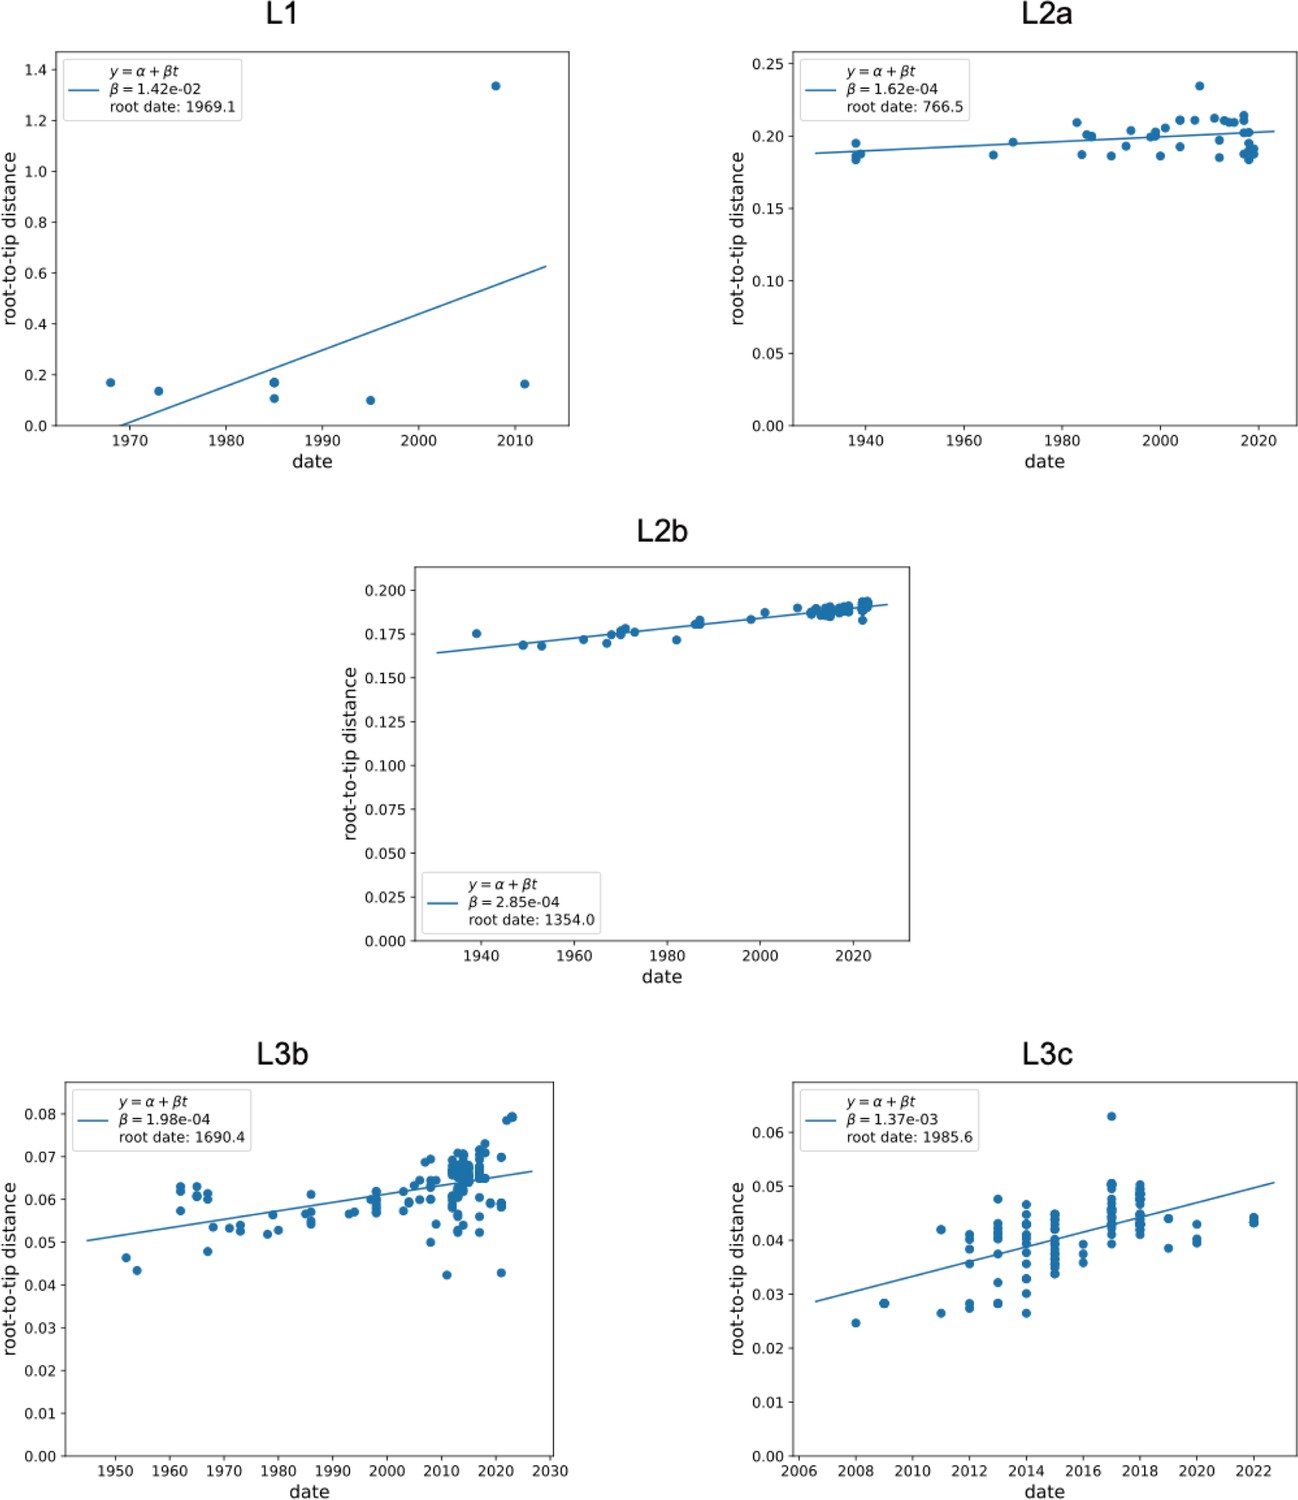
Assessment of the temporal structure (L1-L3c).
The plots depict the root-to-tip regression analysis for the Salmonella maximum likelihood tree, generated using TreeTime software. Each data point on the plot represents a measurement from the root to each tip in the tree, with the solid line indicating the regression line.
Figure 2—figure supplement 5
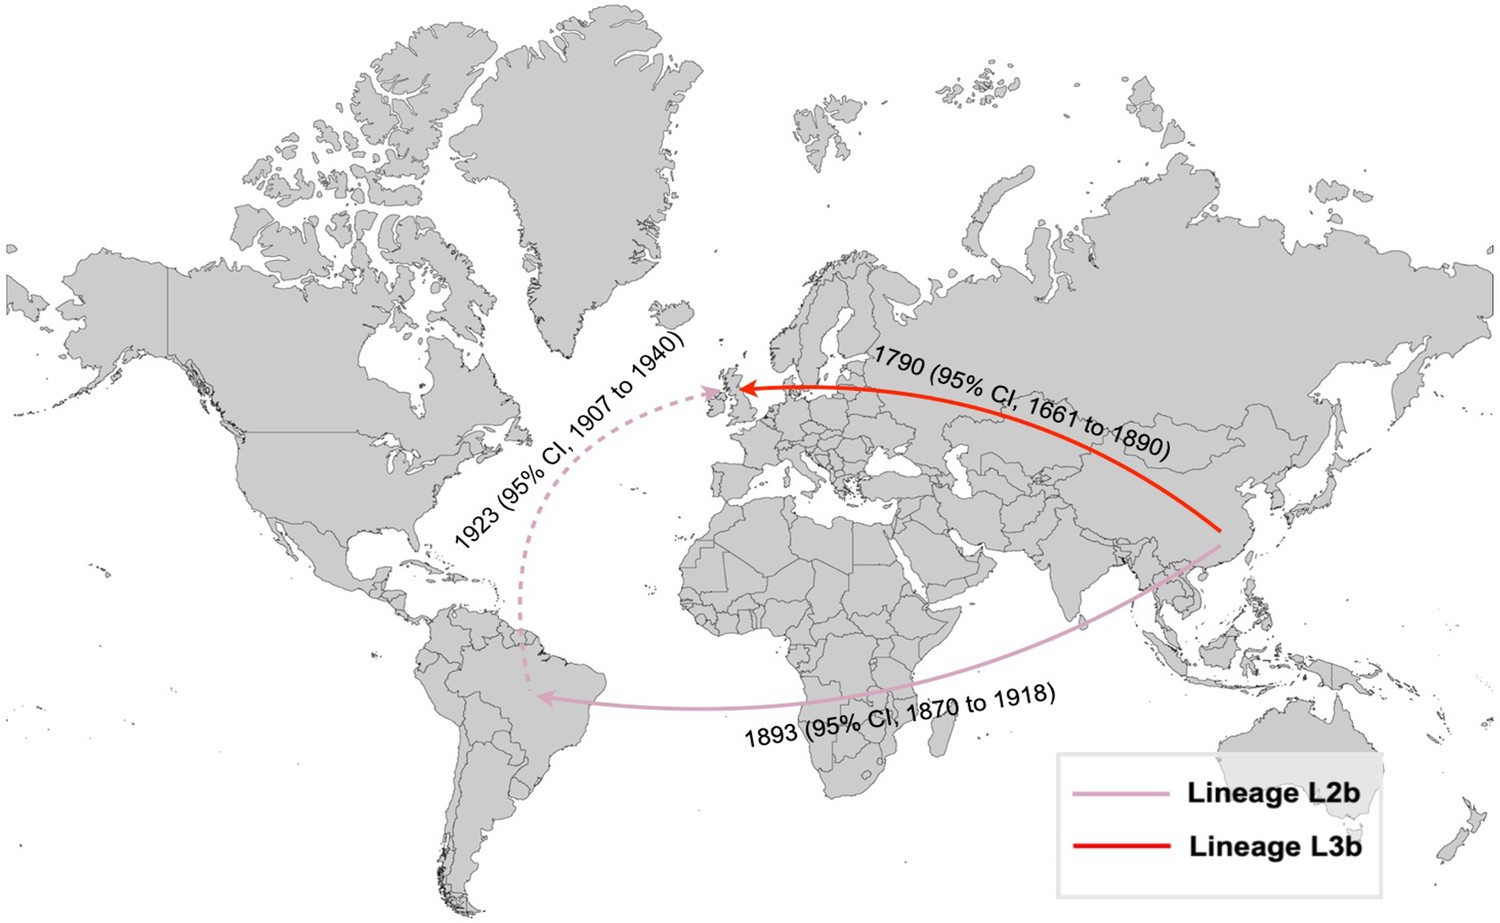
Historical international transmissions of S. Gallinarum biovar Pullorum (bvSP) lineages L2b and L3b are depicted with arrows representing the transmission paths. The pink and red lines represent L2b and L3b, respectively.
Figure 2—figure supplement 6
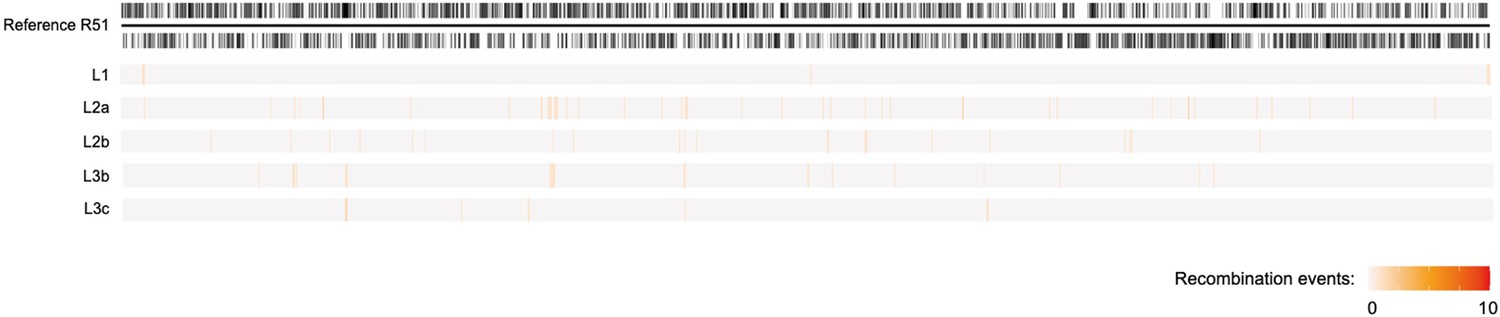
Recombination removal using Gubbins.
Recombination in five lineages (L1, L2a, L2b, L3b, L3c) were removed using Gubbins with default parameters. The recombination regions for each lineage were mapped onto the reference genome, S. Gallinarum R51. Different colors represent the number of recombination events in each S. Gallinarum lineages strains, with darker colors indicating higher frequencies of recombination.
Figure 3 with 1 supplement
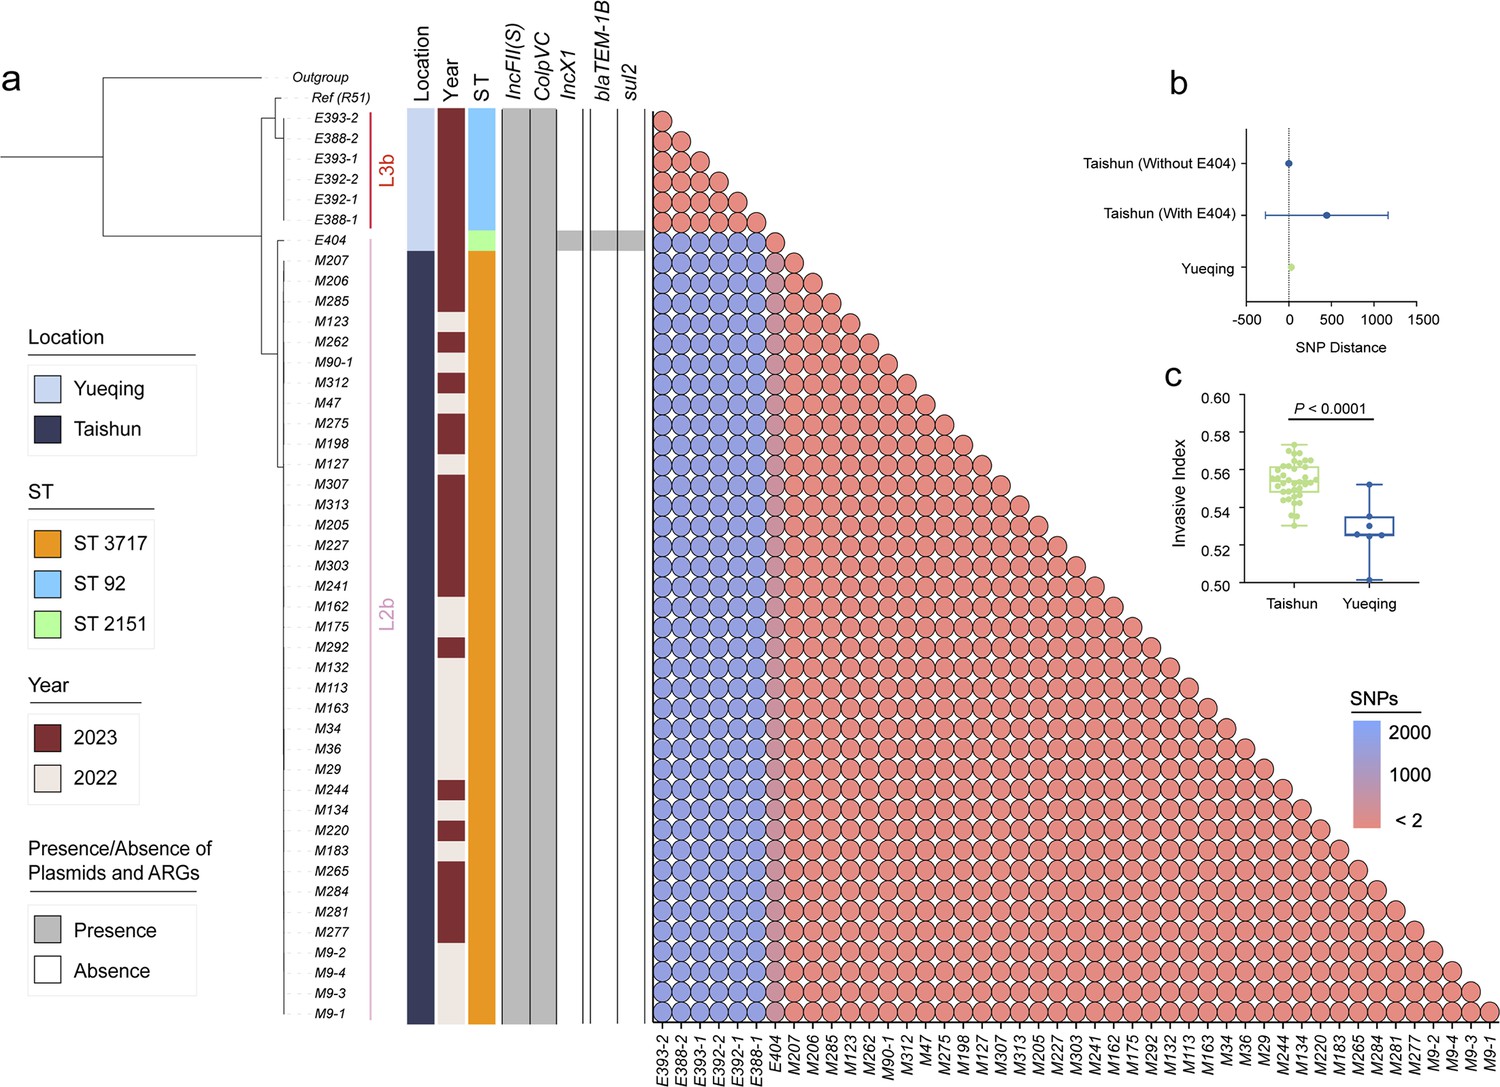
Genomic characteristics of 45 newly isolated S. Gallinarum biovar Pullorum (bvSP) strains from Taishun and Yueqing, Zhejiang Province, China.
(a) The phylogenetic tree, constructed using core-genome single nucleotide polymorphism sites (cgSNPs), categorizes the 45 bvSP strains into two distinct lineages (L3b and L2b). On the left side of the heatmap, information on isolation regions, sequence types (STs), and sampling times are displayed, with various colors indicating different categories as specified on the left. The right section of the heatmap presents a detailed matrix showing plasmids, antimicrobial resistance genes (ARGs), and cgSNP distances. The presence of a plasmid or ARG in an isolate is denoted by gray shading, while absence is indicated by white. cgSNPs below two were used as the threshold, with red circles signifying a higher probability of transmission between isolate pairs. (b) The average cgSNP distance between isolates from Taishun and Yueqing. E404 led to an increase in the mean cgSNP distance of bvSP from Taishun. (c) Invasiveness index of bvSP in Taishun and Yueqing. The results show a higher invasiveness index for bvSP isolated from Taishun, indicating that bvSP isolated from Taishun might have greater invasive capabilities among vulnerable hens.
Figure 3—figure supplement 1
Potential transmission events (n=53) of S. Gallinarum biovar Pullorum (bvSP).
The core-genome single nucleotide polymorphism site (cgSNP) distances were calculated between the bvSP strains isolated from Zhejiang Province (n=95) and those from China with available provincial information (n=435). Only cgSNP distances less than two are depicted, with darker colors indicating a higher transmission event.
Figure 4 with 2 supplements
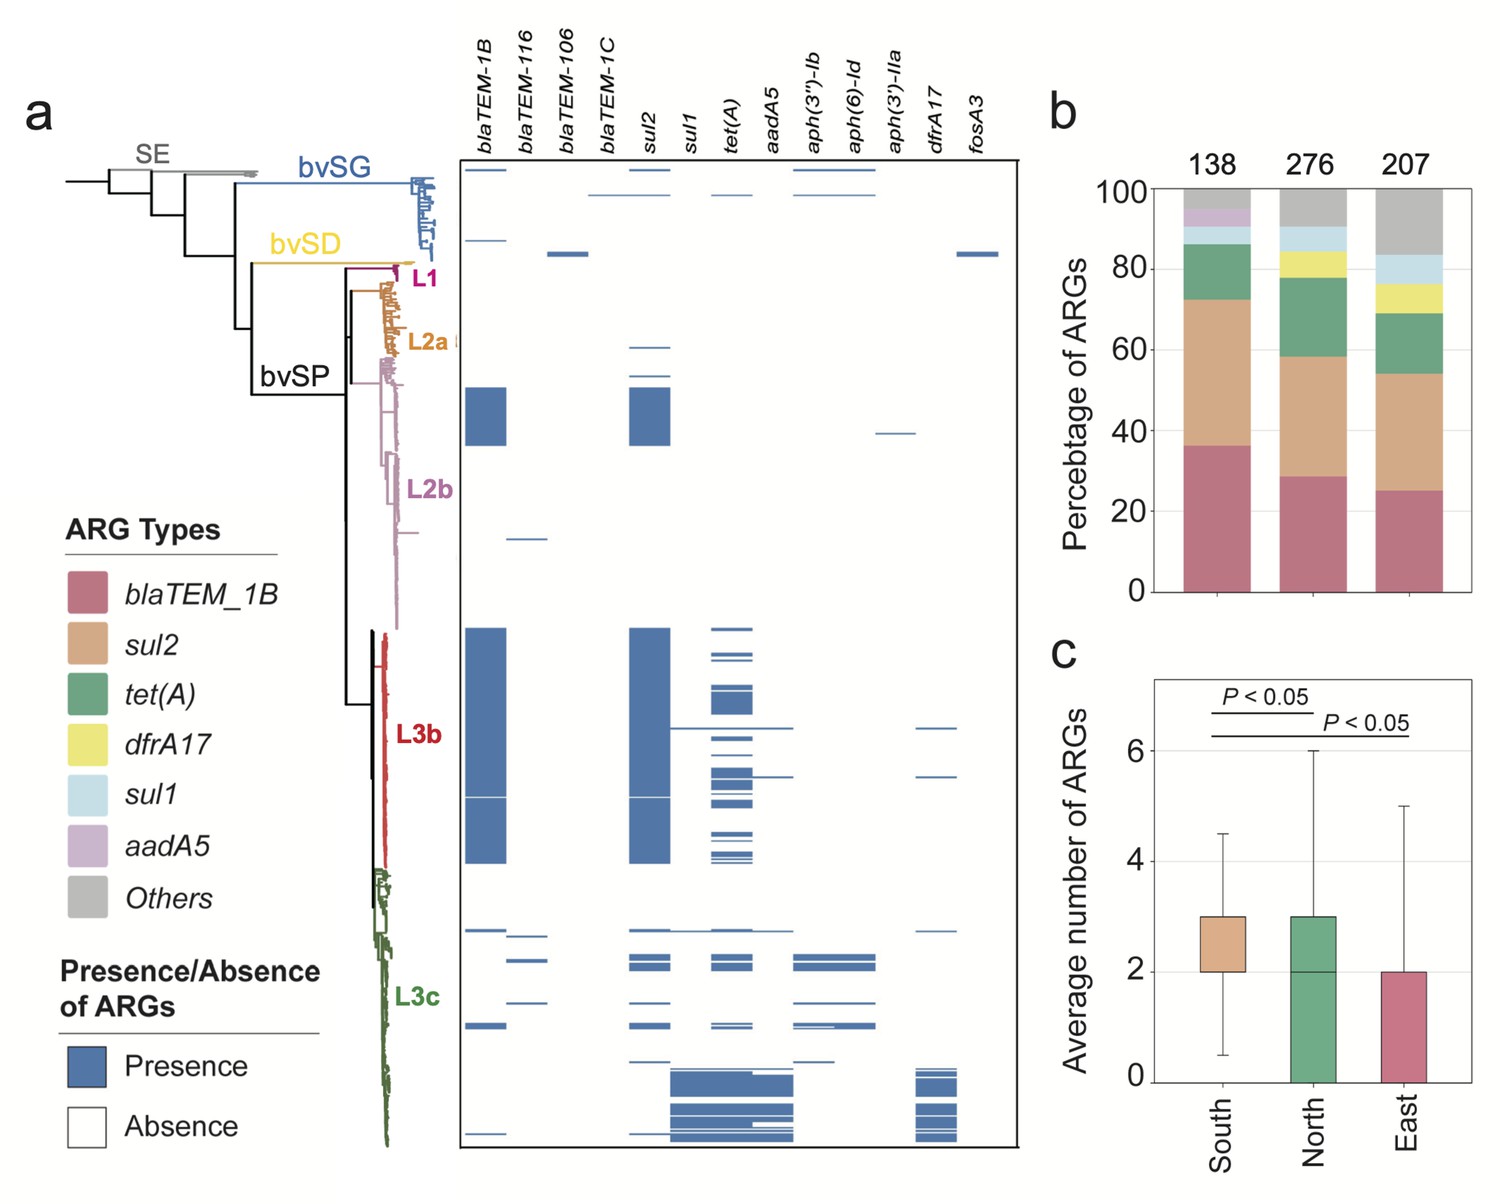
The antimicrobial resistance genes (ARGs) carried by S. Gallinarum.
(a) The phylogenetic tree was constructed using core-genome single nucleotide polymorphism sites (cgSNPs), revealing three S. Gallinarum biovars: S. Gallinarum biovar Pullorum (bvSP), S. Gallinarum biovar Duisburg (bvSD), and S. Gallinarum biovar Gallinarum (bvSG). Additionally, Salmonella serovar Enteritidis (SE) is represented by a gray line. Further, bvSP can be subdivided into five lineages: fuchsia (L1), orange (L2a), pink (L2b), red (L3b), and green (L3c). The heatmap on the right indicates the resistome carried by the corresponding Salmonella. (b) The dominant resistome types in different regions of China. The y-axis represents the percentage of each dominant resistome. The total sample size for each bar is indicated at the top. (c) The average number of resistome carried by bvSP is from different regions of China.
Figure 4—figure supplement 1
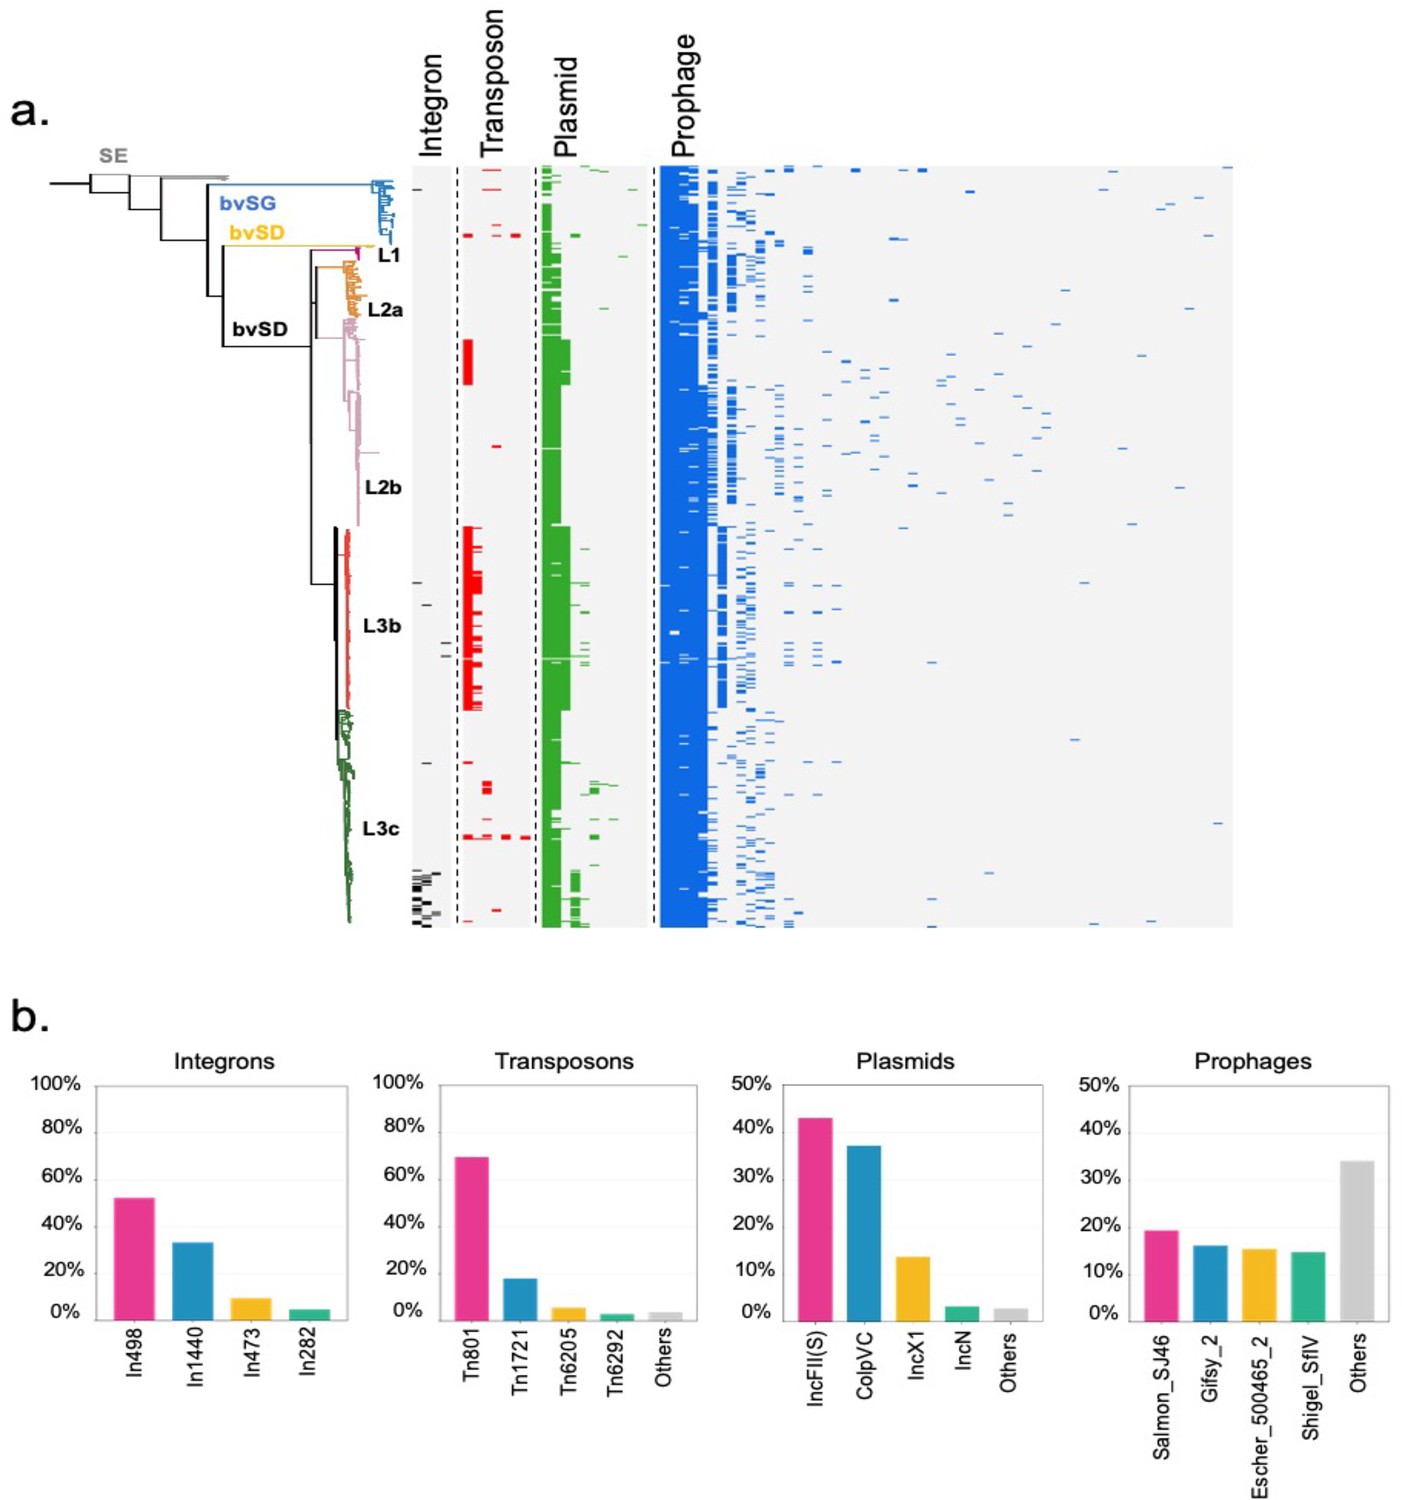
The carriage of four predominant mobilome.
(a) The phylogenetic tree of S. Gallinarum was constructed using core-genome single nucleotide polymorphism sites (cgSNPs), with distinct colors representing each S. Gallinarum biovar; Salmonella serovar Enteritidis (SE) is depicted in gray. Furthermore, different colors are assigned to represent various lineages of bvSP: fuchsia for L1, orange for L2a, pink for L2b, red for L3b, and green for L3c. Heatmaps on the right side illustrate the presence of integrons, transposons, plasmids, and prophages carried by the corresponding Salmonella strains. (b) Predominant types of mobilomes prevalent among bvSP are depicted. The x-axis of the bar graph illustrates the top four mobilome types in bvSP based on the total count within each category.
Figure 4—figure supplement 2
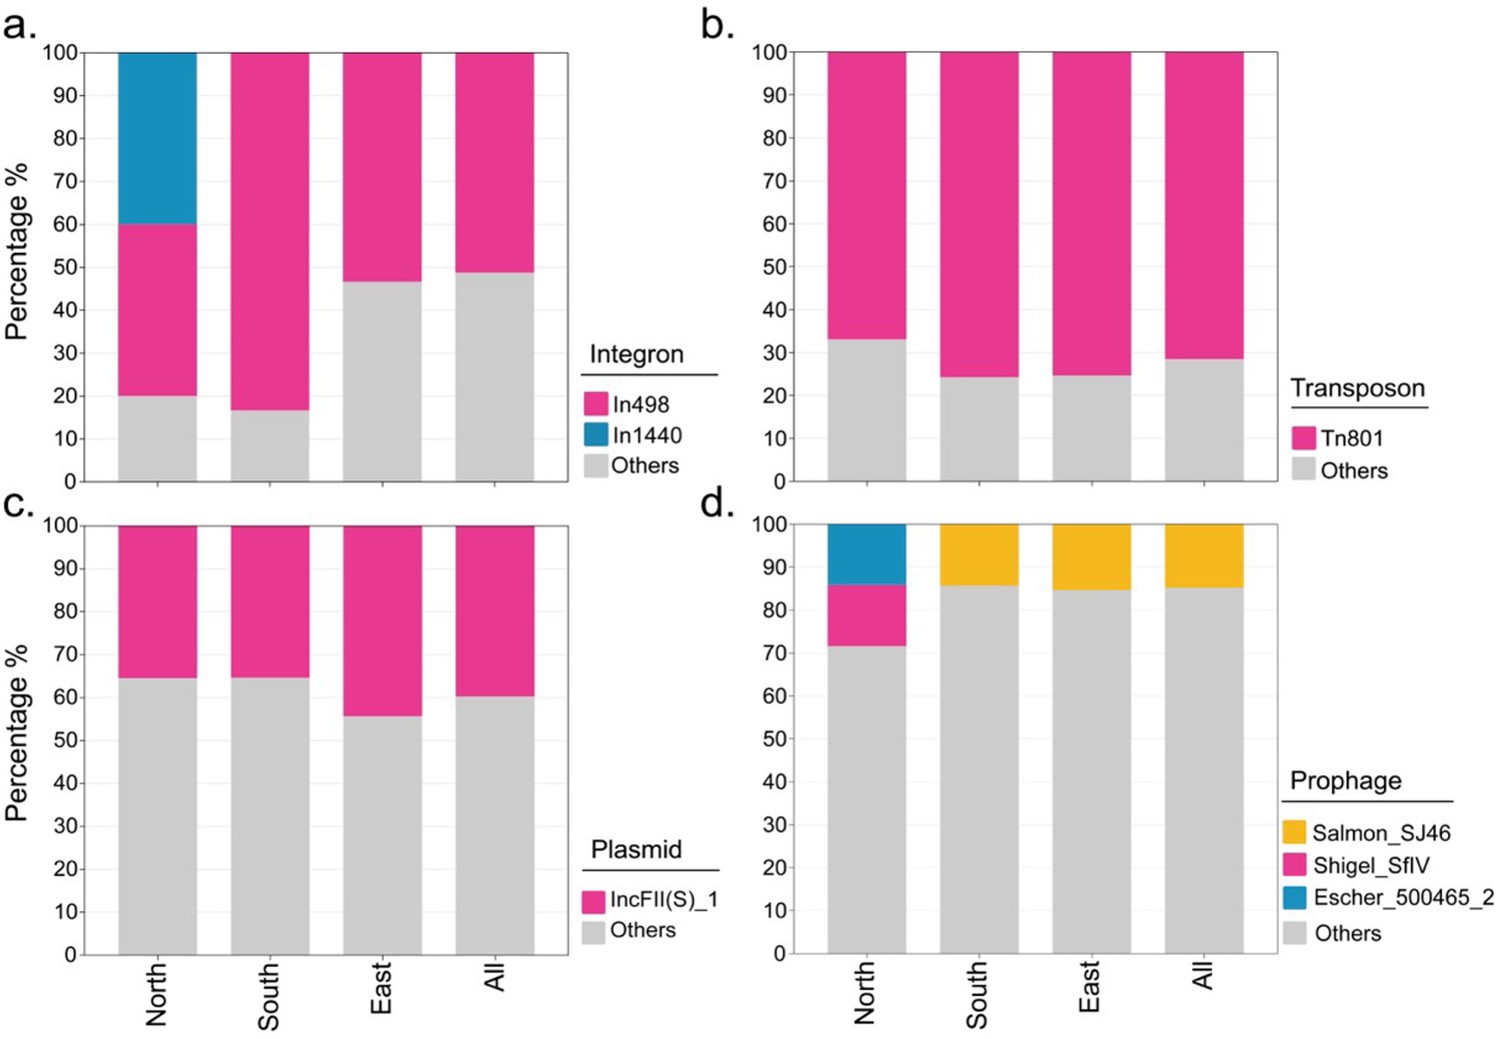
Types of predominant mobile genetic elements carried by various regions.
(a–d) presents integron, transposon, plasmid, and prophage, respectively.
Figure 5 with 1 supplement
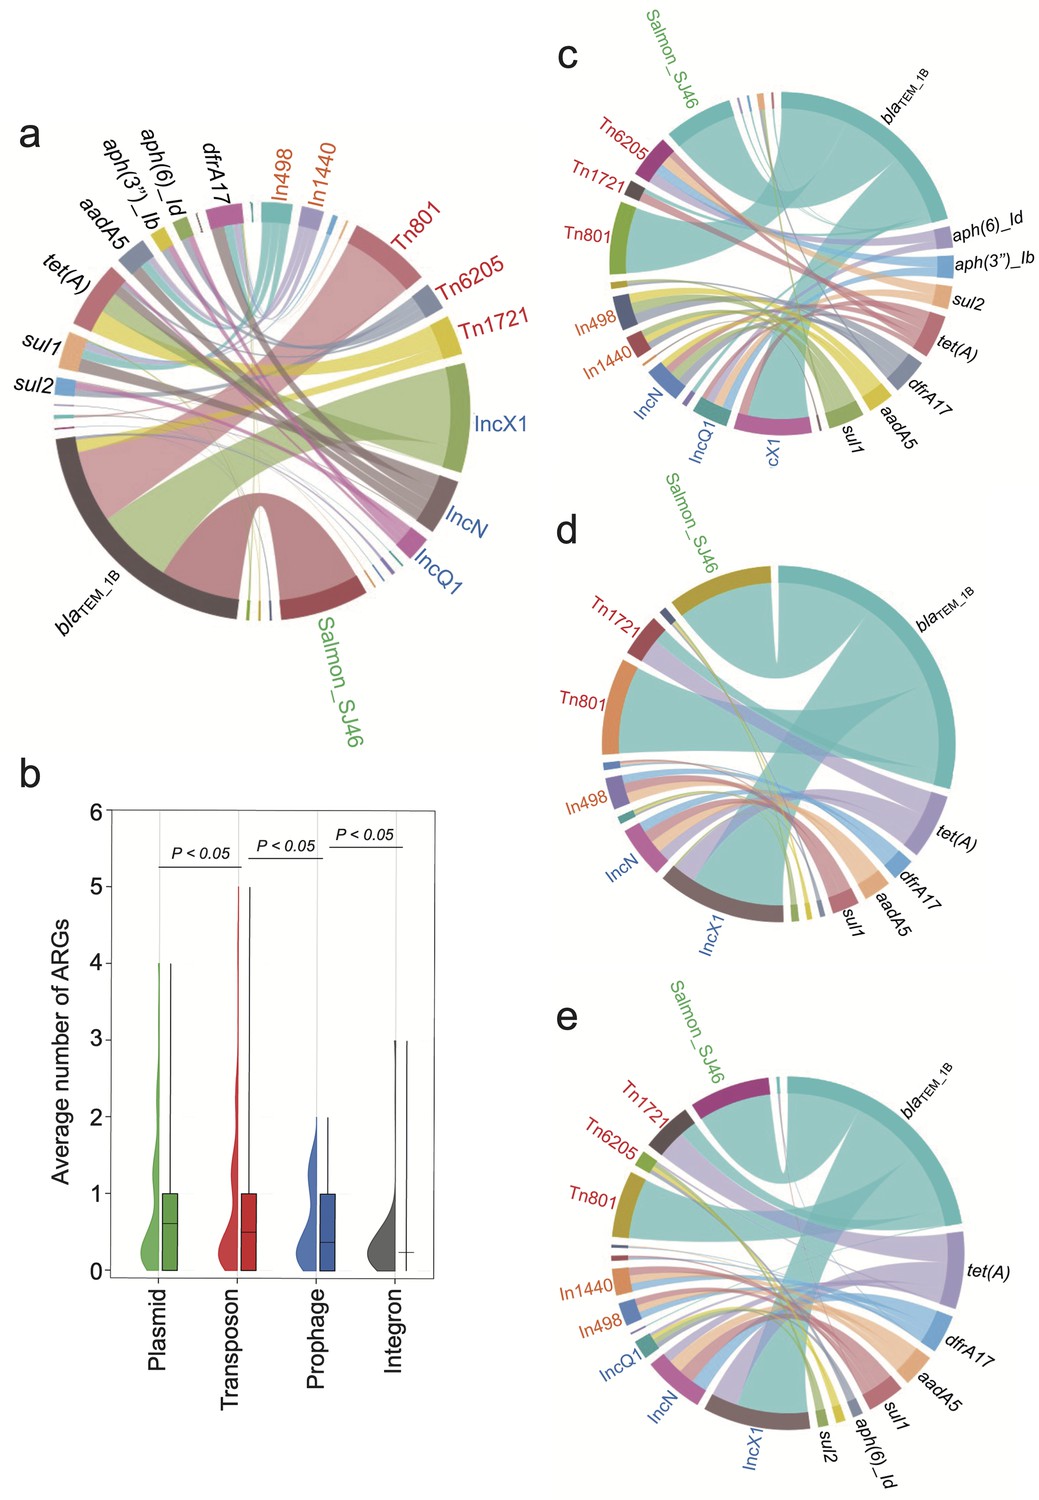
The primary source of resistome is carried by distinct mobilome.
Different font colors denote various mobilome types. Specifically, orange signifies integrons, red denotes transposons, blue represents plasmids, and green indicates prophages. A black font is utilized to distinguish the categories of resistome. The connecting line between the resistome and the mobilome represents the potential carrying relationship. (a) The mobilome-carried antimicrobial resistance genes (ARGs) among S. Gallinarum biovar Pullorum (bvSP). (b) The average number of ARGs carried by the four mobilome genetic elements (MGEs) in bvSP. The unpaired t-test was used to compare the differences between isolates, with p<0.05 considered statistically significant. (c–e) The mobilome-carried ARGs among bvSP isolated from the eastern, southern, and northern regions of China.
Figure 5—figure supplement 1
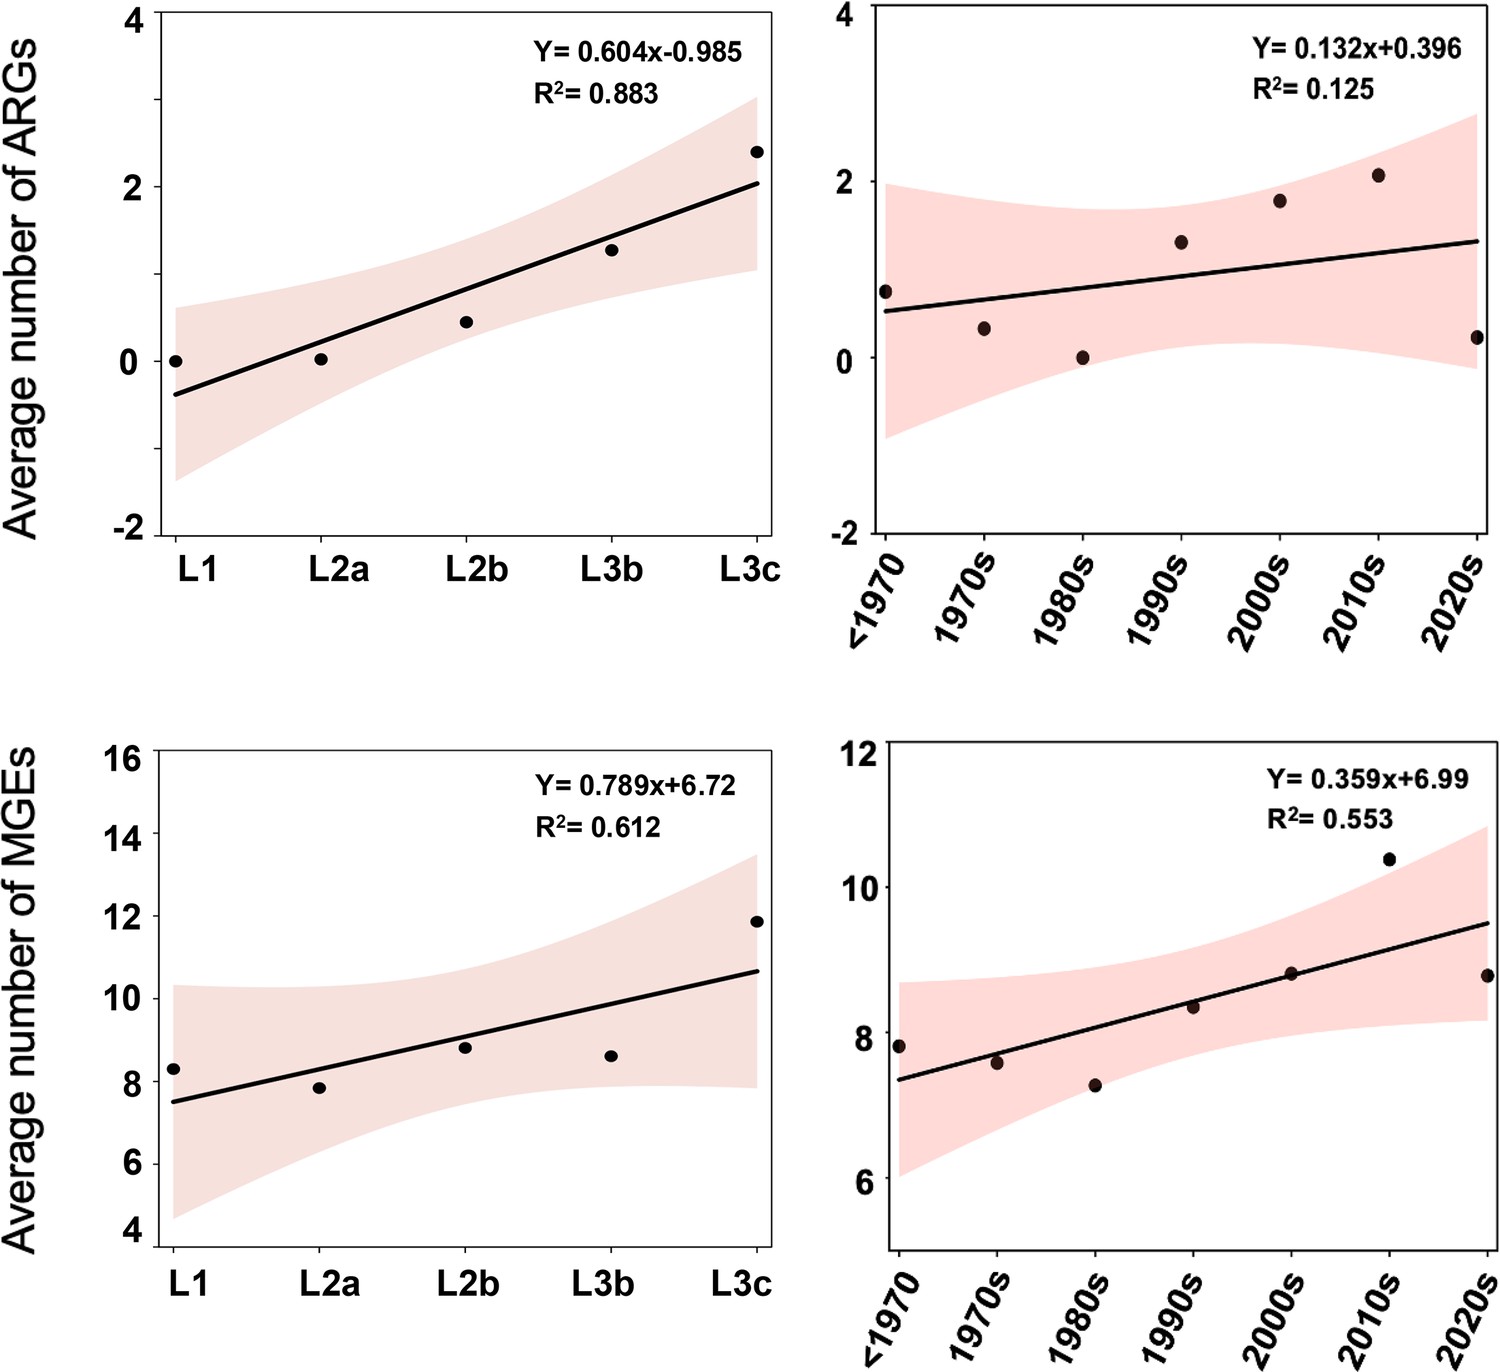
Trends in both resistome and mobilome quantities over time and across lineages.
Figure 6
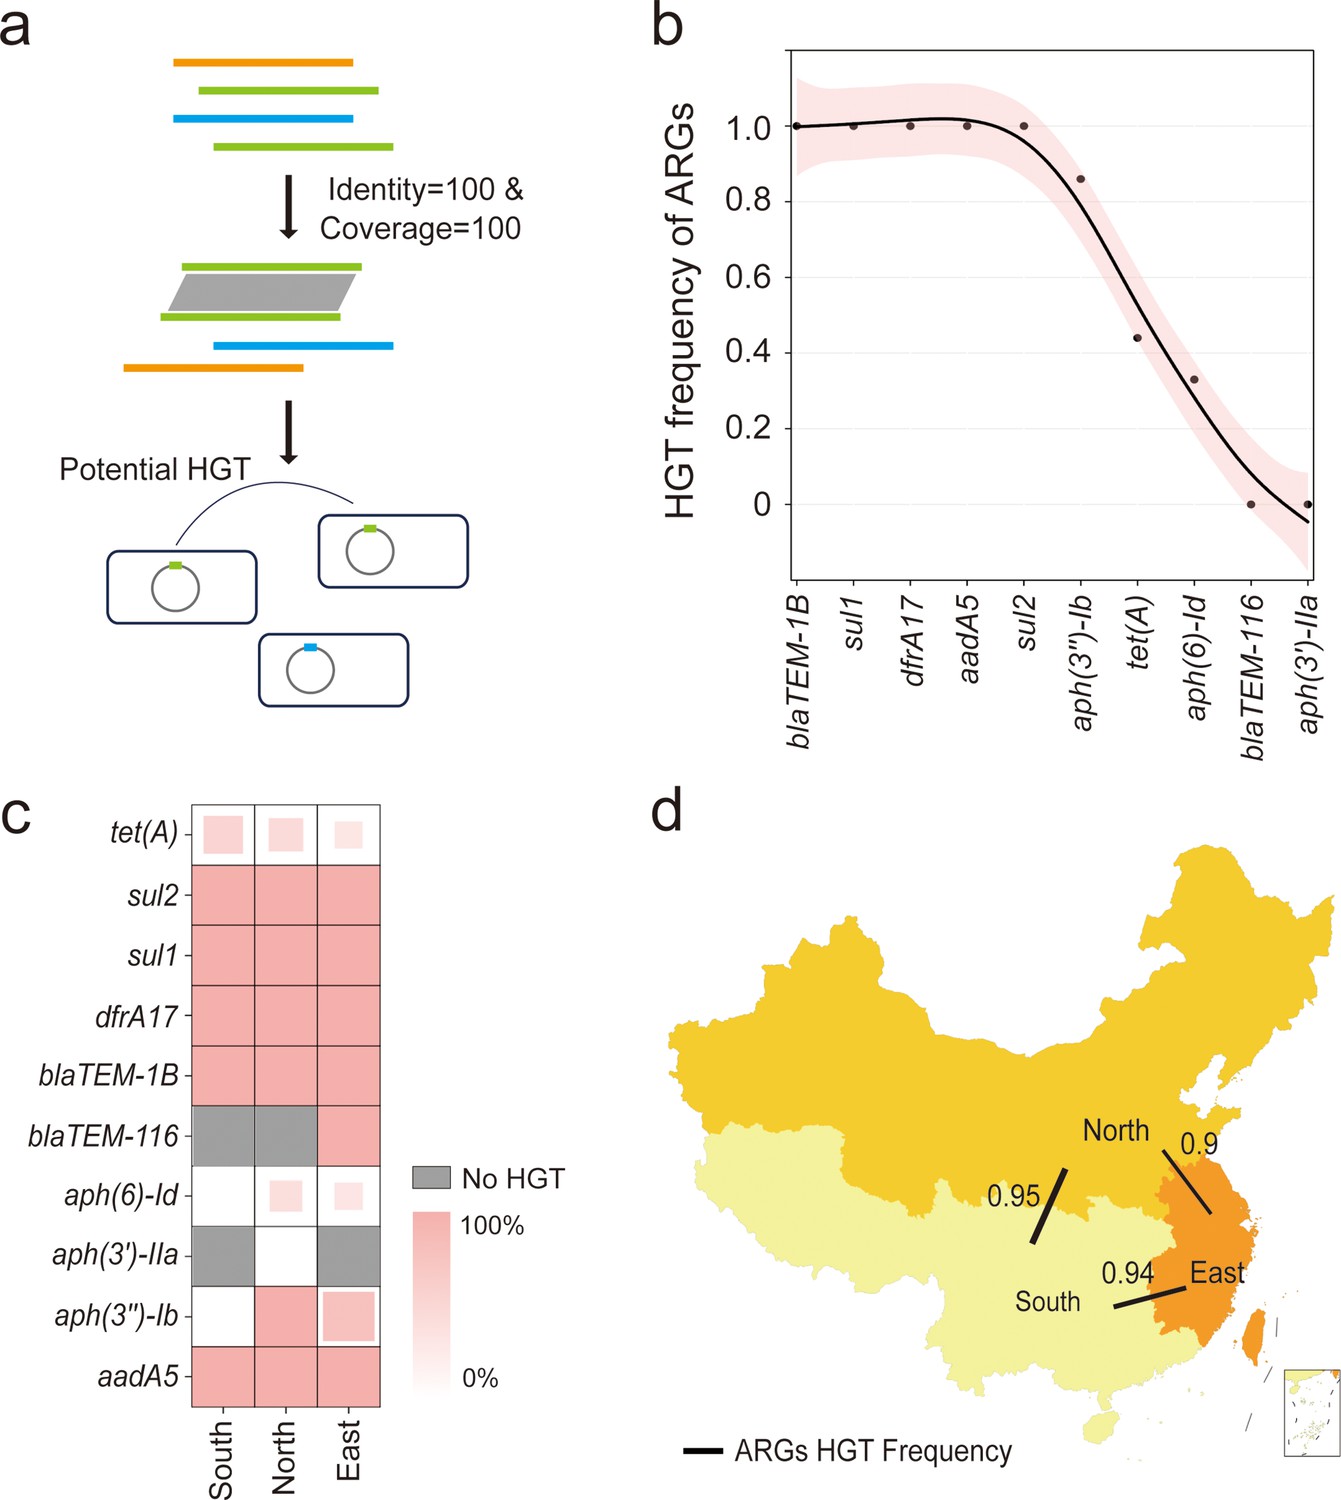
The horizontal gene transfer (HGT) frequency of the resistome among S. Gallinarum biovar Pullorum (bvSP) isolated from China.
(a) Workflow for identification of horizontally transferred antimicrobial resistance genes (ARGs) in Salmonella. (b) The x-axis represents the resistome of bvSP, while the y-axis represents the corresponding levels of HGT frequency. (c) The HGT frequency level of specific ARGs carried by bvSP isolated from various regions of China. Deeper colors mean higher HGT frequency. (d) The frequency of horizontal retransmission of the resistome between different regions of China. A higher value indicates more frequent transfer events of resistome between two regions. The colors on the map represent the number of bvSP isolates in each region. Darker colors indicate a higher number of bvSP isolates in that area.
Author response image 1
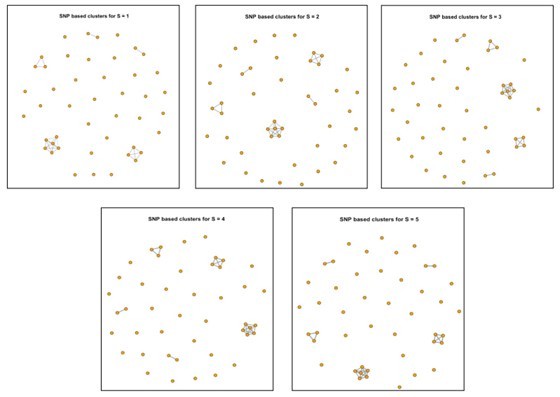
Clustering results of 45 newly isolated S. Gallinarum strains using different SNP thresholds of 1, 2, 3, 4, and 5 SNPs.
The five subplots represent the clustering results under each threshold. Each point corresponds to an individual strain, and lines connect strains with potential transmission relationships.
Additional files
-
Supplementary file 1
Information on 45 newly isolated S. Gallinarum biovar Pullorum (bvSP) originated from Yueqing and Taishun used in this study.
- https://cdn.elifesciences.org/articles/101241/elife-101241-supp1-v1.xlsx
-
Supplementary file 2
Information on 540 Salmonella isolates was obtained from public sources to assemble the global database, with 325 sequences previously preserved in our laboratory.
- https://cdn.elifesciences.org/articles/101241/elife-101241-supp2-v1.xlsx
-
Supplementary file 3
The regional classification of 436 S. Gallinarum biovar Pullorum (bvSP) strains isolated from China was conducted.
- https://cdn.elifesciences.org/articles/101241/elife-101241-supp3-v1.xlsx
-
Supplementary file 4
Information on calculation of invasiveness index for 45 S. Gallinarum biovar Pullorum (bvSP) isolates newly originated from Yueqing and Taishun.
- https://cdn.elifesciences.org/articles/101241/elife-101241-supp4-v1.xlsx
-
Supplementary file 5
SNP distance-based tracing analysis for the 95 strains from Zhejiang Province and those from China with available provincial information (n=435).
Only strains with an SNP distance of two or fewer are considered likely to be involved in potential transmission events.
- https://cdn.elifesciences.org/articles/101241/elife-101241-supp5-v1.xlsx
-
Supplementary file 6
Information on antimicrobial resistance genes carried by 528 S. Gallinarum biovar Pullorum (bvSP) isolates.
- https://cdn.elifesciences.org/articles/101241/elife-101241-supp6-v1.xlsx
-
Supplementary file 7
Information on plasmids, transposons, integrons, and prophages carried by 528 S. Gallinarum biovar Pullorum (bvSP) isolates.
- https://cdn.elifesciences.org/articles/101241/elife-101241-supp7-v1.xlsx
-
Supplementary file 8
A co-localization analysis was conducted to assess each antimicrobial resistance gene’s (ARG)’s association with mobile genetic elements (MGEs).
Among 621 ARGs identified in 436 S. Gallinarum biovar Pullorum (bvSP) isolates collected across China, 415 ARGs were found to be located on MGEs.
- https://cdn.elifesciences.org/articles/101241/elife-101241-supp8-v1.xlsx
-
Supplementary file 9
Detection of horizontal gene transfer (HGT) of antimicrobial resistance genes (ARGs) carried by mobile genetic elements in S. Gallinarum biovar Pullorum (bvSP) genomes from China.
Using the HGTphyloDetect pipeline, we calculated the Alien Index (AI) score and out_perc values for each ARG sequences. ARGs with AI score≥45 and out_perc≥90% were identified as potential candidates for horizontal ARGs transfer. Additionally, based on BLAST hit scores, we determined the most likely donor organisms for these ARGs.
- https://cdn.elifesciences.org/articles/101241/elife-101241-supp9-v1.xlsx
-
Supplementary file 10
The horizontal gene transfer (HGT) frequency value for specific antimicrobial resistance genes was identified from S. Gallinarum biovar Pullorum (bvSP) isolated from different regions of China.
- https://cdn.elifesciences.org/articles/101241/elife-101241-supp10-v1.xlsx
-
MDAR checklist
- https://cdn.elifesciences.org/articles/101241/elife-101241-mdarchecklist1-v1.docx
Download links
A two-part list of links to download the article, or parts of the article, in various formats.
Downloads (link to download the article as PDF)
Open citations (links to open the citations from this article in various online reference manager services)
Cite this article (links to download the citations from this article in formats compatible with various reference manager tools)
Avian-specific Salmonella transition to endemicity is accompanied by localized resistome and mobilome interaction
eLife 13:RP101241.
https://doi.org/10.7554/eLife.101241.4


