PA28γ promotes the malignant progression of tumor by elevating mitochondrial function via C1QBP
- State Key Laboratory of Oral Diseases & National Center for Stomatology & National Clinical Research Center for Oral Diseases & Research Unit of Oral Carcinogenesis and Management & Chinese Academy of Medical Sciences, West China Hospital of Stomatology, Sichuan University, China
- Department of Stomatology, The First Affiliated Hospital with Nanjing Medical University, China
- State Key Laboratory of Biotherapy and Cancer Center, West China Hospital, Sichuan University and Collaborative Innovation Center for Biotherapy, China
Figures
Figure 1 with 1 supplement
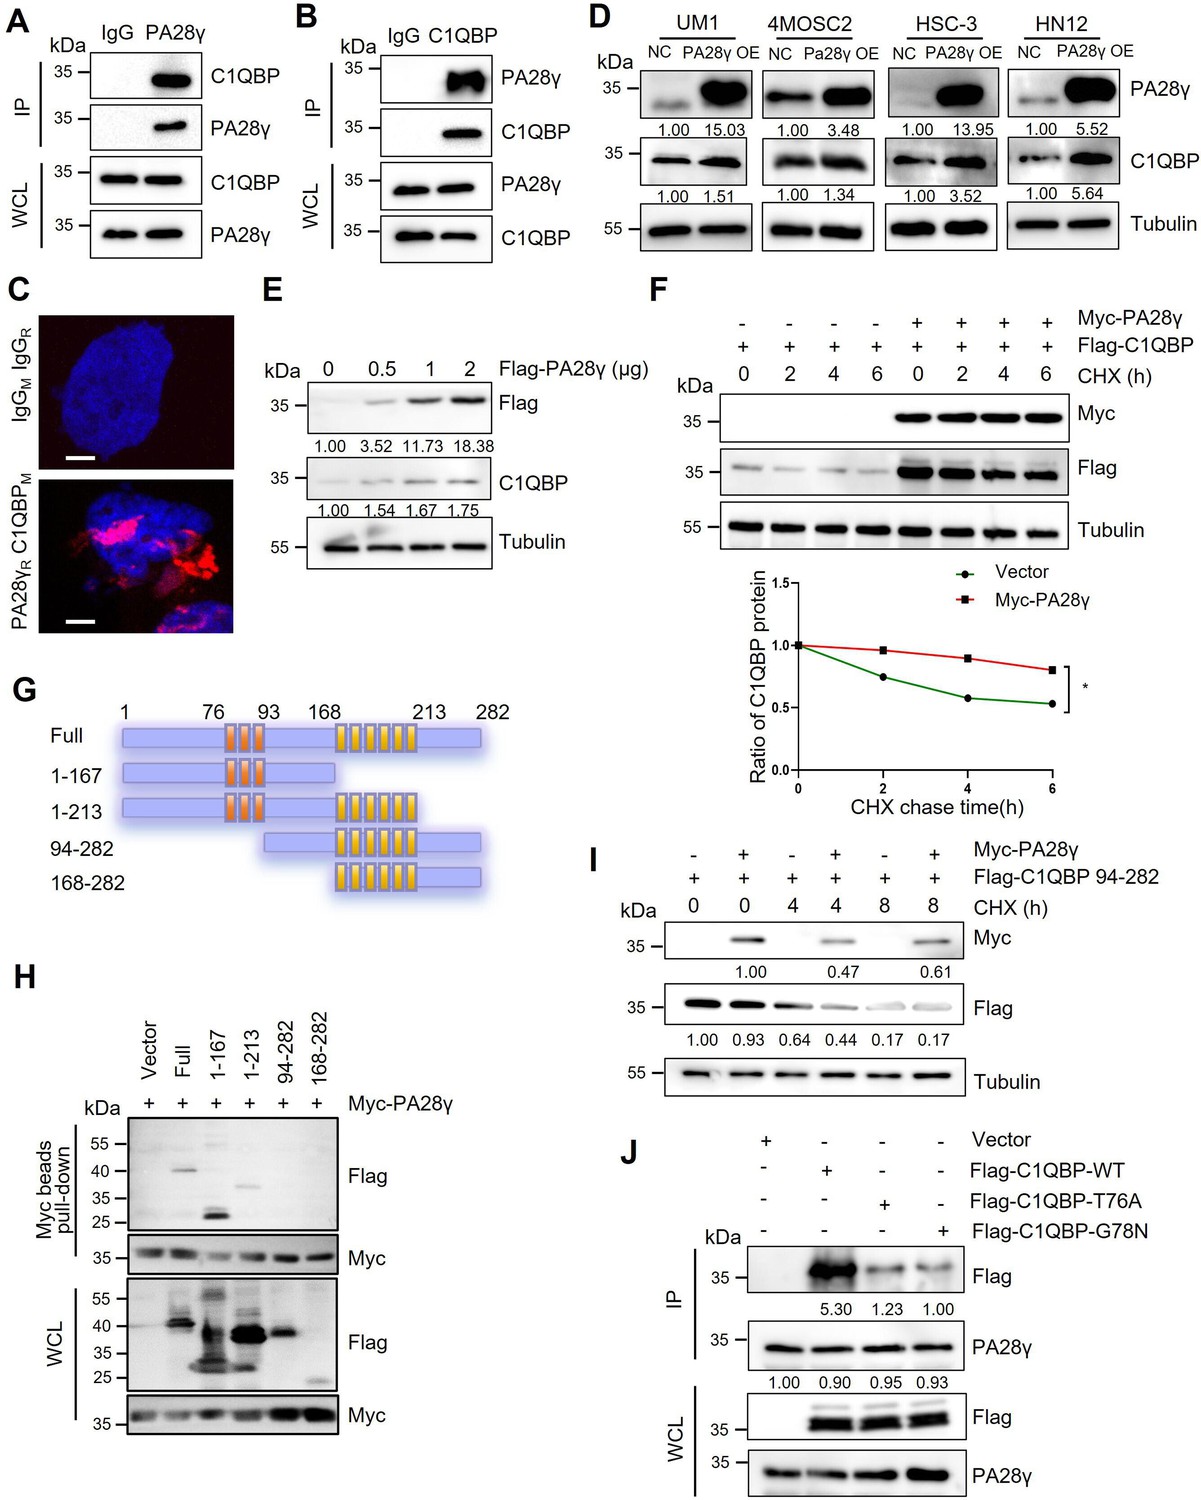
The interaction between proteasome activator 28γ (PA28γ) and C1QBP.
(A, B) The interaction between endogenous PA28γ and C1QBP in HSC-3 cells was verified via immunoprecipitation (IP). (C) Proximity ligation assay (PLA) image of UM1 cells shows the interaction between C1QBP and PA28γ in both cytoplasm and nucleus (red fluorescence, scale bar=5μm). (D) Western blot analysis of C1QBP in four oral squamous cell carcinoma (OSCC) cell lines with PA28γ overexpression. (E) Western blot analysis of C1QBP in 293T cells transfected with increasing doses of Flag-PA28γ. (F) 293T cells transfected with Flag-C1QBP with or without Myc-PA28γ were treated with cycloheximide (CHX) (100 μg/ml) for the indicated periods of time. Quantification of Flag-C1QBP levels relative to tubulin levels is shown (the data are representative of one experiment with three independent biological replicates, *p<0.05). (G) Full-length C1QBP and truncation with deletion of functional domains. (H) Pull-down of 293T cells transfected with Myc-PA28γ and full-length Flag-C1QBP or truncation mutants of functional domains for 36 hr. (I) 293T cells transfected with Flag-C1QBP 94-282 with or without Myc-PA28γ were treated with CHX (100 μg/ml) for the indicated periods of time. (J) IP of 293T cells transfected with Flag-C1QBP wild-type or mutations (T76A and G78N) for 48 hr.
Figure 1—figure supplement 1
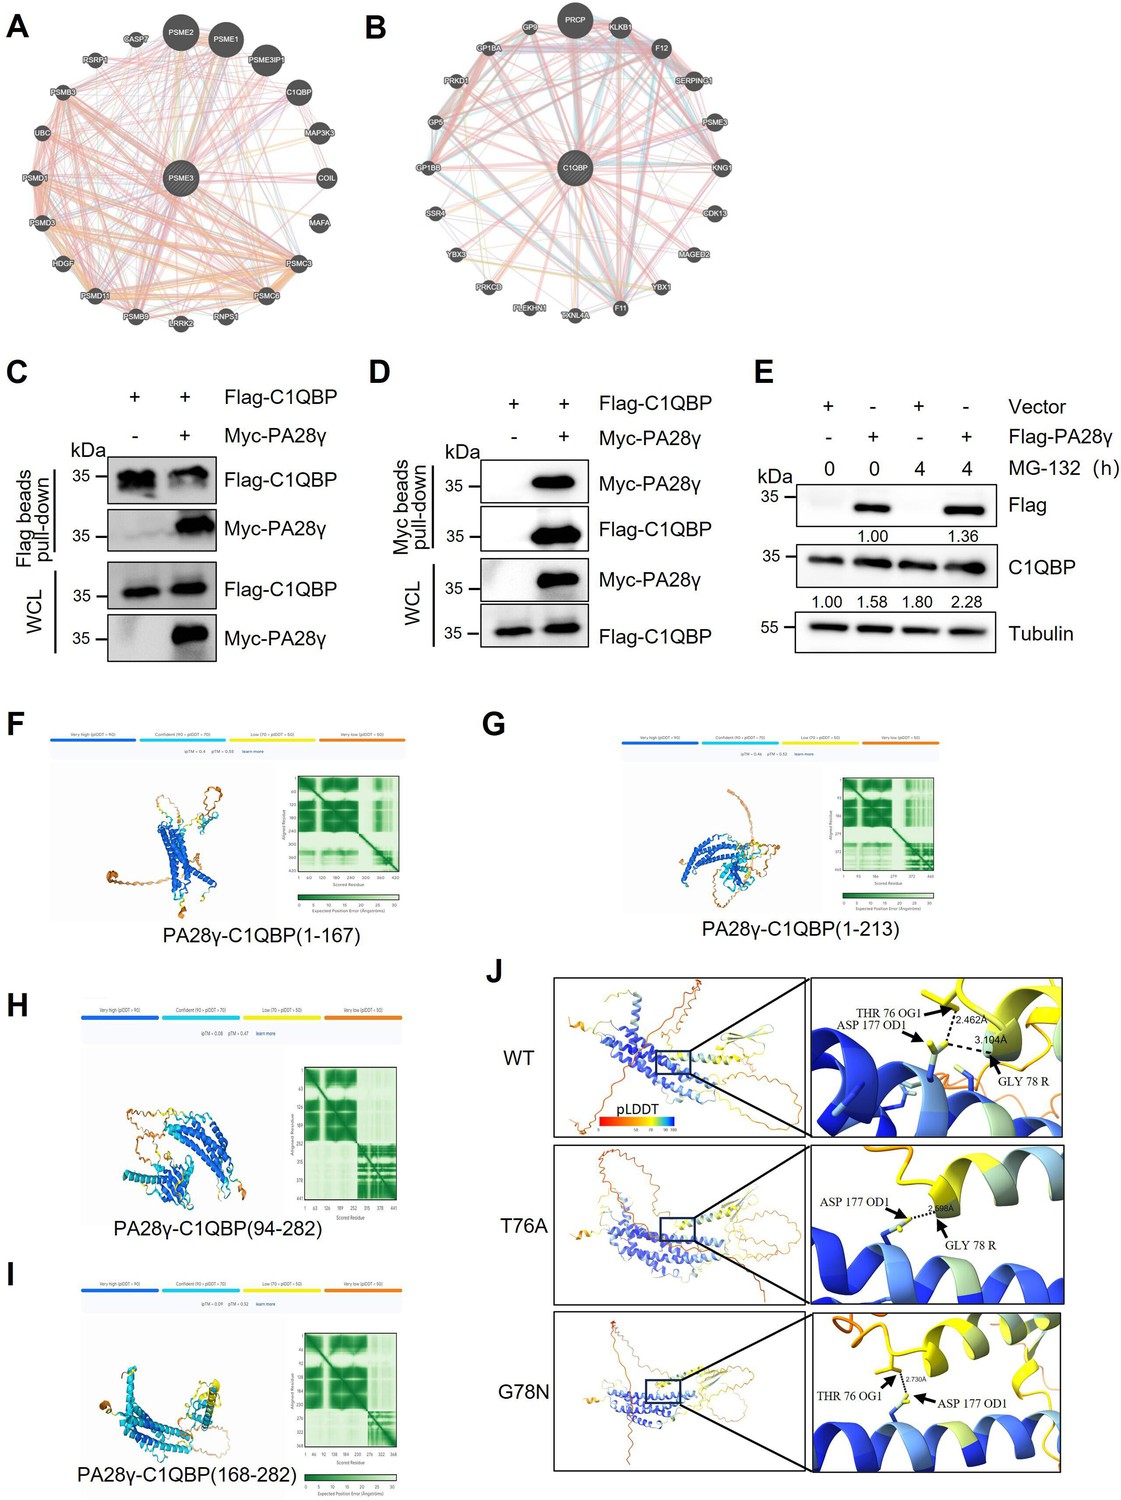
The interaction between proteasome activator 28γ (PA28γ) and C1QBP.
(A, B) The gene network of PSME3 and C1QBP in the GeneMANIA database. (C, D) The interaction between exogenous PA28γ and C1QBP in 293T cells was verified via pull-down. (E) 293T cells transfected with Vector or Flag-PA28γ were treated with MG-132 (10μM) for the indicated periods of time. (F-I) The prediction of interactions between PA28γ and truncated C1QBP with AlphaFold 3. (J) The prediction of interactions between PA28γ and C1QBP wild-type or mutations with AlphaFold 3.
Figure 2 with 1 supplement
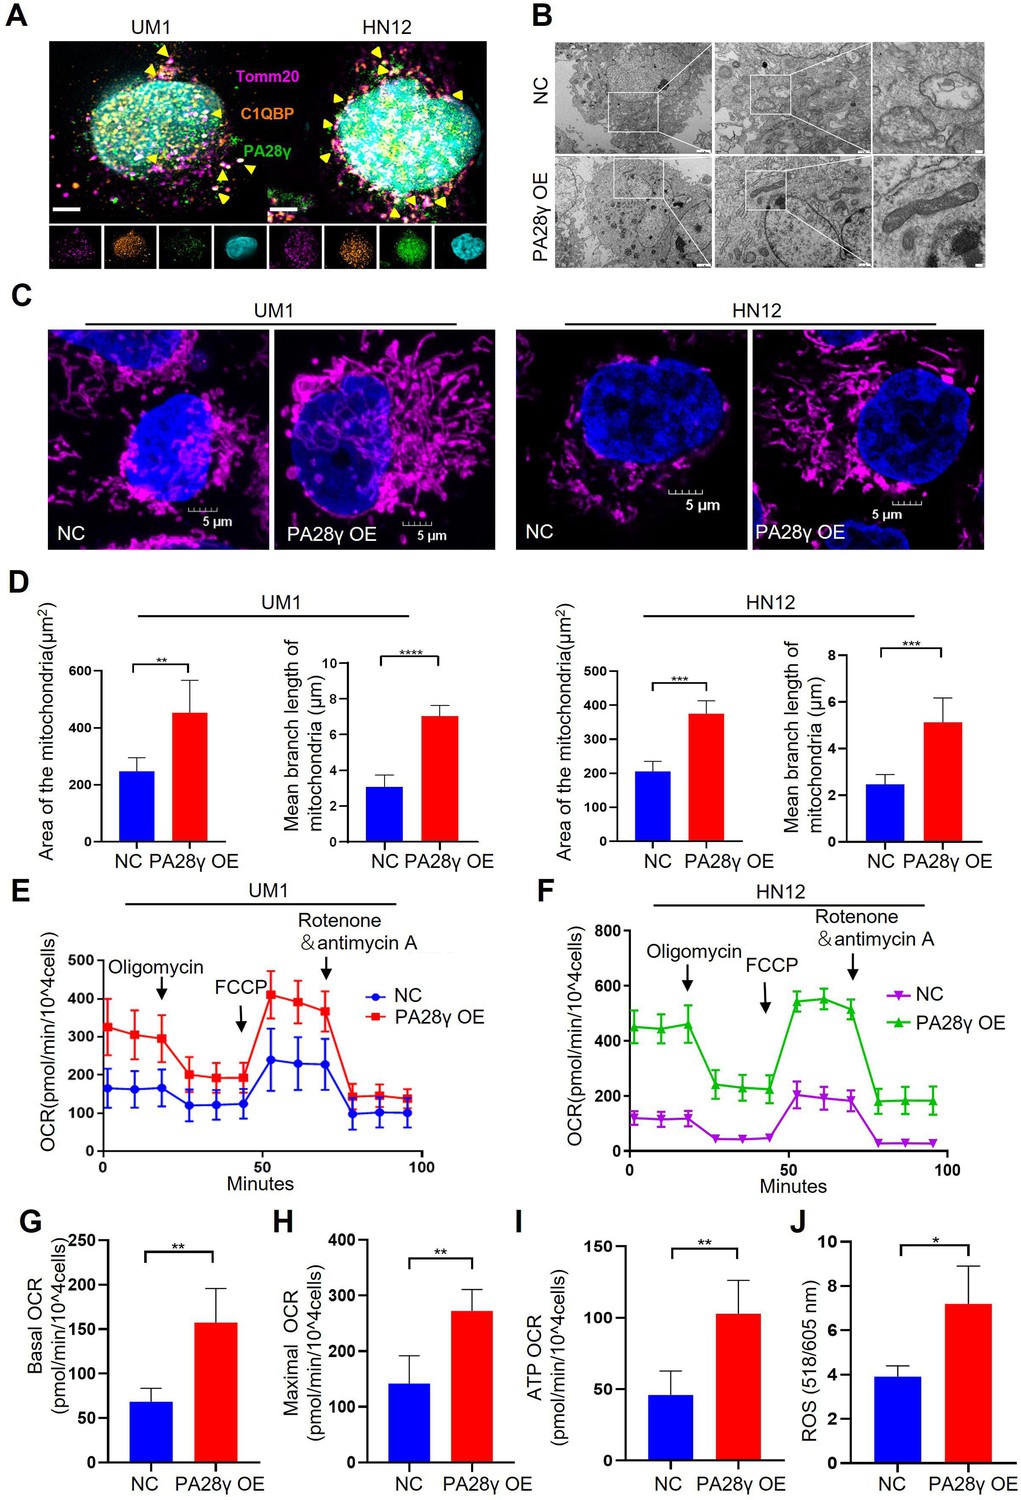
Proteasome activator 28γ (PA28γ) and C1QBP colocalize in mitochondria and influence mitochondrial functions in vitro.
(A) Confocal image of immunofluorescence (IF) in two oral squamous cell carcinoma (OSCC) cell lines (scale bar=5μm). (B) Transmission electron microscopy (TEM) images of PA28γ-overexpressing and control UM1 cells (scale bar=2μm). (C) Representative confocal images of mitochondria in two OSCC cell lines (scale bar=5μm). (D) The area and mean branch length of mitochondria in two OSCC cell lines were measured by ImageJ (the data are presented as the mean ± SD of three independent experiments; **p<0.01, ***p<0.001, and ****p<0.0001). (E, F) Oxygen consumption rates (OCRs) of PA28γ-overexpressing and control UM1 and HN12 cells were plotted using a Cell Mito Stress Test Kit (the data are presented as the means ± SDs of three independent experiments). (G-I) Basal OCRs, maximal OCRs, and ATP production of PA28γ-overexpressing and control UM1 cells measured by the Cell Mito Stress Test (the data are presented as the means ± SDs of three independent experiments, **p<0.01). (J) ROS generation in PA28γ-overexpressing and control UM1 cells (the data are presented as the means ± SDs of three independent experiments; *p<0.05).
Figure 2—figure supplement 1
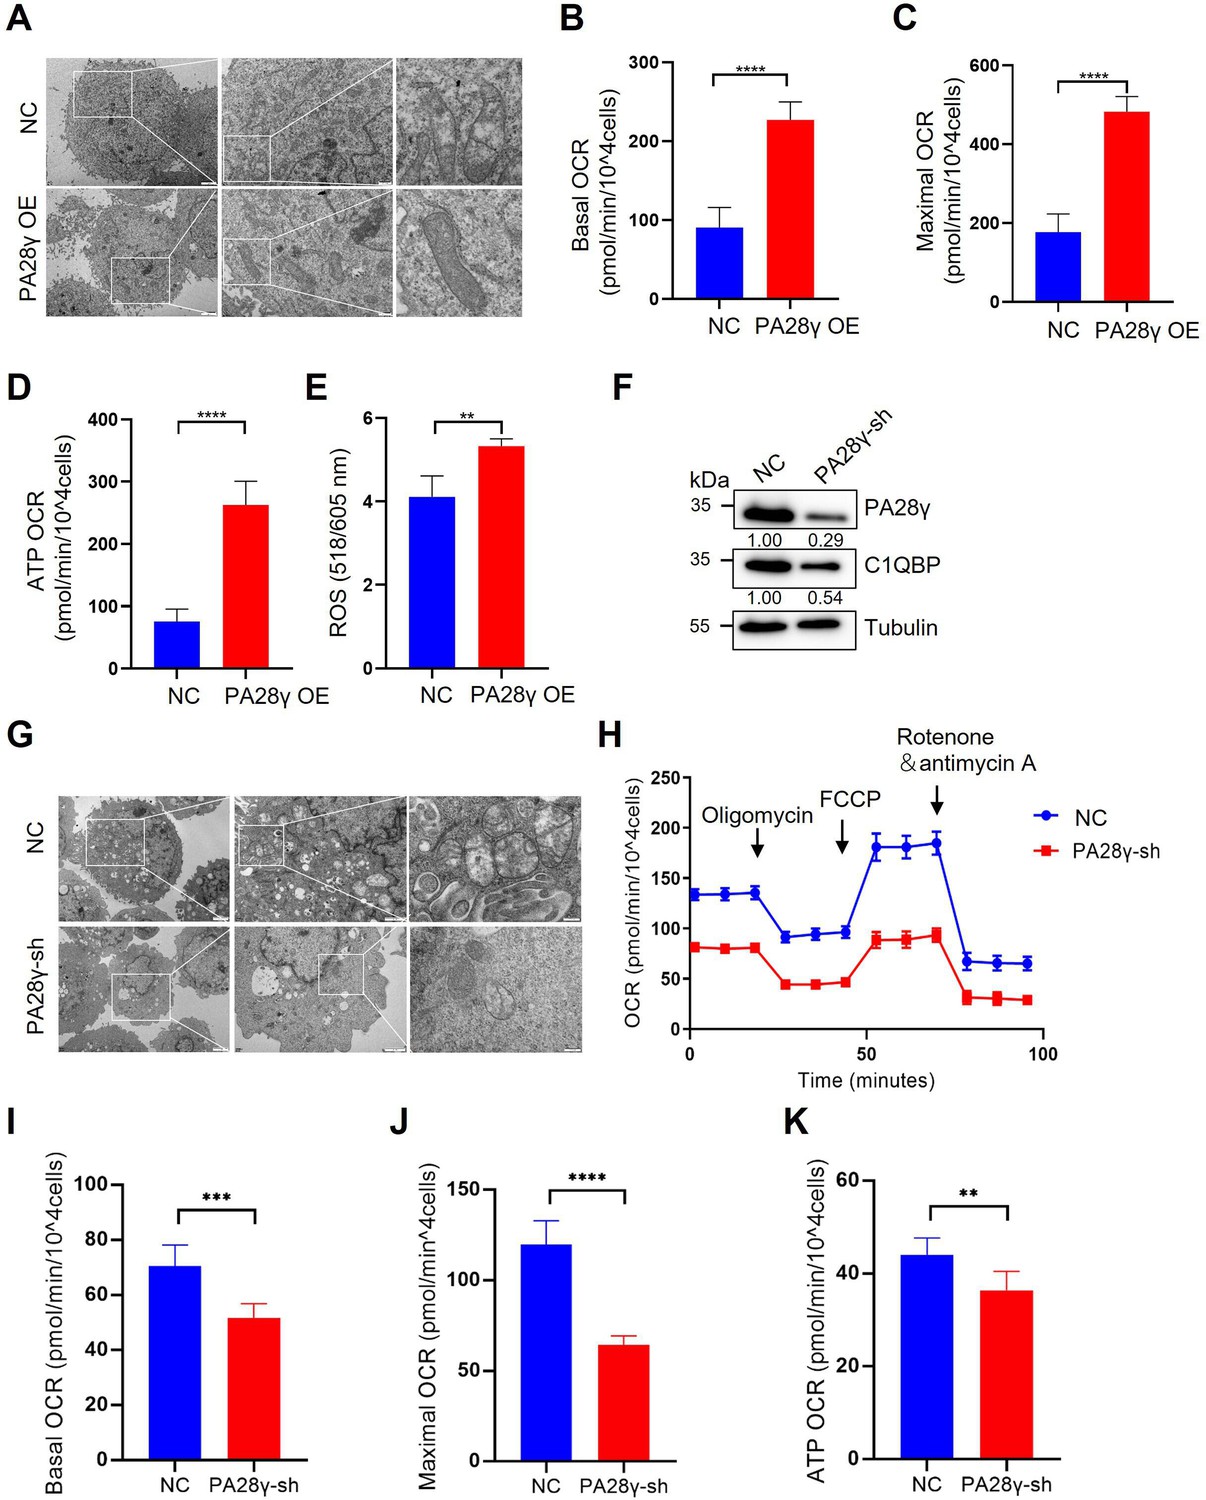
Proteasome activator 28γ (PA28γ) and C1QBP colocalize in mitochondria and regulate OXPHOS in oral squamous cell carcinoma (OSCC) cells.
(A) Transmission electron microscopy (TEM) images of PA28γ-overexpressing and control HN12 cells (scale bar=2μm). (B-D) Basal oxygen consumption rate (OCRs), maximal OCRs, and ATP production of PA28γ-overexpressing and control HN12 cells measured by the cell Mito Stress Test (the data are presented as the means ± SDs of 3 independent experiments; ****p<0.0001). (E) ROS generation in PA28γ-overexpressing and control HN12 cells (the data are presented as the means ± SDs of three independent experiments; **p<0.01). (F) Western blot analysis of PA28γ-sh and control UM1 cells. (G) TEM images of PA28γ-sh and control UM1 cells (scale bar=2μm). (H) OCRs of PA28γ-sh and control UM1 cells were plotted using a Cell Mito Stress Test Kit (the data are presented as the means ± SDs of three independent experiments). (I-K) Basal OCRs, maximal OCRs, and ATP production of PA28γ-sh and control UM1 cells measured by the Cell Mito Stress Test (the data are presented as the means ± SDs of three independent experiments; **p<0.01, ***p<0.001, and ****p<0.0001).
Figure 3 with 1 supplement
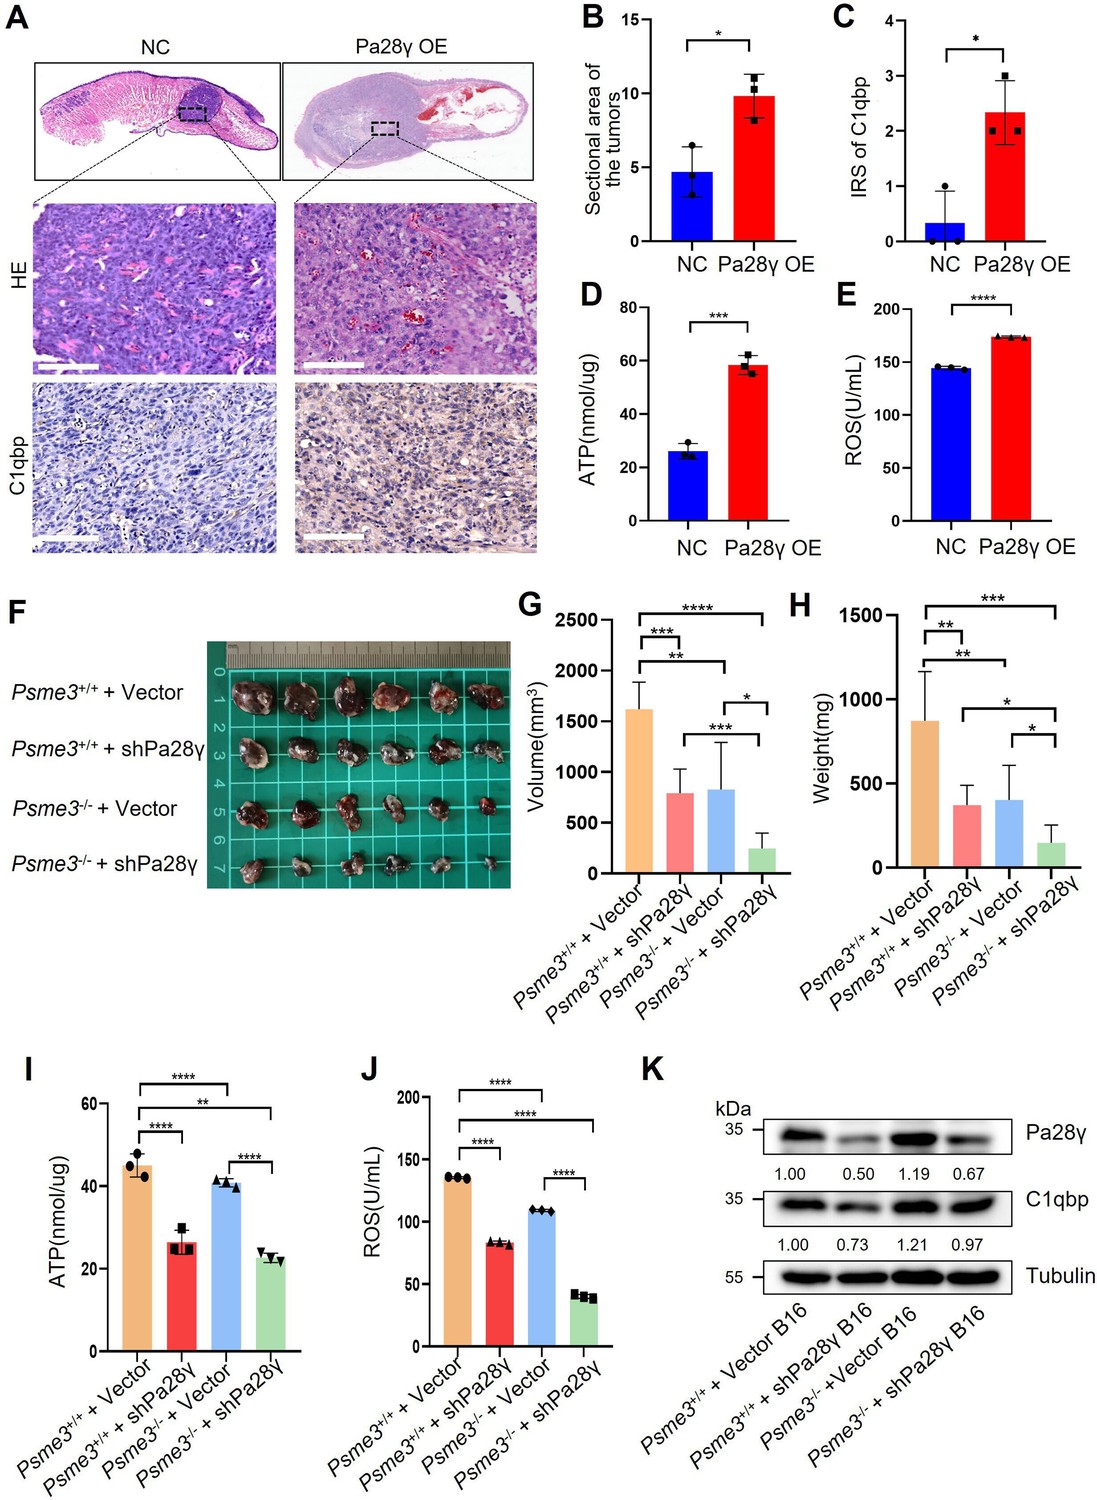
Proteasome activator 28γ (PA28γ) affect mitochondrial functions in vivo.
(A) Representative images of H&E staining and immunohistochemical (IHC) staining of C1qbp of tongue sections from mice (n=3, scale bar=100μm). (B) Quantification of the sectional area in tumors from the Pa28γ-overexpressing and control groups (n=3; the data are presented as the means ± SDs of three samples; *p<0.05). (C) Comparison of the immunoreactive scores (IRSs) of C1qbp antibody staining in the Pa28γ-overexpressing and control groups (n=3, the data are presented as the means ± SDs; *p<0.05). (D, E) Quantification of ATP production and ROS levels in tumors from the Pa28γ-overexpressing and control groups (n=3; the data are presented as the means ± SDs of three samples; *p<0.05, ***p<0.001, ****p<0.0001). (F) Images of the tumors in different groups at the endpoint (n=6, scale bar=1cm). (G-J) The volume, weight, ATP, and ROS of tumors in different groups at the endpoint (n=6; the data are presented as the means ± SDs of three independent experiments; *p<0.05, **p<0.01, ***p<0.001, ****p<0.0001). (K) Western blot analysis of tumors in different groups.
Figure 3—figure supplement 1
Proteasome activator 28γ (PA28γ) overexpression can upregulate C1QBP in vivo.
(A) Diagram of an allogeneic orthotopic transplantation tumor mouse model. (B) Representative immunohistochemical (IHC) images of C1QBP antibody staining in Pa28γ-overexpressing and control nude mice (n=6, scale bar=200μm). (C) immunoreactive scores (IRSs) of C1QBP antibody staining in the Pa28γ-overexpressing and control nude mice (n=6, the data are presented as the means ± SDs; *p<0.05). (D) Western blot analysis of PA28γ-silenced and control B16 cells. (E) Diagram of subcutaneous transplantation tumor mouse model.
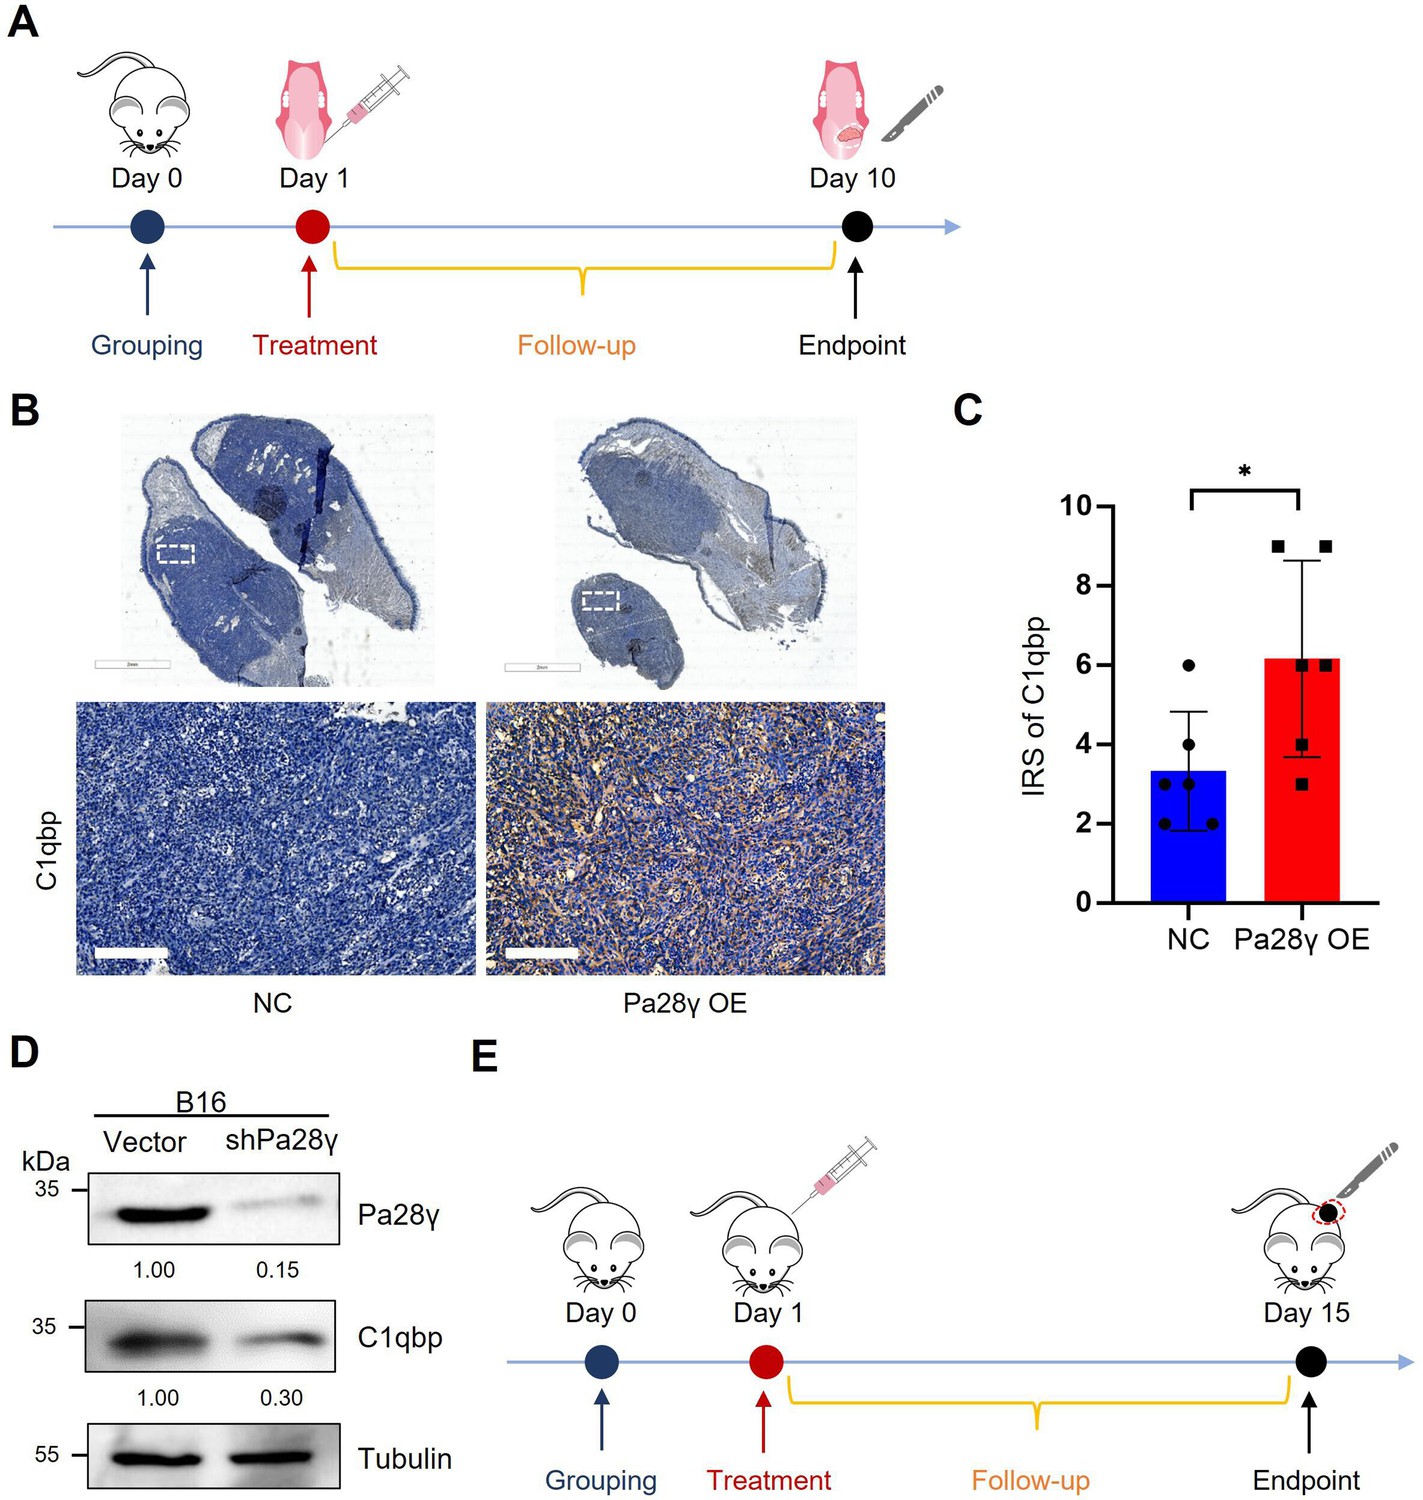
Figure 4 with 1 supplement
Proteasome activator 28γ (PA28γ) regulates mitochondrial oxidative phosphorylation (OXPHOS) and cellular biological behavior via C1QBP.
(A, B) Western blot analysis of PA28γ-overexpressing and control UM1 and 4MOSC2 cells. (C) Western blot analysis of PA28γ-overexpressing oral squamous cell carcinoma (OSCC) cells transfected with siNC or siC1QBP. (D) OCRs of C1QBP-silenced and control PA28γ-overexpressing UM1 and 4MOSC2 cells (the data are presented as the means ± SDs of three independent experiments). (E-H) Cell migration, invasion and proliferation in control, C1QBP-silenced, PA28γ-overexpressing and PA28γ-overexpressing + C1QBP-silenced UM1 cells (scale bar=100μm, the data are presented as the means ± SDs of three independent experiments; *p<0.05, **p<0.01, ***p<0.001, ****p<0.0001).
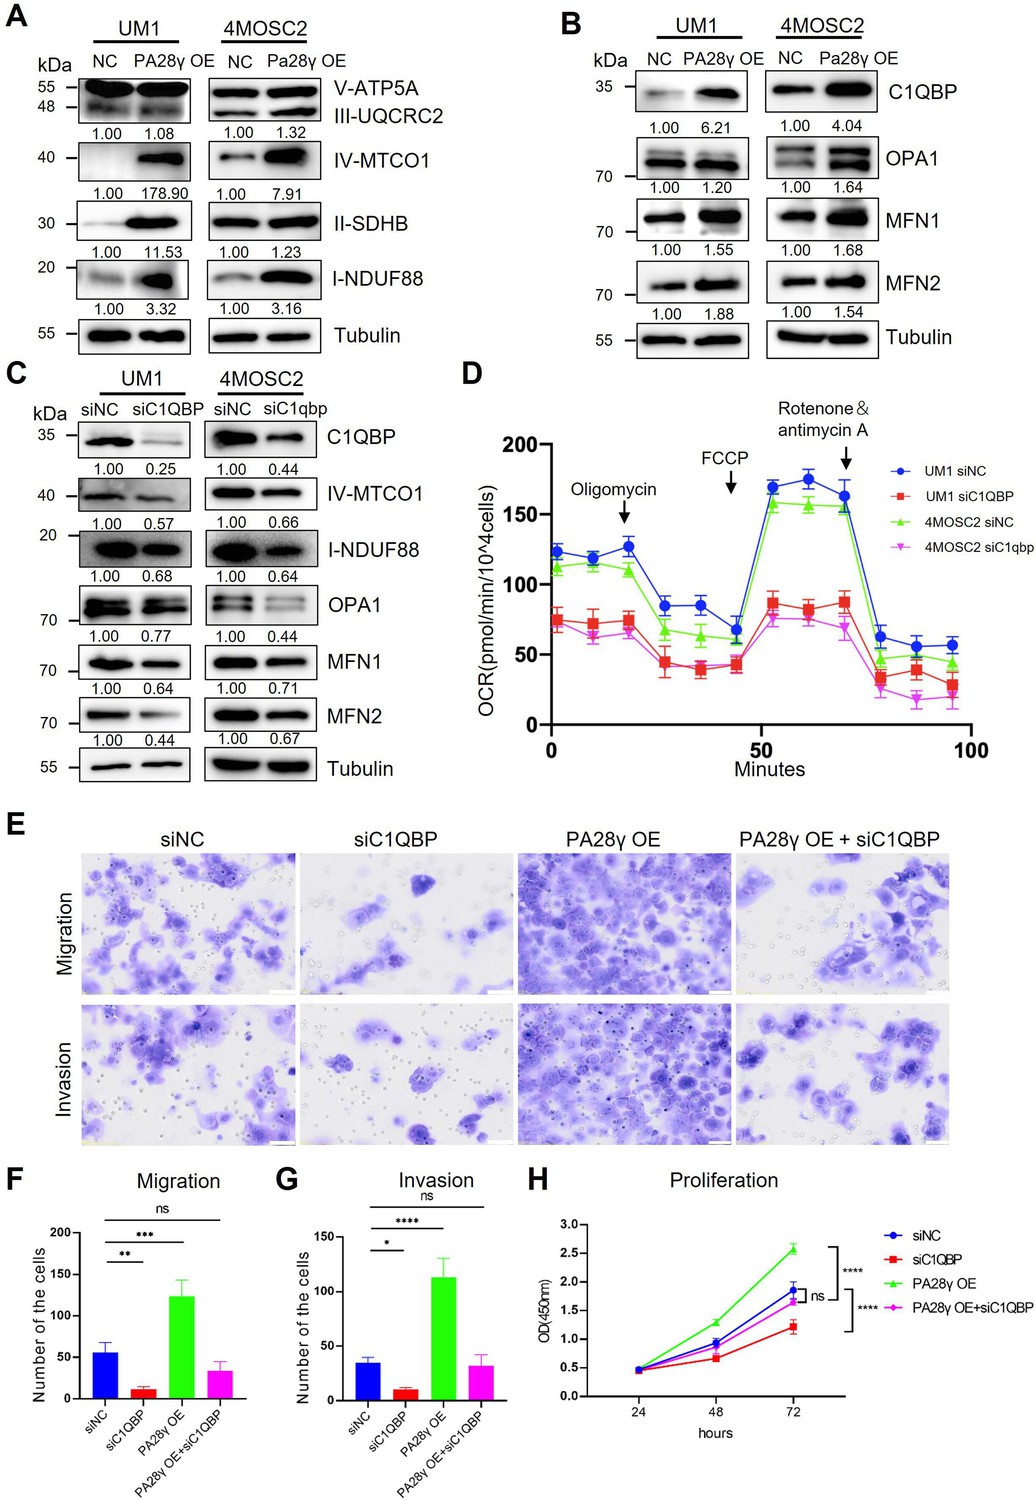
Figure 4—figure supplement 1
Proteasome activator 28γ (PA28γ) and C1QBP are involved in oxidative phosphorylation (OXPHOS) and cellular biological behavior.
(A, B) Heatmap differential metabolites and KEGG enrichment analysis in the PA28γ-overexpressing and control HN12 cells. (C, D) Western blot analysis of PA28γ-overexpressing and control HN12 cells. (E-G) Basal oxygen consumption rates (OCRs), maximal OCRs, and ATP production of C1QBP-silenced and control PA28γ-overexpressing UM1 and 4MOSC2 cells measured by the Cell Mito Stress Test (data are presented as the mean ± SD of three independent experiments, ****p<0.0001).
Figure 5 with 1 supplement
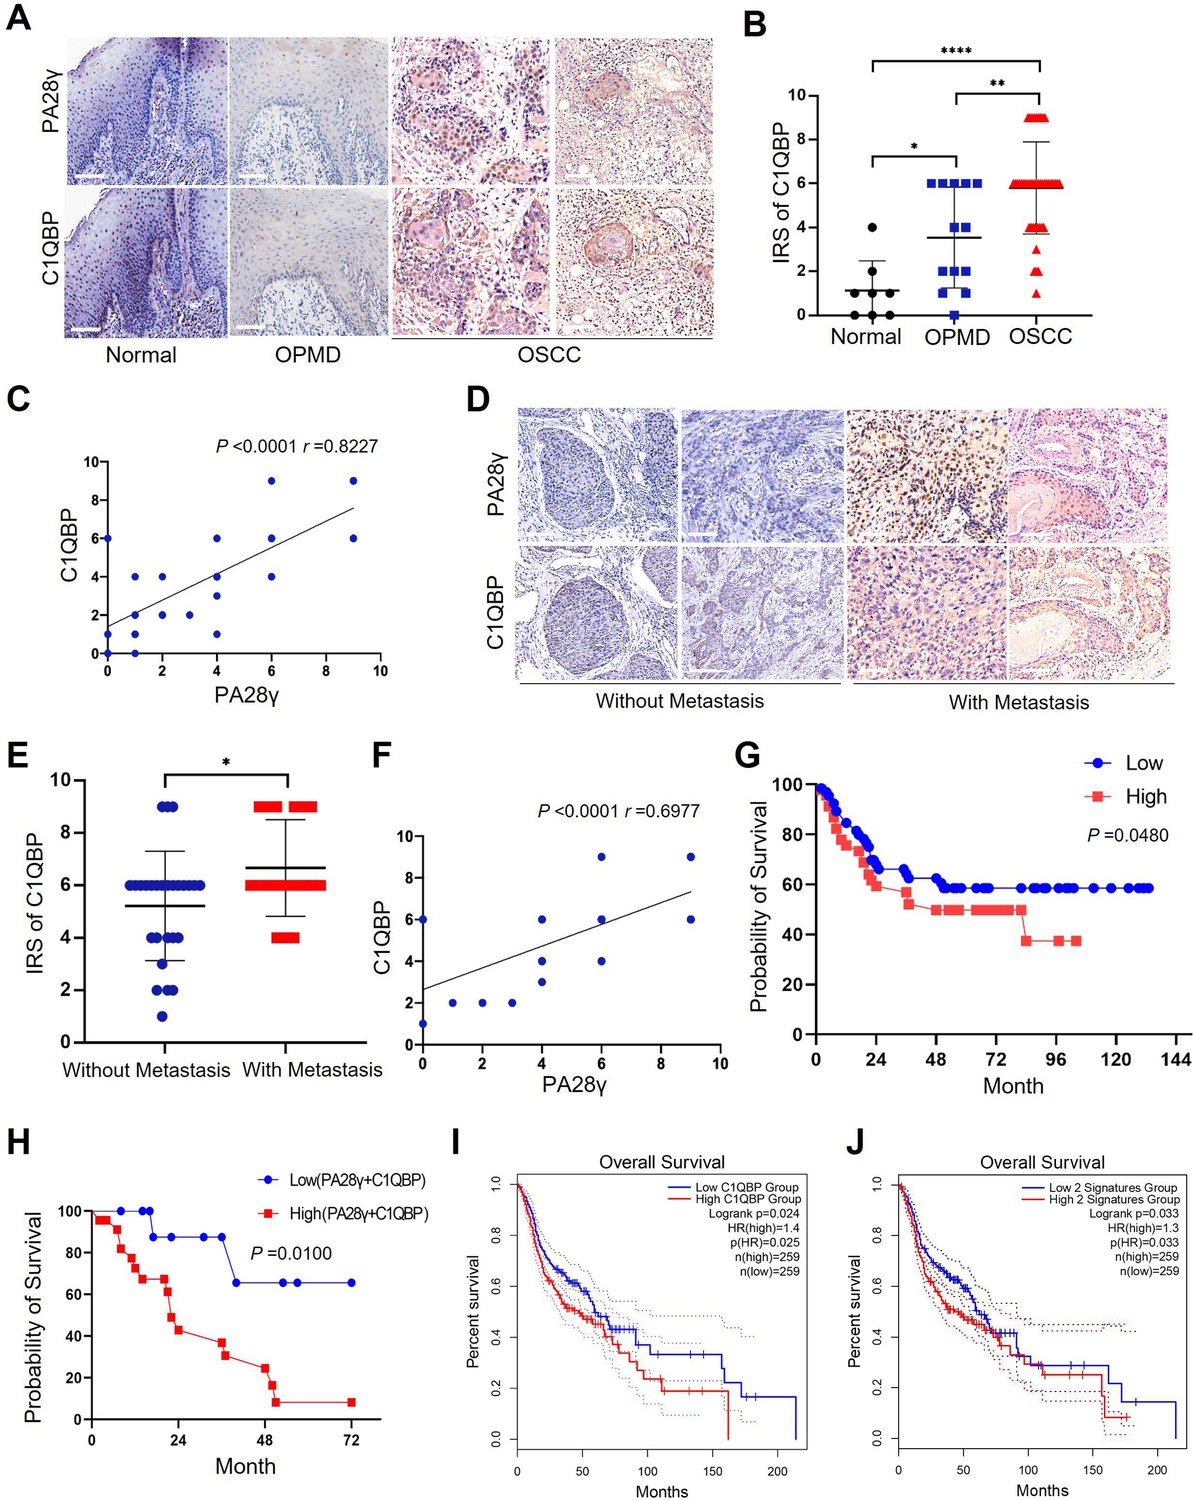
The correlation between proteasome activator 28γ (PA28γ) and C1QBP in the carcinogenesis and development of oral squamous cell carcinoma (OSCC).
(A) Representative immunohistochemical (IHC) staining of PA28γ and C1QBP in normal (n=8), OPMD (n=13) and OSCC (n=45) samples (scale bar=200μm). (B) Comparison of the immunoreactive scores (IRSs) of C1QBP between the normal, OPMD, and OSCC groups (the data are presented as the means ± SDs; *p<0.05, **p<0.01, ****p<0.0001). (C) Spearman correlation analysis was used to test the correlation between PA28γ and C1QBP in normal, OPMD, and OSCC tissues (p<0.0001, r=0.8227). (D) Representative IHC staining of PA28γ and C1QBP in non-metastatic (n=27) and metastatic (n=18) OSCC patients (scale bar=200μm). (E) Comparison of the immunoreactive scores (IRSs) of C1QBP in the non-metastatic and metastatic OSCC groups (the data are presented as the means ± SDs; *p<0.05). (F) Spearman correlation analysis was used to test the correlation between PA28γ and C1QBP in OSCC tissues (p<0.0001, r=0.6977). (G) Kaplan–Meier analysis of the protein expression of C1QBP in our multicenter OSCC clinical cohort (n=295, P=0.0480). (H) Kaplan–Meier analysis of both low or high protein expression of C1QBP and PA28γ in our multicenter OSCC clinical cohort (n=295, p=0.0100). (I) Kaplan–Meier analysis of the protein expression of C1QBP in The Cancer Genome Atlas (TCGA) (HNSC) database (n=259, p=0.025). (J) Kaplan–Meier analysis of both low or high protein expression of C1QBP and PA28γ in TCGA HNSC database (n=259, p=0.033).
Figure 5—figure supplement 1
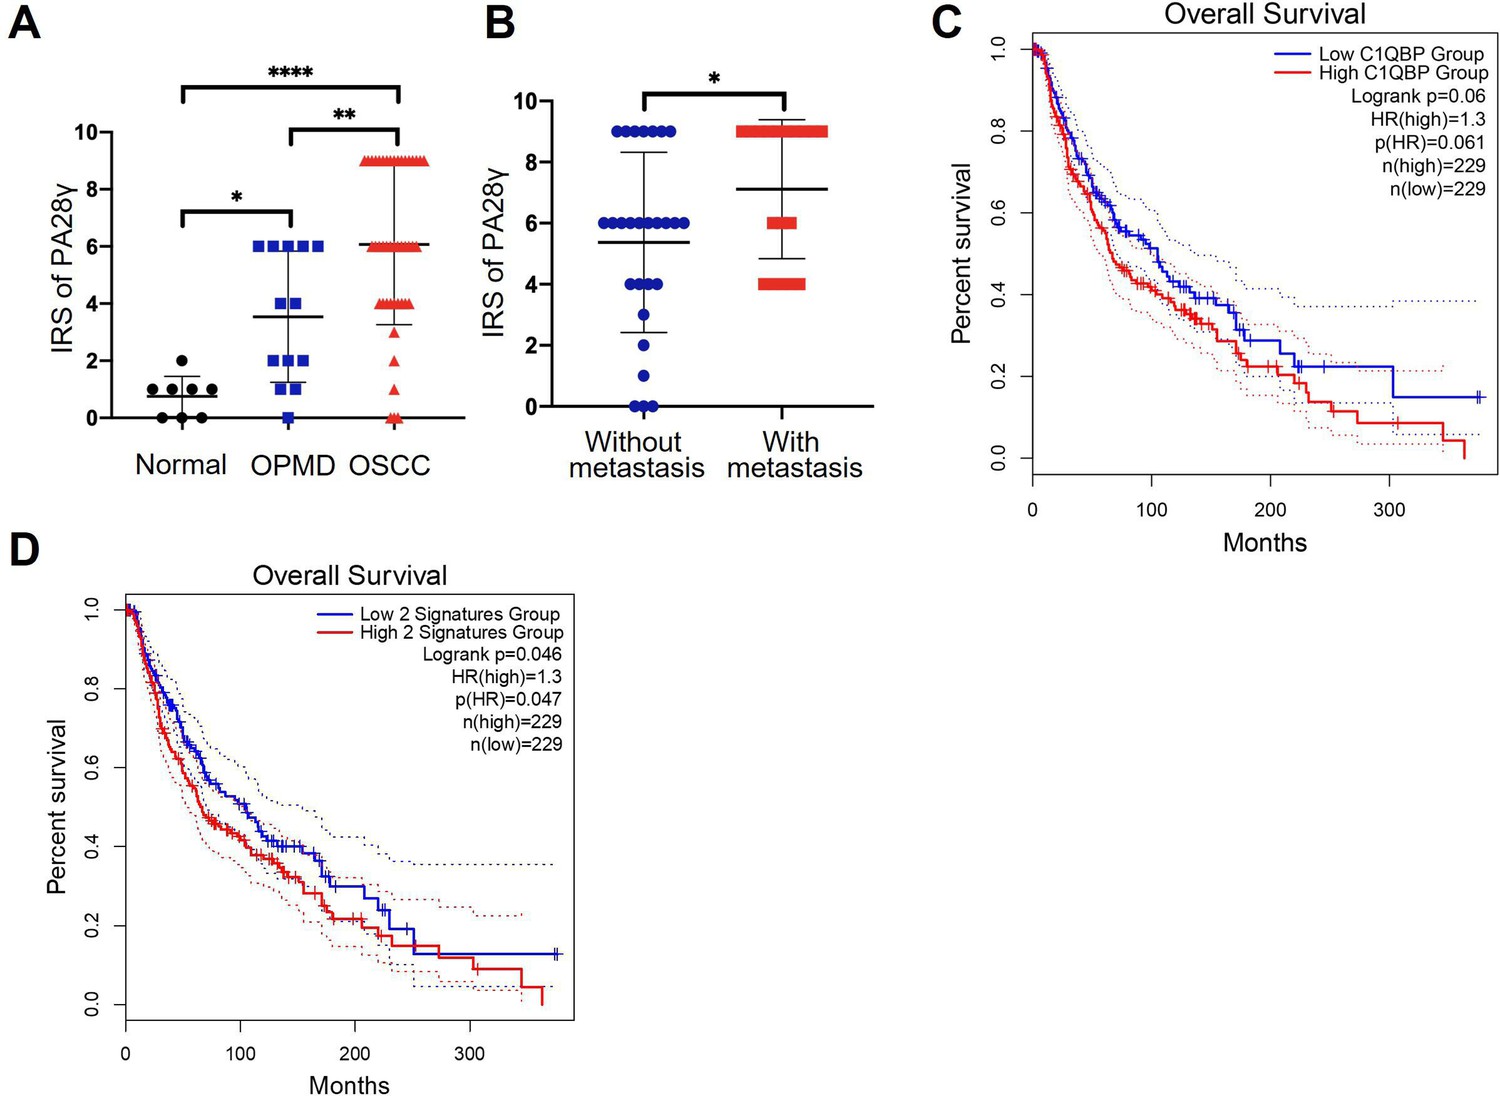
Proteasome activator 28γ (PA28γ) and C1QBP are involved in the development of tumor.
(A) Comparison of the immunoreactive scores (IRSs) of PA28γ between the normal (n=8), OPMD (n=13), and OSCC (n=45) groups (the data are presented as the means ± SDs; *p<0.05, **p<0.01, ****p<0.0001). (B) Comparison of the IRSs of PA28γ in the nonmetastatic (n=27) and metastatic (n=18) oral squamous cell carcinoma (OSCC) groups (the data are presented as the means ± SDs; *p<0.05). (C) Kaplan–Meier analysis of the protein expression of C1QBP in The Cancer Genome Atlas (TCGA) skin cutaneous melanoma (SKCM) database (n=229, p=0.061). (D) Kaplan–Meier analysis of both low or high protein expression of C1QBP and PA28γ in TCGA SKCM database (n=229, p=0.047).
Figure 6
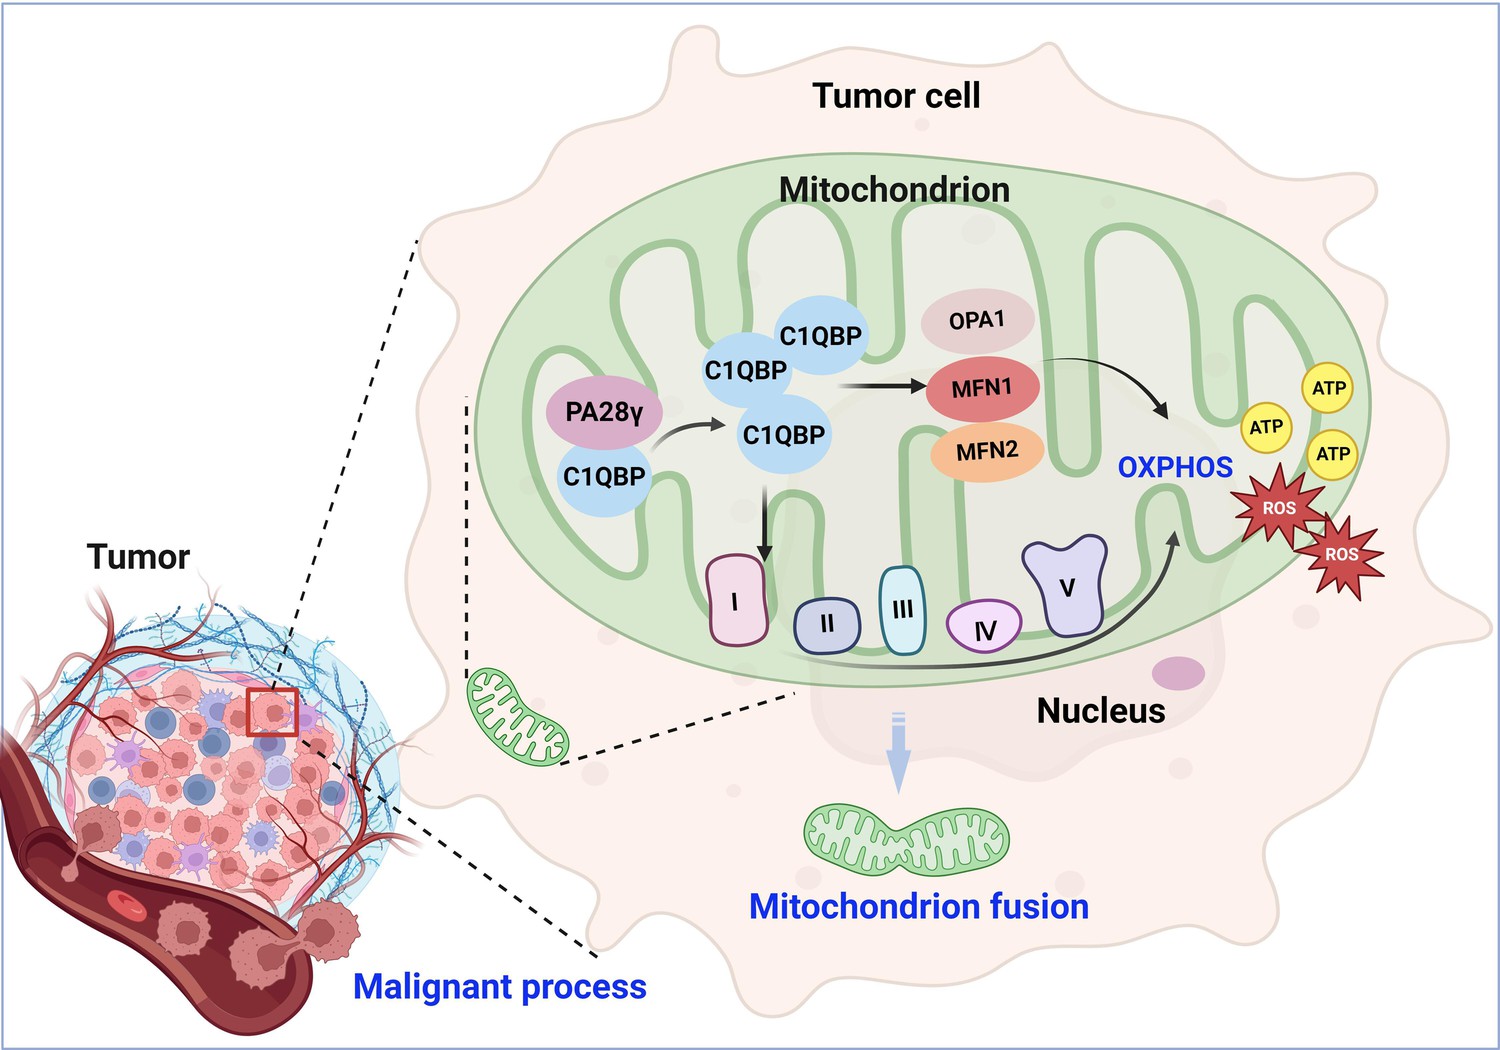
Molecular mechanism through which proteasome activator 28γ (PA28γ) interacts with C1QBP in the malignant progression of tumor.
PA28γ can interact with and stabilize C1QBP, which can activate the expression and function of OPA1, MNF1, MFN2, and mitochondrial respiratory chain complex proteins, resulting in enhanced mitochondrial oxidative phosphorylation (OXPHOS), mitochondrial fusion, and malignant tumor progression.
Tables
Appendix 1—table 1
Baseline Characteristics of the Patients with Oral Squamous Cell Carcinoma in Cohort I.
| characteristic | N=45 Number (%) | P value |
|---|---|---|
| Gender | ||
| Male | 26(57.8) | 0.7553 |
| Female | 19(42.2) | |
| Age(year) | ||
| ﹤60 | 11(24.4) | 0.3428 |
| ≥60 | 34(75.6) | |
| Tumor stage | ||
| T1-2 | 30(66.7) | 0.0030 |
| T3-4 | 15(33.3) | |
| Node stage | 0.0217 | |
| N0 | 27(60.0) | |
| N1-3 | 18(40.0) | |
| Clinical stage | ||
| I-II | 23(51.1) | 0.0045 |
| III-IV | 22(48.9) | |
| Differentiation degree | 0.2651 | |
| Low/Moderate | 11(24.4) | |
| High | 34(75.6) | |
| Recurrence | ||
| Yes | 26(57.8) | 0.5900 |
| No | 19(42.2) | |
| C1QBP expression | ||
| Low | 13(28.9) | <0.05 |
| High | 32(71.1) |
Appendix 1—table 2
Baseline Characteristics of the Patients with Oral Squamous Cell Carcinoma in Cohort II.
| characteristic | N=295 Number (%) | P value |
|---|---|---|
| Gender | ||
| Male | 216(73.2) | 0.0798 |
| Female | 79(26.8) | |
| Age(year) | ||
| ﹤60 | 126(42.7) | 0.6825 |
| ≥60 | 169(57.3) | |
| Smoking | ||
| Yes | 145(49.2) | 0.9483 |
| No | 150(50.8) | |
| Tumor stage | ||
| T1-2 | 219(74.2) | 0.7181 |
| T3-4 | 76(25.8) | |
| Node stage | 0.5265 | |
| N0 | 194(65.8) | |
| N1-3 | 101(34.2) | |
| Clinical stage | ||
| I-II | 155(52.5) | 0.9280 |
| III-IV | 140(47.5) | |
| Recurrence | ||
| Yes | 149(50.5) | 0.1889 |
| No | 146(49.5) | |
| C1QBP expression | ||
| Low | 132(44.7) | <0.05 |
| High | 163(55.3) |
Appendix 1—table 3
Baseline characteristics of the patients with head and neck squamous cell carcinoma in The Cancer Genome Atlas (TCGA) cohort.
| Characteristic | C1QBP expression | P-value | |
|---|---|---|---|
| Low (N=259, Number %) | High (N=259, Number %) | ||
| Gender | |||
| Male | 190(73.3) | 193(74.5) | 0.8414 |
| Female | 69(26.7) | 66(25.5) | |
| Age(year) | |||
| ﹤60 | 133(51.4) | 100(38.6) | 0.0047 |
| ≥60 | 126(48.6) | 159(61.4) | |
| Tumor stage* | |||
| I-II | 57(22.0) | 40(15.4) | 0.0384 |
| III-IV | 161(62.2) | 186(71.8) | |
| Clinical stage* | |||
| I-II | 66(25.5) | 51(19.7) | 0.1702 |
| III-IV | 189(73.0) | 199(76.8) | |
| Histological grade* | |||
| G1-2 | 174(67.2) | 191(73.7) | 0.1876 |
| G3-4 | 72(27.8) | 60(23.2) | |
-
*
The information of some patients is missing.
Appendix 1—table 4
Baseline characteristics of the patients with skin cutaneous melanoma in The Cancer Genome Atlas (TCGA) cohort.
| Characteristic | C1QBP expression | P-value | |
|---|---|---|---|
| Low (N=229, Number %) | High (N=229, Number %) | ||
| Gender | |||
| Male | 143(62.4) | 145(63.3) | 0.9230 |
| Female | 86(37.6) | 84(36.7) | |
| Age(year) | |||
| ﹤60 | 107(46.7) | 102(44.5) | 0.7075 |
| ≥60 | 122(53.3) | 127(55.5) | |
| Tumor stage* | |||
| I-II | 77(33.6) | 71(31.0) | 0.6013 |
| III-IV | 117(51.1) | 122(53.3) | |
| Node stage* | |||
| 0 | 106(46.3) | 123(53.7) | 0.1599 |
| 1–3 | 94(41.0) | 81(35.4) | |
| Metastasis stage* | |||
| 0 | 205(89.5) | 204(89.1) | 0.9999 |
| 1 | 11(0.05) | 11(0.05) | |
| Clinical stage* | |||
| I-II | 102(44.5) | 118(51.5) | 0.1373 |
| III-IV | 103(45.0) | 87(38.0) | |
-
*
The information of some patients is missing.
Additional files
Download links
A two-part list of links to download the article, or parts of the article, in various formats.
Downloads (link to download the article as PDF)
Open citations (links to open the citations from this article in various online reference manager services)
Cite this article (links to download the citations from this article in formats compatible with various reference manager tools)
PA28γ promotes the malignant progression of tumor by elevating mitochondrial function via C1QBP
eLife 13:RP101244.
https://doi.org/10.7554/eLife.101244.5


